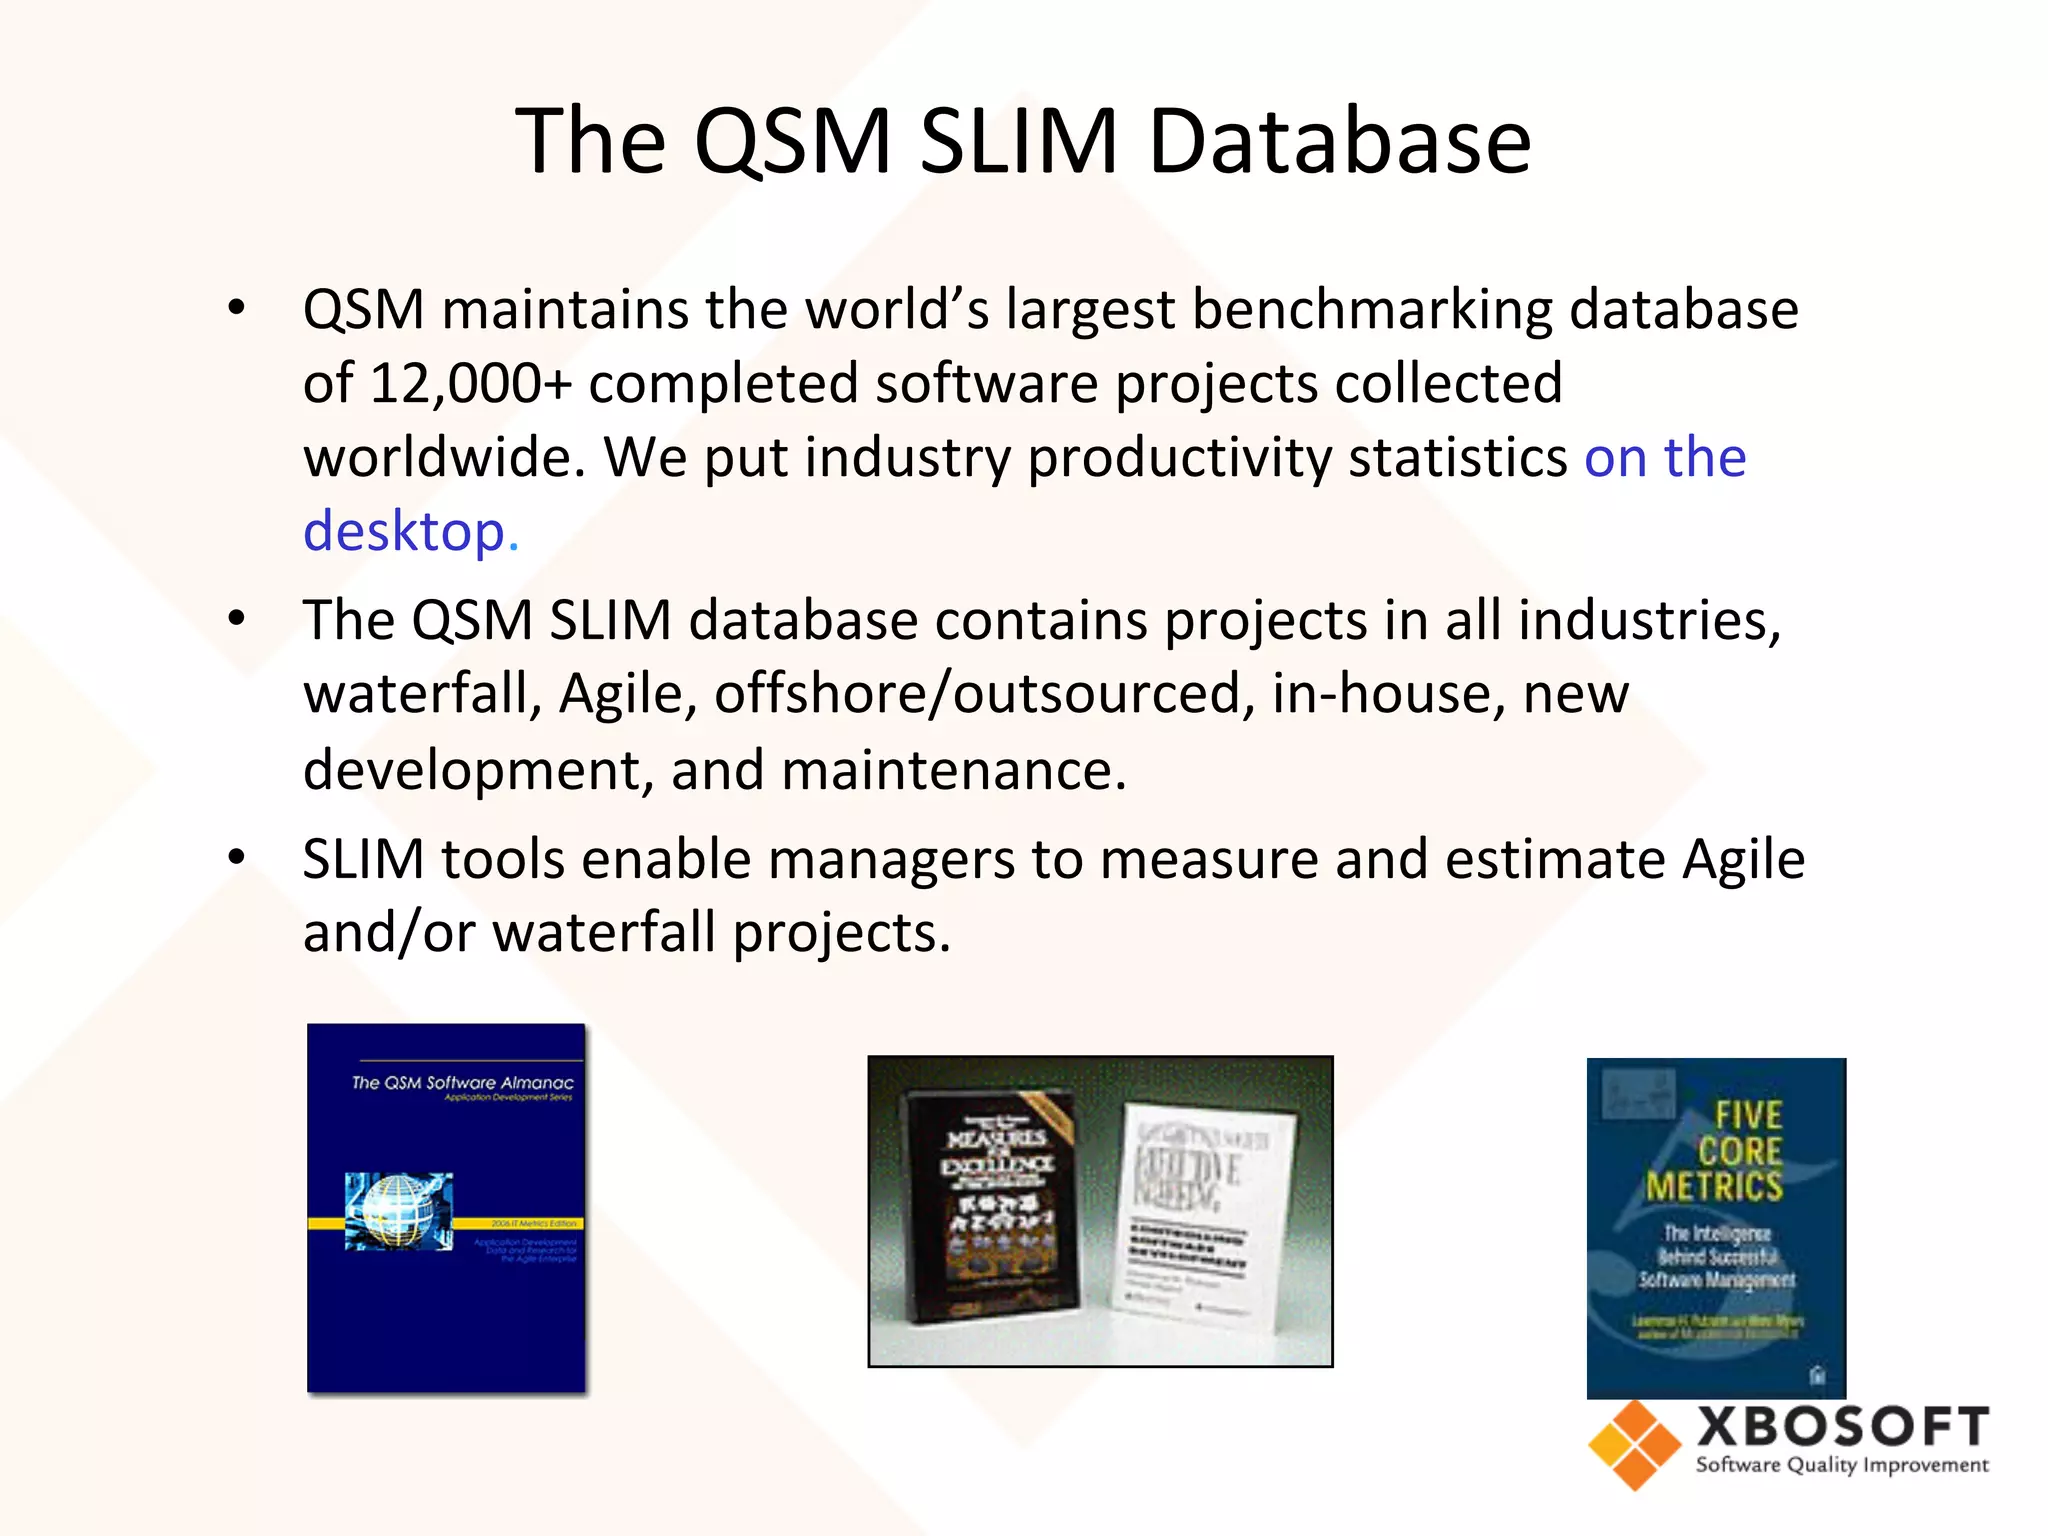
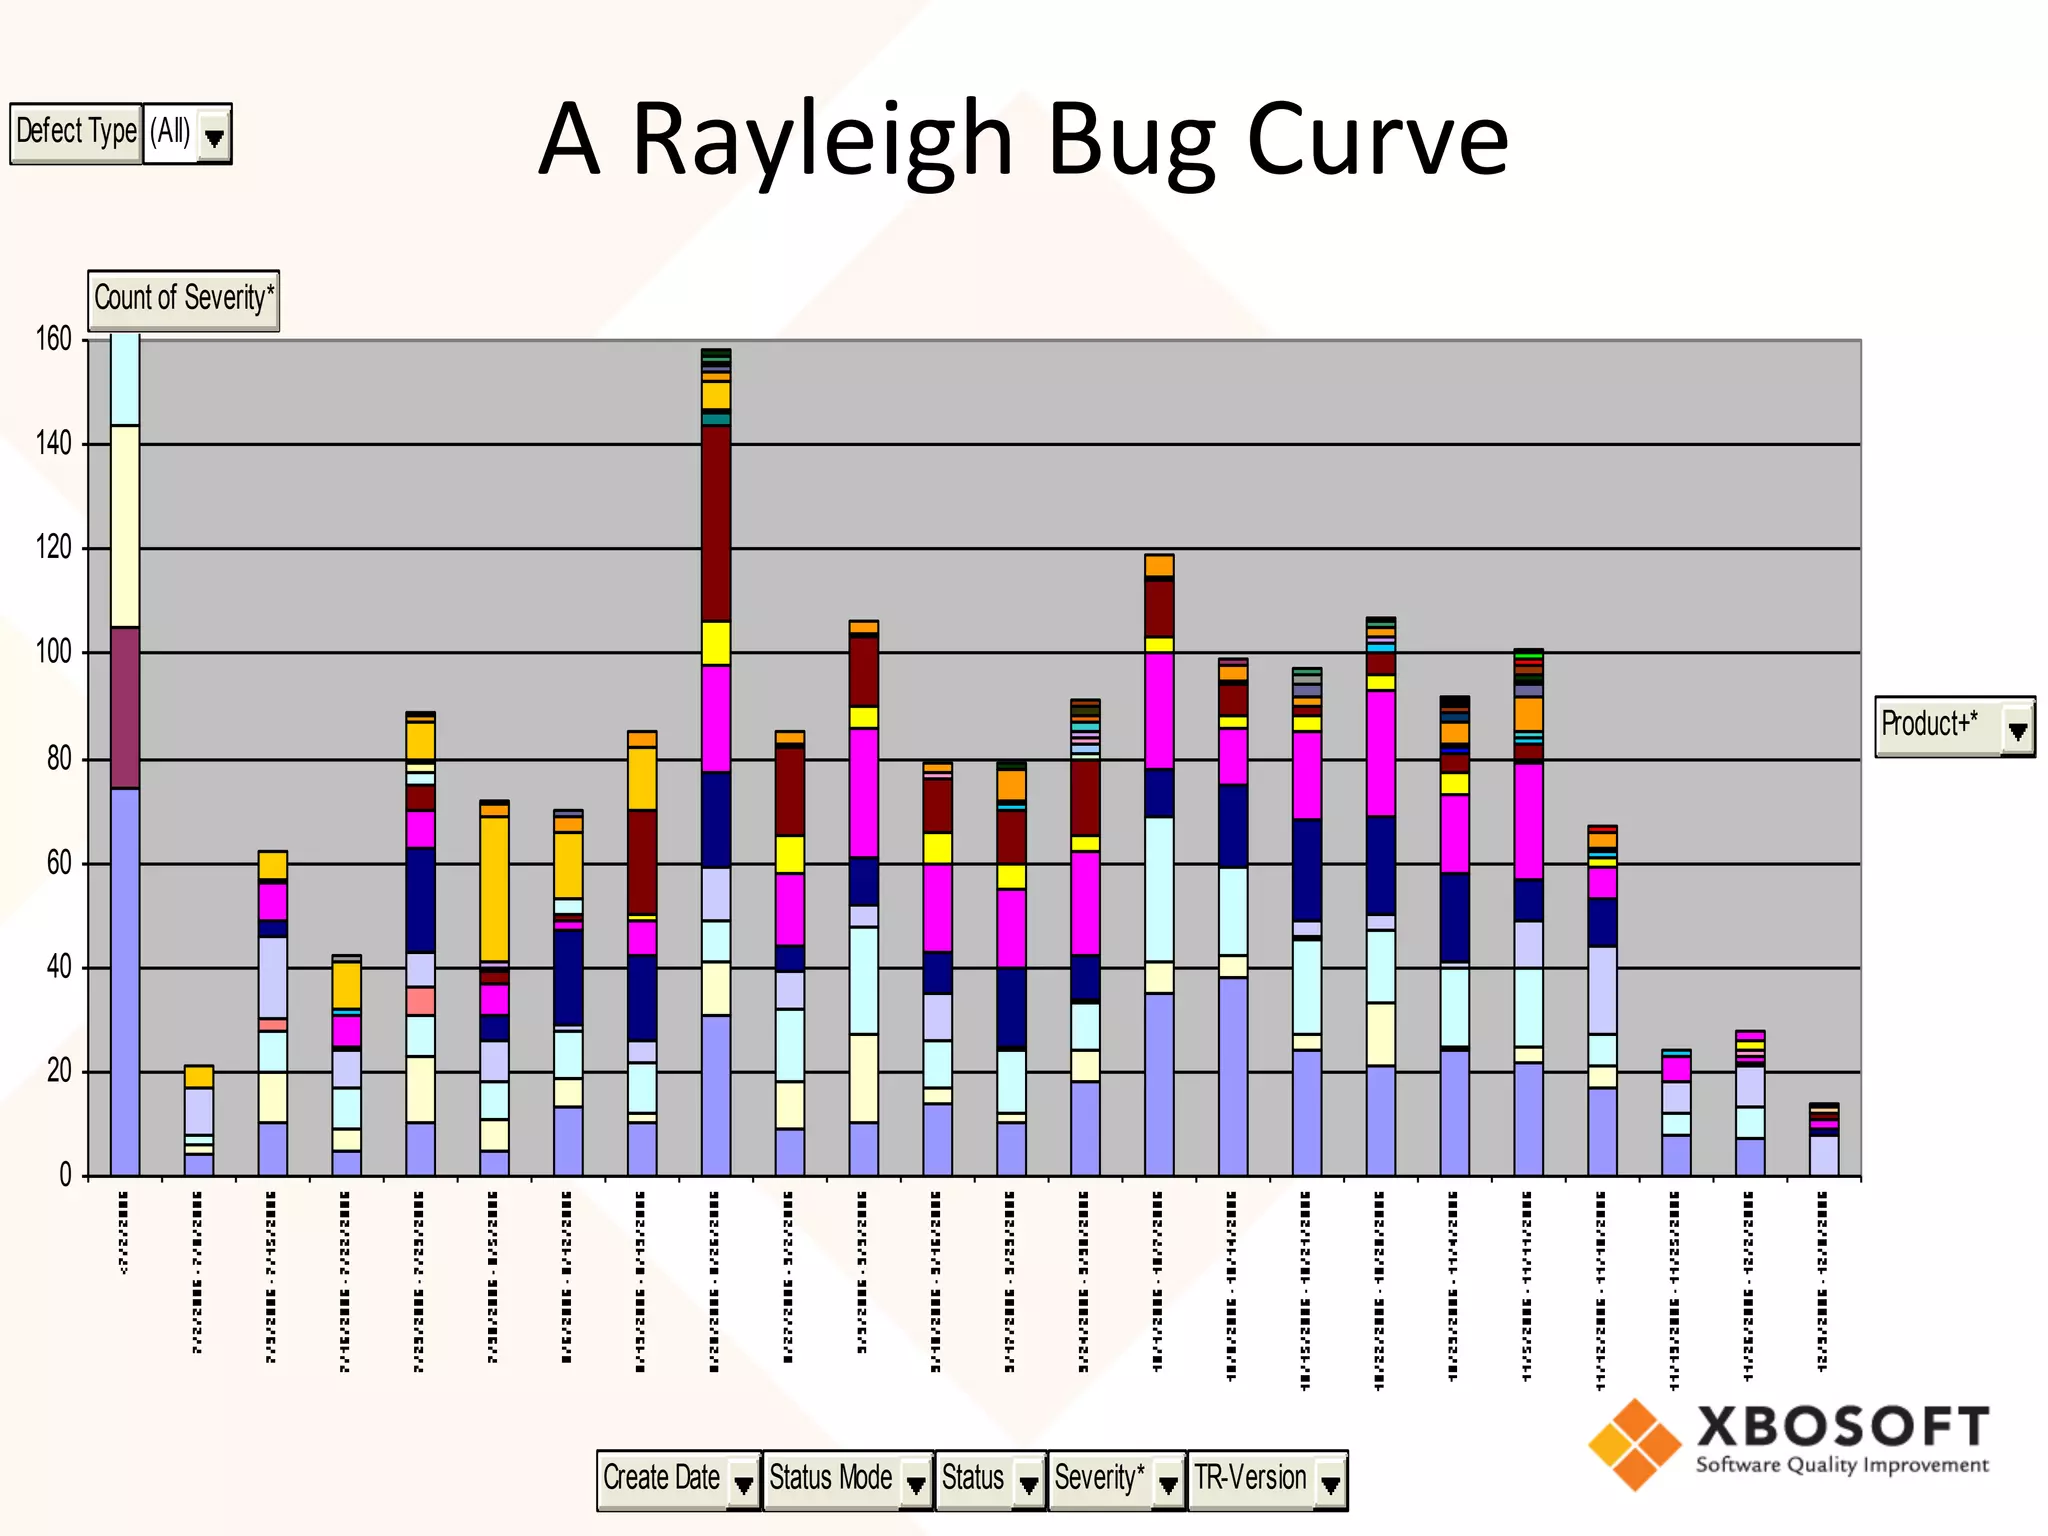
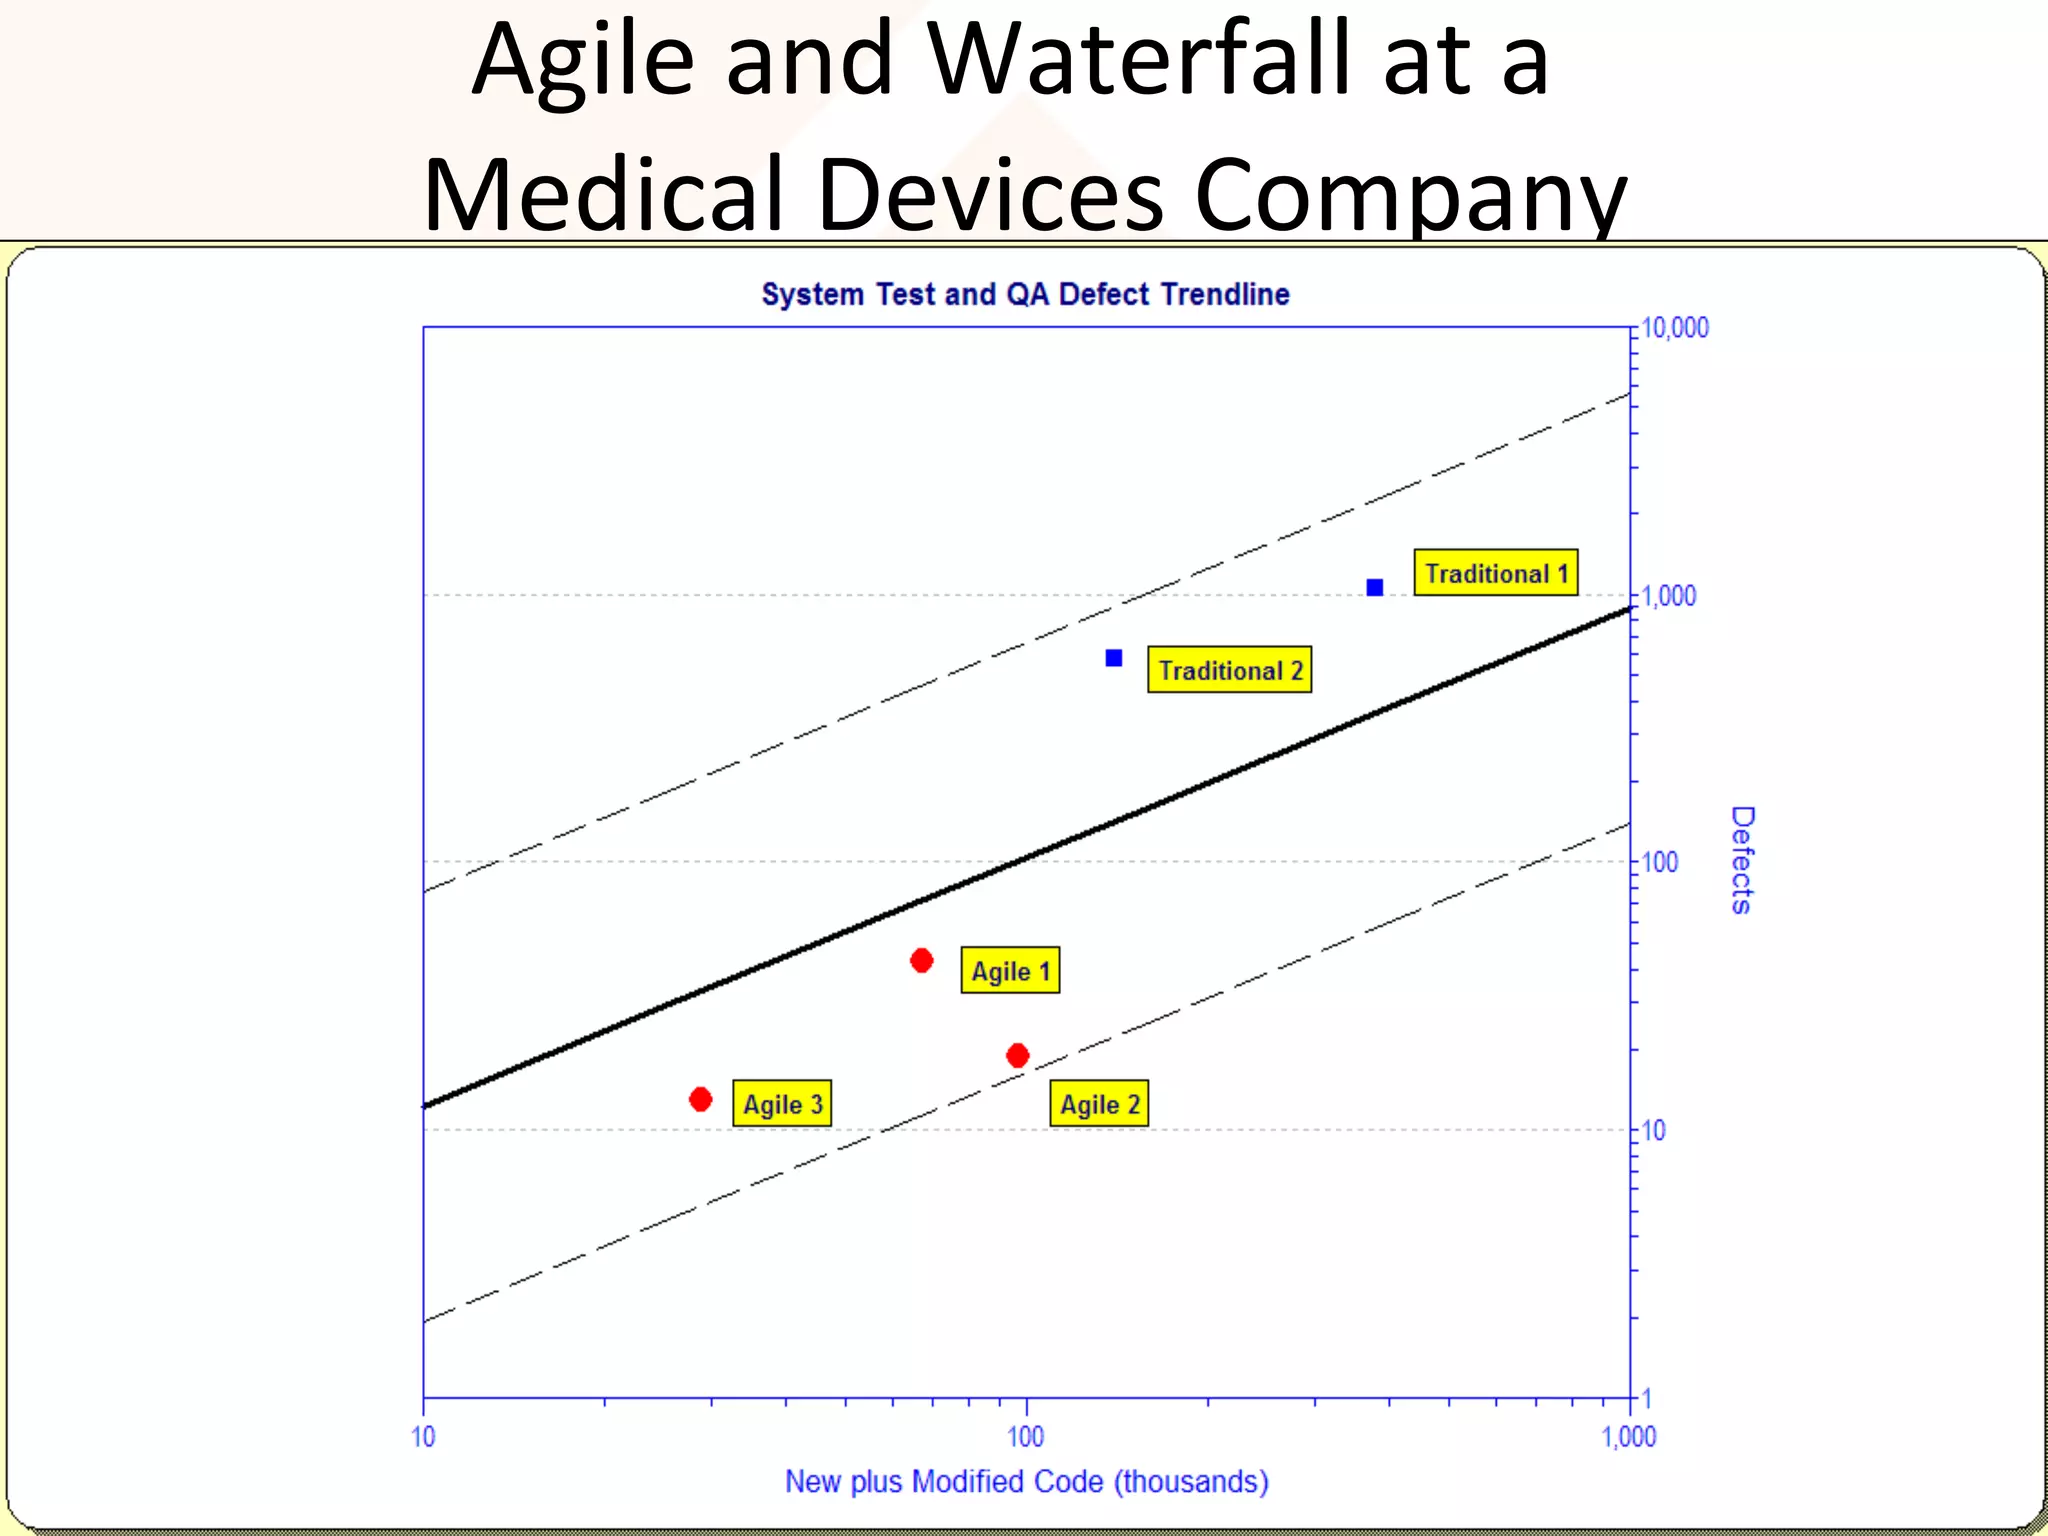
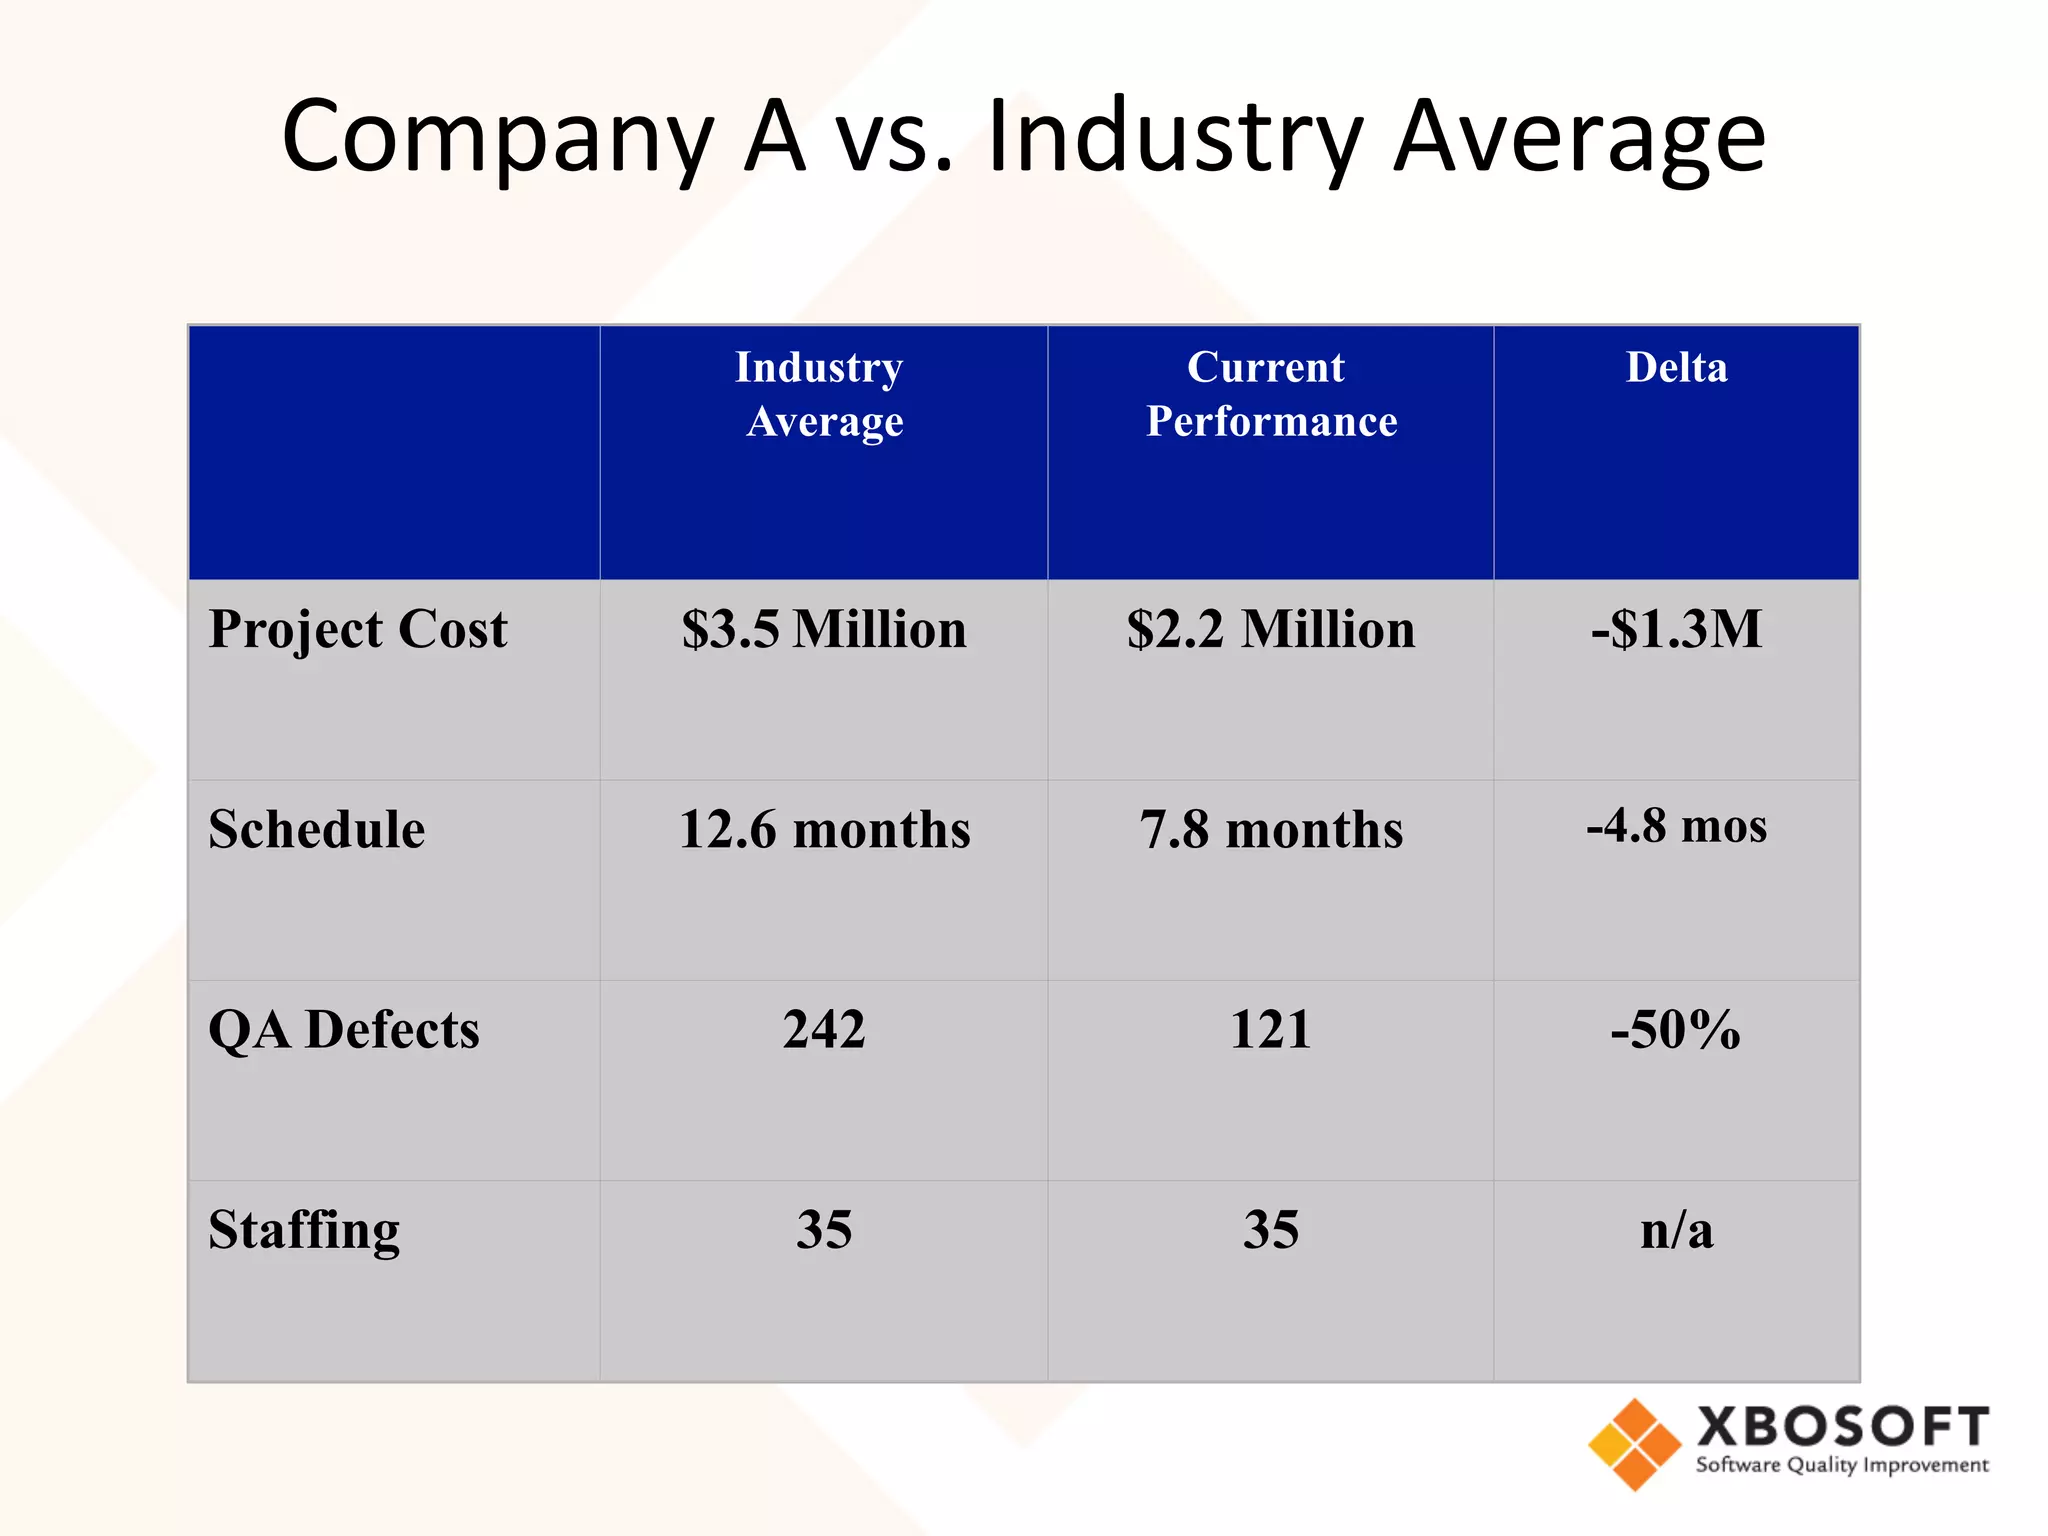
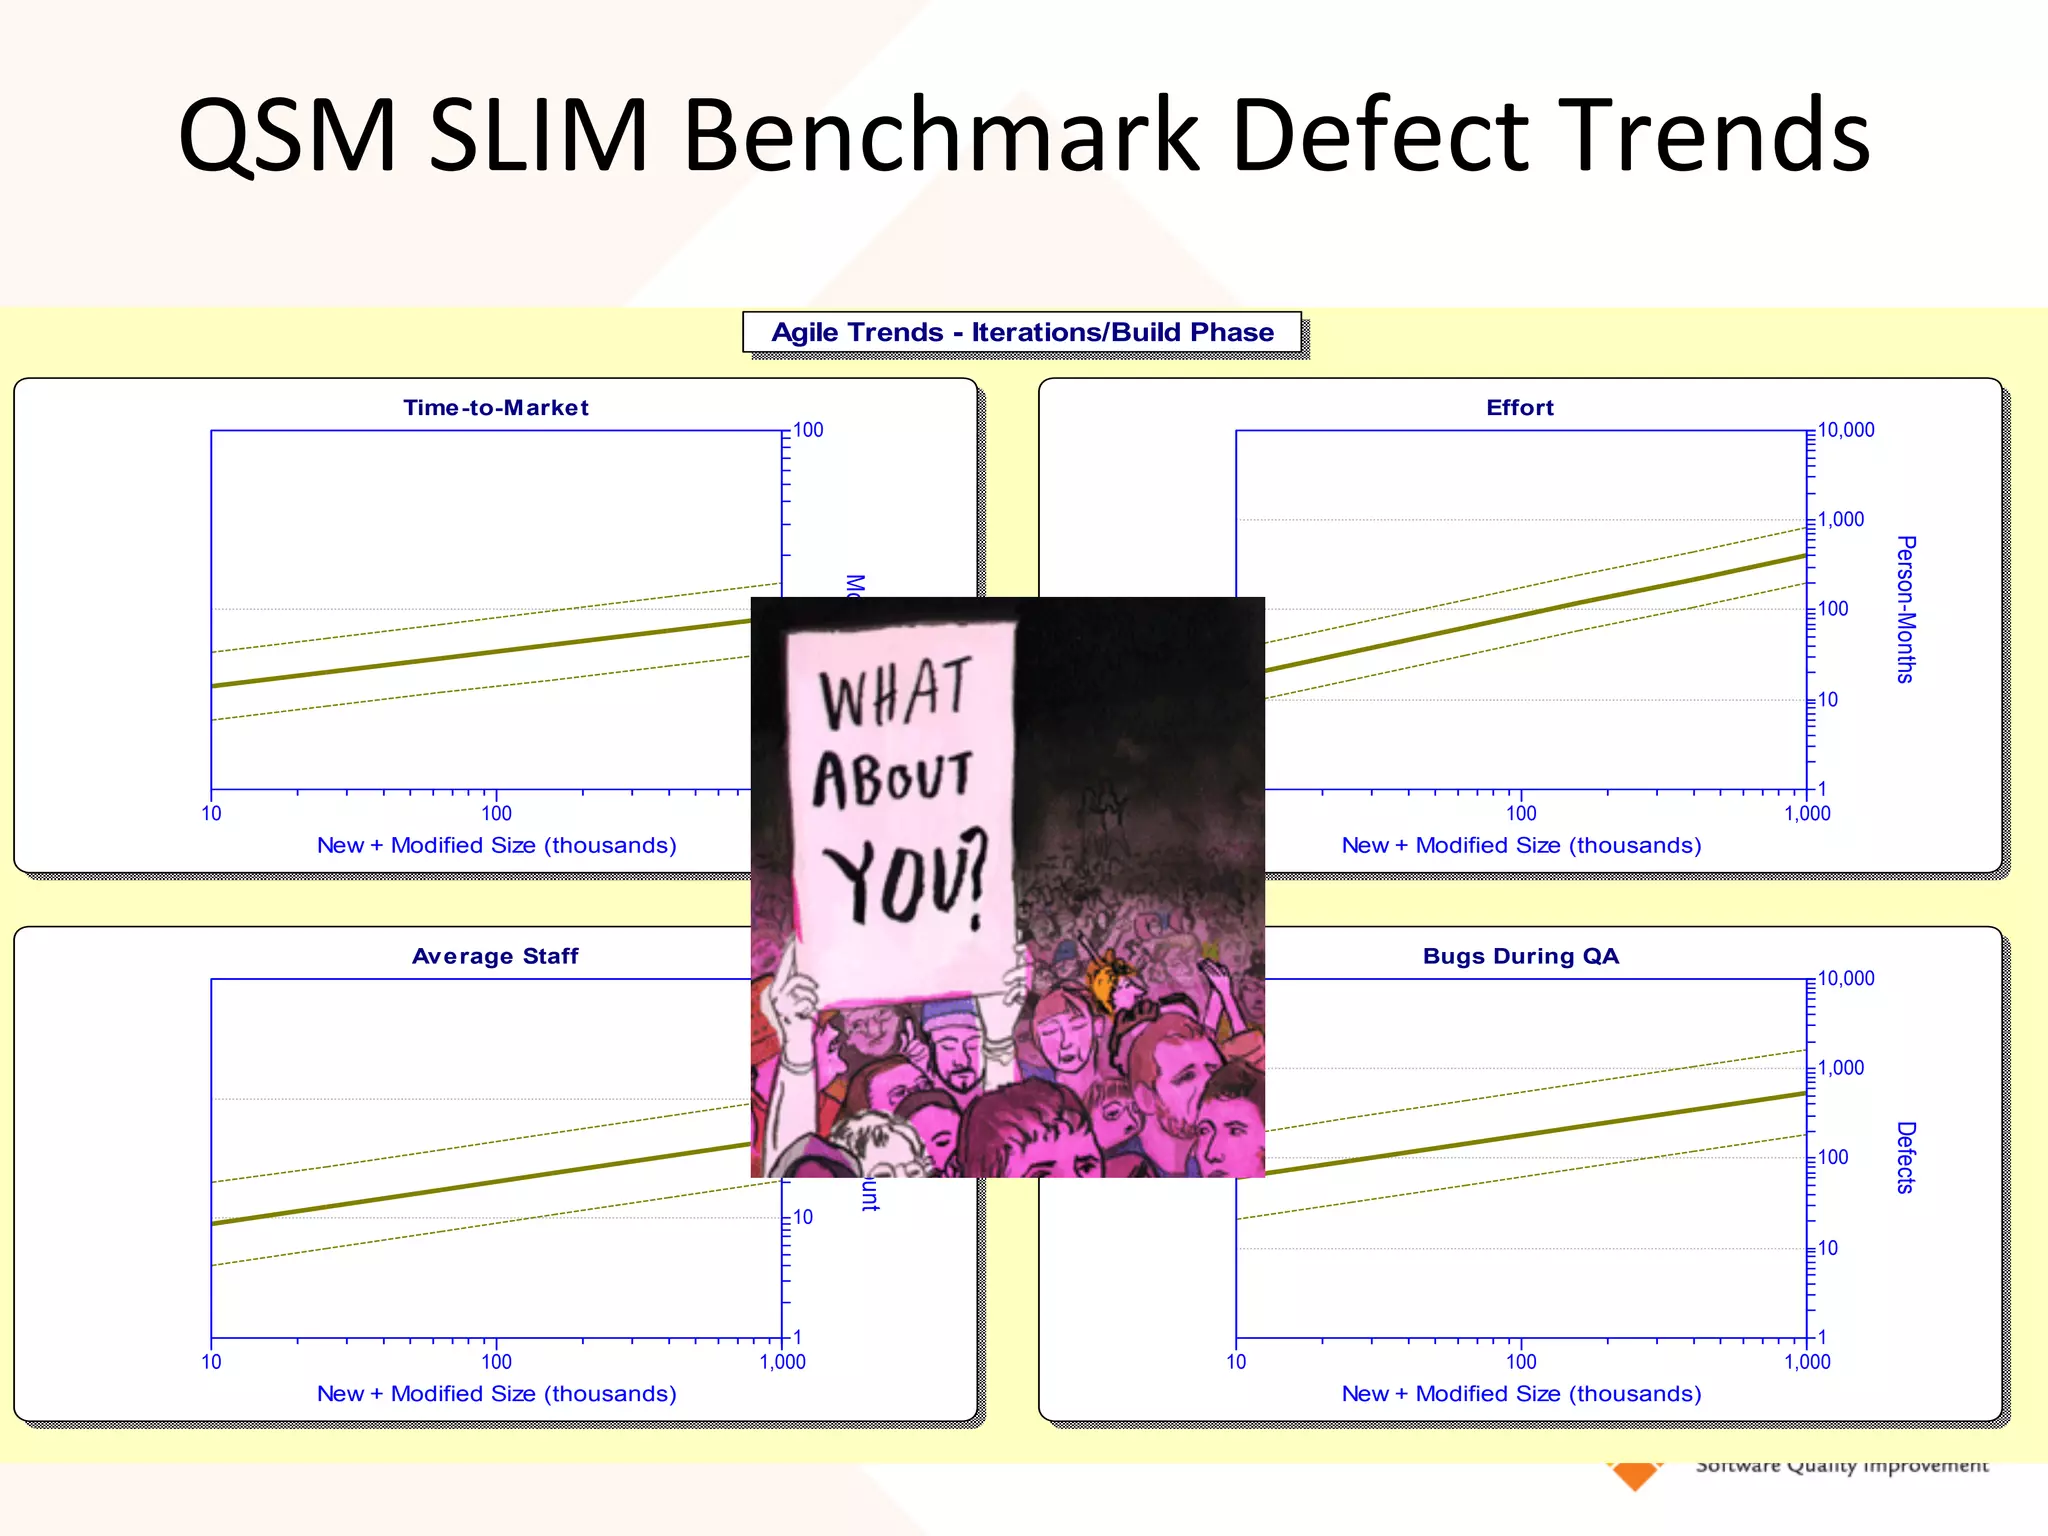
Defect	Rates	in	Agile	and	Waterfall	
What	They	Mean	to	You
	with Michael Mah
#ShiftLeftQA
From	Nuclear	Submarines	to	Widgets:	What	QA	
and	Test	Defect	Rates	Are	Saying.
	with Michael Mah
#ShiftLeftQA
XBOSoft
Dedicated to Software Quality Improvement
Founded in 2006
We speed products to market with our expert:
•  Software QA Consulting
•  Software Testing
–  Automation
–  Performance
–  Security
XBOSoft,	Inc.	All	Rights	Reserved.	 3	
#ShiftLeftQA
Meet Our Speakers
Philip Lew
CEO and Founder, XBOSoft
•  Relevant specialties and passions
o  Software quality process,
evaluation, measurement and
improvement
o  Software quality in use / UX
design
o  Mobile User Experience and
usability
o  Cycling and travel
XBOSoft,	Inc.	All	Rights	Reserved.	 4	
XBOSoft Team
#ShiftLeftQA
Michael	Mah	
Michael Mah is the director of the Benchmarking Practice at the Cutter
Consortium, a Boston-based IT think-tank, and served as past editor of
the IT Metrics Strategies publication. He is also managing partner at QSM
Associates Inc. based in Massachusetts USA.
• Michael teaches, writes, and consults to companies on measuring, estimating and managing
software projects, whether in-house, offshore, waterfall, or agile.
• With over 25 years of experience, Michael and his partners have derived productivity patterns
for thousands of software projects collected worldwide across engineering and business
applications. His current work examines time-pressure dynamics of teams, and its role in
project success and failure. In addition to his background in physics and electrical engineering,
he is a mediator specializing in dispute resolution for technology projects.
• He has a degree in electrics engineering from Tufts University. His training on dispute
resolution, mediation, and participatory processes is from the Program on Negotiation at
Harvard Law School and the Radcliffe Institute for Advanced Study. Michael is also a private
pilot and lives in the mountains of Western Massachusetts.
• He can be reached at michael.mah@qsma.com.
House Rules
§  Participants other than the speakers are muted
§  Ask questions in the Webinar control on the right
side of your screen or through Twitter @XBOSoft
§  Questions may be asked throughout the webinar -
we’ll try to answer them at the end
§  You’ll receive info on recording after the webinar
Webinar Hashtag: #ShiftLeftQA
XBOSoft,	Inc.	All	Rights	Reserved.	 6	
#ShiftLeftQA
The	QSM	SLIM	Database	
•  QSM	maintains	the	world’s	largest	benchmarking	database	
of	12,000+	completed	software	projects	collected	
worldwide.	We	put	industry	productivity	statistics	on	the	
desktop.	
•  The	QSM	SLIM	database	contains	projects	in	all	industries,	
waterfall,	Agile,	offshore/outsourced,	in-house,	new	
development,	and	maintenance.	
•  SLIM	tools	enable	managers	to	measure	and	estimate	Agile	
and/or	waterfall	projects.
Partial List of Clients
•  British Telecom
•  SAP
•  Microsoft
•  Intel
•  AT&T/BellSouth
•  BMC Software
•  Motorola
•  VerizonWireless
•  Roche Diagnostics
•  Fiserv Corp
•  IBM Global
•  Misys Healthcare
•  Nationwide
•  Boeing
•  Bank of New York
Mellon
•  Lockheed Martin
•  Progressive
•  DirecTV
0
20
40
60
80
100
120
140
160
Defect Type (All)
Count of Severity*
Create Date Status Mode Status Severity* TR-Version
Product+*
A	Rayleigh	Bug	Curve
Project Profile - Card Swipe Project
Agile	and	Waterfall	at	a		
Medical	Devices	Company
Real	Work,…	Optional	Chaos	
Time	à	
Effort	à	
But	if	we	severely	compress	a	project	schedule,	
most	of	the	effort	goes	into	the	Optional	Chaos.		
This	increases	costs	but	does	not	add	value	to	
the	product	
If	we	have	the	latitude	to	take	longer	on	a	
project,	we	can	greatly	increase	the	
proportion	of	work	that	goes	into	the	
product	
Source:		Armour,	Phillip	G.	
“Real	work,	Necessary	Friction,	Optional	Chaos”	
Communications	of	the	ACM	Vol	47	No	6	June	2004
Trendline	Assessment	–	Defects/Quality	
Defects During Test
100 1,000
Effective SLOC (thousands)
10
100
1,000
10,000
Errors(SysInt-Del)
Rel 5.0
Rel 6.0
Rel 6.5
Rel 7.5
Rel 7.0
Rel 8.0
Rel 5.0
Rel 6.0
Rel 6.5
Rel 7.5
Rel 7.0
Rel 8.0
Business Sy stems Av ionic Sy stems Command & Control Microcode Sy stems Process Control QSM 2005 Business
Av g. Line Sty le 1 Sigma Line Sty le
Far Fewer Defects: 50% - 66% Below Industry
Industry
Average
Current
Performance
Delta
Project Cost $3.5 Million $2.2 Million -$1.3M
Schedule 12.6 months 7.8 months -4.8 mos
QA Defects 242 121 -50%
Staffing 35 35 n/a
Company	A	vs.	Industry	Average
Industry
Average
Current
Performance
Delta
Project Cost $1.8 M $924k None
Schedule 10.3 months 5.1 months -5.2 mos
QA Defects 159 40 -75%
Staffing 23 15 -35%
2017	vs.	Industry	Average	
* Average Code Size 163k SLOC
Proper Planning
FAA	Radar	Flight	Following
Radar	Flight	Following	(Foreflight)
Defects Found
6 12 18 24 30 36 42 48 54 60 66 72 78 84 90
05/17
'03
06/28 08/09 09/20 11/01 12/13 01/24
'04
03/06 04/17 05/29 07/10 08/21 10/02 11/13 12/25 02/05
'05
0
100
200
300
400
500
Defects
10987654310
1098765
Current Plan Actuals Green Control Bound Yellow Control Bound Project: CEP
Rayleigh Defect Curve Schedule Forecasting
Domain	Knowledge	
•  Smart	people,	experienced	
people	
•  Coding	is	moving	knowledge	
from	mind	into	the	machine	
•  Inexperience	costs	money
Short	Feedback	Loops	
•  Paired	programmers	
•  Instantaneous	code	
reviews	
•  Accelerated	learning	and	
execution	
•  Face	to	face	
communication	channel
Avoiding	Burnout	
•  XP	=	Sustainable	pace	
•  40	Hour	Work	Weeks	
•  Prevent	productivity	
collapse	for	
overworked	teams
Transparency	
•  “Transparency	is	a	great	
floodlight.	People	who	
thrive	in	political	
maneuvering	hate	
SCRUM…”	
• 	 -	Ken	Schwaber
High-bandwidth	Communication	
•  The	best	teams	have	
“wide-open	pipes”	
•  Domain	knowledge	
moves	among	the	team	
•  Information	flows	rapidly	
and	accurately
Build	a	Little	Less
QSM	SLIM	Benchmark	Defect	Trends	
Agile Trends - Iterations/Build Phase
Time-to-Market
10 100 1,000
New + Modified Size (thousands)
1
10
100
Months
Effort
10 100 1,000
New + Modified Size (thousands)
1
10
100
1,000
10,000
Person-Months
Average Staff
10 100 1,000
New + Modified Size (thousands)
1
10
100
1,000
Headcount
Bugs During QA
10 100 1,000
New + Modified Size (thousands)
1
10
100
1,000
10,000
Defects
Continuous		
Improvement		
Cycle	
Data	Storage	
and	Reuse	
Manage
Project
Portfolios
Estimate
& Plan
Projects
Track &
Forecast
Projects
Analyze &
Benchmark
Projects
Store and Manage Historical Project Data
Portfolio	
Management	
Mathematical Models
1) Program Estimation
2) In-Flight Forecasting
3) Benchmarking
Based on 20+ years of research
Industry Database of 12,000 projects
Government and Commercial
SLIM Model Architecture Overview
Questions:	Contact	Us	
Michael Mah
Managing Partner
QSM Associates, Inc.
Pittsfield MA USA
email: michael.mah@qsma.com
website: www.qsma.com
twitter: @michaelcmah
tel: 1 413-499-0988
Andrea Gelli
QSM Associates Switzerland
8032 Zurich
tel +41 44 555 9126
email: andrea.gelli@qsma.ch
Post your webinar questions on Twitter @XBOSoft
Registrants will receive an email with information on where to view the recording
and slides from today’s webinar.
Join us to keep updated on all our webinars, reports and white papers:
facebook.com/xbosoft
+xbosoft
linkedin.com/company/xbosoft
Check out our blog: http://xbosoft.com/software-quality-blog/
Download our free white papers: https://xbosoft.com/resources/white-papers/
Email us with ideas for future webinars or questions regarding our services!
services@xbosoft.com
Thank you!
Q+A
www.xbosoft.com

Defect Patterns Analysis for Agile and Waterfall - XBOSoft Webinar with Michael Mah