Download to read offline
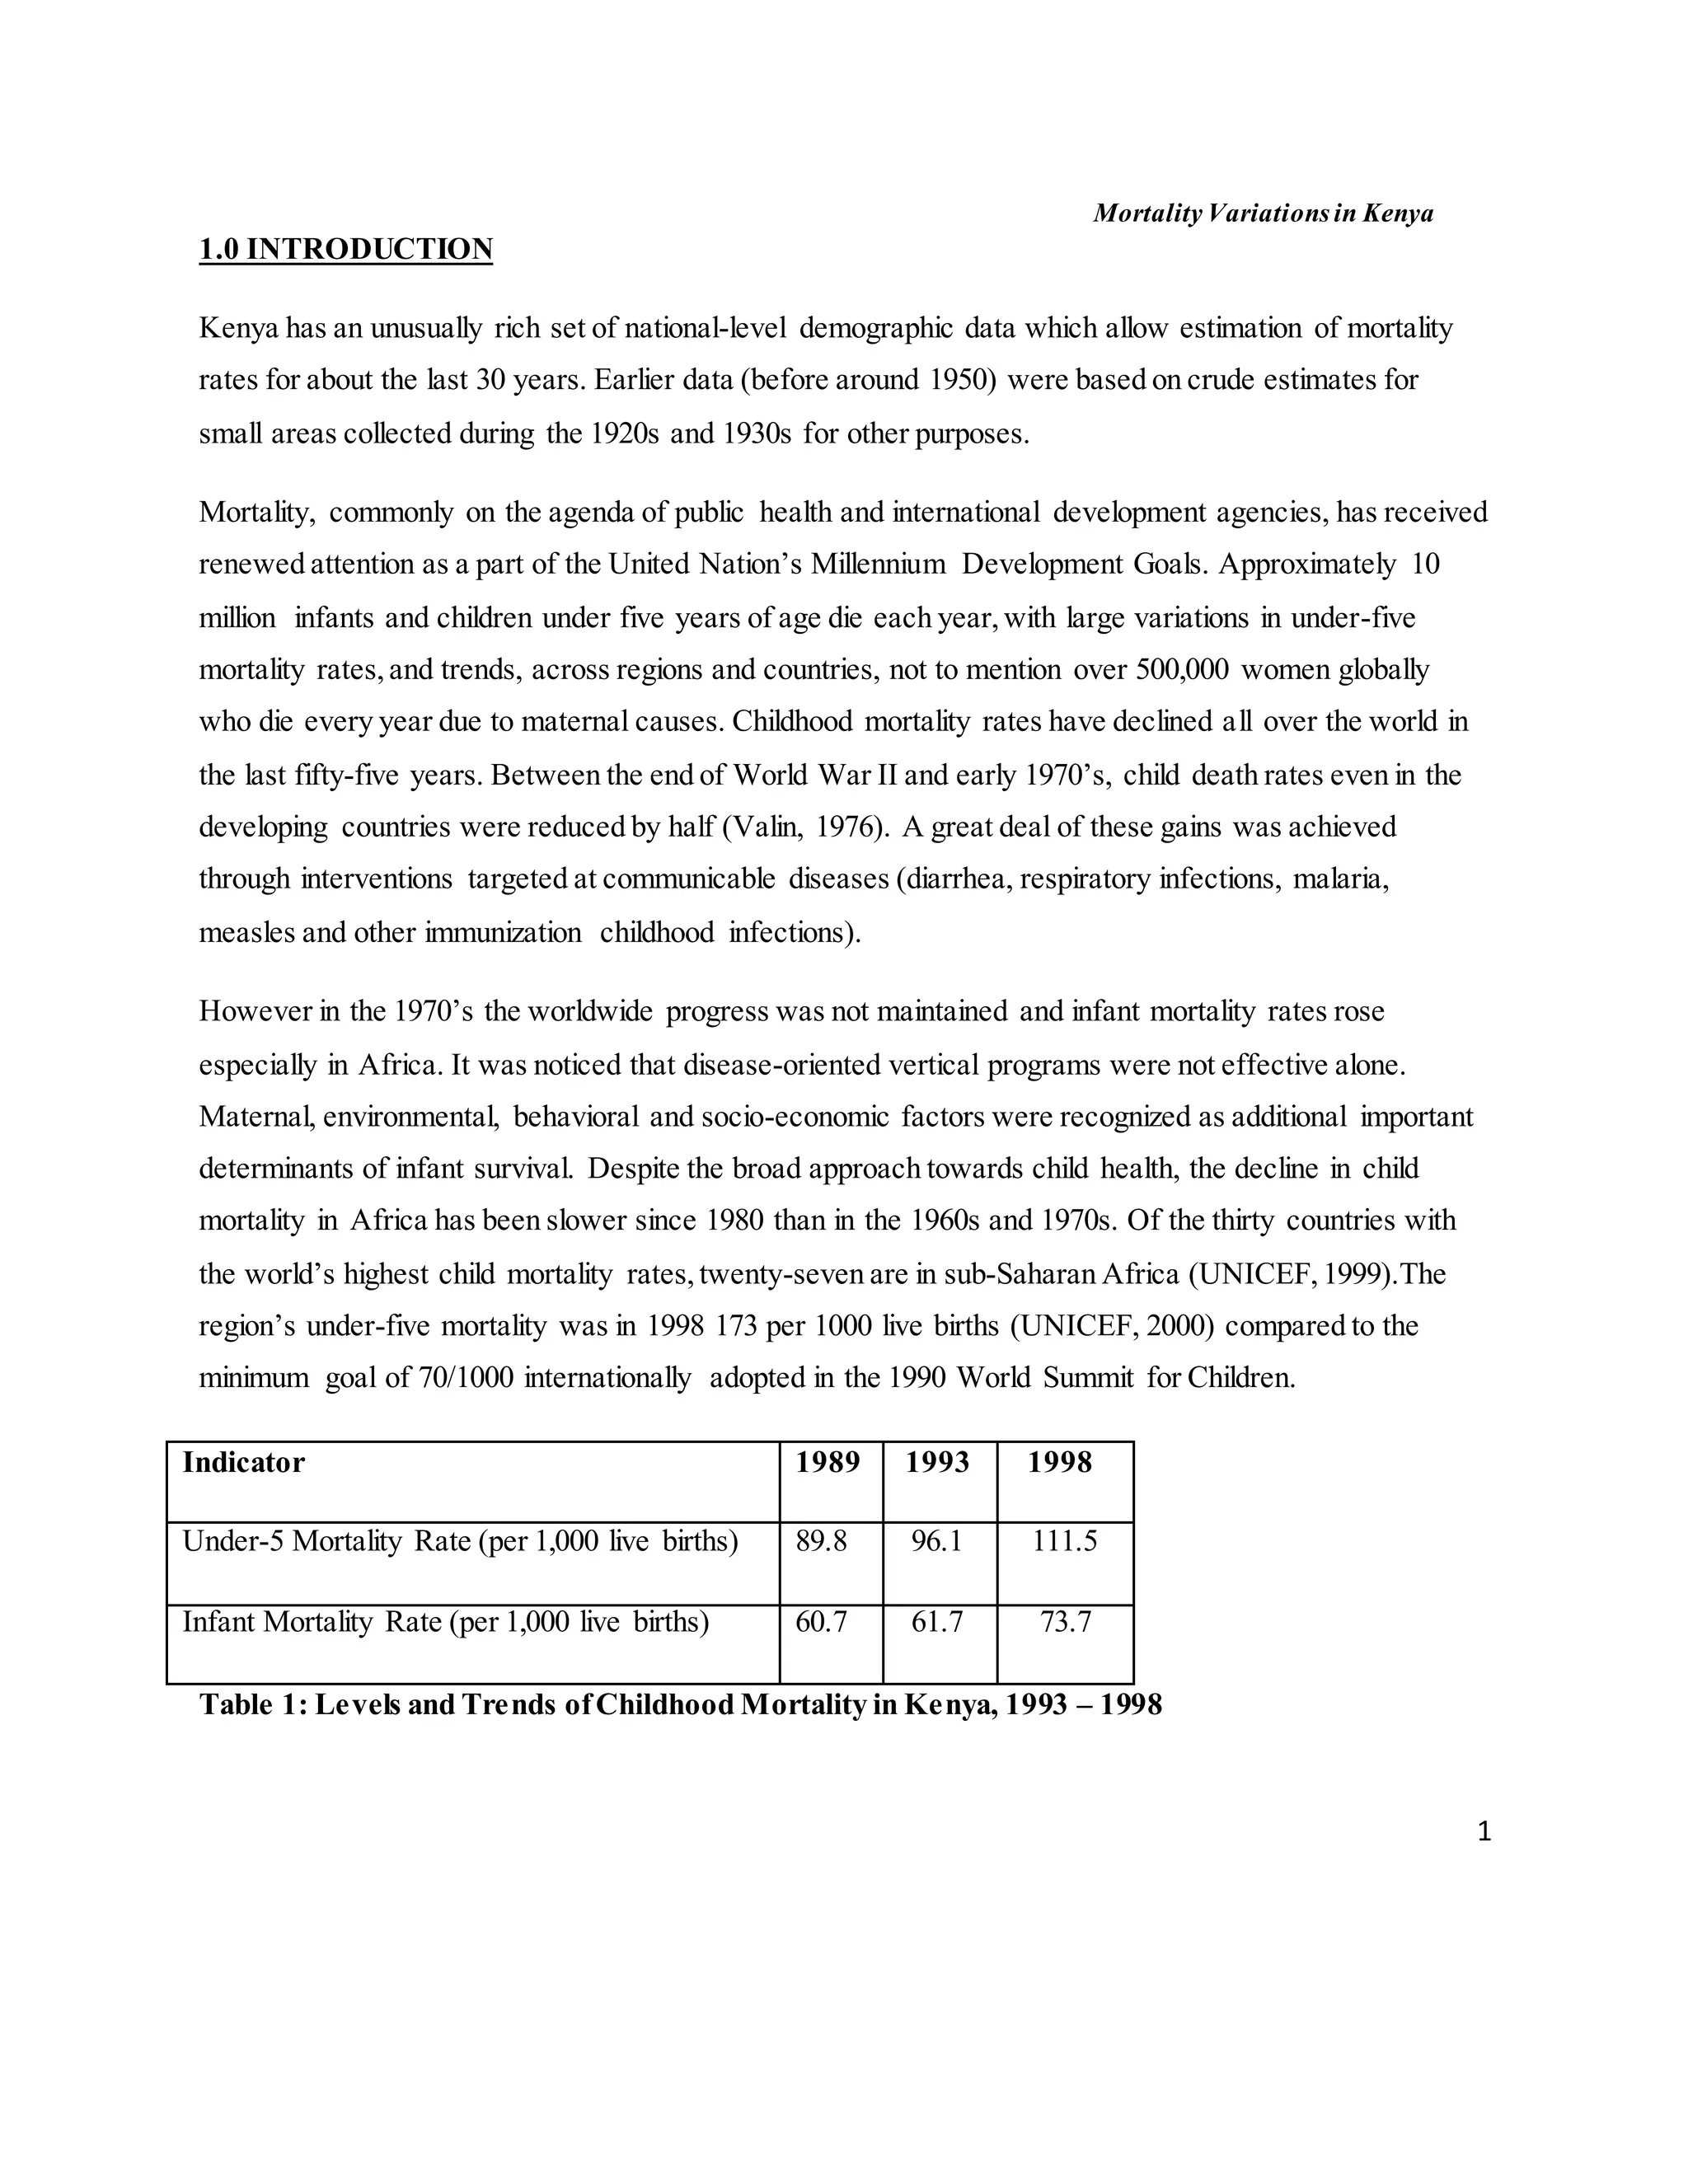
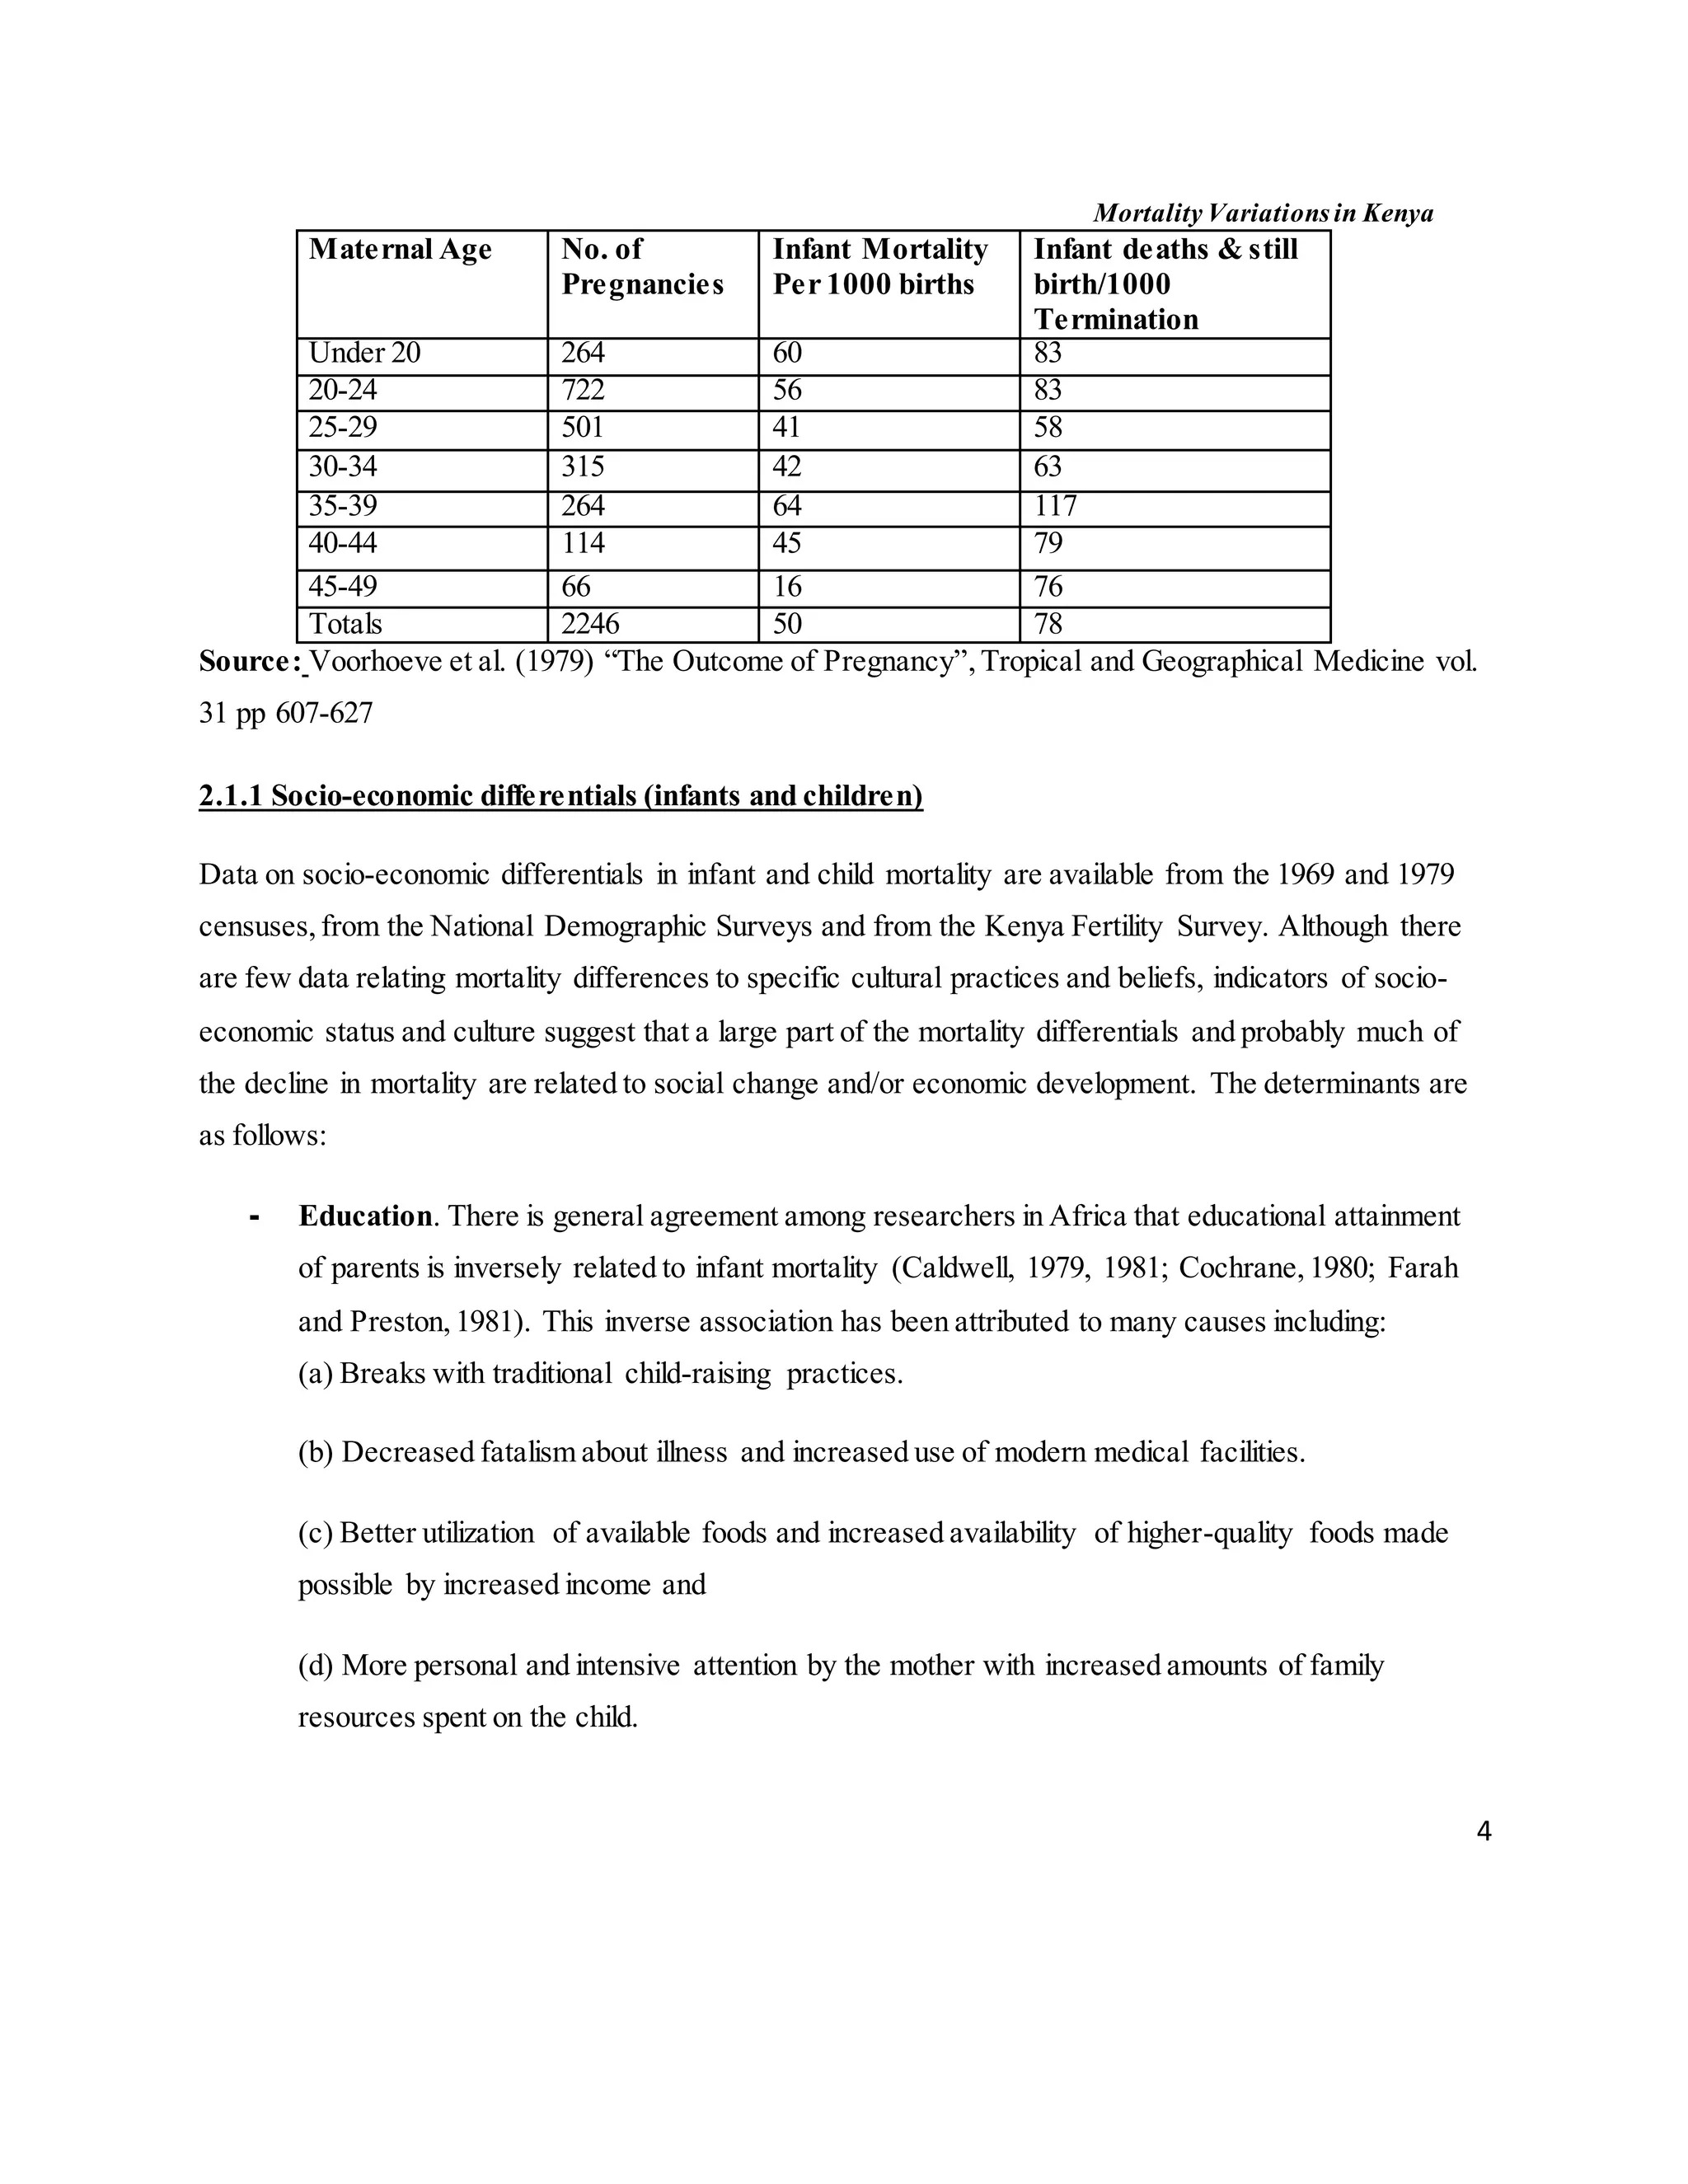

The document discusses mortality variations in Kenya, highlighting trends in childhood and maternal mortality rates over the past 30 years. Despite global declines in child mortality, sub-Saharan Africa, including Kenya, continues to experience high rates due to various socio-economic, environmental, and healthcare factors. The text emphasizes the importance of holistic approaches in addressing these mortality rates, particularly focusing on determinants like education, healthcare access, and living conditions.


