Download to read offline
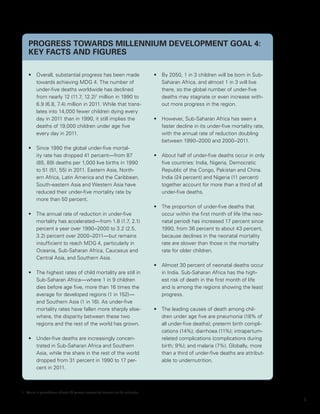

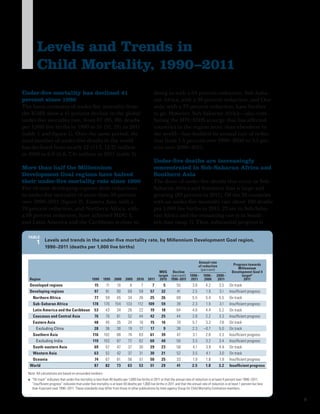
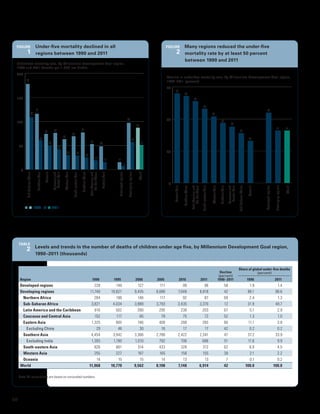
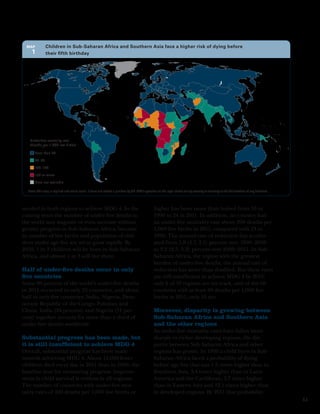
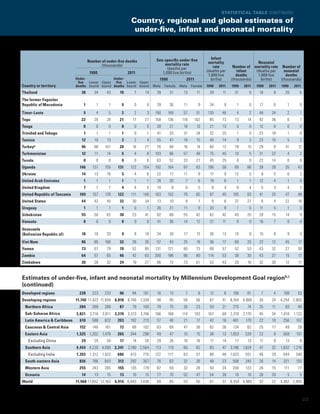
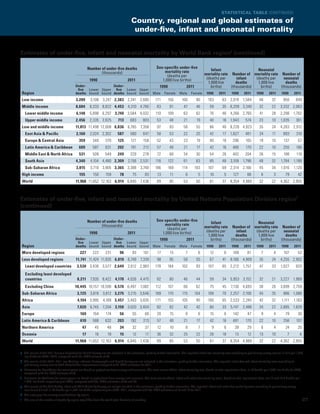


This document summarizes key facts about progress towards Millennium Development Goal 4 (MDG 4), which aims to reduce child mortality. It finds that while the global under-five mortality rate has declined 41% since 1990, the pace of reduction must accelerate to meet MDG 4. Most of the 6.9 million child deaths in 2011 were from preventable diseases. Sub-Saharan Africa and Southern Asia still have the highest rates and account for an increasing share of global child deaths. Redoubling efforts there is critical to achieve universal reductions.


![Millennium Development Goal 4 In Nigeria[1]](https://cdn.slidesharecdn.com/ss_thumbnails/millenniumdevelopmentgoal4innigeria1-13261342419582-phpapp02-120109124049-phpapp02-thumbnail.jpg?width=640&height=640&fit=bounds)


