The document summarizes a study on monitoring and assessing landslides in the Himalayan region between Agastmuni and Sonprayag. It discusses landslide inventory mapping using pre- and post-disaster imagery to identify landslides. An eight-layer landslide susceptibility map was created using weighted overlay analysis in GIS. Factors like geology, slope, and land use/land cover were considered. Vulnerability and risk maps were also produced by analyzing impacts to infrastructure, agriculture and built-up areas. The risk map showed 3% of the area was at high risk, concentrated where development and roads were located in more vulnerable zones.
![ISSN2349-7831
International Journal of Recent Research in Social Sciences and Humanities (IJRRSSH)
Vol. 4, Issue 2, pp: (92-118), Month: April - June 2017, Available at: www.paperpublications.org
Page | 116
Paper Publications
along the river of Madhmashawar ganga & kaliganga fall high to very high risk zone
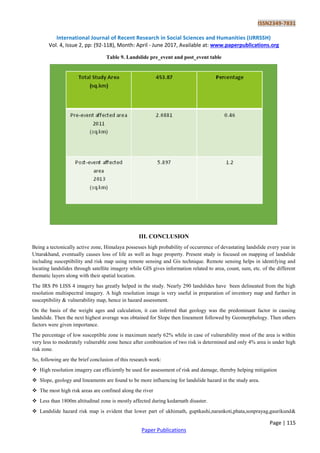
The minimum size of the landslide that can be detected using this method depends upon the resolution of the satellite
data. However, using 5.8 m resolution data, a landslide of 452 sq. km was detected.
ACKNOWLEDGEMENT
My deepest gratitude goes to my respected supervisor and co-supervisor, Mrs. Richa Upadhyay Sharma Scientist “SD”,
Geosciences and Geo-hazard Department and Dr. ShovanLalChattoraj Scientist “SD” Geosciences and Geo-hazards
Dept.Indian Institute of Remote Sensing (IIRS).They are always available as an active support and assistance throughout
this project work. I thank them for their advice, guidance, patience and encouragement they showed to me. I have learned
a lot from them above all the essence of a scientific research and critical comments.
I feel indebted to Dr. P.K. Champati ray, Scientist “SG”, Head, Geosciences and Geo-hazards Department for his constant
help, cooperation and supervision all through the course.
I would like to express my heartfelt gratitude and thankfulness to Dr. R.S. Chatterjee, Scientist SG Indian Institute of
Remote Sensing, Course coordinator, Geosciences Department for his constant support and encouragement throughout
the course at Geosciences Department, IIRS.
I owe my gratitude to Mr. Suresh Kannujiya Scientist “SC”, Geosciences and Geo-hazard Department for his help and
support.
I avail this opportunity to express my profound sense of reverence and humble gratitude to Dr. Senthil Kumar, Director,
IIRS, and Dr. S.P.S Kushwaha, Dean (Academic), IIRS for their support to stay at beautiful and homely campus of IIRS
in Dehradun.
My Special thanks to all JRFs and M.tech seniors Bhavana Ghildiyal, Somalin Nath, Bipin Kumar, Gopal Sharma,
ShailajaThapa, Rohit Kumar, Vivek Senger, Shobhna Lakhera and Sumi Kala who gave me support and ideas throughout
the Project work.
I cannot forget my friends Nazia khan ,Fakhr Un Nisha, Deepmala Gupta and Nida plus all my friends and classmates
who have always been remained supportive during my course work. My sincere thanks to them for their encouragement
and cooperation.
I would love to express my sincere gratitude to my parents Ayyub Ahmad Mother Sanjeeda Begum and my brother Dr.
Tanveer and sisters Fahmida, Asba, Farha, Qudsi for their continuous support and encouragement and love and concern
are always overwhelming and led me to a great accomplishment.
Last but not least to Ashish Dhiman (Tech-Asst) and Ms. Ramandeep Kaur who has been very active in providing
necessary logistics that make my project smoother.
REFERENCES
[1] Antonini, G., Ardizzone, F., Cardinali, M., Galli, M., Guzzetti, F., &Reichenbach, P., (2002) a. Surface deposits and
landslide inventory map of the area affected by the 1997 Umbria– Marche earthquakes. Bollettino Della
SocietaGeologicaItaliana 121 (2), 843–853.
[2] Aleotti, P., &Chowdhury, R. (1999). Landslide hazard assessment: summary, review and new. Perspectives. Bull
EngGeolEnv 58(1):21–44.
[3] Ayalew L, Yamagishi H, Marui H, Kanno, T. (2005). Landslides in Sado Island of Japan: Part II. GIS-based
susceptibility mapping with comparison of results from two methods and verifications. EngGeol, 81:432–445.
[4] Barlow, J., Franklin, S., Martin, Y., (2006). High spatial resolution satellite imagery, DEM derivatives, and image
segmentation for the detection of mass wasting processes. Photogrammetric Engineering and Remote Sensing, 72,
687–692.](https://image.slidesharecdn.com/monitoringandassesmentoflandslide-956-180709165627/85/Monitoringand-assesmentoflandslide-956-26-320.jpg)
![ISSN2349-7831
International Journal of Recent Research in Social Sciences and Humanities (IJRRSSH)
Vol. 4, Issue 2, pp: (92-118), Month: April - June 2017, Available at: www.paperpublications.org
Page | 117
Paper Publications
[5] Barredo J.I., Benavidesz A., Hervhl J. and Van Westen C.J. (2000). Comparing heuristic landslide hazard
assessment techniques using GIS in the Tirajana basin. Gran Canaria Island, Spain. International Journal of Earth
Observation and Geoinformation, 2(1): 9–23.
[6] Brunsden, D., (1985). Landslide types, mechanisms, recognition, identification. In: Morgan, C.S. (Ed.), Landslides
in the South Wales Coalfield, Proceedings Symposium. The Polytechnic of Wales, (pp. 19–28).
[7] Behling, R.., Roessner, S., Segl, K., Kleinschmit, B., Kaufmann, H. (2014). Automated landslide identification based
on temporal NDVI-trajectories using long-term optical multi-sensor time-series data. EGU General Assembly
Conference Abstracts. p. 15679.
[8] Clerici, A., Perego, S., Tellini, C. and Vescovi, P., (2002). A Procedure for Landslide Susceptibility Zonation by the
Conditional Analysis Method, Geomorphology, 48,349-364.
[9] Cardinali, M., Antonini, G., Reichenbach, P., Guzzetti, F., (2001). Photo geological and landslide inventory map for
the Upper Tiber River basin. CNR, GruppoNazionale per la DifesadalleCatastrofiIdrogeologiche, Publication n.
2116, scale 1:100,000. Causes and consequences; INTERNATIONAL JOURNAL OF GEOMATICS AND
GEOSCINCES.
[10] Chen, Z., & Lee, C.F., (2004). Geohazards of slope mass movement and its prevention in Hong Kong and together
with expertise opinion. Engineering geology, 76(1-2), 3-25.
[11] Clerici, A., Perego, S., Tellini, C. and Vescovi, P. (2006), A GIS-based automated procedure for landslide
susceptibility mapping by the Conditional Analysis method: the Baganza valley case study (Italian Northern
Apennines), Environmental Geology, 50, 941–961.)
[12] Continuous Slope Mass Rating and Kinematic Analysis in Rudraprayag District,Dai, F.C., Lee C.F. and Ngai, Y.Y.,
(2002). Landslide risk assessment and management: anoverview. Engineering Geology, vol. 64, pp. 65-87.
[13] Ghosh, J.K., Suri, S. A., Knowledge based system for assessment of landslide hazard. In Proceedings of the Indian
Geotechnical Conference, vol. 1, pp. 393–396. IGS, Ahmedabad (2005)).
[14] Guzzetti, F., Reichenbach, P., Cardinali, M., Galli, M., Ardizzone, F., (2005). Probabilistic landslide hazard
assessment at the basin scale. Geomorphology, 72, 272–299. Herva´ s. J., Barredo J. I., Rosin P. L., Pasuto, A.,
Mantovani. F., Silvano. S., (2003). Monitoring landslides from optical remotely sensed imagery: the case history of
Tessina landslide, Italy. Geomorphology. 54:63–75.
[15] Herva´ s. J., Barredo J. I., Rosin P. L., Pasuto, A., Mantovani. F., Silvano. S., (2003). Monitoring landslides from
optical remotely sensed imagery: the case history of Tessina landslide, Italy. Geomorphology. 54:63–75.
[16] Hoang Bac Bui, Quoc Phi Nguyen, Van Trung Nguyen ; Gis-BasedWeights-of-Evidence Modeling For Landslide
Susceptibility Mapping At Jaechon,Area, Korea.
[17] Hürlimann, M., Rickenmann, D., Medina, V., & Bateman, A., (2008). Evaluation of approaches to calculate debris-
flow parameters for hazard assessment, Engineering Geology, 102 (2008) 152–16.
[18] Introduction to landslides Part 2: Mapping landslides from air photos; Cees van Westen ; International Institute for
Aerospace Survey and Earth Sciences (ITC),Enscheda, The Netherlands.
[19] Islam, M.A., Chattoraj S.L, Champati ray P.K; Ukhimath landslide 2012 at Uttarakhand, India:
[20] KuldeepPareta, Jitendra Kumar, UpasanaPareta. (2012). Landslide Hazard Zonation using Quantitative Methods in
GIS, International Journal of Geospatial Engineering and Technology, Vol. 1, No. 1, 2012, pp. 1-9).
[21] Landslide hazard assessment in active seismic zone of Himalaya;Published online: 11
[22] Lee, S., Sambath,T., (2006). Landslide susceptibility mapping in the DamreiRomelarea, Cambodia using frequency
ratio and logistic regression models. Environmental Geology, 50(6),847–856.
[23] McCalpin, J., (1984). Preliminary age classification of landslides for inventory mapping. Proceedings 21st annual
Engineering Geology and Soils Engineering Symposium. University Press, Moscow, Idaho, pp. 99–111.](https://image.slidesharecdn.com/monitoringandassesmentoflandslide-956-180709165627/85/Monitoringand-assesmentoflandslide-956-27-320.jpg)
![ISSN2349-7831
International Journal of Recent Research in Social Sciences and Humanities (IJRRSSH)
Vol. 4, Issue 2, pp: (92-118), Month: April - June 2017, Available at: www.paperpublications.org
Page | 118
Paper Publications
[24] November 2006; © Springer-Verlag 2006.
[25] P. K. Champati ray , SuvarnaDimri , R. C. Lakhera , Santosh Sati ; Fuzzy-based method for
[26] Pašek, J., (1975). Landslide inventory. International Association Engineering Geologist Bulletin,12, 73–74.
[27] R. K. Umrao, R. Singh, M. Ahmad, T. N. Singh; Stability Analysis of Cut Slopes Using
[28] Rautela, P., Lakhera, R, C., (2000). Landslide risk analysis between Giri and Ton Rivers in Himalaya (India). Int J
Appl Earth ObservGeoinform, 2:153–160
[29] recent trends and techniques ; Published in SpringerPlus 2013.
[30] Sudhakar D Pardeshi, Sumant E Autade and Suchitra S Pardeshi; Landslide hazard assessment:
[31] Uttarakhand; Published Online October 2011 in Scientific Research
[32] Van Westen, C.J., Rengers, N., Terlien, M.T.J., &Soeters, R. (1997).Prediction of the occurrence of slope instability
phenomenal through GIS-based hazard zonation. GeologischeRundschau, 86(2), 404-414.
[33] Varnes. (1978). Landslides types and processes.
[34] Kanungo, D. P., Arora, M. K., Sarkar, S., and R. P. Gupta. (2009). Landslide Susceptibility Zonation (LSZ)
Mapping - A Review. Vol (2), 1.
[35] Vaidya KS (1980) Geology of Kumayun lesser Himalaya. Wadia Institute of Himalayan Geology, Dehradun,
View publication statsView publication stats](https://image.slidesharecdn.com/monitoringandassesmentoflandslide-956-180709165627/85/Monitoringand-assesmentoflandslide-956-28-320.jpg)


