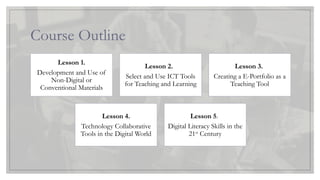
Course Outline
Lesson 1.
Developmentand Use of
Non-Digital or
Conventional Materials
Lesson 2.
Select and Use ICT Tools
for Teaching and Learning
Lesson 3.
Creating a E-Portfolio as a
Teaching Tool
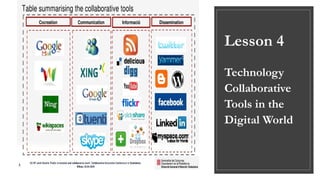
Lesson 4.
Technology Collaborative
Tools in the Digital World
Lesson 5.
Digital Literacy Skills in the
21st
Century
3.
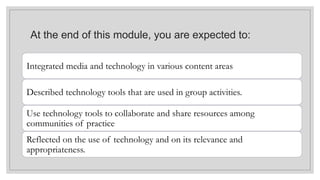
At the endof this module, you are expected to:
Integrated media and technology in various content areas
Described technology tools that are used in group activities.
Use technology tools to collaborate and share resources among
communities of practice.
Reflected on the use of technology and on its relevance and
appropriateness.
4.
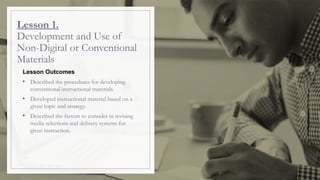
Lesson 1.
Development andUse of
Non-Digital or Conventional
Materials
Lesson Outcomes
• Described the procedures for developing
conventional instructional materials.
• Developed instructional material based on a
given topic and strategy.
• Described the factors to consider in revising
media selections and delivery systems for
given instruction.
5.
Instructional Materials
◦enhance teachingand learning.
Instructional materials are defined as print
and non-print items that are rested to pact
information to students in the educational
process (Effiong & Igiri, 2015).
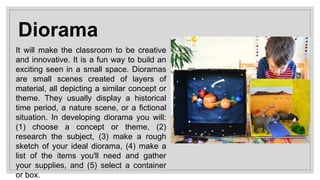
Diorama
It will makethe classroom to be creative
and innovative. It is a fun way to build an
exciting seen in a small space. Dioramas
are small scenes created of layers of
material, all depicting a similar concept or
theme. They usually display a historical
time period, a nature scene, or a fictional
situation. In developing diorama you will:
(1) choose a concept or theme, (2)
research the subject, (3) make a rough
sketch of your ideal diorama, (4) make a
list of the items you'll need and gather
your supplies, and (5) select a container
or box.
8.
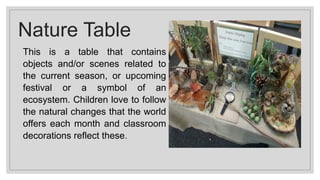
Nature Table
This isa table that contains
objects and/or scenes related to
the current season, or upcoming
festival or a symbol of an
ecosystem. Children love to follow
the natural changes that the world
offers each month and classroom
decorations reflect these.
9.
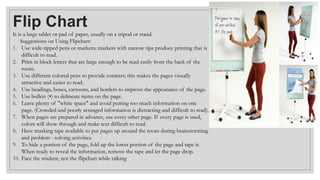
Flip Chart
It isa large tablet or pad of paper, usually on a tripod or stand.
Suggestions on Using Flipchart:
1. Use wide-tipped pens or markers; markers with narrow tips produce printing that is
difficult to read.
2. Print in block letters that are large enough to be read easily from the back of the
room.
3. Use different colored pens to provide contrast; this makes the pages visually
attractive and easier to read.
4. Use headings, boxes, cartoons, and borders to improve the appearance of the page.
5. Use bullets (•) to delineate items on the page.
6. Leave plenty of "white space" and avoid putting too much information on one
page. (Crowded and poorly arranged information is distracting and difficult to read).
7. When pages are prepared in advance, use every other page. If every page is used,
colors will show through and make text difficult to read.
8. Have masking tape available to put pages up around the room during brainstorming
and problem - solving activities.
9. To hide a portion of the page, fold up the lower portion of the page and tape it.
When ready to reveal the information, remove the tape and let the page drop.
10. Face the student, not the flipchart while talking
11.
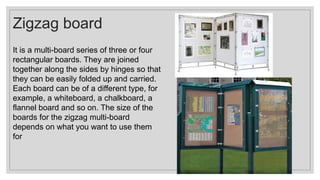
Zigzag board
It isa multi-board series of three or four
rectangular boards. They are joined
together along the sides by hinges so that
they can be easily folded up and carried.
Each board can be of a different type, for
example, a whiteboard, a chalkboard, a
flannel board and so on. The size of the
boards for the zigzag multi-board
depends on what you want to use them
for
12.
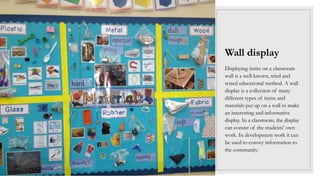
Wall display
Displaying itemson a classroom
wall is a well-known, tried and
tested educational method. A wall
display is a collection of many
different types of items and
materials put up on a wall to make
an interesting and informative
display. In a classroom, the display
can consist of the students' own
work. In development work it can
be used to convey information to
the community.
13.
Click icon toadd picture
Rope and Pole
display board
This board consists of two
parallel, horizontal poles tied
loosely together with rope.
Visual aids such as posters
'can be pinned to the rope.
This in of display board is
invaluable where there are
few solid walls for displaying
information. It has no solid
backing and can be made
quickly for teaching, training
and when working with
communities.
14.
Instructional
materials
Textbooks, audio andvideo cassettes,
handouts, charts, teaching aids of various
kinds which can all be used for different
purposes by the teacher.
Classroom instructional materials do not
only mean the materials available in the
market.
15.
The following aresuggested steps in developing
instructional materials:
(1) find existing materials that may be adopted or amended
to meet your needs;
(2) Use tools to create new instructional materials that help
plan and carry out the development process;
(3) implement preproduction activities before materials are
created;
(4) schedule the crafting of the story board; and
(5) when developing content, provide contextualizing
elements (collaboration, role play, case studies).
18.
Course Progress
Lesson 1
Development
andUse of Non-
Digital or
Conventional
Materials
Lesson 2
Select and Use
ICT Tools for
Teaching and
Learning
Lesson 3
Creating a E-
Portfolio as a
Teaching Tool
Lesson 4
Technology
Collaborative
Tools in the
Digital World
Lesson 5
Digital Literacy
Skills in the 21st
Century
19.
1. What digitalgadgets you found in
your room, bag or packets?
2. How the gadgets help you in
learning?
3. Can Facebook be a tool in learning?
How?
20.
Lesson 2
Select andUse ICT Tools for
Teaching and Learning
Lesson Outcomes
At the end of the lesson, you should be able to:
Selected and used an appropriate digital
tool in teaching
Provided alternative ways in incorporating
the digital tool in a lesson
21.
"Technology will never
replacegreat teachers,
but technology in the
hands of great teachers
is transformational."
-George Couros
Click icon toadd picture
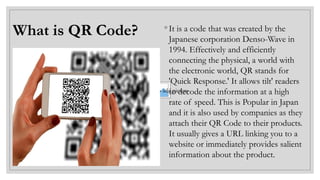
What is QR Code? ◦ It is a code that was created by the
Japanese corporation Denso-Wave in
1994. Effectively and efficiently
connecting the physical, a world with
the electronic world, QR stands for
'Quick Response.' It allows tilt' readers
to decode the information at a high
rate of speed. This is Popular in Japan
and it is also used by companies as they
attach their QR Code to their products.
It usually gives a URL linking you to a
website or immediately provides salient
information about the product.
24.
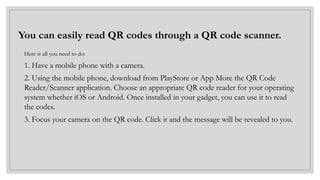
You can easilyread QR codes through a QR code scanner.
Here is all you need to do:
1. Have a mobile phone with a camera.
2. Using the mobile phone, download from PlayStore or App More the QR Code
Reader/Scanner application. Choose an appropriate QR code reader for your operating
system whether iOS or Android. Once installed in your gadget, you can use it to read
the codes.
3. Focus your camera on the QR code. Click it and the message will be revealed to you.
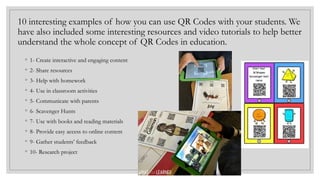
10 interesting examplesof how you can use QR Codes with your students. We
have also included some interesting resources and video tutorials to help better
understand the whole concept of QR Codes in education.
◦ 1- Create interactive and engaging content
◦ 2- Share resources
◦ 3- Help with homework
◦ 4- Use in classroom activities
◦ 5- Communicate with parents
◦ 6- Scavenger Hunts
◦ 7- Use with books and reading materials
◦ 8- Provide easy access to online content
◦ 9- Gather students’ feedback
◦ 10- Research project
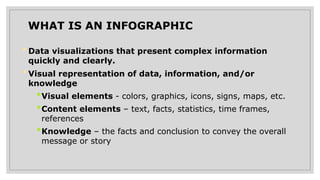
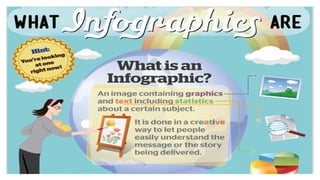
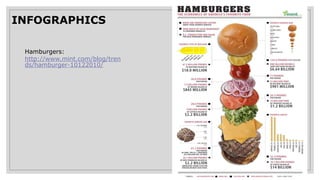
WHAT IS ANINFOGRAPHIC
•Data visualizations that present complex information
quickly and clearly.
•Visual representation of data, information, and/or
knowledge
•Visual elements - colors, graphics, icons, signs, maps, etc.
•Content elements – text, facts, statistics, time frames,
references
•Knowledge – the facts and conclusion to convey the overall
message or story
31.
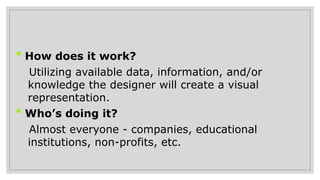
• How doesit work?
•Utilizing available data, information, and/or
knowledge the designer will create a visual
representation.
• Who’s doing it?
•Almost everyone - companies, educational
institutions, non-profits, etc.
32.
• Why isit significant?
•Conveys visual representation of relevant data
•Engages audience
• What are the downsides?
•Data can be skewed and/or have a margin of error
which would make the data irrelevant. Data is
constantly changing on a daily basis, so the
information presented could be outdated.
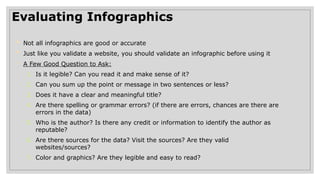
Evaluating Infographics
• Notall infographics are good or accurate
• Just like you validate a website, you should validate an infographic before using it
◦ A Few Good Question to Ask:
1. Is it legible? Can you read it and make sense of it?
2. Can you sum up the point or message in two sentences or less?
3. Does it have a clear and meaningful title?
4. Are there spelling or grammar errors? (if there are errors, chances are there are
errors in the data)
5. Who is the author? Is there any credit or information to identify the author as
reputable?
6. Are there sources for the data? Visit the sources? Are they valid
websites/sources?
7. Color and graphics? Are they legible and easy to read?
36.
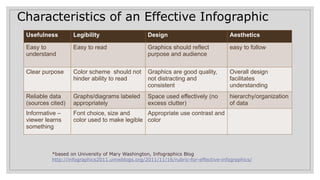
Characteristics of anEffective Infographic
◦ *based on University of Mary Washington, Infographics Blog
http://infographics2011.umwblogs.org/2011/11/16/rubric-for-effective-infographics/
Usefulness Legibility Design Aesthetics
Easy to
understand
Easy to read Graphics should reflect
purpose and audience
easy to follow
Clear purpose Color scheme should not
hinder ability to read
Graphics are good quality,
not distracting and
consistent
Overall design
facilitates
understanding
Reliable data
(sources cited)
Graphs/diagrams labeled
appropriately
Space used effectively (no
excess clutter)
hierarchy/organization
of data
Informative –
viewer learns
something
Font choice, size and
color used to make legible
Appropriate use contrast and
color
37.
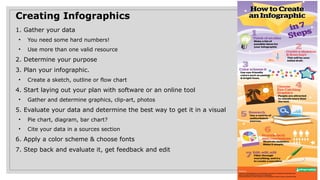
Creating Infographics
1. Gatheryour data
• You need some hard numbers!
• Use more than one valid resource
2. Determine your purpose
3. Plan your infographic.
• Create a sketch, outline or flow chart
4. Start laying out your plan with software or an online tool
• Gather and determine graphics, clip-art, photos
5. Evaluate your data and determine the best way to get it in a visual
• Pie chart, diagram, bar chart?
• Cite your data in a sources section
6. Apply a color scheme & choose fonts
7. Step back and evaluate it, get feedback and edit
38.
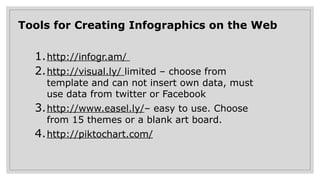
Tools for CreatingInfographics on the Web
1.http://infogr.am/
2.http://visual.ly/ limited – choose from
template and can not insert own data, must
use data from twitter or Facebook
3.http://www.easel.ly/– easy to use. Choose
from 15 themes or a blank art board.
4.http://piktochart.com/
39.
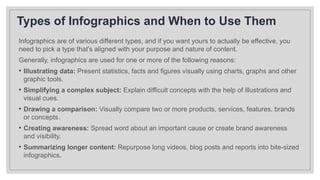
Types of Infographicsand When to Use Them
Infographics are of various different types, and if you want yours to actually be effective, you
need to pick a type that’s aligned with your purpose and nature of content.
Generally, infographics are used for one or more of the following reasons:
• Illustrating data: Present statistics, facts and figures visually using charts, graphs and other
graphic tools.
• Simplifying a complex subject: Explain difficult concepts with the help of illustrations and
visual cues.
• Drawing a comparison: Visually compare two or more products, services, features, brands
or concepts.
• Creating awareness: Spread word about an important cause or create brand awareness
and visibility.
• Summarizing longer content: Repurpose long videos, blog posts and reports into bite-sized
infographics.
40.
Once you’re sureabout what you need an infographic for, you can move on to
selecting the right type of infographic for your needs.
◦ Statistical infographics
◦ Informational infographics
◦ Process infographics
◦ Timeline infographics
◦ Anatomical infographics
◦ Hierarchical infographics
◦ List infographics
◦ Comparison infographics
◦ Location-based infographics
◦ Visual resume infographics
41.
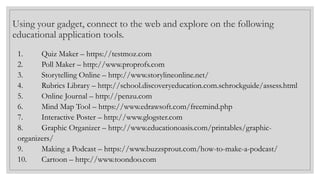
Using your gadget,connect to the web and explore on the following
educational application tools.
1. Quiz Maker – https://testmoz.com
2. Poll Maker – http://www.proprofs.com
3. Storytelling Online – http://www.storylineonline.net/
4. Rubrics Library – http://school.discoveryeducation.com.schrockguide/assess.html
5. Online Journal – http://penzu.com
6. Mind Map Tool – https://www.edrawsoft.com/freemind.php
7. Interactive Poster – http://www.glogster.com
8. Graphic Organizer – http://www.educationoasis.com/printables/graphic-
organizers/
9. Making a Podcast – https://www.buzzsprout.com/how-to-make-a-podcast/
10. Cartoon – http://www.toondoo.com
42.
Course Progress
Lesson 1
•Devel
opmen
t and
Use of
Non-
Digital
or
Conve
Lesson 2
• Select and
Use ICT
Tools for
Teaching
and
Learning
Lesson 3
• Creating a
E-
Portfolio
as a
Teaching
Tool
Lesson 4
• Technolog
y
Collaborat
ive Tools
in the
Digital
World
Lesson 5
• Digital
Literacy
Skills in
the 21st
Century
Learning Outcomes
◦At theend of the lesson, you should be able to:
• Explore the use of a platform such as google
site
• Construct an e-Portfolio to document learning
45.
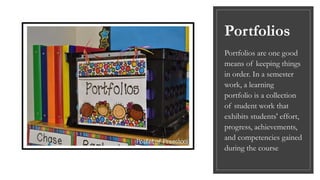
Portfolios
Portfolios are onegood
means of keeping things
in order. In a semester
work, a learning
portfolio is a collection
of student work that
exhibits students' effort,
progress, achievements,
and competencies gained
during the course
46.
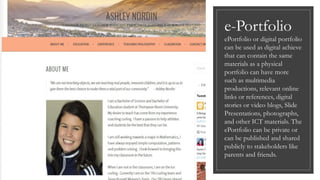
e-Portfolio
ePortfolio or digitalportfolio
can be used as digital achieve
that can contain the same
materials as a physical
portfolio can have more
such as multimedia
productions, relevant online
links or references, digital
stories or video blogs, Slide
Presentations, photographs,
and other ICT materials. The
ePortfolio can be private or
can be published and shared
publicly to stakeholders like
parents and friends.
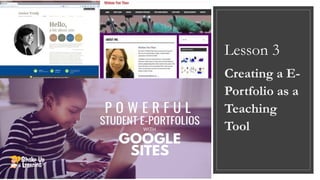
47.
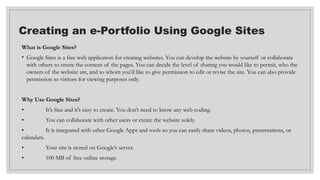
Creating an e-PortfolioUsing Google Sites
What is Google Sites?
• Google Sites is a free web application for creating websites. You can develop the website by yourself or collaborate
with others to create the content of the pages. You can decide the level of sharing you would like to permit, who the
owners of the website are, and to whom you’d like to give permission to edit or revise the site. You can also provide
permission to visitors for viewing purposes only.
Why Use Google Sites?
• It’s free and it’s easy to create. You don’t need to know any web coding.
• You can collaborate with other users or create the website solely.
• It is integrated with other Google Apps and tools so you can easily share videos, photos, presentations, or
calendars.
• Your site is stored on Google’s server.
• 100 MB of free online storage.
48.
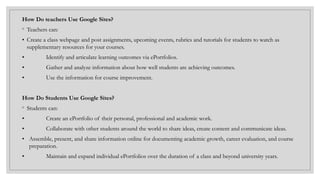
How Do teachersUse Google Sites?
◦ Teachers can:
• Create a class webpage and post assignments, upcoming events, rubrics and tutorials for students to watch as
supplementary resources for your courses.
• Identify and articulate learning outcomes via ePortfolios.
• Gather and analyze information about how well students are achieving outcomes.
• Use the information for course improvement.
How Do Students Use Google Sites?
◦ Students can:
• Create an ePortfolio of their personal, professional and academic work.
• Collaborate with other students around the world to share ideas, create content and communicate ideas.
• Assemble, present, and share information online for documenting academic growth, career evaluation, and course
preparation.
• Maintain and expand individual ePortfolios over the duration of a class and beyond university years.
49.
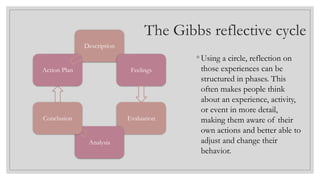
The Gibbs reflectivecycle
◦ Using a circle, reflection on
those experiences can be
structured in phases. This
often makes people think
about an experience, activity,
or event in more detail,
making them aware of their
own actions and better able to
adjust and change their
behavior.
Description
Feelings
Evaluation
Analysis
Conclusion
Action Plan
50.
Administrating the ePortfolio
Beforepublishing your ePortfolio for the world to
see your work, you can control who can see your
work. The icon for sharing the site can be managed
by entering the email address of the person with
whom you want to share it.
51.
Assessing an ePortfoliousing a Rubric
◦ Evaluating an e-Portfolio using a rubric, is a consistent application of learning
expectations, learning outcomes or standards. It should tell the students the link
between learning or what will be taught and the assessment or what will be
evaluated. Rubrics are simple and easy to understand. The items in the rubric
should be mutually exclusive.
◦ Students can see connections between learning (what will be taught) and
assessment (what will be evaluated) by making the feedback they receive from
teachers clearer, more detailed, and more useful in terms of identifyin2 and
communicating what students have learned or what they may still need to learn.
52.
Course Progress
Lesson 1
•Devel
opmen
t and
Use of
Non-
Digital
or
Conve
Lesson 2
• Select and
Use ICT
Tools for
Teaching
and
Learning
Lesson 3
• Creating a
E-
Portfolio
as a
Teaching
Tool
Lesson 4
• Technolog
y
Collaborat
ive Tools
in the
Digital
World
Lesson 5
• Digital
Literacy
Skills in
the 21st
Century
"Collaboration is essentialin our classrooms
because it is inherent in the nature of how
work is accomplished in our civic and
workforce lives. Fifty years ago, much work
was accomplished by individuals working
alone, but not today. Much of all significant
work is accomplished in teams, and in many
cases, global teams."
55.
Collaboration is oneof the most essential ingredients to fostering 21st
century skills and deeper learning in the classroom. The Harvard
education specialist Tony Wagner has argued that, because knowledge is
now available on every internet-connected device, the ability to
collaborate has become far more important for students than academic
knowledge.
Did you know that it was a collaborative school computer club that
brought together two minds that would change the future of
technology forever? Those two minds were Bill Gates and Paul Allen,
the founders of Microsoft. Collaboration doesn’t just fuel social and
emotional skills ...it fuels innovation.
Course Progress
Lesson 1
•Devel
opmen
t and
Use of
Non-
Digital
or
Conve
Lesson 2
• Select and
Use ICT
Tools for
Teaching
and
Learning
Lesson 3
• Creating a
E-
Portfolio
as a
Teaching
Tool
Lesson 4
• Technolog
y
Collaborat
ive Tools
in the
Digital
World
Lesson 5
• Digital
Literacy
Skills in
the 21st
Century
#37 Before you get started on your own infographic spend some time looking at other infographics and become familiar with different ways to display data.
If your purpose is data/fact drive – give the facts – avoid putting your opinion or bias into the design. If you want it to be subjective or persuasive – make that obvious in your design. Organize your data and numbers first – choose your sources first – reliable quality sources – hard numbers – avoid subjective or opinion-based data.
The Power of the Three-Color Palette
The use (or misuse) of color can make or break your infographic. With all of the data that goes into an infographic, it’s critical that the reader’s eye easily flows down the page. Therefore, you need to select a palette that doesn’t attack the senses. This article from Smashing Magazine offers a helpful solution: stick to the rule of three, specifically three primary colors. One color (usually the lightest) should be used as the background and the other two should be used to break up the sections. Importantly, do this before you start designing, because it will help you determine how to visualize the various elements. From http://www.desantisbreindel.com/7-must-read-articles-for-developing-killer-infographics/
Kathy’s step by step handout is what some of my suggestions for creating your infogrpahics are based on, be sure to have a look at it
Kathy Schrock’s Guide to Infographics: http://www.schrockguide.net/uploads/3/9/2/2/392267/infographic_steps.jpg
Consider using the inverted pyramid style for your infographic – put the largest most important message the foundation of your infographic at the top and work your way down through the details. The inverted pyramid puts the most newsworthy information at the top, and then the remaining information follows in order of importance, with the least important at the bottom.