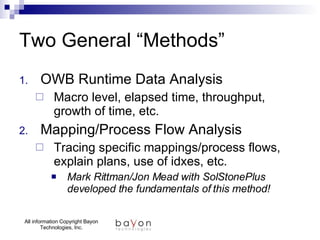
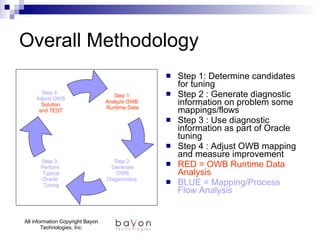
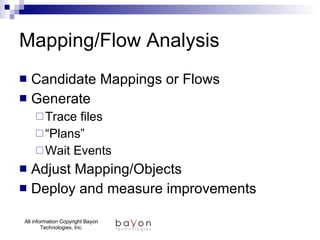
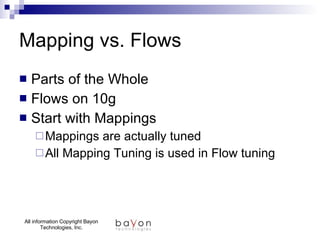
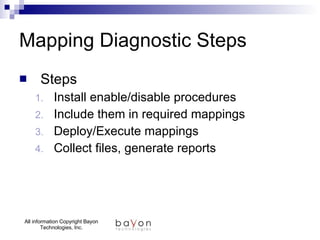
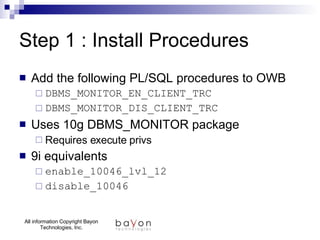
Downloaded 108 times


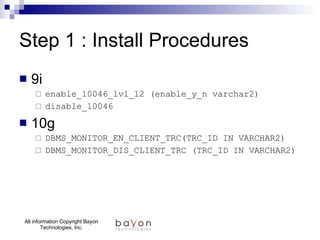
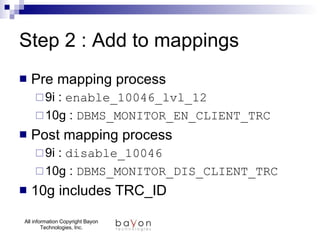
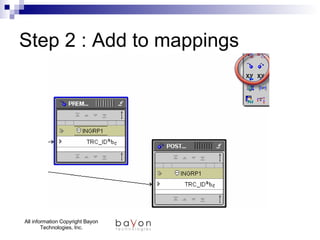
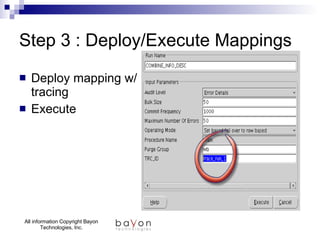
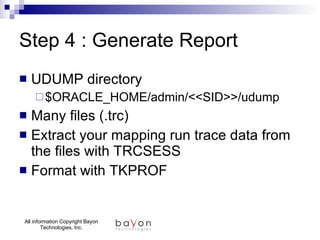
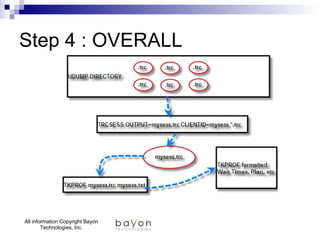
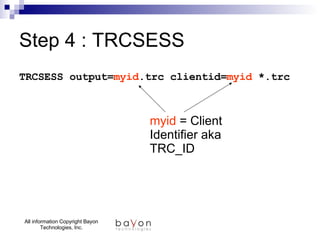
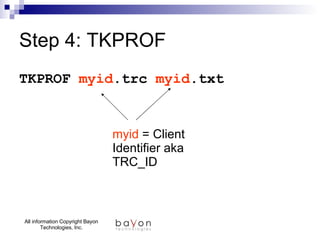

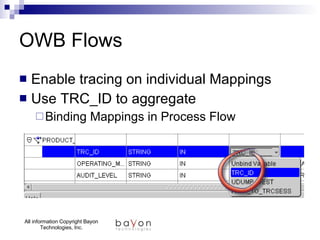
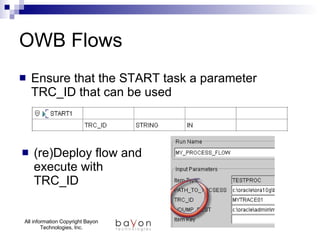
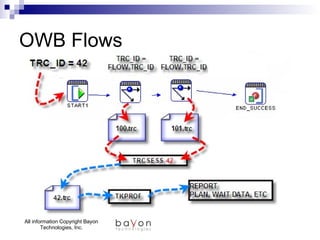


This document discusses methods for tuning Oracle Warehouse Builder (OWB) mappings and flows by leveraging existing Oracle tuning expertise. It describes monitoring OWB runtime data and analyzing specific mapping/process flows to identify tuning candidates. The overall methodology involves determining candidates, generating diagnostic information, performing typical Oracle tuning, adjusting the OWB solution, and testing. Specific steps are outlined for enabling tracing on mappings, collecting trace files, and using tools like TKPROF to analyze the files and identify opportunities for tuning mappings and overall flows.