Free Oracle Performance Tools
Rogerio Bacchi Eguchi
Apresentação Pessoal
• Oracle DBA Sênior com extensa experiência em ambientes OLTP de missão crítica
e que empregam as tecnologias da Oracle Maximum Availability Architecture
• 4 anos como DBA no Oracle Advanced Customer Support Services (2002-2005)
• 10 anos como DBA no UOL/UOLDiveo/PagSeguro (2005-2015)
• 2 anos como DBA/DMA na TOTVS (2016 > ...)
• Oracle 8i-12c Certified Professional. Oracle Exadata Certified Expert.
• RedHat 5 Certified Engineer
• Artigos publicados no OTN Brasil: 9 artigos
• Blogger: http://reguchi.wordpress.com
• Twitter: reguchi_br
Agenda
1. Tuning – A history
2. Tuning – Objectives
3. Tuning – Pareto Principle
4. Real-time analysis
5. Historic Performance analysis
6. SQL tuning
7. SO tools
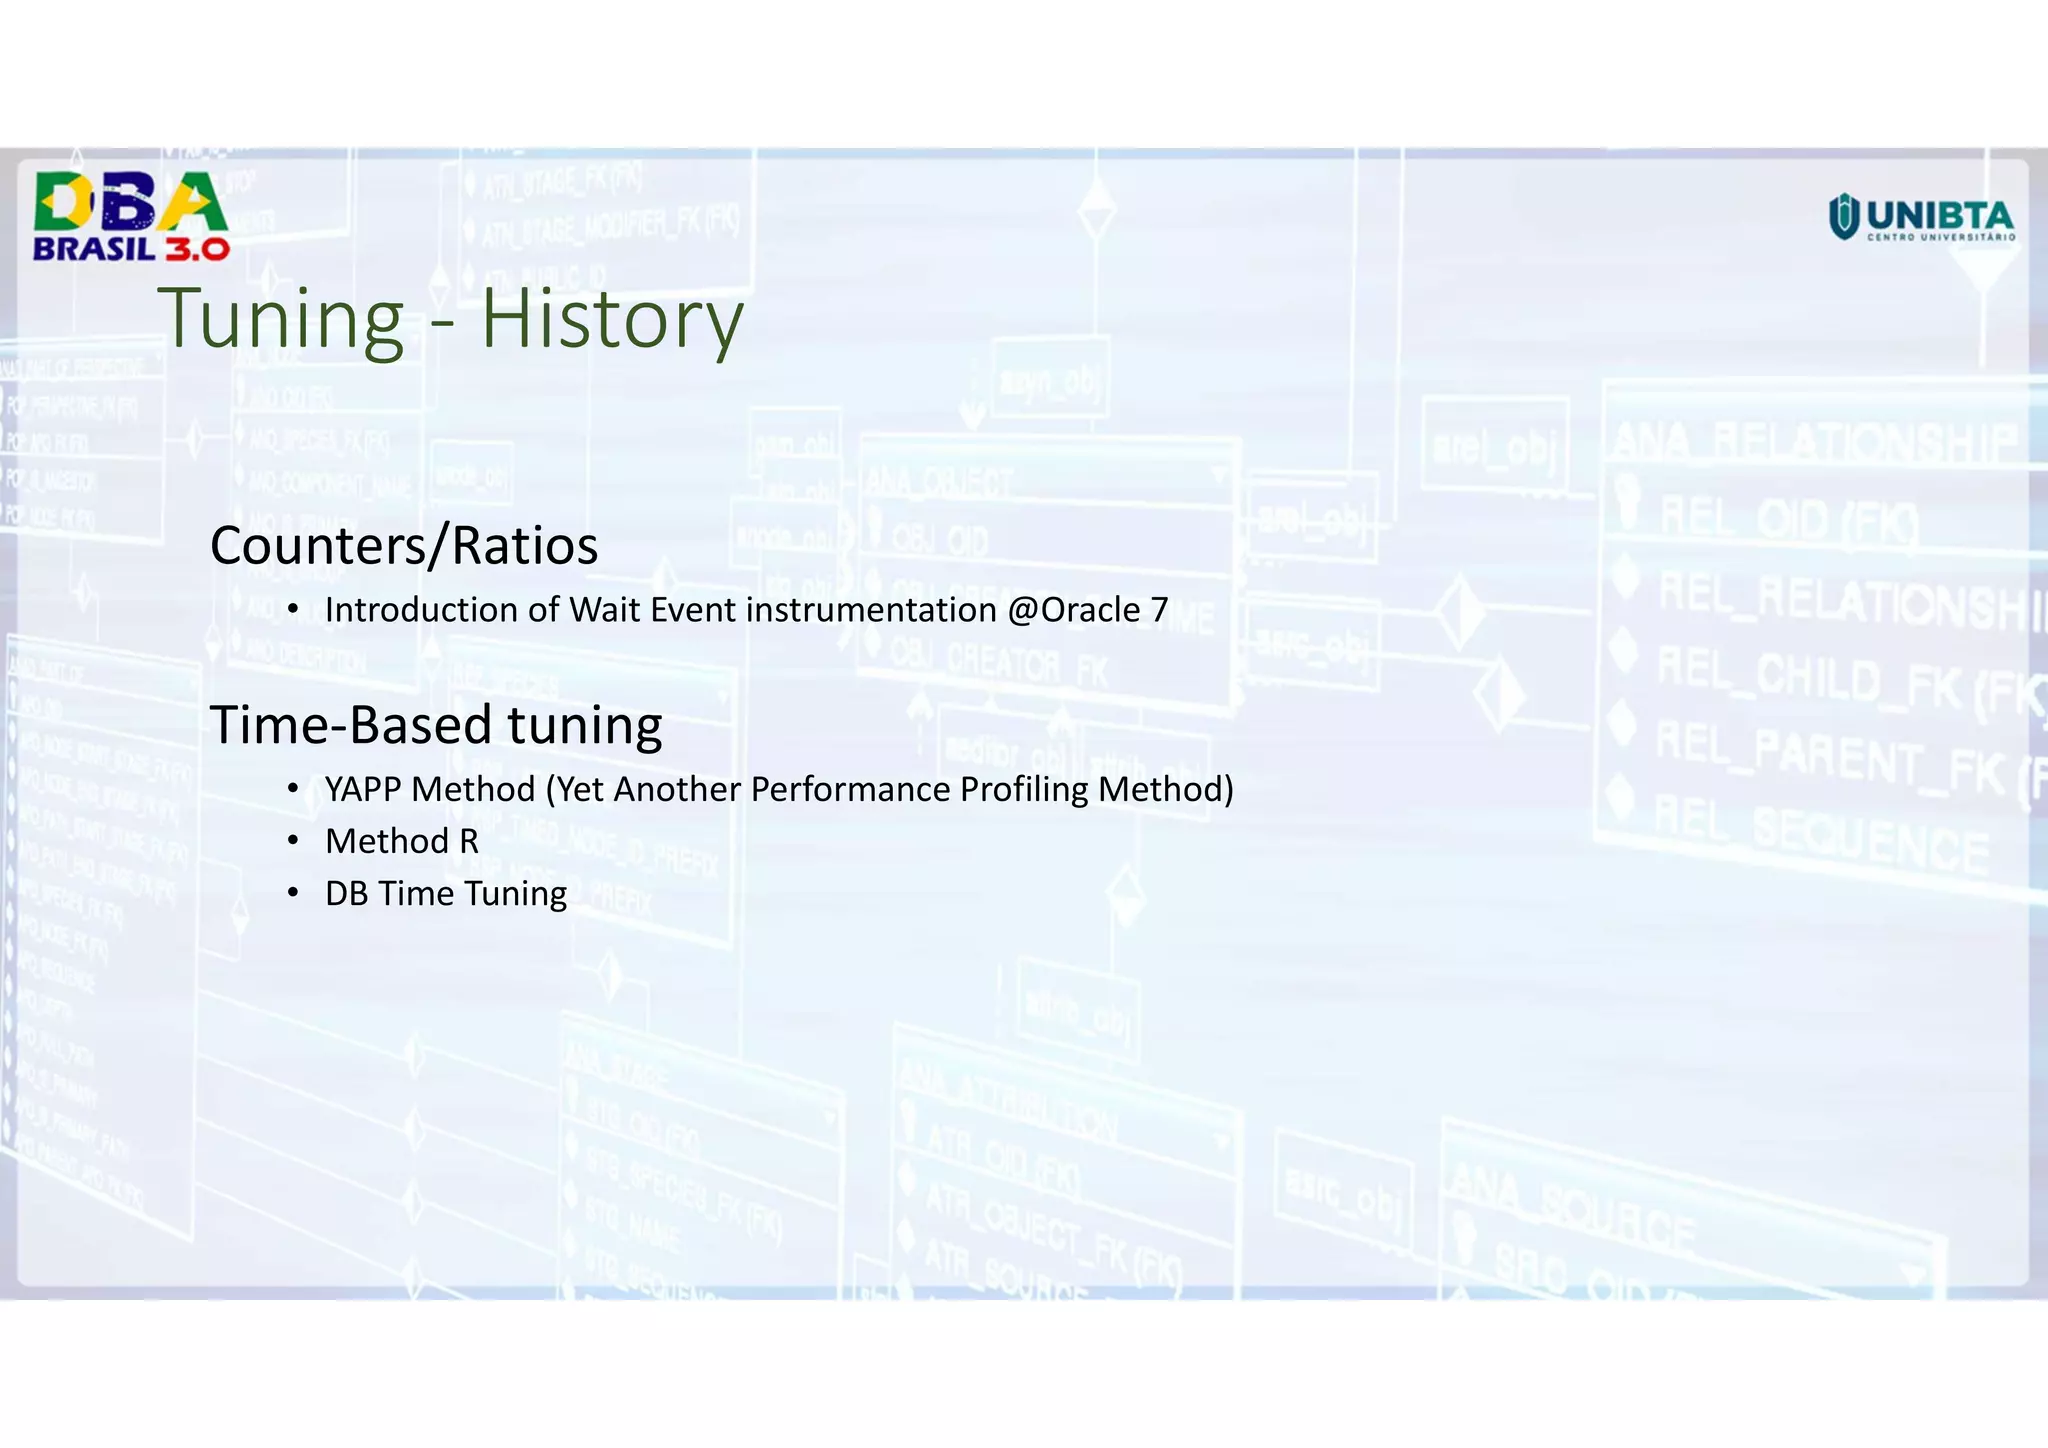
Tuning - History
Counters/Ratios
• Introduction of Wait Event instrumentation @Oracle 7
Time-Based tuning
• YAPP Method (Yet Another Performance Profiling Method)
• Method R
• DB Time Tuning
Tuning - History
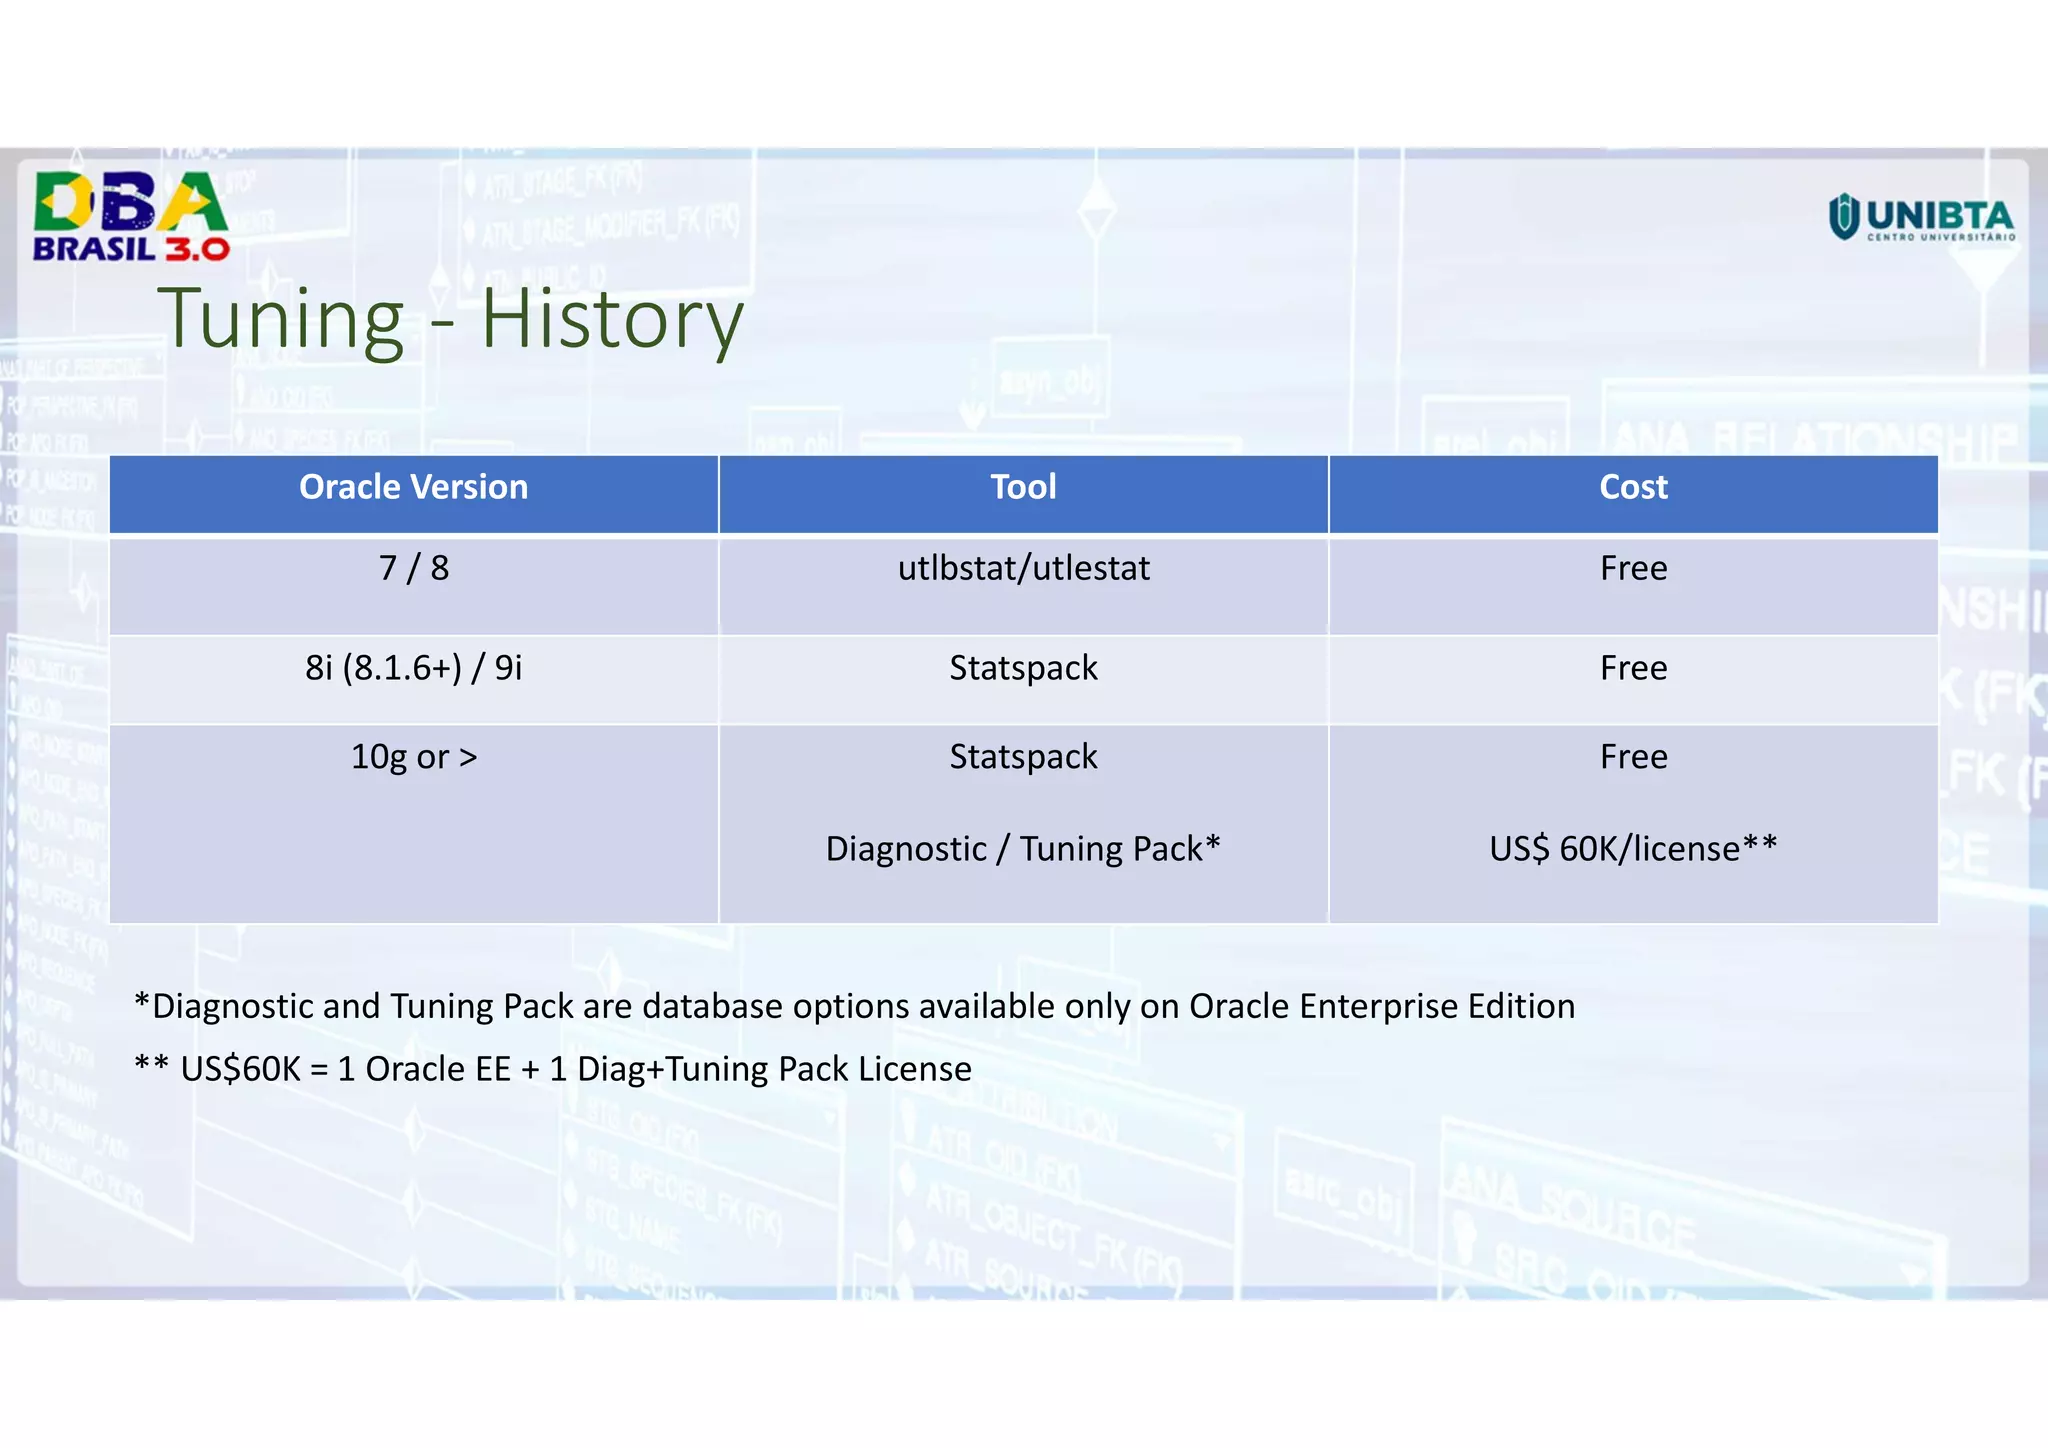
*Diagnostic and Tuning Pack are database options available only on Oracle Enterprise Edition
** US$60K = 1 Oracle EE + 1 Diag+Tuning Pack License
Oracle Version Tool Cost
7 / 8 utlbstat/utlestat Free
8i (8.1.6+) / 9i Statspack Free
10g or > Statspack
Diagnostic / Tuning Pack*
Free
US$ 60K/license**
Tuning - Objectives
1. Define performance and performance problems
2. Check the performance of the Oracle DB
3. Check the overall performance of the server and storage
Tuning - Objectives
Why do I care about time ?
• Human time is critical to the enterprise
• Systems performance affects business goals
• “Time is money”
• Performance improvement means doing things faster
Performance is always and only about time
Tuning - Objectives
Response Time = Work done (service time) + Waiting for work (wait time)
Each server process is typically in one of three states:
• Idle: Waiting for something to do (sleeping)
• Running code: Using the CPU or in a run queue
• Waiting: blocked
• For some resource to become available
• For a requested activity to complete
If service time and/or wait time is high, it will directly impact the total
response time
Tuning - Objectives
1. Reactive tuning
• Firefighter
2. Proactive tuning
• Plan, Do, Check, Act
Pareto Principle (80/20 rule)
“The minority of causes, inputs, or efforts usually produces a majority
of the results”
Top Foreground Events by Total Wait Time
SQL ordered by CPU Time
SQL ordered by User I/O Wait
SQL ordered by buffer gets
SQL ordered by physical reads
SQL ordered by Executions
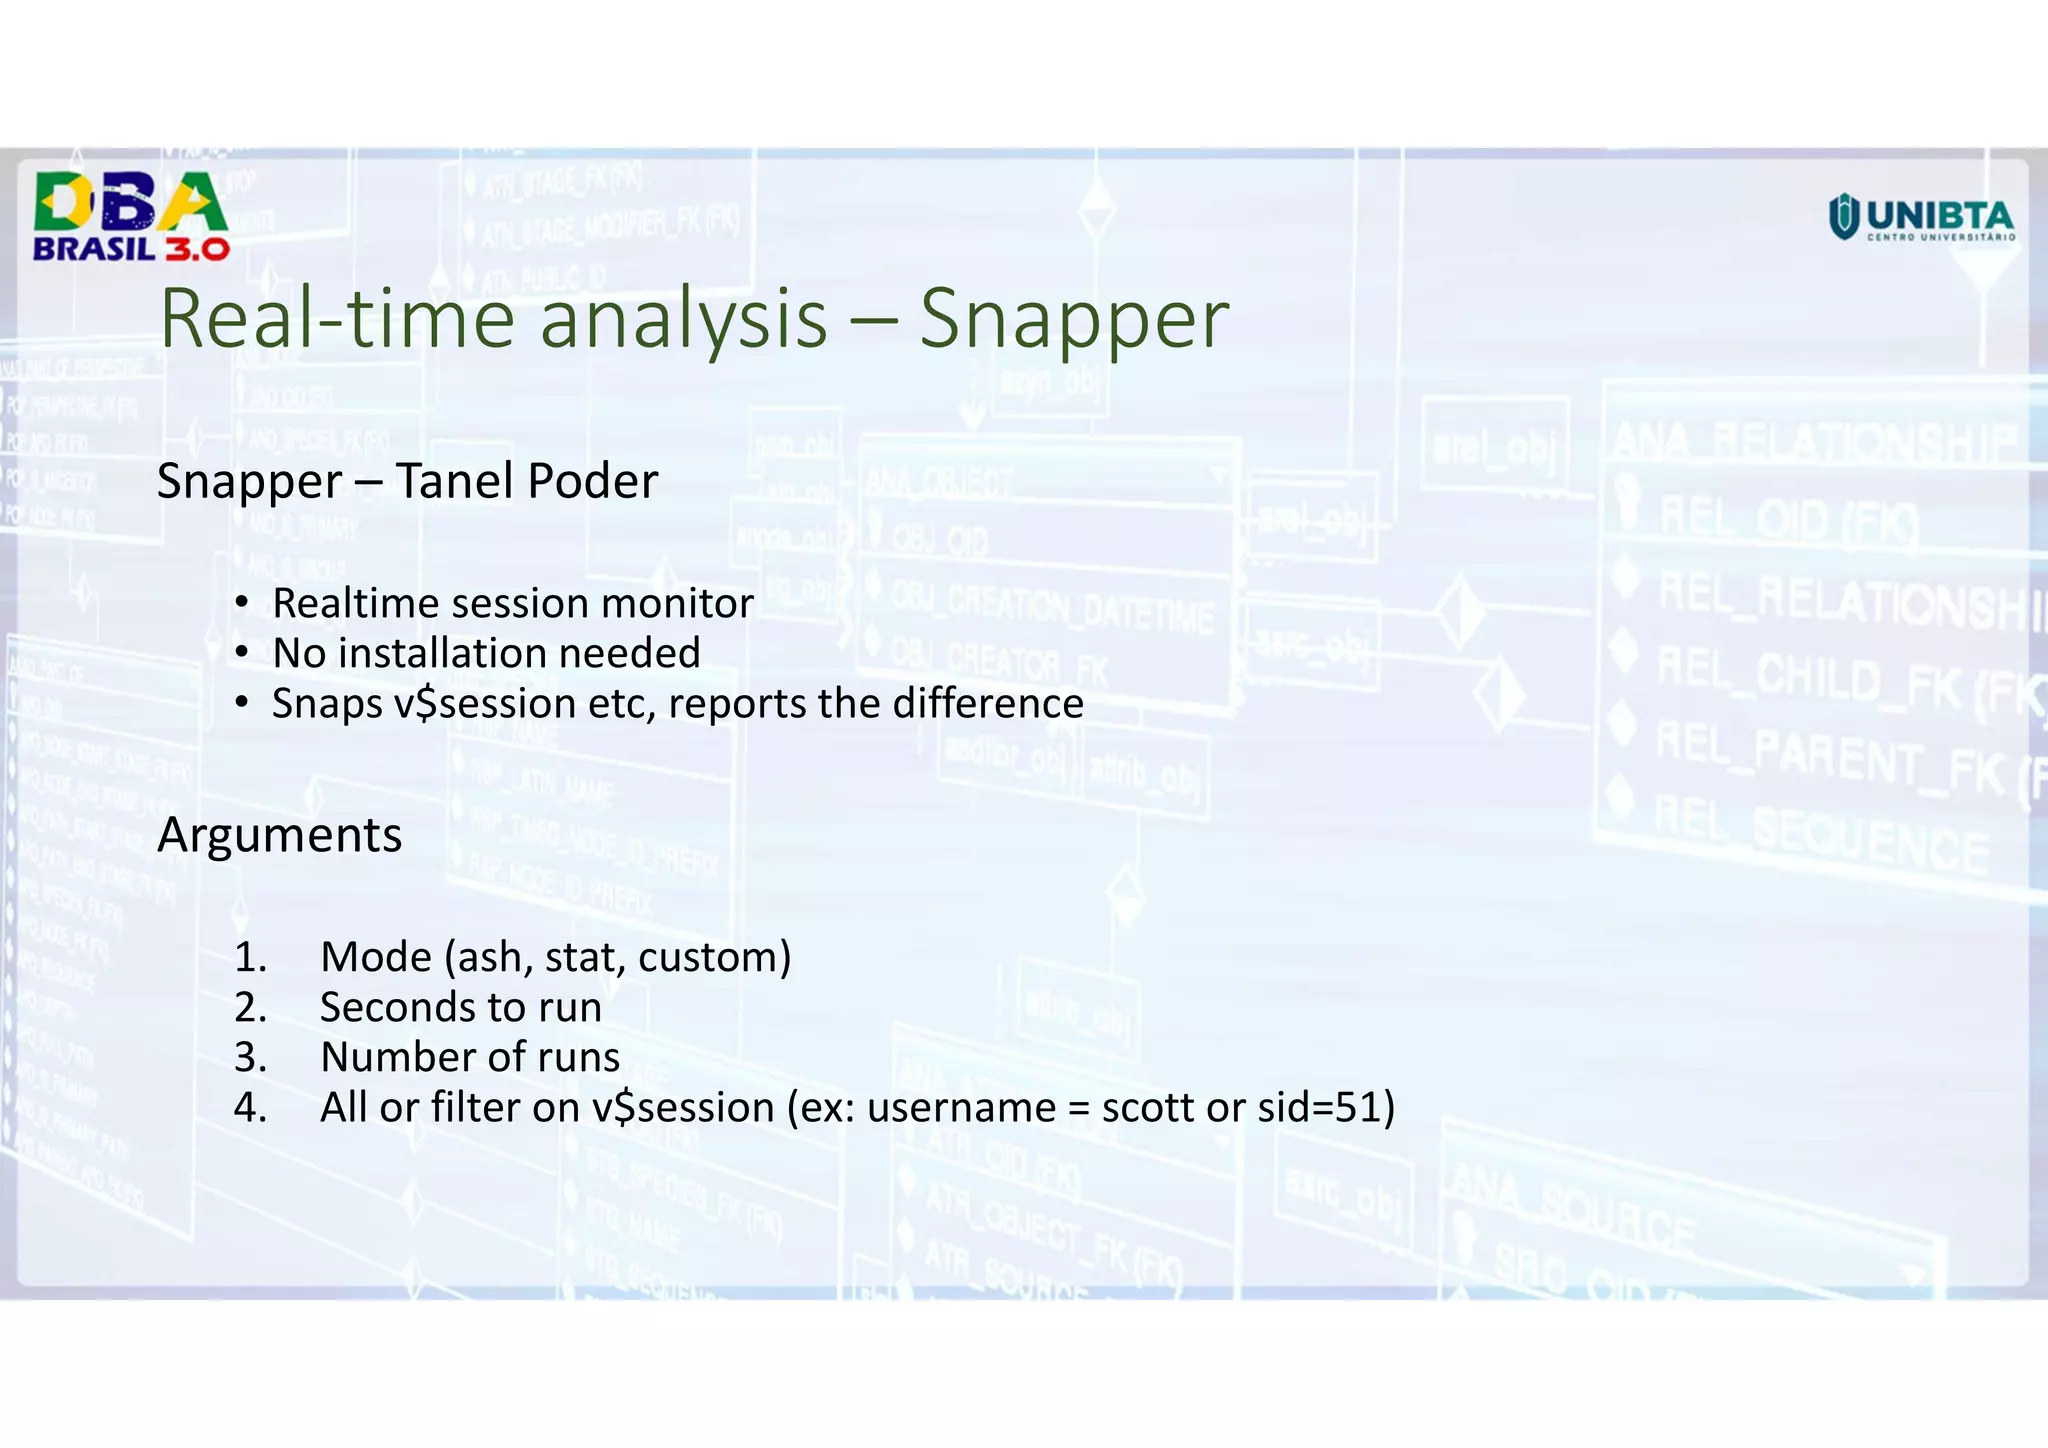
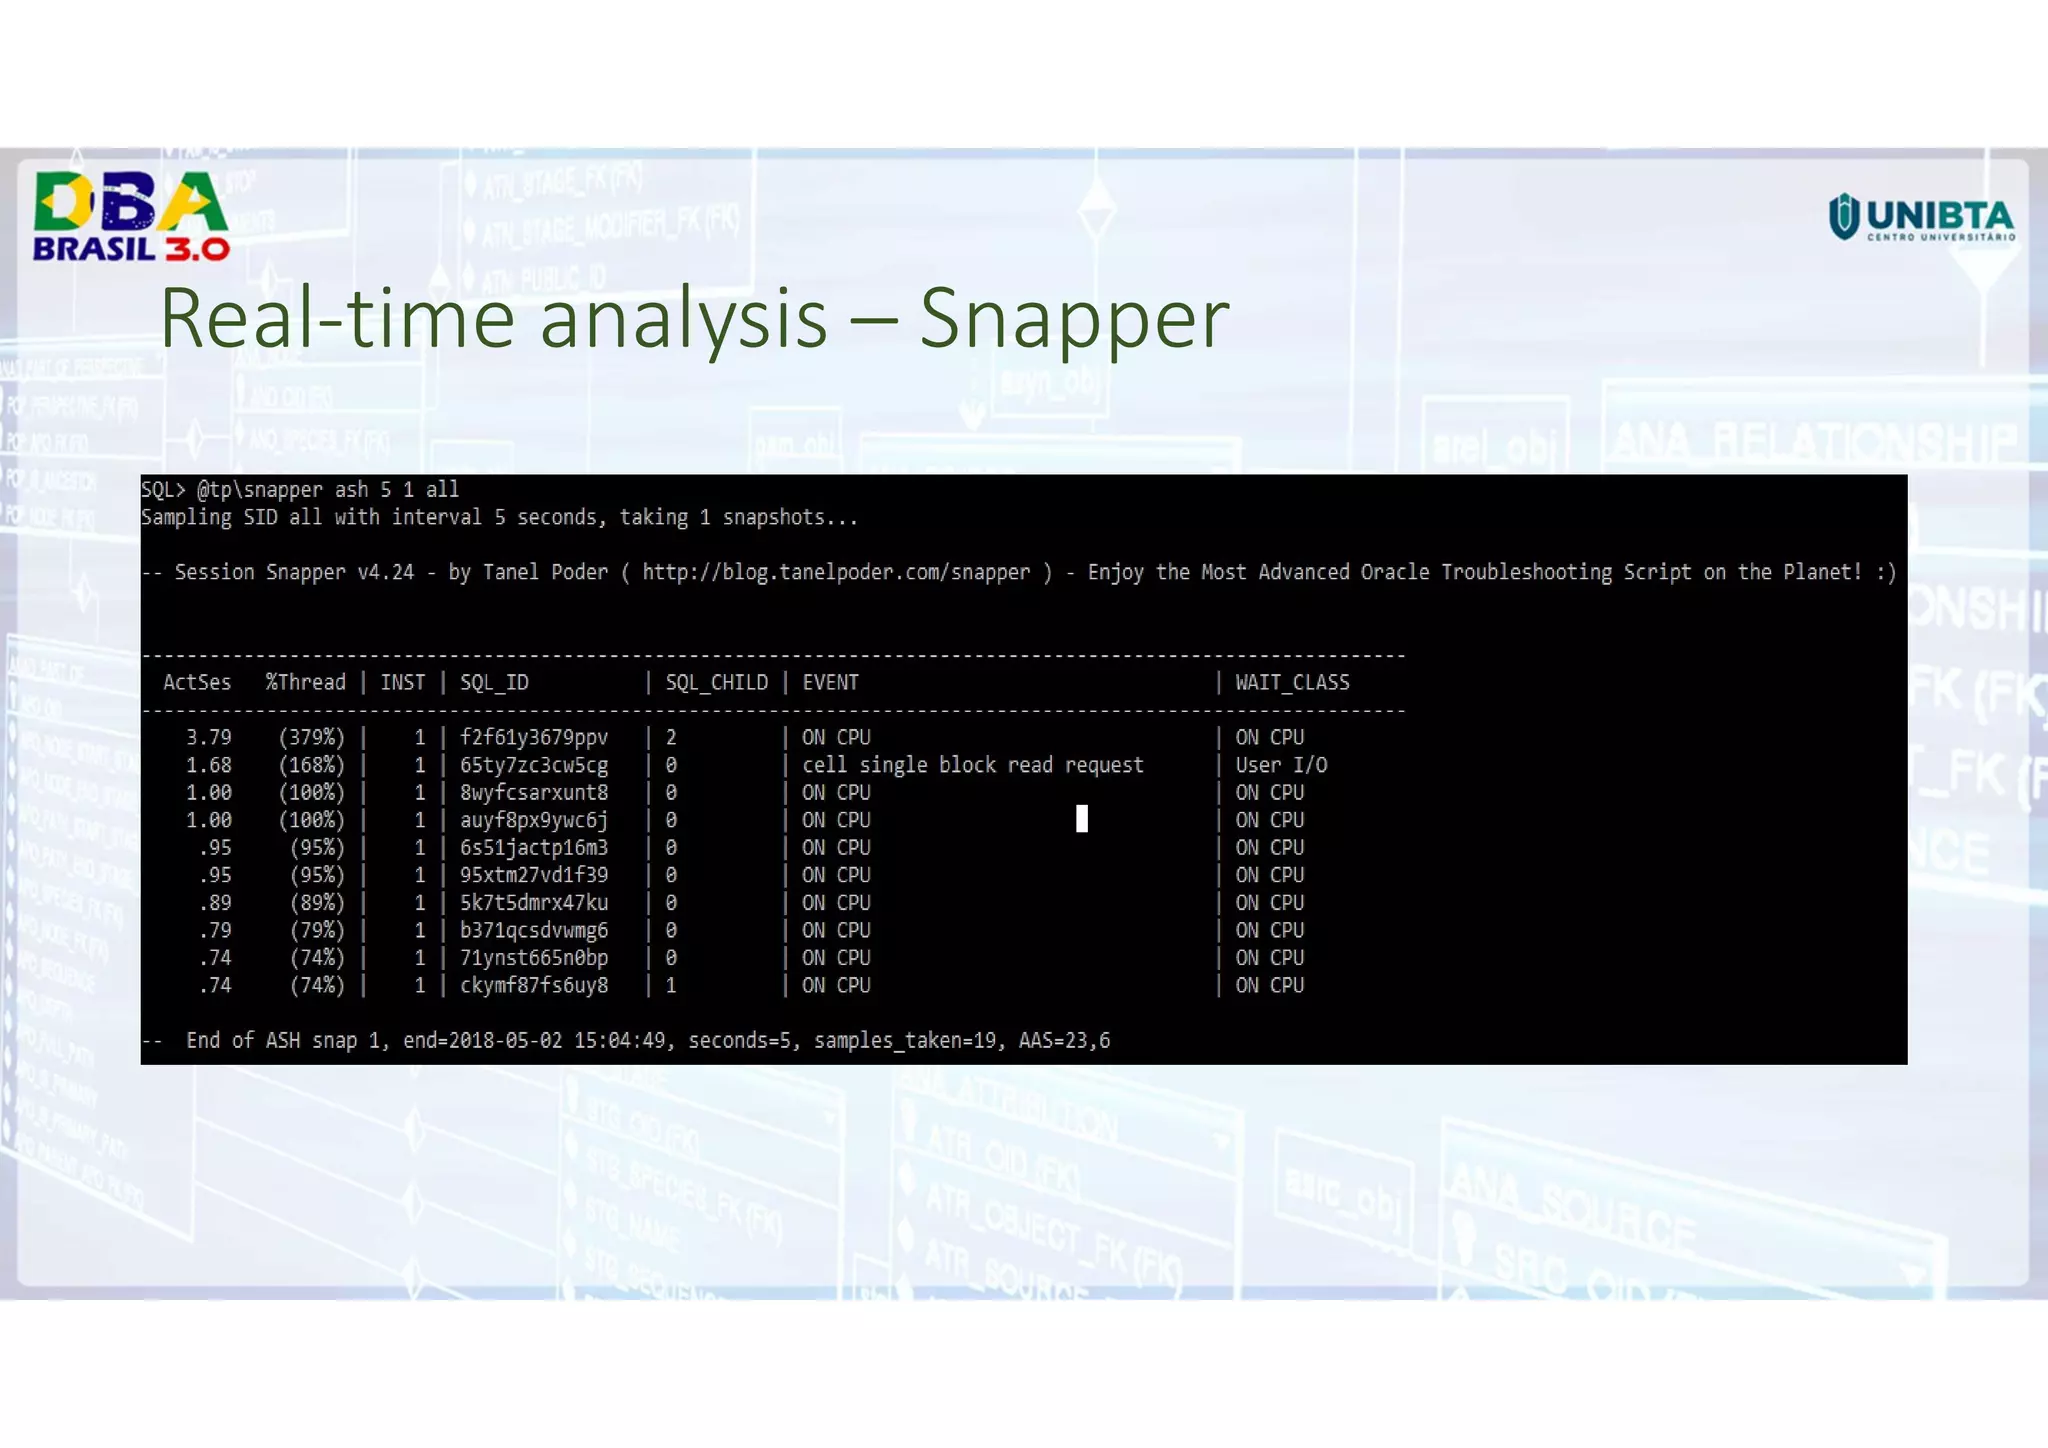
Real-time analysis – Snapper
Snapper – Tanel Poder
• Realtime session monitor
• No installation needed
• Snaps v$session etc, reports the difference
Arguments
1. Mode (ash, stat, custom)
2. Seconds to run
3. Number of runs
4. All or filter on v$session (ex: username = scott or sid=51)
Real-time analysis – Snapper
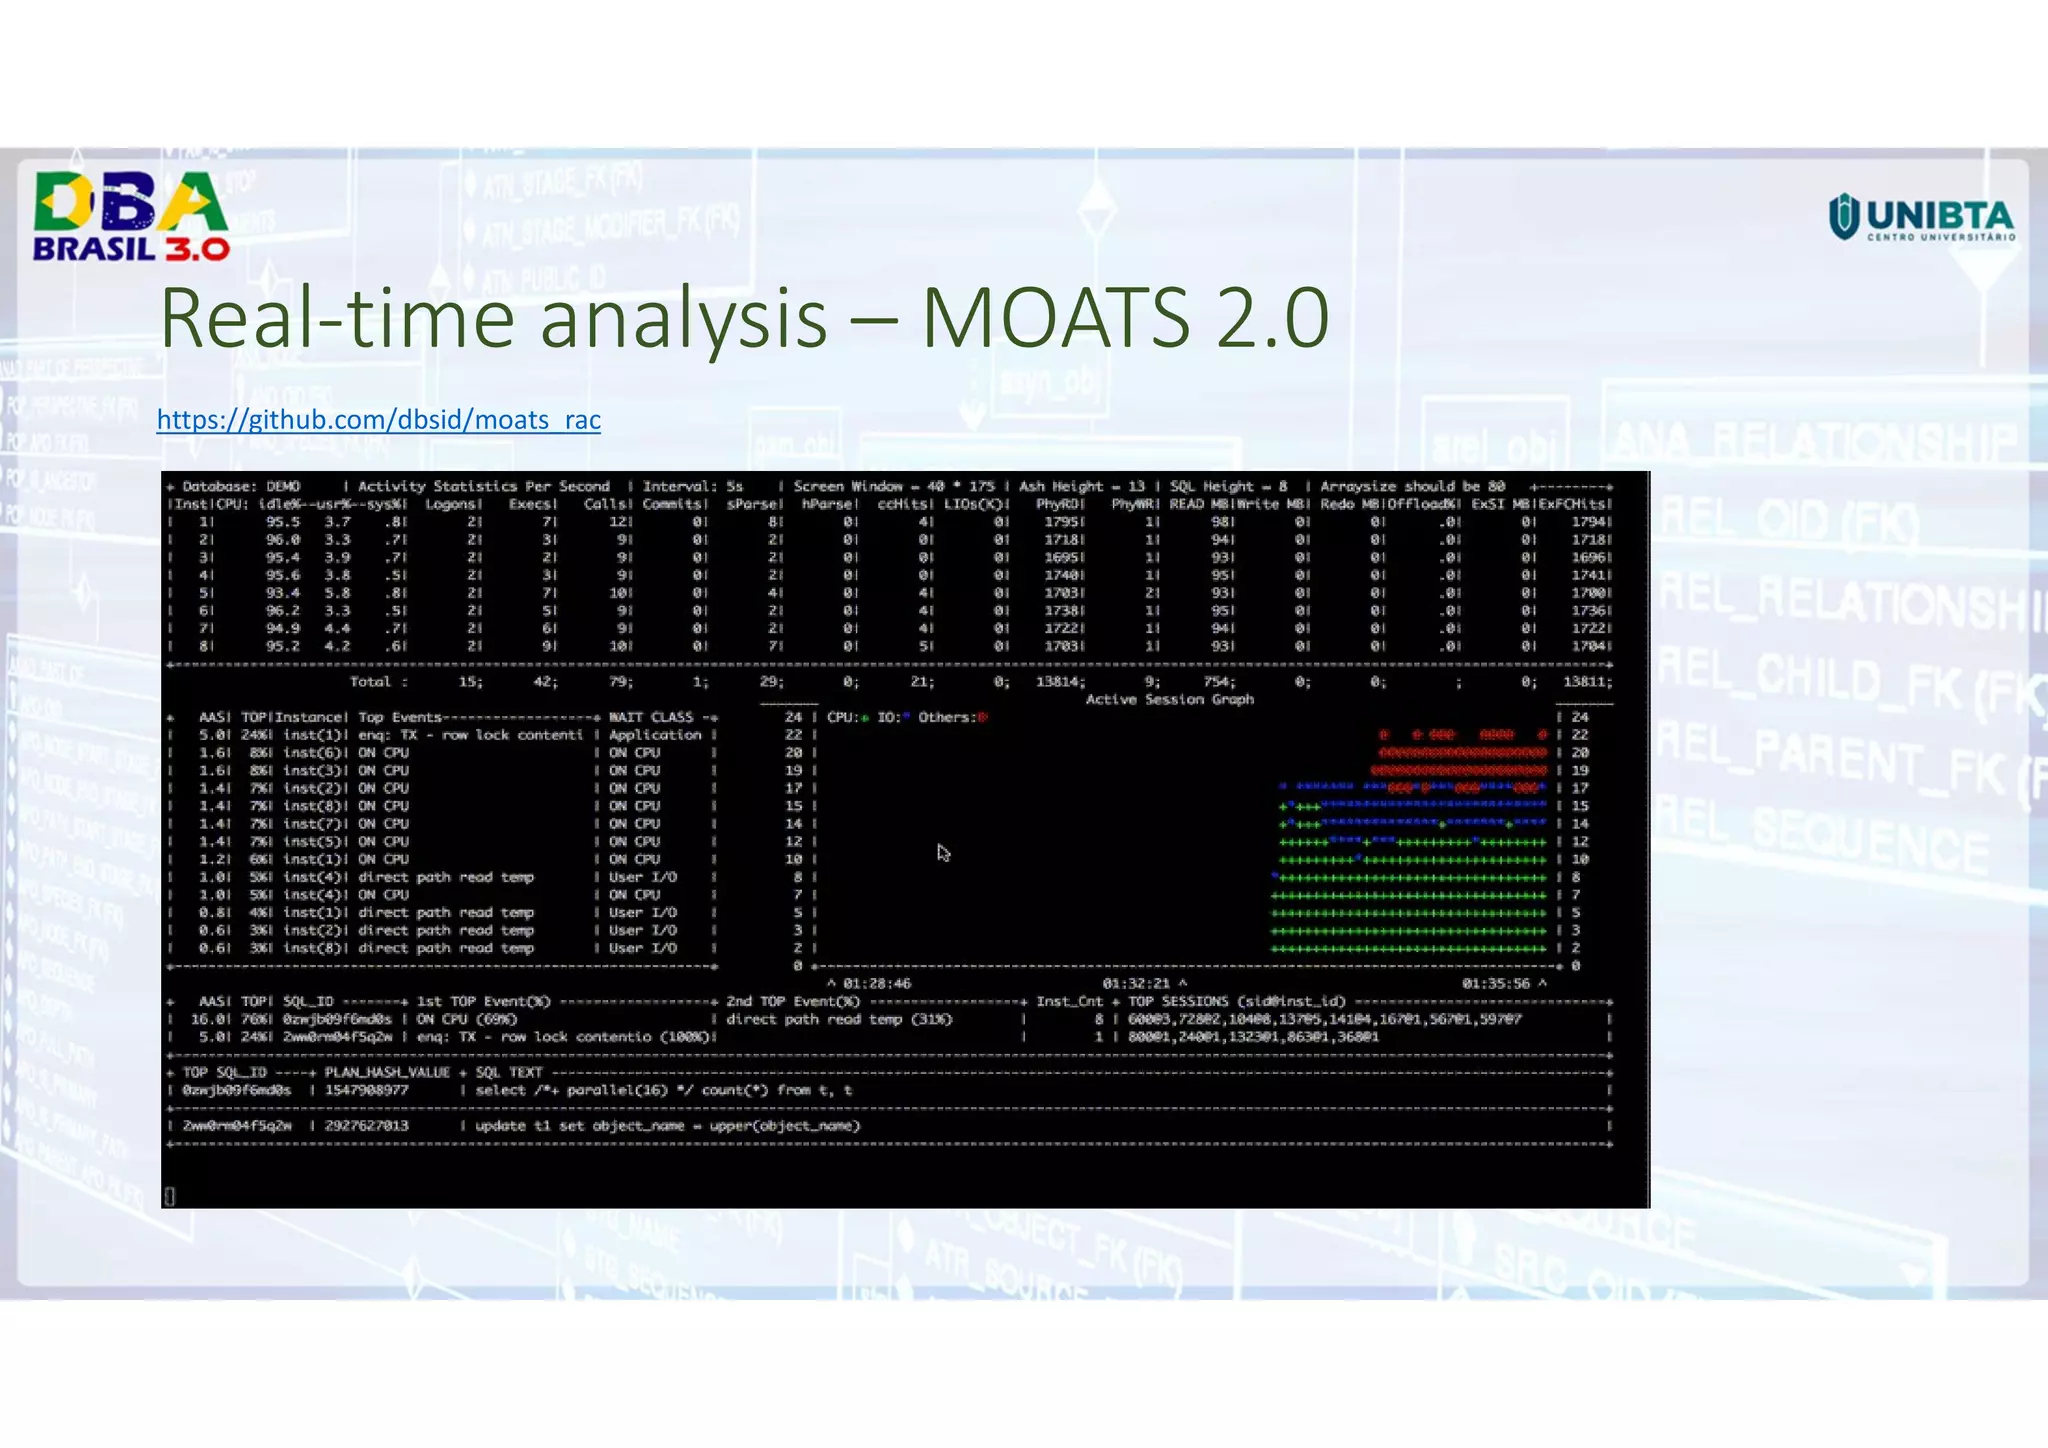
Real-time analysis – MOATS 2.0
https://github.com/dbsid/moats_rac
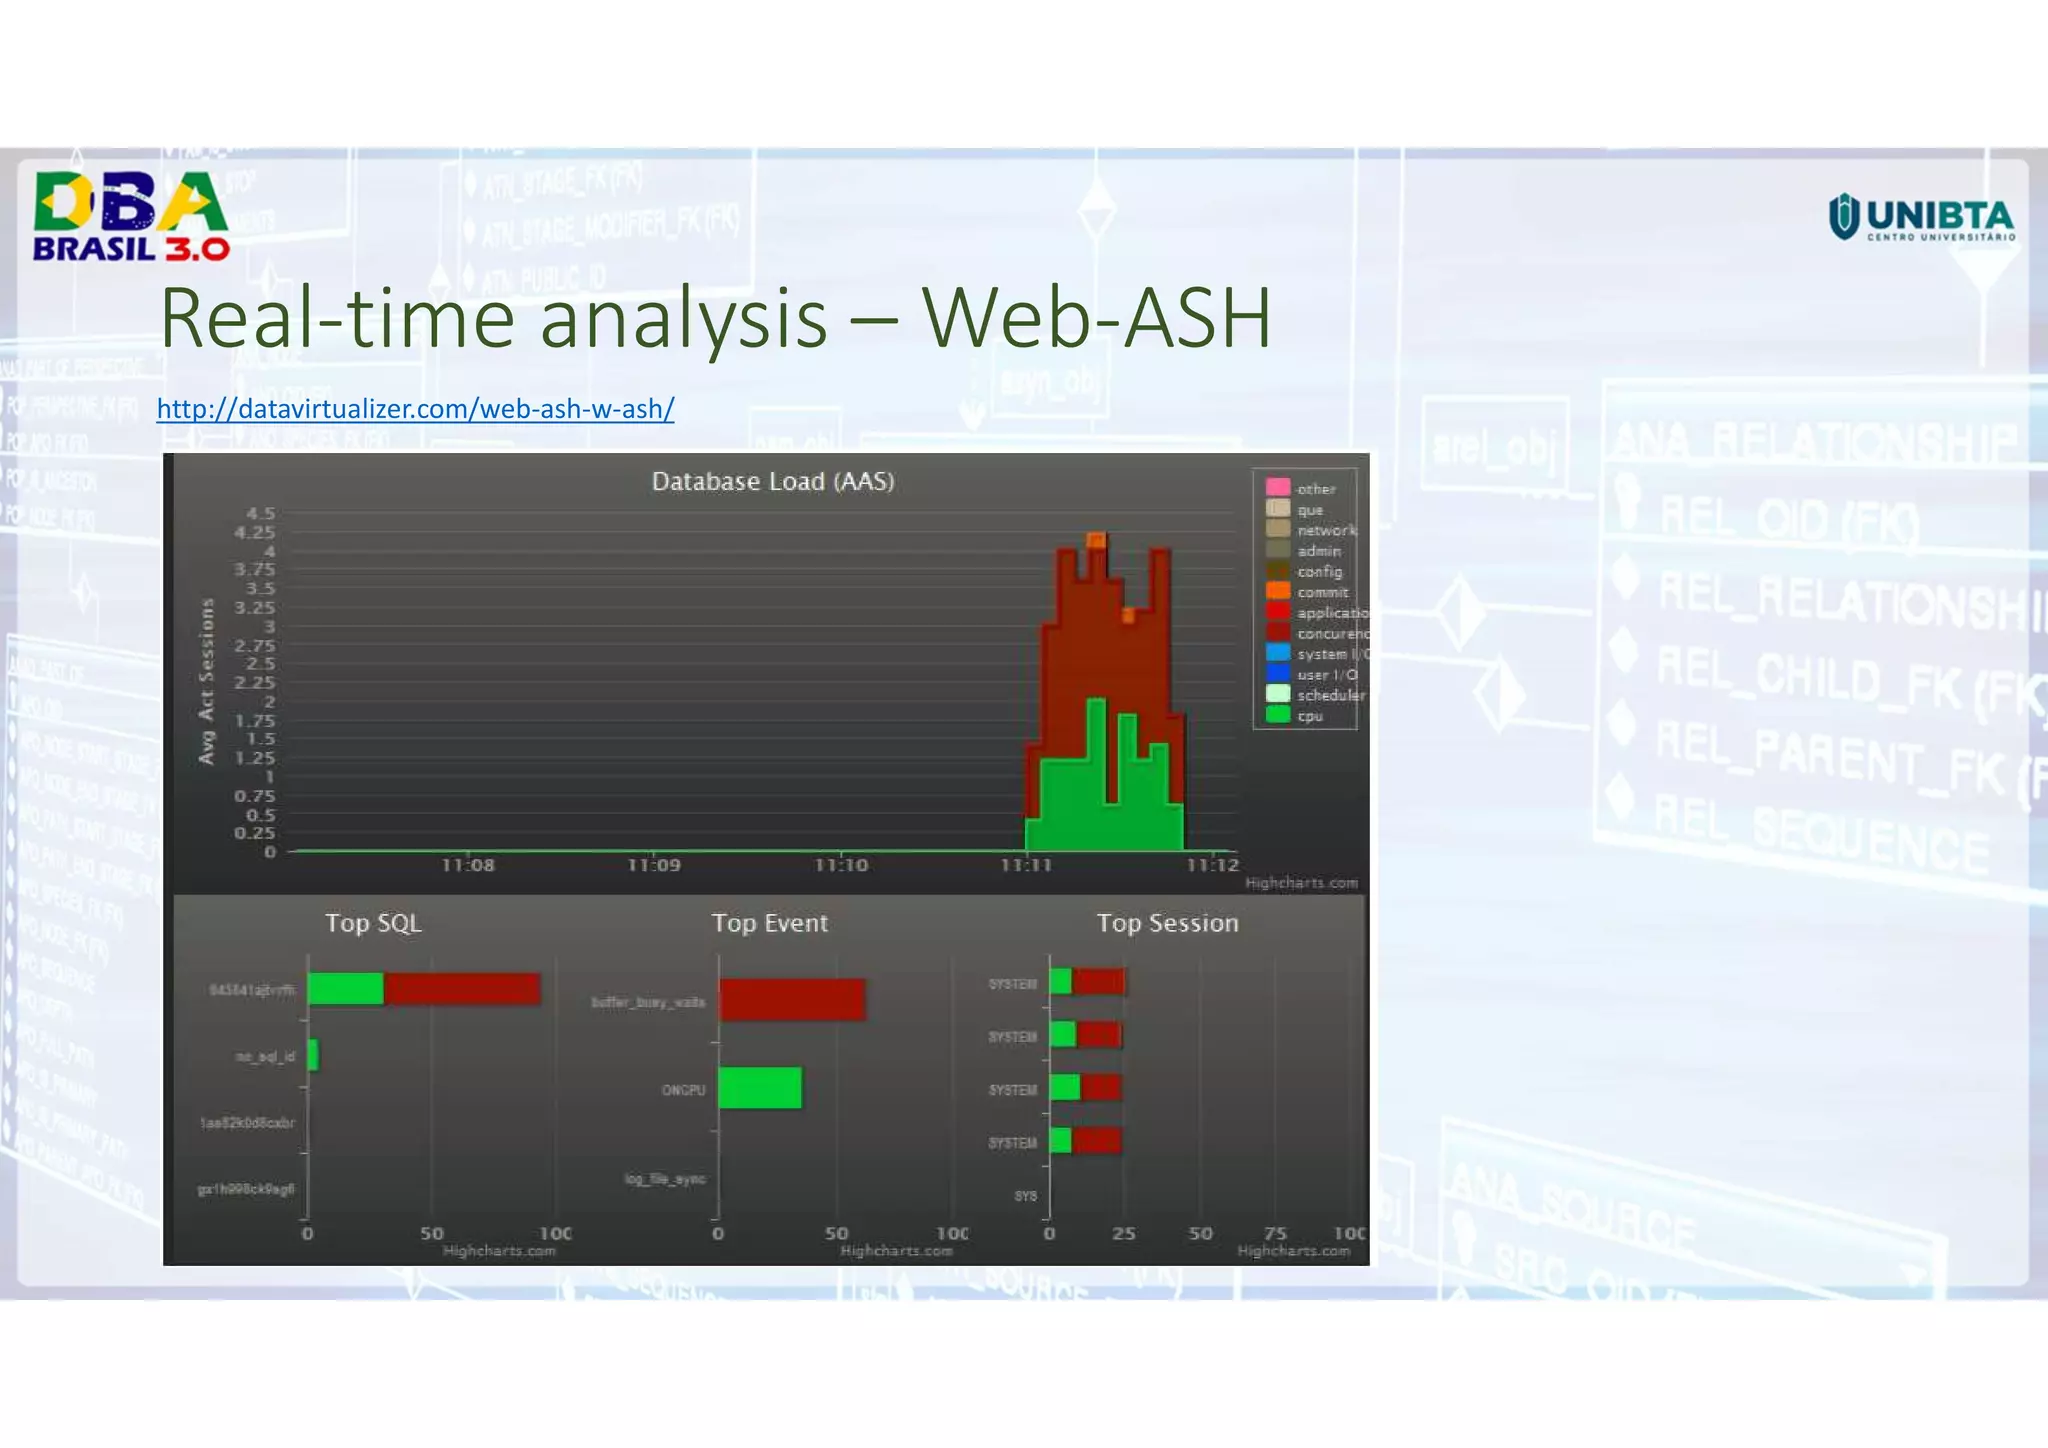
Real-time analysis – Web-ASH
http://datavirtualizer.com/web-ash-w-ash/
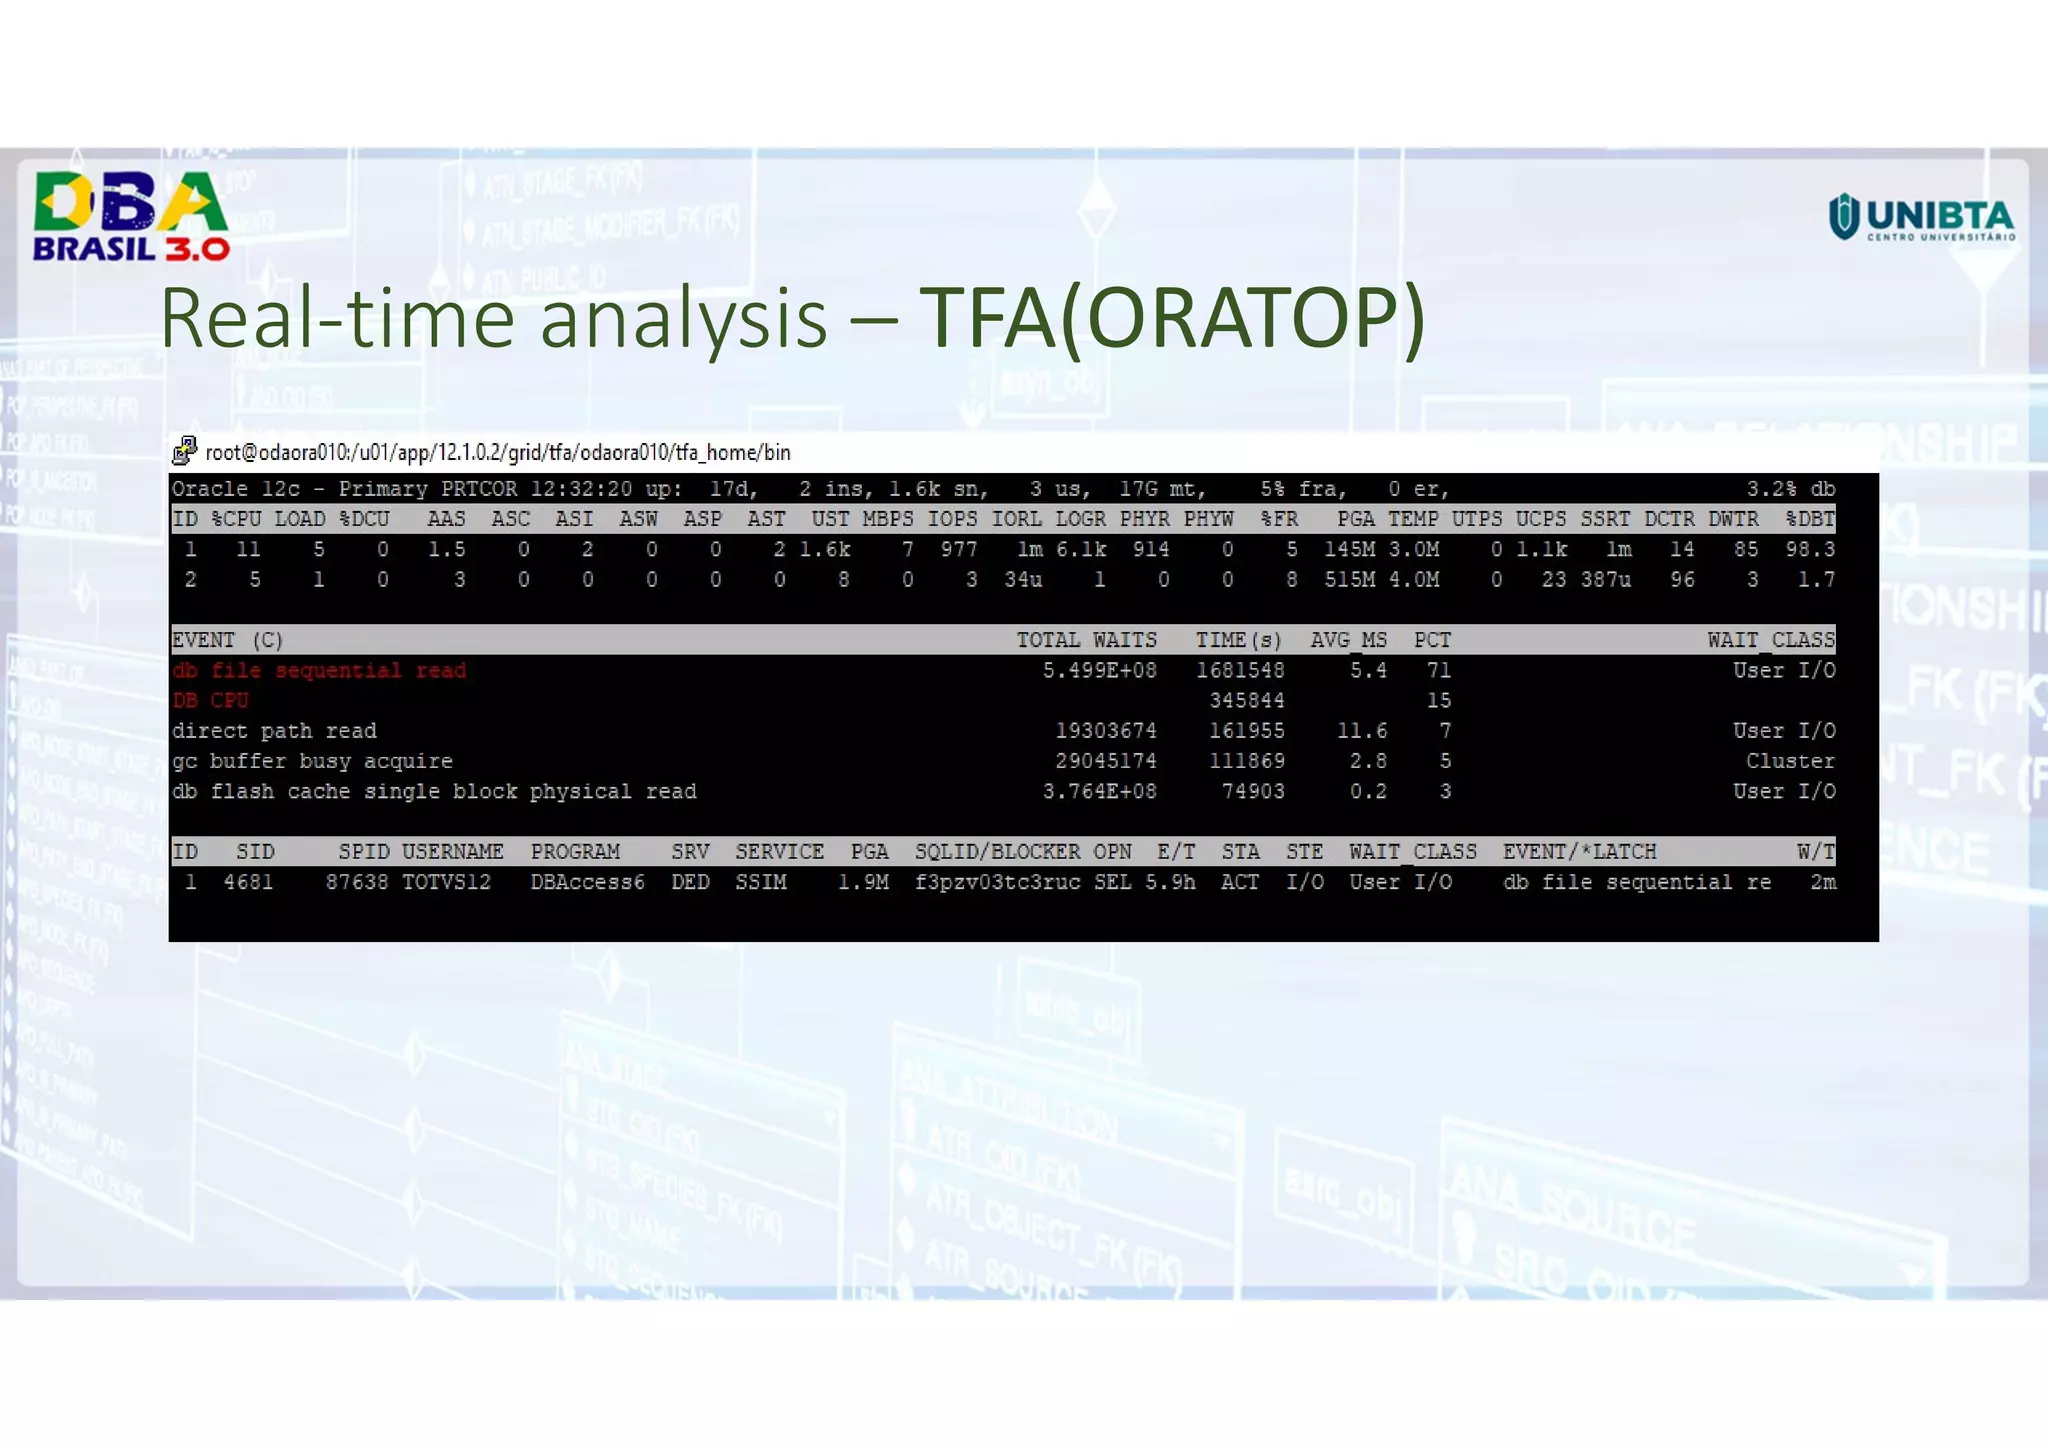
Real-time analysis – TFA(ORATOP)
Historic Performance
Statspack
• Shipped on 8i (8.1.6) and beyond
• diagnostic tool for instance-wide performance problems
• also supports application tuning activities by identifying high-load SQL statements
• https://oracle-base.com/articles/8i/statspack-8i
Historic Performance
TUNAS360
• (TUN)ing with (A)ctive (s)essions
• requires no installation and no parameter when executed
• it observes the workload for few minutes and then collects a set of reports on such
load
• Run @tunas360.sql
EDB360
• edb360 is a free to use tool to perform an initial assessment of an Oracle database
• pre-check: @sql/awr_ash_pre_check.sql
• Run: @edb360.sql N NULL
• Parameter 1: Oracle License Pack (required) - [ T | D | N ]
• Parameter 2: Custom edb360 configuration filename (optional) - 7a-7b
https://carlos-sierra.net/
SQL Tuning
SQLHC (Oracle)
Run: @sqlhc.sql N 0vy6pt4krb3gm
• Parameter 1: [ T | D | N ] – If tuning/diagnostic/none packages are licensed.
• Parameter 3: SQL_ID
SQLd360 (mauro-pagano.com)
• helps to diagnose SQL statements performing poorly
• input one SQL statement and output a set of diagnostics files
• Installs nothing
• Run: @sqld360.sql 0vy6pt4krb3gm N
• Parameter 1: SQL_ID
• Parameter 2: [ T | D | N ] – If tuning/diagnostic/none packages are licensed.
SQL Tuning
SQLT (Oracle)
• helps to diagnose SQL statements performing poorly
• input one SQL statement and output a set of diagnostics files
• Oracle Diagnostic and/or the Oracle Tuning Packs enhances functionality to the SQLT tool.
• Installation
• cd sqlt/install
• sqlplus / as sysdba @sqcreate
Main methods
• XTRACT - if you know the SQL_ID or the HASH_VALUE of the SQL to be analyzed
• XECUTE - provides more detail than XTRACT, it executes the SQL being analyzed, then it produces a set of diagnostics files
• XTRXEC - This method combines the features of XTRACT and XECUTE. Actually, XTRXEC executes both methods serially
• XTRSBY - Use this method if you need to analyze a SQL executed on a Data Guard or stand-by read-only database.
You need to know the SQL_ID or the HASH_VALUE of the SQL to be analyzed.
• XPLAIN - This method is based on the EXPLAIN PLAN FOR command use dbms_xplan.display_cursor instead !*
• XPREXT - Use this method if you have used XTRACT and you need a faster execution of SQLT while disabling some SQLT features.
Script sqlt/run/sqltcommon11.sql shows which features are disabled.
• XPREXC - Use this method if you have used XECUTE and you need a faster execution of SQLT while disabling some SQLT features.
Script sqlt/run/sqltcommon11.sql shows which features are disabled.
SQLT Main Report: Usage Suggestions (Doc ID 1922234.1)
*https://sqlmaria.com/2017/11/21/does-the-explain-plan-command-really-show-the-execution-plan-that-will-be-used/
SQL Tuning
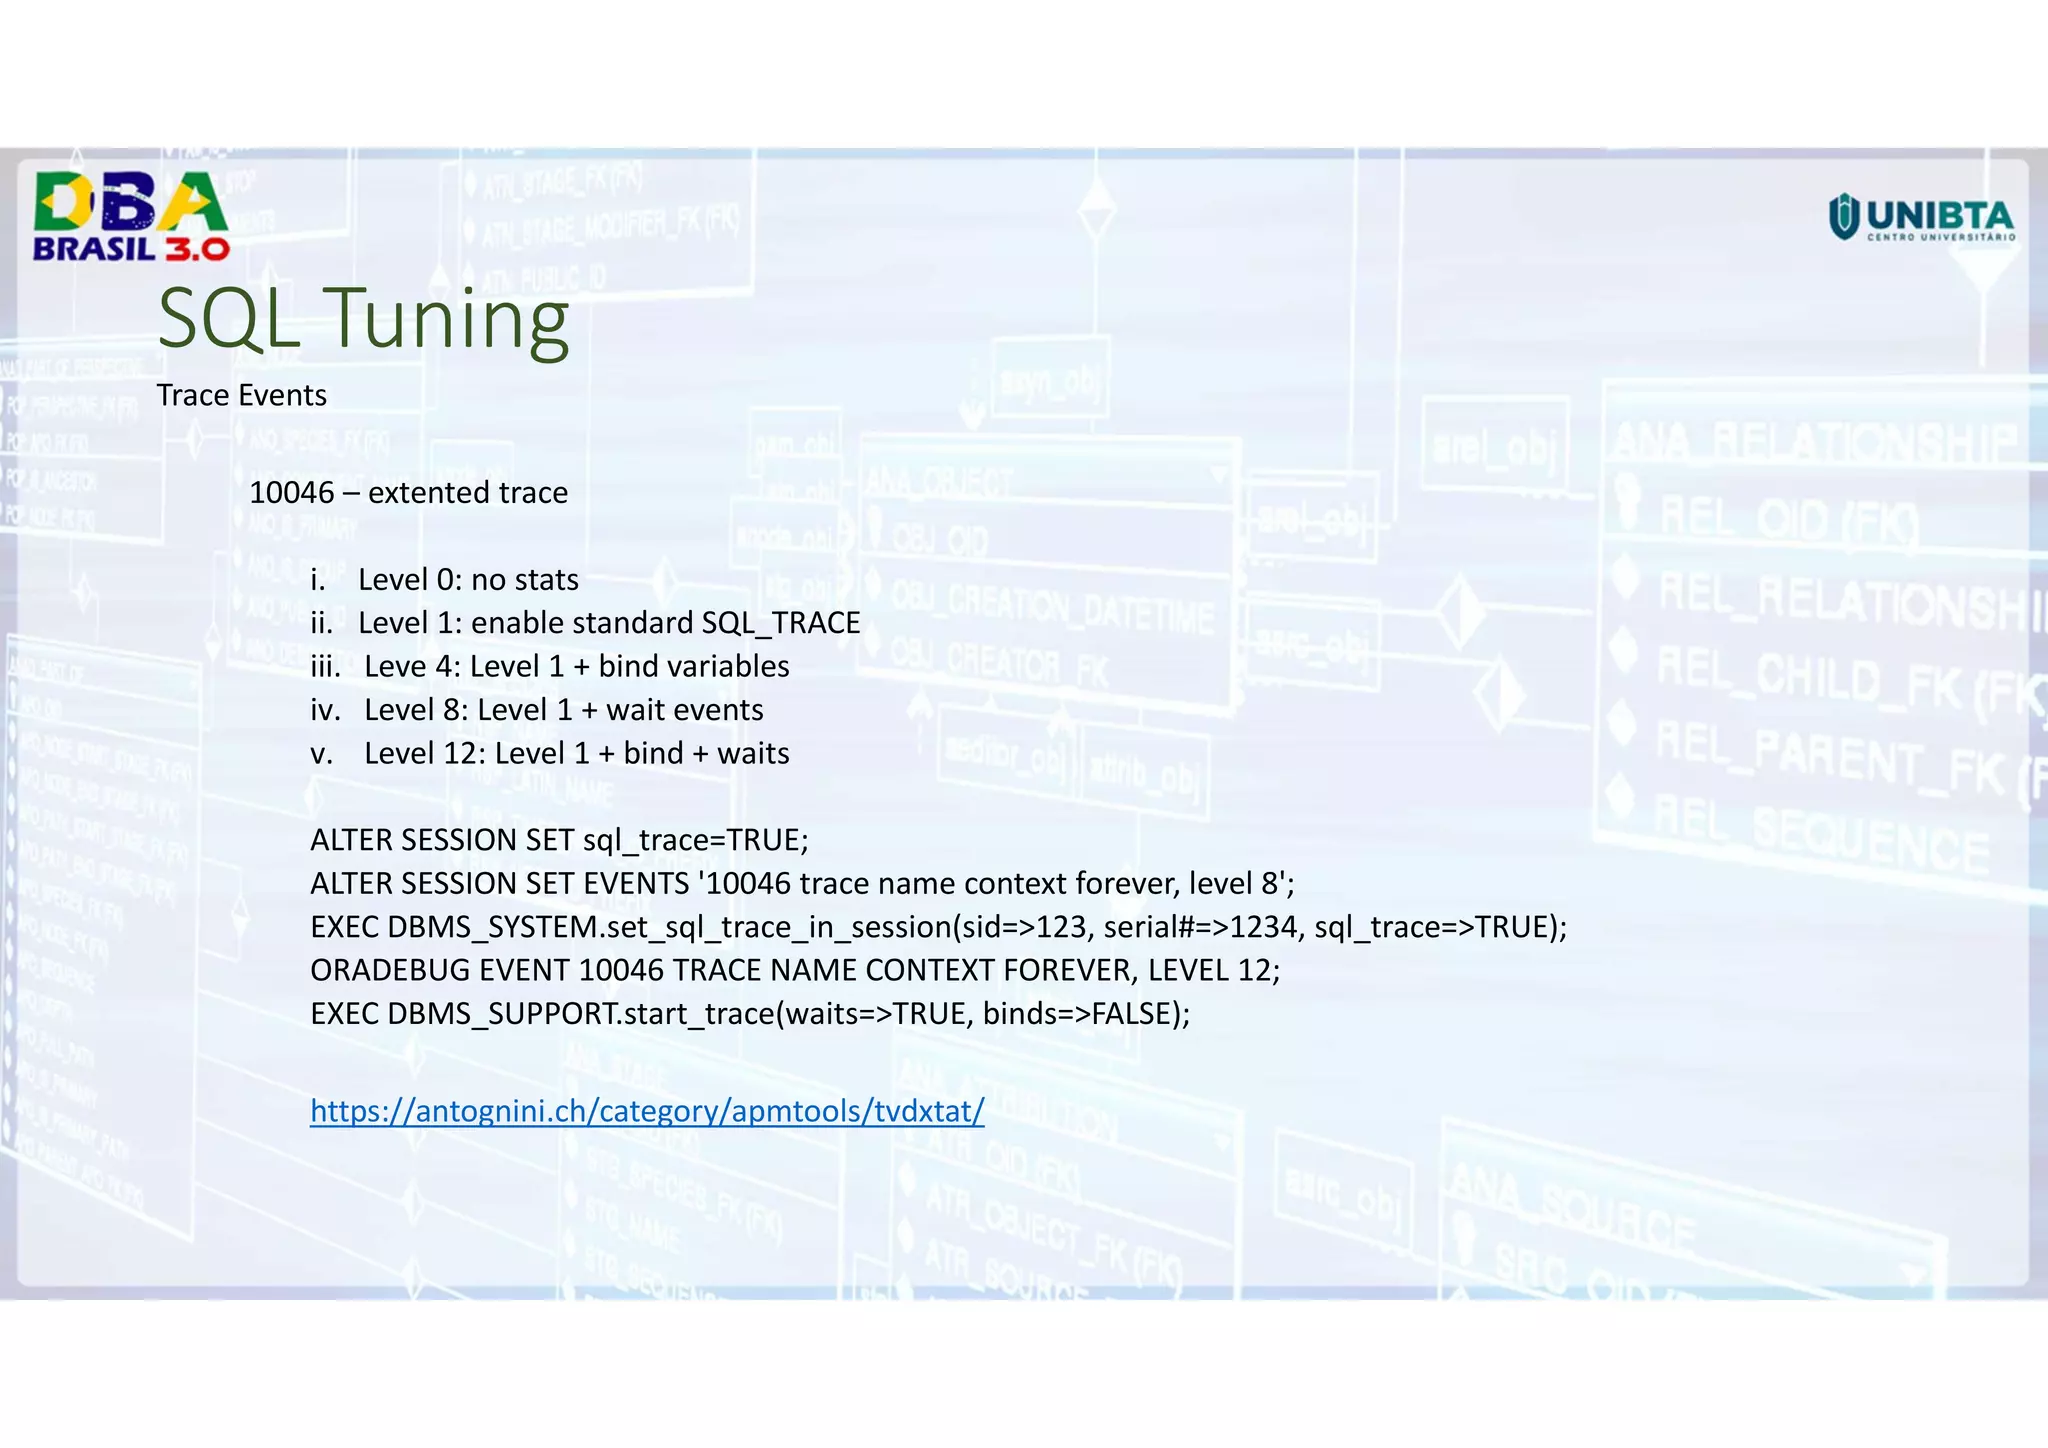
Trace Events
10046 – extented trace
i. Level 0: no stats
ii. Level 1: enable standard SQL_TRACE
iii. Leve 4: Level 1 + bind variables
iv. Level 8: Level 1 + wait events
v. Level 12: Level 1 + bind + waits
ALTER SESSION SET sql_trace=TRUE;
ALTER SESSION SET EVENTS '10046 trace name context forever, level 8';
EXEC DBMS_SYSTEM.set_sql_trace_in_session(sid=>123, serial#=>1234, sql_trace=>TRUE);
ORADEBUG EVENT 10046 TRACE NAME CONTEXT FOREVER, LEVEL 12;
EXEC DBMS_SUPPORT.start_trace(waits=>TRUE, binds=>FALSE);
https://antognini.ch/category/apmtools/tvdxtat/
SQL Tuning
Trace Events
10053 - examine the internal decisions made by the Cost Based Optimizer
i. ALTER SESSION SET EVENTS '10053 trace name context forever, level 1';
ii. DBMS_SQLDIAG.DUMP_TRACE
iii. ALTER SESSION SET EVENTS 'trace[rdbms.SQL_Optimizer.*][sql:cjk13xfm8ybh7]';
http://www.oaktable.net/contribute/10053-viewer
OS Tools
1. SYSSTAT
1. KSAR
2. TFA
1. OSWATCHER
3. GRAFANA
4. CENTREON
5. ZABBIX
6. PROMETHEUS
Agradecimentos
1. Coordenação do DBA Brasil 3.0 pelo evento
2. Todos que escolheram prestigiar minha palestra
3. TOTVS
Free oracle performance tools

Free oracle performance tools

  • 1.
    Free Oracle PerformanceTools Rogerio Bacchi Eguchi
  • 3.
    Apresentação Pessoal • OracleDBA Sênior com extensa experiência em ambientes OLTP de missão crítica e que empregam as tecnologias da Oracle Maximum Availability Architecture • 4 anos como DBA no Oracle Advanced Customer Support Services (2002-2005) • 10 anos como DBA no UOL/UOLDiveo/PagSeguro (2005-2015) • 2 anos como DBA/DMA na TOTVS (2016 > ...) • Oracle 8i-12c Certified Professional. Oracle Exadata Certified Expert. • RedHat 5 Certified Engineer • Artigos publicados no OTN Brasil: 9 artigos • Blogger: http://reguchi.wordpress.com • Twitter: reguchi_br
  • 4.
    Agenda 1. Tuning –A history 2. Tuning – Objectives 3. Tuning – Pareto Principle 4. Real-time analysis 5. Historic Performance analysis 6. SQL tuning 7. SO tools
  • 5.
    Tuning - History Counters/Ratios •Introduction of Wait Event instrumentation @Oracle 7 Time-Based tuning • YAPP Method (Yet Another Performance Profiling Method) • Method R • DB Time Tuning
  • 6.
    Tuning - History *Diagnosticand Tuning Pack are database options available only on Oracle Enterprise Edition ** US$60K = 1 Oracle EE + 1 Diag+Tuning Pack License Oracle Version Tool Cost 7 / 8 utlbstat/utlestat Free 8i (8.1.6+) / 9i Statspack Free 10g or > Statspack Diagnostic / Tuning Pack* Free US$ 60K/license**
  • 7.
    Tuning - Objectives 1.Define performance and performance problems 2. Check the performance of the Oracle DB 3. Check the overall performance of the server and storage
  • 8.
    Tuning - Objectives Whydo I care about time ? • Human time is critical to the enterprise • Systems performance affects business goals • “Time is money” • Performance improvement means doing things faster Performance is always and only about time
  • 9.
    Tuning - Objectives ResponseTime = Work done (service time) + Waiting for work (wait time) Each server process is typically in one of three states: • Idle: Waiting for something to do (sleeping) • Running code: Using the CPU or in a run queue • Waiting: blocked • For some resource to become available • For a requested activity to complete If service time and/or wait time is high, it will directly impact the total response time
  • 10.
    Tuning - Objectives 1.Reactive tuning • Firefighter 2. Proactive tuning • Plan, Do, Check, Act
  • 11.
    Pareto Principle (80/20rule) “The minority of causes, inputs, or efforts usually produces a majority of the results” Top Foreground Events by Total Wait Time SQL ordered by CPU Time SQL ordered by User I/O Wait SQL ordered by buffer gets SQL ordered by physical reads SQL ordered by Executions
  • 12.
    Real-time analysis –Snapper Snapper – Tanel Poder • Realtime session monitor • No installation needed • Snaps v$session etc, reports the difference Arguments 1. Mode (ash, stat, custom) 2. Seconds to run 3. Number of runs 4. All or filter on v$session (ex: username = scott or sid=51)
  • 13.
  • 14.
    Real-time analysis –MOATS 2.0 https://github.com/dbsid/moats_rac
  • 15.
    Real-time analysis –Web-ASH http://datavirtualizer.com/web-ash-w-ash/
  • 16.
  • 17.
    Historic Performance Statspack • Shippedon 8i (8.1.6) and beyond • diagnostic tool for instance-wide performance problems • also supports application tuning activities by identifying high-load SQL statements • https://oracle-base.com/articles/8i/statspack-8i
  • 18.
    Historic Performance TUNAS360 • (TUN)ingwith (A)ctive (s)essions • requires no installation and no parameter when executed • it observes the workload for few minutes and then collects a set of reports on such load • Run @tunas360.sql EDB360 • edb360 is a free to use tool to perform an initial assessment of an Oracle database • pre-check: @sql/awr_ash_pre_check.sql • Run: @edb360.sql N NULL • Parameter 1: Oracle License Pack (required) - [ T | D | N ] • Parameter 2: Custom edb360 configuration filename (optional) - 7a-7b https://carlos-sierra.net/
  • 19.
    SQL Tuning SQLHC (Oracle) Run:@sqlhc.sql N 0vy6pt4krb3gm • Parameter 1: [ T | D | N ] – If tuning/diagnostic/none packages are licensed. • Parameter 3: SQL_ID SQLd360 (mauro-pagano.com) • helps to diagnose SQL statements performing poorly • input one SQL statement and output a set of diagnostics files • Installs nothing • Run: @sqld360.sql 0vy6pt4krb3gm N • Parameter 1: SQL_ID • Parameter 2: [ T | D | N ] – If tuning/diagnostic/none packages are licensed.
  • 20.
    SQL Tuning SQLT (Oracle) •helps to diagnose SQL statements performing poorly • input one SQL statement and output a set of diagnostics files • Oracle Diagnostic and/or the Oracle Tuning Packs enhances functionality to the SQLT tool. • Installation • cd sqlt/install • sqlplus / as sysdba @sqcreate Main methods • XTRACT - if you know the SQL_ID or the HASH_VALUE of the SQL to be analyzed • XECUTE - provides more detail than XTRACT, it executes the SQL being analyzed, then it produces a set of diagnostics files • XTRXEC - This method combines the features of XTRACT and XECUTE. Actually, XTRXEC executes both methods serially • XTRSBY - Use this method if you need to analyze a SQL executed on a Data Guard or stand-by read-only database. You need to know the SQL_ID or the HASH_VALUE of the SQL to be analyzed. • XPLAIN - This method is based on the EXPLAIN PLAN FOR command use dbms_xplan.display_cursor instead !* • XPREXT - Use this method if you have used XTRACT and you need a faster execution of SQLT while disabling some SQLT features. Script sqlt/run/sqltcommon11.sql shows which features are disabled. • XPREXC - Use this method if you have used XECUTE and you need a faster execution of SQLT while disabling some SQLT features. Script sqlt/run/sqltcommon11.sql shows which features are disabled. SQLT Main Report: Usage Suggestions (Doc ID 1922234.1) *https://sqlmaria.com/2017/11/21/does-the-explain-plan-command-really-show-the-execution-plan-that-will-be-used/
  • 21.
    SQL Tuning Trace Events 10046– extented trace i. Level 0: no stats ii. Level 1: enable standard SQL_TRACE iii. Leve 4: Level 1 + bind variables iv. Level 8: Level 1 + wait events v. Level 12: Level 1 + bind + waits ALTER SESSION SET sql_trace=TRUE; ALTER SESSION SET EVENTS '10046 trace name context forever, level 8'; EXEC DBMS_SYSTEM.set_sql_trace_in_session(sid=>123, serial#=>1234, sql_trace=>TRUE); ORADEBUG EVENT 10046 TRACE NAME CONTEXT FOREVER, LEVEL 12; EXEC DBMS_SUPPORT.start_trace(waits=>TRUE, binds=>FALSE); https://antognini.ch/category/apmtools/tvdxtat/
  • 22.
    SQL Tuning Trace Events 10053- examine the internal decisions made by the Cost Based Optimizer i. ALTER SESSION SET EVENTS '10053 trace name context forever, level 1'; ii. DBMS_SQLDIAG.DUMP_TRACE iii. ALTER SESSION SET EVENTS 'trace[rdbms.SQL_Optimizer.*][sql:cjk13xfm8ybh7]'; http://www.oaktable.net/contribute/10053-viewer
  • 23.
    OS Tools 1. SYSSTAT 1.KSAR 2. TFA 1. OSWATCHER 3. GRAFANA 4. CENTREON 5. ZABBIX 6. PROMETHEUS
  • 24.
    Agradecimentos 1. Coordenação doDBA Brasil 3.0 pelo evento 2. Todos que escolheram prestigiar minha palestra 3. TOTVS