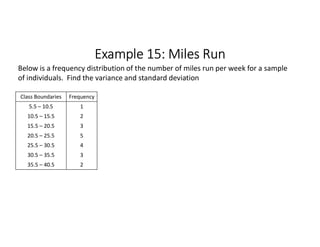
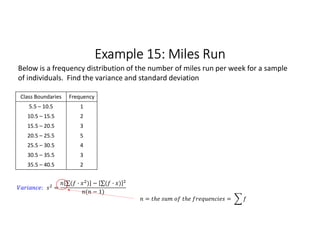
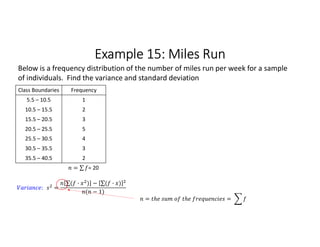
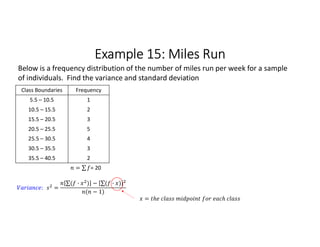
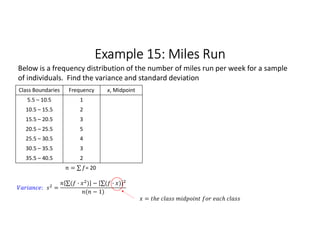
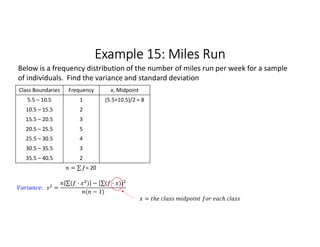
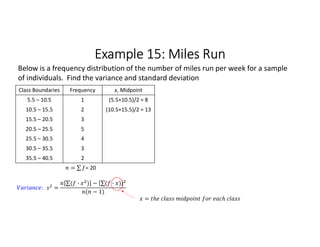
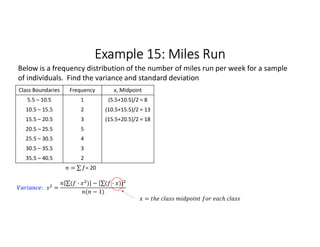
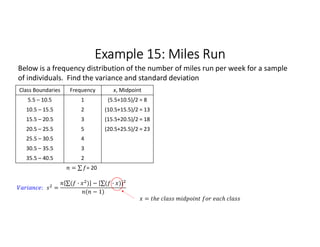
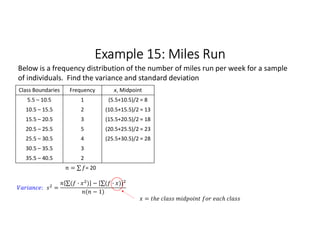
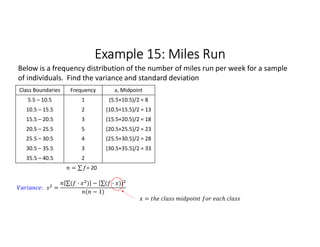
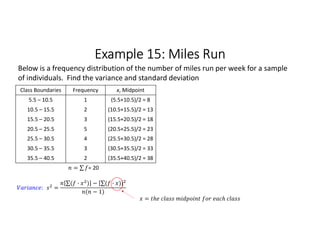
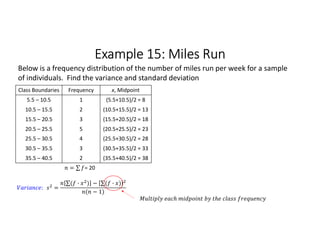
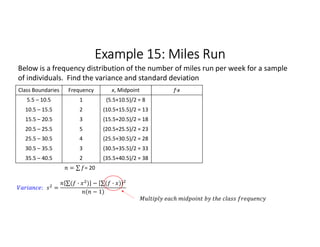
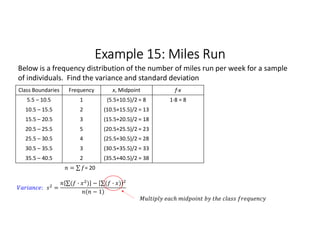
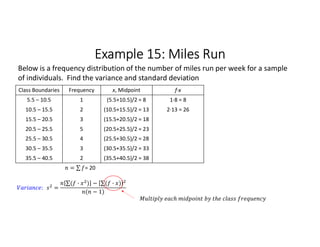
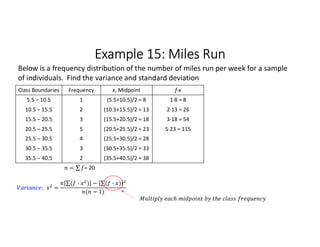
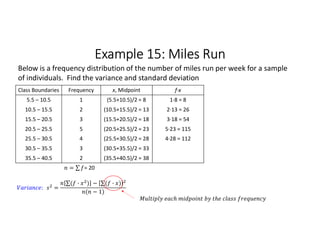
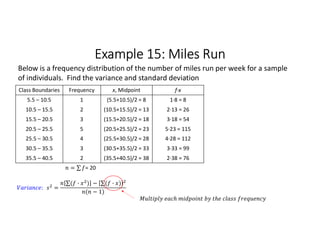
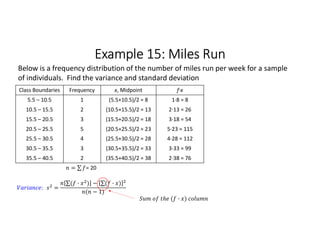
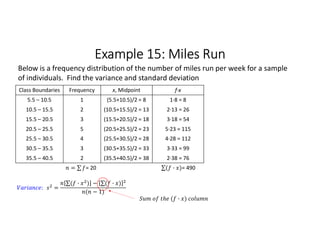
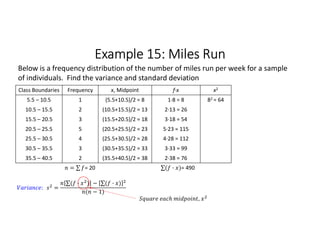
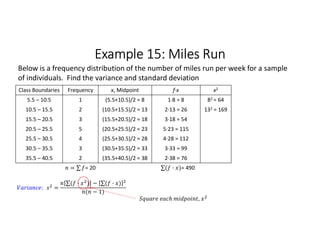
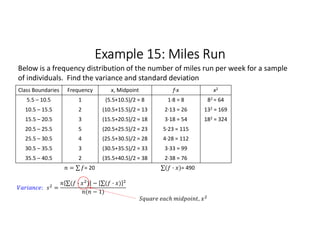
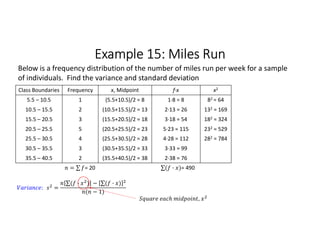
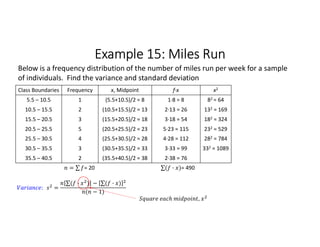
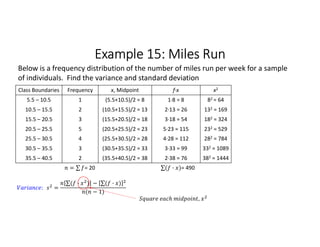
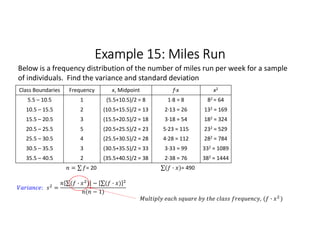
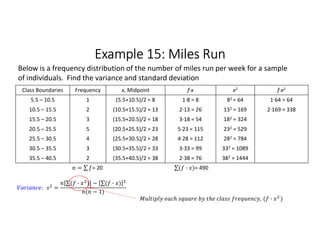
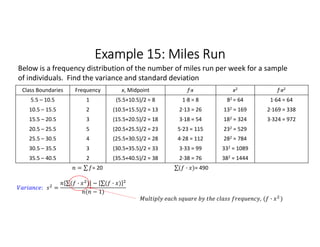
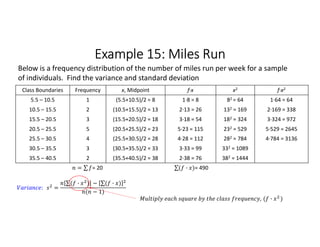
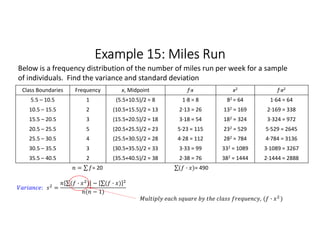
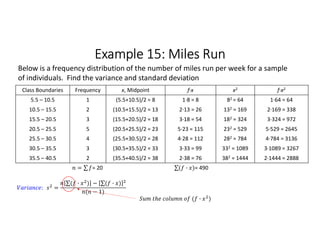
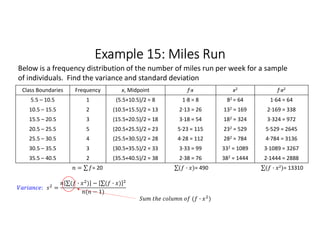
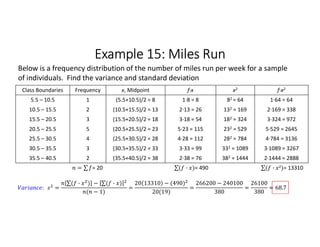
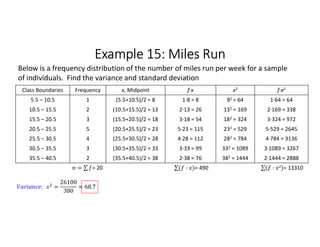
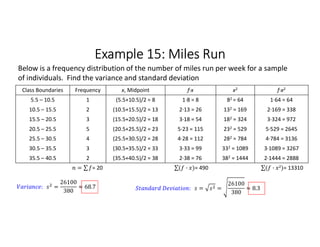
SlideShare a Scribd company logo
1 of 44
Download to read offline
Example 15: Miles Run
Class Boundaries Frequency
5.5 – 10.5 1
10.5 – 15.5 2
15.5 – 20.5 3
20.5 – 25.5 5
25.5 – 30.5 4
30.5 – 35.5 3
35.5 – 40.5 2
Below is a frequency distribution of the number of miles run per week for a sample
of individuals. Find the variance and standard deviation
Example 15: Miles Run
Class Boundaries Frequency
5.5 – 10.5 1
10.5 – 15.5 2
15.5 – 20.5 3
20.5 – 25.5 5
25.5 – 30.5 4
30.5 – 35.5 3
35.5 – 40.5 2
Below is a frequency distribution of the number of miles run per week for a sample
of individuals. Find the variance and standard deviation
: =
∑( · ) 
  − ∑( · ) 
 
( − 1)
= =
 
 
Example 15: Miles Run
Class Boundaries Frequency
5.5 – 10.5 1
10.5 – 15.5 2
15.5 – 20.5 3
20.5 – 25.5 5
25.5 – 30.5 4
30.5 – 35.5 3
35.5 – 40.5 2
= ∑ 
  = 20
Below is a frequency distribution of the number of miles run per week for a sample
of individuals. Find the variance and standard deviation
: =
∑( · ) 
  − ∑( · ) 
 
( − 1)
=
Example 15: Miles Run
Class Boundaries Frequency x, Midpoint
5.5 – 10.5 1 (5.5+10.5)/2 = 8
10.5 – 15.5 2 (10.5+15.5)/2 = 13
15.5 – 20.5 3 (15.5+20.5)/2 = 18
20.5 – 25.5 5 (20.5+25.5)/2 = 23
25.5 – 30.5 4 (25.5+30.5)/2 = 28
30.5 – 35.5 3 (30.5+35.5)/2 = 33
35.5 – 40.5 2 (35.5+40.5)/2 = 38
= ∑ 
  = 20
Below is a frequency distribution of the number of miles run per week for a sample
of individuals. Find the variance and standard deviation
: =
∑( · ) 
  − ∑( · ) 
 
( − 1)
Example 15: Miles Run
Class Boundaries Frequency x, Midpoint f∙x
5.5 – 10.5 1 (5.5+10.5)/2 = 8 1∙8 = 8
10.5 – 15.5 2 (10.5+15.5)/2 = 13 2∙13 = 26
15.5 – 20.5 3 (15.5+20.5)/2 = 18 3∙18 = 54
20.5 – 25.5 5 (20.5+25.5)/2 = 23 5∙23 = 115
25.5 – 30.5 4 (25.5+30.5)/2 = 28 4∙28 = 112
30.5 – 35.5 3 (30.5+35.5)/2 = 33 3∙33 = 99
35.5 – 40.5 2 (35.5+40.5)/2 = 38 2∙38 = 76
= ∑ 
  = 20
Below is a frequency distribution of the number of miles run per week for a sample
of individuals. Find the variance and standard deviation
: =
∑( · ) 
  − ∑( · ) 
 
( − 1)
( · )
Example 15: Miles Run
Class Boundaries Frequency x, Midpoint f∙x
5.5 – 10.5 1 (5.5+10.5)/2 = 8 1∙8 = 8
10.5 – 15.5 2 (10.5+15.5)/2 = 13 2∙13 = 26
15.5 – 20.5 3 (15.5+20.5)/2 = 18 3∙18 = 54
20.5 – 25.5 5 (20.5+25.5)/2 = 23 5∙23 = 115
25.5 – 30.5 4 (25.5+30.5)/2 = 28 4∙28 = 112
30.5 – 35.5 3 (30.5+35.5)/2 = 33 3∙33 = 99
35.5 – 40.5 2 (35.5+40.5)/2 = 38 2∙38 = 76
= ∑ 
  = 20 ∑( · ) 
  = 490
Below is a frequency distribution of the number of miles run per week for a sample
of individuals. Find the variance and standard deviation
: =
∑( · ) 
  − ∑( · ) 
 
( − 1)
,
Example 15: Miles Run
Class Boundaries Frequency x, Midpoint f∙x x2
5.5 – 10.5 1 (5.5+10.5)/2 = 8 1∙8 = 8 82 = 64
10.5 – 15.5 2 (10.5+15.5)/2 = 13 2∙13 = 26 132 = 169
15.5 – 20.5 3 (15.5+20.5)/2 = 18 3∙18 = 54 182 = 324
20.5 – 25.5 5 (20.5+25.5)/2 = 23 5∙23 = 115 232 = 529
25.5 – 30.5 4 (25.5+30.5)/2 = 28 4∙28 = 112 282 = 784
30.5 – 35.5 3 (30.5+35.5)/2 = 33 3∙33 = 99 332 = 1089
35.5 – 40.5 2 (35.5+40.5)/2 = 38 2∙38 = 76 382 = 1444
= ∑ 
  = 20 ∑( · ) 
  = 490
Below is a frequency distribution of the number of miles run per week for a sample
of individuals. Find the variance and standard deviation
: =
∑( · ) 
  − ∑( · ) 
 
( − 1)
, ( · )
Example 15: Miles Run
Class Boundaries Frequency x, Midpoint f∙x x2 f∙x2
5.5 – 10.5 1 (5.5+10.5)/2 = 8 1∙8 = 8 82 = 64 1∙64 = 64
10.5 – 15.5 2 (10.5+15.5)/2 = 13 2∙13 = 26 132 = 169 2∙169 = 338
15.5 – 20.5 3 (15.5+20.5)/2 = 18 3∙18 = 54 182 = 324 3∙324 = 972
20.5 – 25.5 5 (20.5+25.5)/2 = 23 5∙23 = 115 232 = 529 5∙529 = 2645
25.5 – 30.5 4 (25.5+30.5)/2 = 28 4∙28 = 112 282 = 784 4∙784 = 3136
30.5 – 35.5 3 (30.5+35.5)/2 = 33 3∙33 = 99 332 = 1089 3∙1089 = 3267
35.5 – 40.5 2 (35.5+40.5)/2 = 38 2∙38 = 76 382 = 1444 2∙1444 = 2888
= ∑ 
  = 20 ∑( · ) 
  = 490
Below is a frequency distribution of the number of miles run per week for a sample
of individuals. Find the variance and standard deviation
: =
∑( · ) 
  − ∑( · ) 
 
( − 1)
( · )
Example 15: Miles Run
Class Boundaries Frequency x, Midpoint f∙x x2 f∙x2
5.5 – 10.5 1 (5.5+10.5)/2 = 8 1∙8 = 8 82 = 64 1∙64 = 64
10.5 – 15.5 2 (10.5+15.5)/2 = 13 2∙13 = 26 132 = 169 2∙169 = 338
15.5 – 20.5 3 (15.5+20.5)/2 = 18 3∙18 = 54 182 = 324 3∙324 = 972
20.5 – 25.5 5 (20.5+25.5)/2 = 23 5∙23 = 115 232 = 529 5∙529 = 2645
25.5 – 30.5 4 (25.5+30.5)/2 = 28 4∙28 = 112 282 = 784 4∙784 = 3136
30.5 – 35.5 3 (30.5+35.5)/2 = 33 3∙33 = 99 332 = 1089 3∙1089 = 3267
35.5 – 40.5 2 (35.5+40.5)/2 = 38 2∙38 = 76 382 = 1444 2∙1444 = 2888
= ∑ 
  = 20 ∑( · ) 
  = 490 ∑( · 2) 
  = 13310
Below is a frequency distribution of the number of miles run per week for a sample
of individuals. Find the variance and standard deviation
: =
∑( · ) 
  − ∑( · ) 
 
( − 1)
=
20 13310 − (490)
20(19)
=
266200 − 240100
380
=
26100
380
≈ 68.7
Example 15: Miles Run
Class Boundaries Frequency x, Midpoint f∙x x2 f∙x2
5.5 – 10.5 1 (5.5+10.5)/2 = 8 1∙8 = 8 82 = 64 1∙64 = 64
10.5 – 15.5 2 (10.5+15.5)/2 = 13 2∙13 = 26 132 = 169 2∙169 = 338
15.5 – 20.5 3 (15.5+20.5)/2 = 18 3∙18 = 54 182 = 324 3∙324 = 972
20.5 – 25.5 5 (20.5+25.5)/2 = 23 5∙23 = 115 232 = 529 5∙529 = 2645
25.5 – 30.5 4 (25.5+30.5)/2 = 28 4∙28 = 112 282 = 784 4∙784 = 3136
30.5 – 35.5 3 (30.5+35.5)/2 = 33 3∙33 = 99 332 = 1089 3∙1089 = 3267
35.5 – 40.5 2 (35.5+40.5)/2 = 38 2∙38 = 76 382 = 1444 2∙1444 = 2888
= ∑ 
  = 20 ∑( · ) 
  = 490 ∑( · 2) 
  = 13310
Below is a frequency distribution of the number of miles run per week for a sample
of individuals. Find the variance and standard deviation
: =
26100
380
≈ 68.7 : =
 
=
26100
380
 
≈ 8.3

More Related Content

What's hot

Grade 10_Math-Lesson 2-3 Graphs of Polynomial Functions .pptx
Grade 10_Math-Lesson 2-3 Graphs of Polynomial Functions .pptxGrade 10_Math-Lesson 2-3 Graphs of Polynomial Functions .pptx
Grade 10_Math-Lesson 2-3 Graphs of Polynomial Functions .pptxErlenaMirador1
 
Algebra and Trigonometry 9th Edition Larson Solutions Manual
Algebra and Trigonometry 9th Edition Larson Solutions ManualAlgebra and Trigonometry 9th Edition Larson Solutions Manual
Algebra and Trigonometry 9th Edition Larson Solutions Manualkejeqadaqo
 
4.1 implicit differentiation
4.1 implicit differentiation4.1 implicit differentiation
4.1 implicit differentiationdicosmo178
 
3 2 Polynomial Functions And Their Graphs
3 2 Polynomial Functions And Their Graphs3 2 Polynomial Functions And Their Graphs
3 2 Polynomial Functions And Their Graphssilvia
 
linear transformation
linear transformationlinear transformation
linear transformationmansi acharya
 
Graphs of polynomial functions
Graphs of polynomial functionsGraphs of polynomial functions
Graphs of polynomial functionsCarlos Erepol
 
Operation on Functions.pptx
Operation on Functions.pptxOperation on Functions.pptx
Operation on Functions.pptxAPHRODITE51
 
4.1 exponential functions 2
4.1 exponential functions 24.1 exponential functions 2
4.1 exponential functions 2kvillave
 
(8) Lesson 5.3 - Angles of Triangles
(8) Lesson 5.3 - Angles of Triangles(8) Lesson 5.3 - Angles of Triangles
(8) Lesson 5.3 - Angles of Triangleswzuri
 
Lesson 11 derivative of trigonometric functions
Lesson 11 derivative of trigonometric functionsLesson 11 derivative of trigonometric functions
Lesson 11 derivative of trigonometric functionsRnold Wilson
 
GRE - Coordinate Geometry
GRE - Coordinate GeometryGRE - Coordinate Geometry
GRE - Coordinate GeometryGeorge Prep
 
10.1 Distance and Midpoint Formulas
10.1 Distance and Midpoint Formulas10.1 Distance and Midpoint Formulas
10.1 Distance and Midpoint Formulasswartzje
 
Lesson 1 derivative of trigonometric functions
Lesson 1 derivative of trigonometric functionsLesson 1 derivative of trigonometric functions
Lesson 1 derivative of trigonometric functionsLawrence De Vera
 

What's hot (20)

Grade 10_Math-Lesson 2-3 Graphs of Polynomial Functions .pptx
Grade 10_Math-Lesson 2-3 Graphs of Polynomial Functions .pptxGrade 10_Math-Lesson 2-3 Graphs of Polynomial Functions .pptx
Grade 10_Math-Lesson 2-3 Graphs of Polynomial Functions .pptx
 
Volume of revolution
Volume of revolutionVolume of revolution
Volume of revolution
 
Algebra and Trigonometry 9th Edition Larson Solutions Manual
Algebra and Trigonometry 9th Edition Larson Solutions ManualAlgebra and Trigonometry 9th Edition Larson Solutions Manual
Algebra and Trigonometry 9th Edition Larson Solutions Manual
 
4.1 implicit differentiation
4.1 implicit differentiation4.1 implicit differentiation
4.1 implicit differentiation
 
the inverse of the matrix
the inverse of the matrixthe inverse of the matrix
the inverse of the matrix
 
3 2 Polynomial Functions And Their Graphs
3 2 Polynomial Functions And Their Graphs3 2 Polynomial Functions And Their Graphs
3 2 Polynomial Functions And Their Graphs
 
Lesson no. 5 (Reference Angle)
Lesson no. 5 (Reference Angle)Lesson no. 5 (Reference Angle)
Lesson no. 5 (Reference Angle)
 
linear transformation
linear transformationlinear transformation
linear transformation
 
Graphs of polynomial functions
Graphs of polynomial functionsGraphs of polynomial functions
Graphs of polynomial functions
 
Operation on Functions.pptx
Operation on Functions.pptxOperation on Functions.pptx
Operation on Functions.pptx
 
4.1 exponential functions 2
4.1 exponential functions 24.1 exponential functions 2
4.1 exponential functions 2
 
MATLAB - Arrays and Matrices
MATLAB - Arrays and MatricesMATLAB - Arrays and Matrices
MATLAB - Arrays and Matrices
 
distance formula
distance formuladistance formula
distance formula
 
(8) Lesson 5.3 - Angles of Triangles
(8) Lesson 5.3 - Angles of Triangles(8) Lesson 5.3 - Angles of Triangles
(8) Lesson 5.3 - Angles of Triangles
 
Factoring by grouping
Factoring by groupingFactoring by grouping
Factoring by grouping
 
Chain rule
Chain ruleChain rule
Chain rule
 
Lesson 11 derivative of trigonometric functions
Lesson 11 derivative of trigonometric functionsLesson 11 derivative of trigonometric functions
Lesson 11 derivative of trigonometric functions
 
GRE - Coordinate Geometry
GRE - Coordinate GeometryGRE - Coordinate Geometry
GRE - Coordinate Geometry
 
10.1 Distance and Midpoint Formulas
10.1 Distance and Midpoint Formulas10.1 Distance and Midpoint Formulas
10.1 Distance and Midpoint Formulas
 
Lesson 1 derivative of trigonometric functions
Lesson 1 derivative of trigonometric functionsLesson 1 derivative of trigonometric functions
Lesson 1 derivative of trigonometric functions
 

Viewers also liked

Sample Standard Deviation
Sample Standard DeviationSample Standard Deviation
Sample Standard Deviationccooking
 
Relative frequency approximation Blood Types
Relative frequency approximation Blood TypesRelative frequency approximation Blood Types
Relative frequency approximation Blood Typesccooking
 
Weighted Mean - Helicopter Costs
Weighted Mean - Helicopter CostsWeighted Mean - Helicopter Costs
Weighted Mean - Helicopter Costsccooking
 
Weighted Mean - Class Average (Desk Work 6)
Weighted Mean - Class Average (Desk Work 6)Weighted Mean - Class Average (Desk Work 6)
Weighted Mean - Class Average (Desk Work 6)ccooking
 
Sample Standard Deviation - Desk Work 8
Sample Standard Deviation - Desk Work 8Sample Standard Deviation - Desk Work 8
Sample Standard Deviation - Desk Work 8ccooking
 
Population Standard Deviation - Desk Work 7
Population Standard Deviation - Desk Work 7Population Standard Deviation - Desk Work 7
Population Standard Deviation - Desk Work 7ccooking
 
Mean of a frequency distribution
Mean of a frequency distributionMean of a frequency distribution
Mean of a frequency distributionccooking
 
Weighted Mean - New Diet Cola
Weighted Mean - New Diet ColaWeighted Mean - New Diet Cola
Weighted Mean - New Diet Colaccooking
 
Weighted Mean - Class Average
Weighted Mean - Class AverageWeighted Mean - Class Average
Weighted Mean - Class Averageccooking
 
Weighted Mean - GPA
Weighted Mean - GPAWeighted Mean - GPA
Weighted Mean - GPAccooking
 
Mean of a discrete random variable.ppt
Mean of a discrete random variable.pptMean of a discrete random variable.ppt
Mean of a discrete random variable.pptccooking
 
Variance and standard deviation of a discrete random variable
Variance and standard deviation of a discrete random variableVariance and standard deviation of a discrete random variable
Variance and standard deviation of a discrete random variableccooking
 
Indefinite pronouns üst seviye
Indefinite pronouns üst seviyeIndefinite pronouns üst seviye
Indefinite pronouns üst seviyeayse06inci
 
Indefinite Pronouns
 Indefinite Pronouns Indefinite Pronouns
Indefinite PronounsDiana Gamez
 
Sentence Pattern
Sentence PatternSentence Pattern
Sentence Patterncharity94
 
Indefinite pronouns powerpoint
Indefinite pronouns powerpointIndefinite pronouns powerpoint
Indefinite pronouns powerpointRoya Falatoonzadeh
 

Viewers also liked (17)

Sample Standard Deviation
Sample Standard DeviationSample Standard Deviation
Sample Standard Deviation
 
Relative frequency approximation Blood Types
Relative frequency approximation Blood TypesRelative frequency approximation Blood Types
Relative frequency approximation Blood Types
 
Weighted Mean - Helicopter Costs
Weighted Mean - Helicopter CostsWeighted Mean - Helicopter Costs
Weighted Mean - Helicopter Costs
 
Weighted Mean - Class Average (Desk Work 6)
Weighted Mean - Class Average (Desk Work 6)Weighted Mean - Class Average (Desk Work 6)
Weighted Mean - Class Average (Desk Work 6)
 
Sample Standard Deviation - Desk Work 8
Sample Standard Deviation - Desk Work 8Sample Standard Deviation - Desk Work 8
Sample Standard Deviation - Desk Work 8
 
Population Standard Deviation - Desk Work 7
Population Standard Deviation - Desk Work 7Population Standard Deviation - Desk Work 7
Population Standard Deviation - Desk Work 7
 
Mean of a frequency distribution
Mean of a frequency distributionMean of a frequency distribution
Mean of a frequency distribution
 
Weighted Mean - New Diet Cola
Weighted Mean - New Diet ColaWeighted Mean - New Diet Cola
Weighted Mean - New Diet Cola
 
Weighted Mean - Class Average
Weighted Mean - Class AverageWeighted Mean - Class Average
Weighted Mean - Class Average
 
Weighted Mean - GPA
Weighted Mean - GPAWeighted Mean - GPA
Weighted Mean - GPA
 
Mean of a discrete random variable.ppt
Mean of a discrete random variable.pptMean of a discrete random variable.ppt
Mean of a discrete random variable.ppt
 
Variance and standard deviation of a discrete random variable
Variance and standard deviation of a discrete random variableVariance and standard deviation of a discrete random variable
Variance and standard deviation of a discrete random variable
 
Indefinite pronouns üst seviye
Indefinite pronouns üst seviyeIndefinite pronouns üst seviye
Indefinite pronouns üst seviye
 
Indefinite Pronouns
 Indefinite Pronouns Indefinite Pronouns
Indefinite Pronouns
 
Kinds of paragraphs
Kinds of paragraphsKinds of paragraphs
Kinds of paragraphs
 
Sentence Pattern
Sentence PatternSentence Pattern
Sentence Pattern
 
Indefinite pronouns powerpoint
Indefinite pronouns powerpointIndefinite pronouns powerpoint
Indefinite pronouns powerpoint
 

Similar to Module 3 example 15

Unidad 2 ejercicios frecuencia1
Unidad 2 ejercicios frecuencia1Unidad 2 ejercicios frecuencia1
Unidad 2 ejercicios frecuencia1AralysRodriguez
 
Statistical Analysis using Central Tendencies
Statistical Analysis using Central TendenciesStatistical Analysis using Central Tendencies
Statistical Analysis using Central TendenciesCelia Santhosh
 
Regression Analysis , A statistical approch to analysis data.pptx
Regression Analysis , A statistical  approch to analysis data.pptxRegression Analysis , A statistical  approch to analysis data.pptx
Regression Analysis , A statistical approch to analysis data.pptxTifahInternational
 
Juliaで学ぶ Hamiltonian Monte Carlo (NUTS 入り)
Juliaで学ぶ Hamiltonian Monte Carlo (NUTS 入り)Juliaで学ぶ Hamiltonian Monte Carlo (NUTS 入り)
Juliaで学ぶ Hamiltonian Monte Carlo (NUTS 入り)Kenta Sato
 
Quantitative techniques for MBA (QDM)
Quantitative techniques for MBA (QDM)Quantitative techniques for MBA (QDM)
Quantitative techniques for MBA (QDM)npazare
 
Business Statistics - Cumulative frequency
Business Statistics - Cumulative frequencyBusiness Statistics - Cumulative frequency
Business Statistics - Cumulative frequencyDeepukumar Rao
 
Solutions_Manual_to_accompany_Applied_Nu.pdf
Solutions_Manual_to_accompany_Applied_Nu.pdfSolutions_Manual_to_accompany_Applied_Nu.pdf
Solutions_Manual_to_accompany_Applied_Nu.pdfWaleedHussain30
 
Statistical process control ppt @ doms
Statistical process control ppt @ doms Statistical process control ppt @ doms
Statistical process control ppt @ doms Babasab Patil
 
Statistics (Mean, Median, Mode)
Statistics (Mean, Median, Mode)Statistics (Mean, Median, Mode)
Statistics (Mean, Median, Mode)Sherzad Daudzai
 
SUEC 高中 Adv Maths (Statistic).pptx
SUEC 高中 Adv Maths (Statistic).pptxSUEC 高中 Adv Maths (Statistic).pptx
SUEC 高中 Adv Maths (Statistic).pptxtungwc
 
Business statistics solved numericals
Business statistics solved numericalsBusiness statistics solved numericals
Business statistics solved numericalsAnurag Srivastava
 
TEST & MEASUREMENT.pptx
TEST & MEASUREMENT.pptxTEST & MEASUREMENT.pptx
TEST & MEASUREMENT.pptxBAGYALAXMI2
 
An overview of statistics management with excel
An overview of statistics management with excelAn overview of statistics management with excel
An overview of statistics management with excelKRISHANACHOUDHARY1
 
Design of super elevation in Opencast Mine- a case study
Design of super elevation in Opencast Mine-  a case studyDesign of super elevation in Opencast Mine-  a case study
Design of super elevation in Opencast Mine- a case studyTIKESHWAR MAHTO
 

Similar to Module 3 example 15 (20)

Unidad 2 ejercicios frecuencia1
Unidad 2 ejercicios frecuencia1Unidad 2 ejercicios frecuencia1
Unidad 2 ejercicios frecuencia1
 
Statistical Analysis using Central Tendencies
Statistical Analysis using Central TendenciesStatistical Analysis using Central Tendencies
Statistical Analysis using Central Tendencies
 
Regression Analysis , A statistical approch to analysis data.pptx
Regression Analysis , A statistical  approch to analysis data.pptxRegression Analysis , A statistical  approch to analysis data.pptx
Regression Analysis , A statistical approch to analysis data.pptx
 
Juliaで学ぶ Hamiltonian Monte Carlo (NUTS 入り)
Juliaで学ぶ Hamiltonian Monte Carlo (NUTS 入り)Juliaで学ぶ Hamiltonian Monte Carlo (NUTS 入り)
Juliaで学ぶ Hamiltonian Monte Carlo (NUTS 入り)
 
Quantitative techniques for MBA (QDM)
Quantitative techniques for MBA (QDM)Quantitative techniques for MBA (QDM)
Quantitative techniques for MBA (QDM)
 
Dispersion uwsb
Dispersion   uwsbDispersion   uwsb
Dispersion uwsb
 
Business Statistics - Cumulative frequency
Business Statistics - Cumulative frequencyBusiness Statistics - Cumulative frequency
Business Statistics - Cumulative frequency
 
Solutions_Manual_to_accompany_Applied_Nu.pdf
Solutions_Manual_to_accompany_Applied_Nu.pdfSolutions_Manual_to_accompany_Applied_Nu.pdf
Solutions_Manual_to_accompany_Applied_Nu.pdf
 
Statistical process control ppt @ doms
Statistical process control ppt @ doms Statistical process control ppt @ doms
Statistical process control ppt @ doms
 
Statistics (Mean, Median, Mode)
Statistics (Mean, Median, Mode)Statistics (Mean, Median, Mode)
Statistics (Mean, Median, Mode)
 
SUEC 高中 Adv Maths (Statistic).pptx
SUEC 高中 Adv Maths (Statistic).pptxSUEC 高中 Adv Maths (Statistic).pptx
SUEC 高中 Adv Maths (Statistic).pptx
 
Describing Data: Numerical Measures
Describing Data: Numerical MeasuresDescribing Data: Numerical Measures
Describing Data: Numerical Measures
 
S3 pn
S3 pnS3 pn
S3 pn
 
project designa.docx
project designa.docxproject designa.docx
project designa.docx
 
Business statistics solved numericals
Business statistics solved numericalsBusiness statistics solved numericals
Business statistics solved numericals
 
TEST & MEASUREMENT.pptx
TEST & MEASUREMENT.pptxTEST & MEASUREMENT.pptx
TEST & MEASUREMENT.pptx
 
An overview of statistics management with excel
An overview of statistics management with excelAn overview of statistics management with excel
An overview of statistics management with excel
 
HIDRAULICA DE CANALES
HIDRAULICA DE CANALESHIDRAULICA DE CANALES
HIDRAULICA DE CANALES
 
Design of super elevation :- A case study
Design of super elevation :- A case studyDesign of super elevation :- A case study
Design of super elevation :- A case study
 
Design of super elevation in Opencast Mine- a case study
Design of super elevation in Opencast Mine-  a case studyDesign of super elevation in Opencast Mine-  a case study
Design of super elevation in Opencast Mine- a case study
 

Recently uploaded

Types of Journalistic Writing Grade 8.pptx
Types of Journalistic Writing Grade 8.pptxTypes of Journalistic Writing Grade 8.pptx
Types of Journalistic Writing Grade 8.pptxEyham Joco
 
Judging the Relevance and worth of ideas part 2.pptx
Judging the Relevance  and worth of ideas part 2.pptxJudging the Relevance  and worth of ideas part 2.pptx
Judging the Relevance and worth of ideas part 2.pptxSherlyMaeNeri
 
Crayon Activity Handout For the Crayon A
Crayon Activity Handout For the Crayon ACrayon Activity Handout For the Crayon A
Crayon Activity Handout For the Crayon AUnboundStockton
 
Hierarchy of management that covers different levels of management
Hierarchy of management that covers different levels of managementHierarchy of management that covers different levels of management
Hierarchy of management that covers different levels of managementmkooblal
 
ENGLISH6-Q4-W3.pptxqurter our high choom
ENGLISH6-Q4-W3.pptxqurter our high choomENGLISH6-Q4-W3.pptxqurter our high choom
ENGLISH6-Q4-W3.pptxqurter our high choomnelietumpap1
 
ENGLISH 7_Q4_LESSON 2_ Employing a Variety of Strategies for Effective Interp...
ENGLISH 7_Q4_LESSON 2_ Employing a Variety of Strategies for Effective Interp...ENGLISH 7_Q4_LESSON 2_ Employing a Variety of Strategies for Effective Interp...
ENGLISH 7_Q4_LESSON 2_ Employing a Variety of Strategies for Effective Interp...JhezDiaz1
 
How to do quick user assign in kanban in Odoo 17 ERP
How to do quick user assign in kanban in Odoo 17 ERPHow to do quick user assign in kanban in Odoo 17 ERP
How to do quick user assign in kanban in Odoo 17 ERPCeline George
 
Keynote by Prof. Wurzer at Nordex about IP-design
Keynote by Prof. Wurzer at Nordex about IP-designKeynote by Prof. Wurzer at Nordex about IP-design
Keynote by Prof. Wurzer at Nordex about IP-designMIPLM
 
Difference Between Search & Browse Methods in Odoo 17
Difference Between Search & Browse Methods in Odoo 17Difference Between Search & Browse Methods in Odoo 17
Difference Between Search & Browse Methods in Odoo 17Celine George
 
Romantic Opera MUSIC FOR GRADE NINE pptx
Romantic Opera MUSIC FOR GRADE NINE pptxRomantic Opera MUSIC FOR GRADE NINE pptx
Romantic Opera MUSIC FOR GRADE NINE pptxsqpmdrvczh
 
Employee wellbeing at the workplace.pptx
Employee wellbeing at the workplace.pptxEmployee wellbeing at the workplace.pptx
Employee wellbeing at the workplace.pptxNirmalaLoungPoorunde1
 
What is Model Inheritance in Odoo 17 ERP
What is Model Inheritance in Odoo 17 ERPWhat is Model Inheritance in Odoo 17 ERP
What is Model Inheritance in Odoo 17 ERPCeline George
 
Procuring digital preservation CAN be quick and painless with our new dynamic...
Procuring digital preservation CAN be quick and painless with our new dynamic...Procuring digital preservation CAN be quick and painless with our new dynamic...
Procuring digital preservation CAN be quick and painless with our new dynamic...Jisc
 
DATA STRUCTURE AND ALGORITHM for beginners
DATA STRUCTURE AND ALGORITHM for beginnersDATA STRUCTURE AND ALGORITHM for beginners
DATA STRUCTURE AND ALGORITHM for beginnersSabitha Banu
 
Gas measurement O2,Co2,& ph) 04/2024.pptx
Gas measurement O2,Co2,& ph) 04/2024.pptxGas measurement O2,Co2,& ph) 04/2024.pptx
Gas measurement O2,Co2,& ph) 04/2024.pptxDr.Ibrahim Hassaan
 
Introduction to ArtificiaI Intelligence in Higher Education
Introduction to ArtificiaI Intelligence in Higher EducationIntroduction to ArtificiaI Intelligence in Higher Education
Introduction to ArtificiaI Intelligence in Higher Educationpboyjonauth
 
Full Stack Web Development Course for Beginners
Full Stack Web Development Course  for BeginnersFull Stack Web Development Course  for Beginners
Full Stack Web Development Course for BeginnersSabitha Banu
 
EPANDING THE CONTENT OF AN OUTLINE using notes.pptx
EPANDING THE CONTENT OF AN OUTLINE using notes.pptxEPANDING THE CONTENT OF AN OUTLINE using notes.pptx
EPANDING THE CONTENT OF AN OUTLINE using notes.pptxRaymartEstabillo3
 

Recently uploaded (20)

Types of Journalistic Writing Grade 8.pptx
Types of Journalistic Writing Grade 8.pptxTypes of Journalistic Writing Grade 8.pptx
Types of Journalistic Writing Grade 8.pptx
 
Judging the Relevance and worth of ideas part 2.pptx
Judging the Relevance  and worth of ideas part 2.pptxJudging the Relevance  and worth of ideas part 2.pptx
Judging the Relevance and worth of ideas part 2.pptx
 
Crayon Activity Handout For the Crayon A
Crayon Activity Handout For the Crayon ACrayon Activity Handout For the Crayon A
Crayon Activity Handout For the Crayon A
 
Hierarchy of management that covers different levels of management
Hierarchy of management that covers different levels of managementHierarchy of management that covers different levels of management
Hierarchy of management that covers different levels of management
 
ENGLISH6-Q4-W3.pptxqurter our high choom
ENGLISH6-Q4-W3.pptxqurter our high choomENGLISH6-Q4-W3.pptxqurter our high choom
ENGLISH6-Q4-W3.pptxqurter our high choom
 
Raw materials used in Herbal Cosmetics.pptx
Raw materials used in Herbal Cosmetics.pptxRaw materials used in Herbal Cosmetics.pptx
Raw materials used in Herbal Cosmetics.pptx
 
ENGLISH 7_Q4_LESSON 2_ Employing a Variety of Strategies for Effective Interp...
ENGLISH 7_Q4_LESSON 2_ Employing a Variety of Strategies for Effective Interp...ENGLISH 7_Q4_LESSON 2_ Employing a Variety of Strategies for Effective Interp...
ENGLISH 7_Q4_LESSON 2_ Employing a Variety of Strategies for Effective Interp...
 
How to do quick user assign in kanban in Odoo 17 ERP
How to do quick user assign in kanban in Odoo 17 ERPHow to do quick user assign in kanban in Odoo 17 ERP
How to do quick user assign in kanban in Odoo 17 ERP
 
Keynote by Prof. Wurzer at Nordex about IP-design
Keynote by Prof. Wurzer at Nordex about IP-designKeynote by Prof. Wurzer at Nordex about IP-design
Keynote by Prof. Wurzer at Nordex about IP-design
 
Difference Between Search & Browse Methods in Odoo 17
Difference Between Search & Browse Methods in Odoo 17Difference Between Search & Browse Methods in Odoo 17
Difference Between Search & Browse Methods in Odoo 17
 
Romantic Opera MUSIC FOR GRADE NINE pptx
Romantic Opera MUSIC FOR GRADE NINE pptxRomantic Opera MUSIC FOR GRADE NINE pptx
Romantic Opera MUSIC FOR GRADE NINE pptx
 
Model Call Girl in Bikash Puri Delhi reach out to us at 🔝9953056974🔝
Model Call Girl in Bikash Puri  Delhi reach out to us at 🔝9953056974🔝Model Call Girl in Bikash Puri  Delhi reach out to us at 🔝9953056974🔝
Model Call Girl in Bikash Puri Delhi reach out to us at 🔝9953056974🔝
 
Employee wellbeing at the workplace.pptx
Employee wellbeing at the workplace.pptxEmployee wellbeing at the workplace.pptx
Employee wellbeing at the workplace.pptx
 
What is Model Inheritance in Odoo 17 ERP
What is Model Inheritance in Odoo 17 ERPWhat is Model Inheritance in Odoo 17 ERP
What is Model Inheritance in Odoo 17 ERP
 
Procuring digital preservation CAN be quick and painless with our new dynamic...
Procuring digital preservation CAN be quick and painless with our new dynamic...Procuring digital preservation CAN be quick and painless with our new dynamic...
Procuring digital preservation CAN be quick and painless with our new dynamic...
 
DATA STRUCTURE AND ALGORITHM for beginners
DATA STRUCTURE AND ALGORITHM for beginnersDATA STRUCTURE AND ALGORITHM for beginners
DATA STRUCTURE AND ALGORITHM for beginners
 
Gas measurement O2,Co2,& ph) 04/2024.pptx
Gas measurement O2,Co2,& ph) 04/2024.pptxGas measurement O2,Co2,& ph) 04/2024.pptx
Gas measurement O2,Co2,& ph) 04/2024.pptx
 
Introduction to ArtificiaI Intelligence in Higher Education
Introduction to ArtificiaI Intelligence in Higher EducationIntroduction to ArtificiaI Intelligence in Higher Education
Introduction to ArtificiaI Intelligence in Higher Education
 
Full Stack Web Development Course for Beginners
Full Stack Web Development Course  for BeginnersFull Stack Web Development Course  for Beginners
Full Stack Web Development Course for Beginners
 
EPANDING THE CONTENT OF AN OUTLINE using notes.pptx
EPANDING THE CONTENT OF AN OUTLINE using notes.pptxEPANDING THE CONTENT OF AN OUTLINE using notes.pptx
EPANDING THE CONTENT OF AN OUTLINE using notes.pptx
 

Module 3 example 15

  • 1. Example 15: Miles Run Class Boundaries Frequency 5.5 – 10.5 1 10.5 – 15.5 2 15.5 – 20.5 3 20.5 – 25.5 5 25.5 – 30.5 4 30.5 – 35.5 3 35.5 – 40.5 2 Below is a frequency distribution of the number of miles run per week for a sample of individuals. Find the variance and standard deviation
  • 2. Example 15: Miles Run Class Boundaries Frequency 5.5 – 10.5 1 10.5 – 15.5 2 15.5 – 20.5 3 20.5 – 25.5 5 25.5 – 30.5 4 30.5 – 35.5 3 35.5 – 40.5 2 Below is a frequency distribution of the number of miles run per week for a sample of individuals. Find the variance and standard deviation : = ∑( · )    − ∑( · )    ( − 1) = =    
  • 3. Example 15: Miles Run Class Boundaries Frequency 5.5 – 10.5 1 10.5 – 15.5 2 15.5 – 20.5 3 20.5 – 25.5 5 25.5 – 30.5 4 30.5 – 35.5 3 35.5 – 40.5 2 = ∑    = 20 Below is a frequency distribution of the number of miles run per week for a sample of individuals. Find the variance and standard deviation : = ∑( · )    − ∑( · )    ( − 1) = =    
  • 4. Example 15: Miles Run Class Boundaries Frequency 5.5 – 10.5 1 10.5 – 15.5 2 15.5 – 20.5 3 20.5 – 25.5 5 25.5 – 30.5 4 30.5 – 35.5 3 35.5 – 40.5 2 = ∑    = 20 Below is a frequency distribution of the number of miles run per week for a sample of individuals. Find the variance and standard deviation : = ∑( · )    − ∑( · )    ( − 1) =
  • 5. Example 15: Miles Run Class Boundaries Frequency x, Midpoint 5.5 – 10.5 1 10.5 – 15.5 2 15.5 – 20.5 3 20.5 – 25.5 5 25.5 – 30.5 4 30.5 – 35.5 3 35.5 – 40.5 2 = ∑    = 20 Below is a frequency distribution of the number of miles run per week for a sample of individuals. Find the variance and standard deviation : = ∑( · )    − ∑( · )    ( − 1) =
  • 6. Example 15: Miles Run Class Boundaries Frequency x, Midpoint 5.5 – 10.5 1 (5.5+10.5)/2 = 8 10.5 – 15.5 2 15.5 – 20.5 3 20.5 – 25.5 5 25.5 – 30.5 4 30.5 – 35.5 3 35.5 – 40.5 2 = ∑    = 20 Below is a frequency distribution of the number of miles run per week for a sample of individuals. Find the variance and standard deviation : = ∑( · )    − ∑( · )    ( − 1) =
  • 7. Example 15: Miles Run Class Boundaries Frequency x, Midpoint 5.5 – 10.5 1 (5.5+10.5)/2 = 8 10.5 – 15.5 2 (10.5+15.5)/2 = 13 15.5 – 20.5 3 20.5 – 25.5 5 25.5 – 30.5 4 30.5 – 35.5 3 35.5 – 40.5 2 = ∑    = 20 Below is a frequency distribution of the number of miles run per week for a sample of individuals. Find the variance and standard deviation : = ∑( · )    − ∑( · )    ( − 1) =
  • 8. Example 15: Miles Run Class Boundaries Frequency x, Midpoint 5.5 – 10.5 1 (5.5+10.5)/2 = 8 10.5 – 15.5 2 (10.5+15.5)/2 = 13 15.5 – 20.5 3 (15.5+20.5)/2 = 18 20.5 – 25.5 5 25.5 – 30.5 4 30.5 – 35.5 3 35.5 – 40.5 2 = ∑    = 20 Below is a frequency distribution of the number of miles run per week for a sample of individuals. Find the variance and standard deviation : = ∑( · )    − ∑( · )    ( − 1) =
  • 9. Example 15: Miles Run Class Boundaries Frequency x, Midpoint 5.5 – 10.5 1 (5.5+10.5)/2 = 8 10.5 – 15.5 2 (10.5+15.5)/2 = 13 15.5 – 20.5 3 (15.5+20.5)/2 = 18 20.5 – 25.5 5 (20.5+25.5)/2 = 23 25.5 – 30.5 4 30.5 – 35.5 3 35.5 – 40.5 2 = ∑    = 20 Below is a frequency distribution of the number of miles run per week for a sample of individuals. Find the variance and standard deviation : = ∑( · )    − ∑( · )    ( − 1) =
  • 10. Example 15: Miles Run Class Boundaries Frequency x, Midpoint 5.5 – 10.5 1 (5.5+10.5)/2 = 8 10.5 – 15.5 2 (10.5+15.5)/2 = 13 15.5 – 20.5 3 (15.5+20.5)/2 = 18 20.5 – 25.5 5 (20.5+25.5)/2 = 23 25.5 – 30.5 4 (25.5+30.5)/2 = 28 30.5 – 35.5 3 35.5 – 40.5 2 = ∑    = 20 Below is a frequency distribution of the number of miles run per week for a sample of individuals. Find the variance and standard deviation : = ∑( · )    − ∑( · )    ( − 1) =
  • 11. Example 15: Miles Run Class Boundaries Frequency x, Midpoint 5.5 – 10.5 1 (5.5+10.5)/2 = 8 10.5 – 15.5 2 (10.5+15.5)/2 = 13 15.5 – 20.5 3 (15.5+20.5)/2 = 18 20.5 – 25.5 5 (20.5+25.5)/2 = 23 25.5 – 30.5 4 (25.5+30.5)/2 = 28 30.5 – 35.5 3 (30.5+35.5)/2 = 33 35.5 – 40.5 2 = ∑    = 20 Below is a frequency distribution of the number of miles run per week for a sample of individuals. Find the variance and standard deviation : = ∑( · )    − ∑( · )    ( − 1) =
  • 12. Example 15: Miles Run Class Boundaries Frequency x, Midpoint 5.5 – 10.5 1 (5.5+10.5)/2 = 8 10.5 – 15.5 2 (10.5+15.5)/2 = 13 15.5 – 20.5 3 (15.5+20.5)/2 = 18 20.5 – 25.5 5 (20.5+25.5)/2 = 23 25.5 – 30.5 4 (25.5+30.5)/2 = 28 30.5 – 35.5 3 (30.5+35.5)/2 = 33 35.5 – 40.5 2 (35.5+40.5)/2 = 38 = ∑    = 20 Below is a frequency distribution of the number of miles run per week for a sample of individuals. Find the variance and standard deviation : = ∑( · )    − ∑( · )    ( − 1) =
  • 13. Example 15: Miles Run Class Boundaries Frequency x, Midpoint 5.5 – 10.5 1 (5.5+10.5)/2 = 8 10.5 – 15.5 2 (10.5+15.5)/2 = 13 15.5 – 20.5 3 (15.5+20.5)/2 = 18 20.5 – 25.5 5 (20.5+25.5)/2 = 23 25.5 – 30.5 4 (25.5+30.5)/2 = 28 30.5 – 35.5 3 (30.5+35.5)/2 = 33 35.5 – 40.5 2 (35.5+40.5)/2 = 38 = ∑    = 20 Below is a frequency distribution of the number of miles run per week for a sample of individuals. Find the variance and standard deviation : = ∑( · )    − ∑( · )    ( − 1)
  • 14. Example 15: Miles Run Class Boundaries Frequency x, Midpoint f∙x 5.5 – 10.5 1 (5.5+10.5)/2 = 8 10.5 – 15.5 2 (10.5+15.5)/2 = 13 15.5 – 20.5 3 (15.5+20.5)/2 = 18 20.5 – 25.5 5 (20.5+25.5)/2 = 23 25.5 – 30.5 4 (25.5+30.5)/2 = 28 30.5 – 35.5 3 (30.5+35.5)/2 = 33 35.5 – 40.5 2 (35.5+40.5)/2 = 38 = ∑    = 20 Below is a frequency distribution of the number of miles run per week for a sample of individuals. Find the variance and standard deviation : = ∑( · )    − ∑( · )    ( − 1)
  • 15. Example 15: Miles Run Class Boundaries Frequency x, Midpoint f∙x 5.5 – 10.5 1 (5.5+10.5)/2 = 8 1∙8 = 8 10.5 – 15.5 2 (10.5+15.5)/2 = 13 15.5 – 20.5 3 (15.5+20.5)/2 = 18 20.5 – 25.5 5 (20.5+25.5)/2 = 23 25.5 – 30.5 4 (25.5+30.5)/2 = 28 30.5 – 35.5 3 (30.5+35.5)/2 = 33 35.5 – 40.5 2 (35.5+40.5)/2 = 38 = ∑    = 20 Below is a frequency distribution of the number of miles run per week for a sample of individuals. Find the variance and standard deviation : = ∑( · )    − ∑( · )    ( − 1)
  • 16. Example 15: Miles Run Class Boundaries Frequency x, Midpoint f∙x 5.5 – 10.5 1 (5.5+10.5)/2 = 8 1∙8 = 8 10.5 – 15.5 2 (10.5+15.5)/2 = 13 2∙13 = 26 15.5 – 20.5 3 (15.5+20.5)/2 = 18 20.5 – 25.5 5 (20.5+25.5)/2 = 23 25.5 – 30.5 4 (25.5+30.5)/2 = 28 30.5 – 35.5 3 (30.5+35.5)/2 = 33 35.5 – 40.5 2 (35.5+40.5)/2 = 38 = ∑    = 20 Below is a frequency distribution of the number of miles run per week for a sample of individuals. Find the variance and standard deviation : = ∑( · )    − ∑( · )    ( − 1)
  • 17. Example 15: Miles Run Class Boundaries Frequency x, Midpoint f∙x 5.5 – 10.5 1 (5.5+10.5)/2 = 8 1∙8 = 8 10.5 – 15.5 2 (10.5+15.5)/2 = 13 2∙13 = 26 15.5 – 20.5 3 (15.5+20.5)/2 = 18 3∙18 = 54 20.5 – 25.5 5 (20.5+25.5)/2 = 23 25.5 – 30.5 4 (25.5+30.5)/2 = 28 30.5 – 35.5 3 (30.5+35.5)/2 = 33 35.5 – 40.5 2 (35.5+40.5)/2 = 38 = ∑    = 20 Below is a frequency distribution of the number of miles run per week for a sample of individuals. Find the variance and standard deviation : = ∑( · )    − ∑( · )    ( − 1)
  • 18. Example 15: Miles Run Class Boundaries Frequency x, Midpoint f∙x 5.5 – 10.5 1 (5.5+10.5)/2 = 8 1∙8 = 8 10.5 – 15.5 2 (10.5+15.5)/2 = 13 2∙13 = 26 15.5 – 20.5 3 (15.5+20.5)/2 = 18 3∙18 = 54 20.5 – 25.5 5 (20.5+25.5)/2 = 23 5∙23 = 115 25.5 – 30.5 4 (25.5+30.5)/2 = 28 30.5 – 35.5 3 (30.5+35.5)/2 = 33 35.5 – 40.5 2 (35.5+40.5)/2 = 38 = ∑    = 20 Below is a frequency distribution of the number of miles run per week for a sample of individuals. Find the variance and standard deviation : = ∑( · )    − ∑( · )    ( − 1)
  • 19. Example 15: Miles Run Class Boundaries Frequency x, Midpoint f∙x 5.5 – 10.5 1 (5.5+10.5)/2 = 8 1∙8 = 8 10.5 – 15.5 2 (10.5+15.5)/2 = 13 2∙13 = 26 15.5 – 20.5 3 (15.5+20.5)/2 = 18 3∙18 = 54 20.5 – 25.5 5 (20.5+25.5)/2 = 23 5∙23 = 115 25.5 – 30.5 4 (25.5+30.5)/2 = 28 4∙28 = 112 30.5 – 35.5 3 (30.5+35.5)/2 = 33 35.5 – 40.5 2 (35.5+40.5)/2 = 38 = ∑    = 20 Below is a frequency distribution of the number of miles run per week for a sample of individuals. Find the variance and standard deviation : = ∑( · )    − ∑( · )    ( − 1)
  • 20. Example 15: Miles Run Class Boundaries Frequency x, Midpoint f∙x 5.5 – 10.5 1 (5.5+10.5)/2 = 8 1∙8 = 8 10.5 – 15.5 2 (10.5+15.5)/2 = 13 2∙13 = 26 15.5 – 20.5 3 (15.5+20.5)/2 = 18 3∙18 = 54 20.5 – 25.5 5 (20.5+25.5)/2 = 23 5∙23 = 115 25.5 – 30.5 4 (25.5+30.5)/2 = 28 4∙28 = 112 30.5 – 35.5 3 (30.5+35.5)/2 = 33 3∙33 = 99 35.5 – 40.5 2 (35.5+40.5)/2 = 38 2∙38 = 76 = ∑    = 20 Below is a frequency distribution of the number of miles run per week for a sample of individuals. Find the variance and standard deviation : = ∑( · )    − ∑( · )    ( − 1)
  • 21. Example 15: Miles Run Class Boundaries Frequency x, Midpoint f∙x 5.5 – 10.5 1 (5.5+10.5)/2 = 8 1∙8 = 8 10.5 – 15.5 2 (10.5+15.5)/2 = 13 2∙13 = 26 15.5 – 20.5 3 (15.5+20.5)/2 = 18 3∙18 = 54 20.5 – 25.5 5 (20.5+25.5)/2 = 23 5∙23 = 115 25.5 – 30.5 4 (25.5+30.5)/2 = 28 4∙28 = 112 30.5 – 35.5 3 (30.5+35.5)/2 = 33 3∙33 = 99 35.5 – 40.5 2 (35.5+40.5)/2 = 38 2∙38 = 76 = ∑    = 20 Below is a frequency distribution of the number of miles run per week for a sample of individuals. Find the variance and standard deviation : = ∑( · )    − ∑( · )    ( − 1) ( · )
  • 22. Example 15: Miles Run Class Boundaries Frequency x, Midpoint f∙x 5.5 – 10.5 1 (5.5+10.5)/2 = 8 1∙8 = 8 10.5 – 15.5 2 (10.5+15.5)/2 = 13 2∙13 = 26 15.5 – 20.5 3 (15.5+20.5)/2 = 18 3∙18 = 54 20.5 – 25.5 5 (20.5+25.5)/2 = 23 5∙23 = 115 25.5 – 30.5 4 (25.5+30.5)/2 = 28 4∙28 = 112 30.5 – 35.5 3 (30.5+35.5)/2 = 33 3∙33 = 99 35.5 – 40.5 2 (35.5+40.5)/2 = 38 2∙38 = 76 = ∑    = 20 ∑( · )    = 490 Below is a frequency distribution of the number of miles run per week for a sample of individuals. Find the variance and standard deviation : = ∑( · )    − ∑( · )    ( − 1) ( · )
  • 23. Example 15: Miles Run Class Boundaries Frequency x, Midpoint f∙x 5.5 – 10.5 1 (5.5+10.5)/2 = 8 1∙8 = 8 10.5 – 15.5 2 (10.5+15.5)/2 = 13 2∙13 = 26 15.5 – 20.5 3 (15.5+20.5)/2 = 18 3∙18 = 54 20.5 – 25.5 5 (20.5+25.5)/2 = 23 5∙23 = 115 25.5 – 30.5 4 (25.5+30.5)/2 = 28 4∙28 = 112 30.5 – 35.5 3 (30.5+35.5)/2 = 33 3∙33 = 99 35.5 – 40.5 2 (35.5+40.5)/2 = 38 2∙38 = 76 = ∑    = 20 ∑( · )    = 490 Below is a frequency distribution of the number of miles run per week for a sample of individuals. Find the variance and standard deviation : = ∑( · )    − ∑( · )    ( − 1) ,
  • 24. Example 15: Miles Run Class Boundaries Frequency x, Midpoint f∙x x2 5.5 – 10.5 1 (5.5+10.5)/2 = 8 1∙8 = 8 10.5 – 15.5 2 (10.5+15.5)/2 = 13 2∙13 = 26 15.5 – 20.5 3 (15.5+20.5)/2 = 18 3∙18 = 54 20.5 – 25.5 5 (20.5+25.5)/2 = 23 5∙23 = 115 25.5 – 30.5 4 (25.5+30.5)/2 = 28 4∙28 = 112 30.5 – 35.5 3 (30.5+35.5)/2 = 33 3∙33 = 99 35.5 – 40.5 2 (35.5+40.5)/2 = 38 2∙38 = 76 = ∑    = 20 ∑( · )    = 490 Below is a frequency distribution of the number of miles run per week for a sample of individuals. Find the variance and standard deviation : = ∑( · )    − ∑( · )    ( − 1) ,
  • 25. Example 15: Miles Run Class Boundaries Frequency x, Midpoint f∙x x2 5.5 – 10.5 1 (5.5+10.5)/2 = 8 1∙8 = 8 82 = 64 10.5 – 15.5 2 (10.5+15.5)/2 = 13 2∙13 = 26 15.5 – 20.5 3 (15.5+20.5)/2 = 18 3∙18 = 54 20.5 – 25.5 5 (20.5+25.5)/2 = 23 5∙23 = 115 25.5 – 30.5 4 (25.5+30.5)/2 = 28 4∙28 = 112 30.5 – 35.5 3 (30.5+35.5)/2 = 33 3∙33 = 99 35.5 – 40.5 2 (35.5+40.5)/2 = 38 2∙38 = 76 = ∑    = 20 ∑( · )    = 490 Below is a frequency distribution of the number of miles run per week for a sample of individuals. Find the variance and standard deviation : = ∑( · )    − ∑( · )    ( − 1) ,
  • 26. Example 15: Miles Run Class Boundaries Frequency x, Midpoint f∙x x2 5.5 – 10.5 1 (5.5+10.5)/2 = 8 1∙8 = 8 82 = 64 10.5 – 15.5 2 (10.5+15.5)/2 = 13 2∙13 = 26 132 = 169 15.5 – 20.5 3 (15.5+20.5)/2 = 18 3∙18 = 54 20.5 – 25.5 5 (20.5+25.5)/2 = 23 5∙23 = 115 25.5 – 30.5 4 (25.5+30.5)/2 = 28 4∙28 = 112 30.5 – 35.5 3 (30.5+35.5)/2 = 33 3∙33 = 99 35.5 – 40.5 2 (35.5+40.5)/2 = 38 2∙38 = 76 = ∑    = 20 ∑( · )    = 490 Below is a frequency distribution of the number of miles run per week for a sample of individuals. Find the variance and standard deviation : = ∑( · )    − ∑( · )    ( − 1) ,
  • 27. Example 15: Miles Run Class Boundaries Frequency x, Midpoint f∙x x2 5.5 – 10.5 1 (5.5+10.5)/2 = 8 1∙8 = 8 82 = 64 10.5 – 15.5 2 (10.5+15.5)/2 = 13 2∙13 = 26 132 = 169 15.5 – 20.5 3 (15.5+20.5)/2 = 18 3∙18 = 54 182 = 324 20.5 – 25.5 5 (20.5+25.5)/2 = 23 5∙23 = 115 25.5 – 30.5 4 (25.5+30.5)/2 = 28 4∙28 = 112 30.5 – 35.5 3 (30.5+35.5)/2 = 33 3∙33 = 99 35.5 – 40.5 2 (35.5+40.5)/2 = 38 2∙38 = 76 = ∑    = 20 ∑( · )    = 490 Below is a frequency distribution of the number of miles run per week for a sample of individuals. Find the variance and standard deviation : = ∑( · )    − ∑( · )    ( − 1) ,
  • 28. Example 15: Miles Run Class Boundaries Frequency x, Midpoint f∙x x2 5.5 – 10.5 1 (5.5+10.5)/2 = 8 1∙8 = 8 82 = 64 10.5 – 15.5 2 (10.5+15.5)/2 = 13 2∙13 = 26 132 = 169 15.5 – 20.5 3 (15.5+20.5)/2 = 18 3∙18 = 54 182 = 324 20.5 – 25.5 5 (20.5+25.5)/2 = 23 5∙23 = 115 232 = 529 25.5 – 30.5 4 (25.5+30.5)/2 = 28 4∙28 = 112 282 = 784 30.5 – 35.5 3 (30.5+35.5)/2 = 33 3∙33 = 99 35.5 – 40.5 2 (35.5+40.5)/2 = 38 2∙38 = 76 = ∑    = 20 ∑( · )    = 490 Below is a frequency distribution of the number of miles run per week for a sample of individuals. Find the variance and standard deviation : = ∑( · )    − ∑( · )    ( − 1) ,
  • 29. Example 15: Miles Run Class Boundaries Frequency x, Midpoint f∙x x2 5.5 – 10.5 1 (5.5+10.5)/2 = 8 1∙8 = 8 82 = 64 10.5 – 15.5 2 (10.5+15.5)/2 = 13 2∙13 = 26 132 = 169 15.5 – 20.5 3 (15.5+20.5)/2 = 18 3∙18 = 54 182 = 324 20.5 – 25.5 5 (20.5+25.5)/2 = 23 5∙23 = 115 232 = 529 25.5 – 30.5 4 (25.5+30.5)/2 = 28 4∙28 = 112 282 = 784 30.5 – 35.5 3 (30.5+35.5)/2 = 33 3∙33 = 99 332 = 1089 35.5 – 40.5 2 (35.5+40.5)/2 = 38 2∙38 = 76 = ∑    = 20 ∑( · )    = 490 Below is a frequency distribution of the number of miles run per week for a sample of individuals. Find the variance and standard deviation : = ∑( · )    − ∑( · )    ( − 1) ,
  • 30. Example 15: Miles Run Class Boundaries Frequency x, Midpoint f∙x x2 5.5 – 10.5 1 (5.5+10.5)/2 = 8 1∙8 = 8 82 = 64 10.5 – 15.5 2 (10.5+15.5)/2 = 13 2∙13 = 26 132 = 169 15.5 – 20.5 3 (15.5+20.5)/2 = 18 3∙18 = 54 182 = 324 20.5 – 25.5 5 (20.5+25.5)/2 = 23 5∙23 = 115 232 = 529 25.5 – 30.5 4 (25.5+30.5)/2 = 28 4∙28 = 112 282 = 784 30.5 – 35.5 3 (30.5+35.5)/2 = 33 3∙33 = 99 332 = 1089 35.5 – 40.5 2 (35.5+40.5)/2 = 38 2∙38 = 76 382 = 1444 = ∑    = 20 ∑( · )    = 490 Below is a frequency distribution of the number of miles run per week for a sample of individuals. Find the variance and standard deviation : = ∑( · )    − ∑( · )    ( − 1) ,
  • 31. Example 15: Miles Run Class Boundaries Frequency x, Midpoint f∙x x2 5.5 – 10.5 1 (5.5+10.5)/2 = 8 1∙8 = 8 82 = 64 10.5 – 15.5 2 (10.5+15.5)/2 = 13 2∙13 = 26 132 = 169 15.5 – 20.5 3 (15.5+20.5)/2 = 18 3∙18 = 54 182 = 324 20.5 – 25.5 5 (20.5+25.5)/2 = 23 5∙23 = 115 232 = 529 25.5 – 30.5 4 (25.5+30.5)/2 = 28 4∙28 = 112 282 = 784 30.5 – 35.5 3 (30.5+35.5)/2 = 33 3∙33 = 99 332 = 1089 35.5 – 40.5 2 (35.5+40.5)/2 = 38 2∙38 = 76 382 = 1444 = ∑    = 20 ∑( · )    = 490 Below is a frequency distribution of the number of miles run per week for a sample of individuals. Find the variance and standard deviation : = ∑( · )    − ∑( · )    ( − 1) , ( · )
  • 32. Example 15: Miles Run Class Boundaries Frequency x, Midpoint f∙x x2 f∙x2 5.5 – 10.5 1 (5.5+10.5)/2 = 8 1∙8 = 8 82 = 64 10.5 – 15.5 2 (10.5+15.5)/2 = 13 2∙13 = 26 132 = 169 15.5 – 20.5 3 (15.5+20.5)/2 = 18 3∙18 = 54 182 = 324 20.5 – 25.5 5 (20.5+25.5)/2 = 23 5∙23 = 115 232 = 529 25.5 – 30.5 4 (25.5+30.5)/2 = 28 4∙28 = 112 282 = 784 30.5 – 35.5 3 (30.5+35.5)/2 = 33 3∙33 = 99 332 = 1089 35.5 – 40.5 2 (35.5+40.5)/2 = 38 2∙38 = 76 382 = 1444 = ∑    = 20 ∑( · )    = 490 Below is a frequency distribution of the number of miles run per week for a sample of individuals. Find the variance and standard deviation : = ∑( · )    − ∑( · )    ( − 1) , ( · )
  • 33. Example 15: Miles Run Class Boundaries Frequency x, Midpoint f∙x x2 f∙x2 5.5 – 10.5 1 (5.5+10.5)/2 = 8 1∙8 = 8 82 = 64 1∙64 = 64 10.5 – 15.5 2 (10.5+15.5)/2 = 13 2∙13 = 26 132 = 169 15.5 – 20.5 3 (15.5+20.5)/2 = 18 3∙18 = 54 182 = 324 20.5 – 25.5 5 (20.5+25.5)/2 = 23 5∙23 = 115 232 = 529 25.5 – 30.5 4 (25.5+30.5)/2 = 28 4∙28 = 112 282 = 784 30.5 – 35.5 3 (30.5+35.5)/2 = 33 3∙33 = 99 332 = 1089 35.5 – 40.5 2 (35.5+40.5)/2 = 38 2∙38 = 76 382 = 1444 = ∑    = 20 ∑( · )    = 490 Below is a frequency distribution of the number of miles run per week for a sample of individuals. Find the variance and standard deviation : = ∑( · )    − ∑( · )    ( − 1) , ( · )
  • 34. Example 15: Miles Run Class Boundaries Frequency x, Midpoint f∙x x2 f∙x2 5.5 – 10.5 1 (5.5+10.5)/2 = 8 1∙8 = 8 82 = 64 1∙64 = 64 10.5 – 15.5 2 (10.5+15.5)/2 = 13 2∙13 = 26 132 = 169 2∙169 = 338 15.5 – 20.5 3 (15.5+20.5)/2 = 18 3∙18 = 54 182 = 324 20.5 – 25.5 5 (20.5+25.5)/2 = 23 5∙23 = 115 232 = 529 25.5 – 30.5 4 (25.5+30.5)/2 = 28 4∙28 = 112 282 = 784 30.5 – 35.5 3 (30.5+35.5)/2 = 33 3∙33 = 99 332 = 1089 35.5 – 40.5 2 (35.5+40.5)/2 = 38 2∙38 = 76 382 = 1444 = ∑    = 20 ∑( · )    = 490 Below is a frequency distribution of the number of miles run per week for a sample of individuals. Find the variance and standard deviation : = ∑( · )    − ∑( · )    ( − 1) , ( · )
  • 35. Example 15: Miles Run Class Boundaries Frequency x, Midpoint f∙x x2 f∙x2 5.5 – 10.5 1 (5.5+10.5)/2 = 8 1∙8 = 8 82 = 64 1∙64 = 64 10.5 – 15.5 2 (10.5+15.5)/2 = 13 2∙13 = 26 132 = 169 2∙169 = 338 15.5 – 20.5 3 (15.5+20.5)/2 = 18 3∙18 = 54 182 = 324 3∙324 = 972 20.5 – 25.5 5 (20.5+25.5)/2 = 23 5∙23 = 115 232 = 529 25.5 – 30.5 4 (25.5+30.5)/2 = 28 4∙28 = 112 282 = 784 30.5 – 35.5 3 (30.5+35.5)/2 = 33 3∙33 = 99 332 = 1089 35.5 – 40.5 2 (35.5+40.5)/2 = 38 2∙38 = 76 382 = 1444 = ∑    = 20 ∑( · )    = 490 Below is a frequency distribution of the number of miles run per week for a sample of individuals. Find the variance and standard deviation : = ∑( · )    − ∑( · )    ( − 1) , ( · )
  • 36. Example 15: Miles Run Class Boundaries Frequency x, Midpoint f∙x x2 f∙x2 5.5 – 10.5 1 (5.5+10.5)/2 = 8 1∙8 = 8 82 = 64 1∙64 = 64 10.5 – 15.5 2 (10.5+15.5)/2 = 13 2∙13 = 26 132 = 169 2∙169 = 338 15.5 – 20.5 3 (15.5+20.5)/2 = 18 3∙18 = 54 182 = 324 3∙324 = 972 20.5 – 25.5 5 (20.5+25.5)/2 = 23 5∙23 = 115 232 = 529 5∙529 = 2645 25.5 – 30.5 4 (25.5+30.5)/2 = 28 4∙28 = 112 282 = 784 30.5 – 35.5 3 (30.5+35.5)/2 = 33 3∙33 = 99 332 = 1089 35.5 – 40.5 2 (35.5+40.5)/2 = 38 2∙38 = 76 382 = 1444 = ∑    = 20 ∑( · )    = 490 Below is a frequency distribution of the number of miles run per week for a sample of individuals. Find the variance and standard deviation : = ∑( · )    − ∑( · )    ( − 1) , ( · )
  • 37. Example 15: Miles Run Class Boundaries Frequency x, Midpoint f∙x x2 f∙x2 5.5 – 10.5 1 (5.5+10.5)/2 = 8 1∙8 = 8 82 = 64 1∙64 = 64 10.5 – 15.5 2 (10.5+15.5)/2 = 13 2∙13 = 26 132 = 169 2∙169 = 338 15.5 – 20.5 3 (15.5+20.5)/2 = 18 3∙18 = 54 182 = 324 3∙324 = 972 20.5 – 25.5 5 (20.5+25.5)/2 = 23 5∙23 = 115 232 = 529 5∙529 = 2645 25.5 – 30.5 4 (25.5+30.5)/2 = 28 4∙28 = 112 282 = 784 4∙784 = 3136 30.5 – 35.5 3 (30.5+35.5)/2 = 33 3∙33 = 99 332 = 1089 35.5 – 40.5 2 (35.5+40.5)/2 = 38 2∙38 = 76 382 = 1444 = ∑    = 20 ∑( · )    = 490 Below is a frequency distribution of the number of miles run per week for a sample of individuals. Find the variance and standard deviation : = ∑( · )    − ∑( · )    ( − 1) , ( · )
  • 38. Example 15: Miles Run Class Boundaries Frequency x, Midpoint f∙x x2 f∙x2 5.5 – 10.5 1 (5.5+10.5)/2 = 8 1∙8 = 8 82 = 64 1∙64 = 64 10.5 – 15.5 2 (10.5+15.5)/2 = 13 2∙13 = 26 132 = 169 2∙169 = 338 15.5 – 20.5 3 (15.5+20.5)/2 = 18 3∙18 = 54 182 = 324 3∙324 = 972 20.5 – 25.5 5 (20.5+25.5)/2 = 23 5∙23 = 115 232 = 529 5∙529 = 2645 25.5 – 30.5 4 (25.5+30.5)/2 = 28 4∙28 = 112 282 = 784 4∙784 = 3136 30.5 – 35.5 3 (30.5+35.5)/2 = 33 3∙33 = 99 332 = 1089 3∙1089 = 3267 35.5 – 40.5 2 (35.5+40.5)/2 = 38 2∙38 = 76 382 = 1444 = ∑    = 20 ∑( · )    = 490 Below is a frequency distribution of the number of miles run per week for a sample of individuals. Find the variance and standard deviation : = ∑( · )    − ∑( · )    ( − 1) , ( · )
  • 39. Example 15: Miles Run Class Boundaries Frequency x, Midpoint f∙x x2 f∙x2 5.5 – 10.5 1 (5.5+10.5)/2 = 8 1∙8 = 8 82 = 64 1∙64 = 64 10.5 – 15.5 2 (10.5+15.5)/2 = 13 2∙13 = 26 132 = 169 2∙169 = 338 15.5 – 20.5 3 (15.5+20.5)/2 = 18 3∙18 = 54 182 = 324 3∙324 = 972 20.5 – 25.5 5 (20.5+25.5)/2 = 23 5∙23 = 115 232 = 529 5∙529 = 2645 25.5 – 30.5 4 (25.5+30.5)/2 = 28 4∙28 = 112 282 = 784 4∙784 = 3136 30.5 – 35.5 3 (30.5+35.5)/2 = 33 3∙33 = 99 332 = 1089 3∙1089 = 3267 35.5 – 40.5 2 (35.5+40.5)/2 = 38 2∙38 = 76 382 = 1444 2∙1444 = 2888 = ∑    = 20 ∑( · )    = 490 Below is a frequency distribution of the number of miles run per week for a sample of individuals. Find the variance and standard deviation : = ∑( · )    − ∑( · )    ( − 1) , ( · )
  • 40. Example 15: Miles Run Class Boundaries Frequency x, Midpoint f∙x x2 f∙x2 5.5 – 10.5 1 (5.5+10.5)/2 = 8 1∙8 = 8 82 = 64 1∙64 = 64 10.5 – 15.5 2 (10.5+15.5)/2 = 13 2∙13 = 26 132 = 169 2∙169 = 338 15.5 – 20.5 3 (15.5+20.5)/2 = 18 3∙18 = 54 182 = 324 3∙324 = 972 20.5 – 25.5 5 (20.5+25.5)/2 = 23 5∙23 = 115 232 = 529 5∙529 = 2645 25.5 – 30.5 4 (25.5+30.5)/2 = 28 4∙28 = 112 282 = 784 4∙784 = 3136 30.5 – 35.5 3 (30.5+35.5)/2 = 33 3∙33 = 99 332 = 1089 3∙1089 = 3267 35.5 – 40.5 2 (35.5+40.5)/2 = 38 2∙38 = 76 382 = 1444 2∙1444 = 2888 = ∑    = 20 ∑( · )    = 490 Below is a frequency distribution of the number of miles run per week for a sample of individuals. Find the variance and standard deviation : = ∑( · )    − ∑( · )    ( − 1) ( · )
  • 41. Example 15: Miles Run Class Boundaries Frequency x, Midpoint f∙x x2 f∙x2 5.5 – 10.5 1 (5.5+10.5)/2 = 8 1∙8 = 8 82 = 64 1∙64 = 64 10.5 – 15.5 2 (10.5+15.5)/2 = 13 2∙13 = 26 132 = 169 2∙169 = 338 15.5 – 20.5 3 (15.5+20.5)/2 = 18 3∙18 = 54 182 = 324 3∙324 = 972 20.5 – 25.5 5 (20.5+25.5)/2 = 23 5∙23 = 115 232 = 529 5∙529 = 2645 25.5 – 30.5 4 (25.5+30.5)/2 = 28 4∙28 = 112 282 = 784 4∙784 = 3136 30.5 – 35.5 3 (30.5+35.5)/2 = 33 3∙33 = 99 332 = 1089 3∙1089 = 3267 35.5 – 40.5 2 (35.5+40.5)/2 = 38 2∙38 = 76 382 = 1444 2∙1444 = 2888 = ∑    = 20 ∑( · )    = 490 ∑( · 2)    = 13310 Below is a frequency distribution of the number of miles run per week for a sample of individuals. Find the variance and standard deviation : = ∑( · )    − ∑( · )    ( − 1) ( · )
  • 42. Example 15: Miles Run Class Boundaries Frequency x, Midpoint f∙x x2 f∙x2 5.5 – 10.5 1 (5.5+10.5)/2 = 8 1∙8 = 8 82 = 64 1∙64 = 64 10.5 – 15.5 2 (10.5+15.5)/2 = 13 2∙13 = 26 132 = 169 2∙169 = 338 15.5 – 20.5 3 (15.5+20.5)/2 = 18 3∙18 = 54 182 = 324 3∙324 = 972 20.5 – 25.5 5 (20.5+25.5)/2 = 23 5∙23 = 115 232 = 529 5∙529 = 2645 25.5 – 30.5 4 (25.5+30.5)/2 = 28 4∙28 = 112 282 = 784 4∙784 = 3136 30.5 – 35.5 3 (30.5+35.5)/2 = 33 3∙33 = 99 332 = 1089 3∙1089 = 3267 35.5 – 40.5 2 (35.5+40.5)/2 = 38 2∙38 = 76 382 = 1444 2∙1444 = 2888 = ∑    = 20 ∑( · )    = 490 ∑( · 2)    = 13310 Below is a frequency distribution of the number of miles run per week for a sample of individuals. Find the variance and standard deviation : = ∑( · )    − ∑( · )    ( − 1) = 20 13310 − (490) 20(19) = 266200 − 240100 380 = 26100 380 ≈ 68.7
  • 43. Example 15: Miles Run Class Boundaries Frequency x, Midpoint f∙x x2 f∙x2 5.5 – 10.5 1 (5.5+10.5)/2 = 8 1∙8 = 8 82 = 64 1∙64 = 64 10.5 – 15.5 2 (10.5+15.5)/2 = 13 2∙13 = 26 132 = 169 2∙169 = 338 15.5 – 20.5 3 (15.5+20.5)/2 = 18 3∙18 = 54 182 = 324 3∙324 = 972 20.5 – 25.5 5 (20.5+25.5)/2 = 23 5∙23 = 115 232 = 529 5∙529 = 2645 25.5 – 30.5 4 (25.5+30.5)/2 = 28 4∙28 = 112 282 = 784 4∙784 = 3136 30.5 – 35.5 3 (30.5+35.5)/2 = 33 3∙33 = 99 332 = 1089 3∙1089 = 3267 35.5 – 40.5 2 (35.5+40.5)/2 = 38 2∙38 = 76 382 = 1444 2∙1444 = 2888 = ∑    = 20 ∑( · )    = 490 ∑( · 2)    = 13310 Below is a frequency distribution of the number of miles run per week for a sample of individuals. Find the variance and standard deviation : = 26100 380 ≈ 68.7
  • 44. Example 15: Miles Run Class Boundaries Frequency x, Midpoint f∙x x2 f∙x2 5.5 – 10.5 1 (5.5+10.5)/2 = 8 1∙8 = 8 82 = 64 1∙64 = 64 10.5 – 15.5 2 (10.5+15.5)/2 = 13 2∙13 = 26 132 = 169 2∙169 = 338 15.5 – 20.5 3 (15.5+20.5)/2 = 18 3∙18 = 54 182 = 324 3∙324 = 972 20.5 – 25.5 5 (20.5+25.5)/2 = 23 5∙23 = 115 232 = 529 5∙529 = 2645 25.5 – 30.5 4 (25.5+30.5)/2 = 28 4∙28 = 112 282 = 784 4∙784 = 3136 30.5 – 35.5 3 (30.5+35.5)/2 = 33 3∙33 = 99 332 = 1089 3∙1089 = 3267 35.5 – 40.5 2 (35.5+40.5)/2 = 38 2∙38 = 76 382 = 1444 2∙1444 = 2888 = ∑    = 20 ∑( · )    = 490 ∑( · 2)    = 13310 Below is a frequency distribution of the number of miles run per week for a sample of individuals. Find the variance and standard deviation : = 26100 380 ≈ 68.7 : =   = 26100 380   ≈ 8.3