INTRODUCTION
Correlation Analysis
It examinesthe relationship among two or more than two variables
Regression Analysis
It shows the changes in one variable when there is a change in other variable.
In regression changes in first variable leads to change in second variable, but changes
in second variable do not leads to changes in first variable. Hence, first variable is
termed as Independent variable whereas second variable is called as Dependent
variable.
3.
CORRELATION ANALYSIS
There aretwo important types of correlation
Positive and Negative Correlation
Linear and Non-Linear Correlation
Positive Correlation
If the values of the two variables deviate in the samle direction i.e., if an
increase (or decrease) in the values of one variable results, on an average, in
a corresponding increase (or decrease) in the value of the other variable, the
correlation is said to be positive.
Ex: Height and weights, Income and Expenditure
4.
CORRELATION ANALYSIS
Negative Correlation
Correlationbetween two variables is said to be negative or inverse if the
variables deviate in opposite direction. That is, if the increase in the variable
deviate in opposite direction. In other words, if increase (or decrease) in the
value of one variable results in corresponding decrease (or increase) in the
values of the other variable.
Ex: Price and Demand, Current and resistance
5.
CORRELATION ANALYSIS
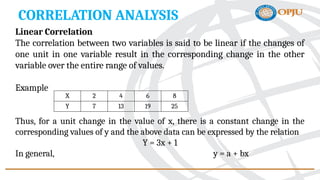
Linear Correlation
Thecorrelation between two variables is said to be linear if the changes of
one unit in one variable result in the corresponding change in the other
variable over the entire range of values.
Example
Thus, for a unit change in the value of x, there is a constant change in the
corresponding values of y and the above data can be expressed by the relation
Y = 3x + 1
In general, y = a + bx
X 2 4 6 8
Y 7 13 19 25
6.
CORRELATION ANALYSIS
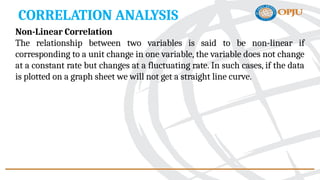
Non-Linear Correlation
Therelationship between two variables is said to be non-linear if
corresponding to a unit change in one variable, the variable does not change
at a constant rate but changes at a fluctuating rate. In such cases, if the data
is plotted on a graph sheet we will not get a straight line curve.
7.
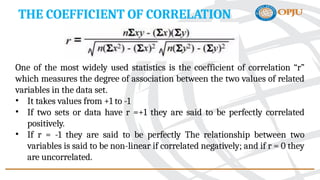
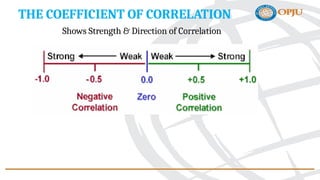
THE COEFFICIENT OFCORRELATION
One of the most widely used statistics is the coefficient of correlation “r”
which measures the degree of association between the two values of related
variables in the data set.
• It takes values from +1 to -1
• If two sets or data have r =+1 they are said to be perfectly correlated
positively.
• If r = -1 they are said to be perfectly The relationship between two
variables is said to be non-linear if correlated negatively; and if r = 0 they
are uncorrelated.
REGRESSION ANALYSIS
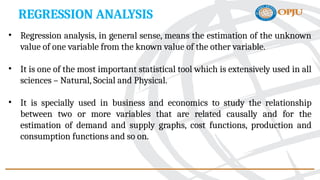
• Regressionanalysis, in general sense, means the estimation of the unknown
value of one variable from the known value of the other variable.
• It is one of the most important statistical tool which is extensively used in all
sciences – Natural, Social and Physical.
• It is specially used in business and economics to study the relationship
between two or more variables that are related causally and for the
estimation of demand and supply graphs, cost functions, production and
consumption functions and so on.
10.
REGRESSION EQUATION
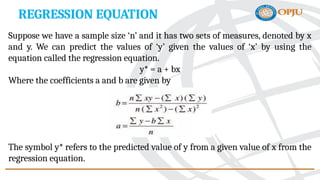
Suppose wehave a sample size ‘n’ and it has two sets of measures, denoted by x
and y. We can predict the values of ‘y’ given the values of ‘x’ by using the
equation called the regression equation.
y* = a + bx
Where the coefficients a and b are given by
The symbol y* refers to the predicted value of y from a given value of x from the
regression equation.
11.
ASSUMPTIONS
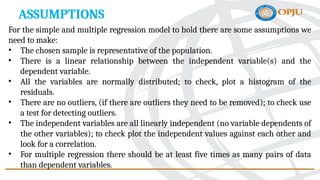
For the simpleand multiple regression model to hold there are some assumptions we
need to make:
• The chosen sample is representative of the population.
• There is a linear relationship between the independent variable(s) and the
dependent variable.
• All the variables are normally distributed; to check, plot a histogram of the
residuals.
• There are no outliers, (if there are outliers they need to be removed); to check use
a test for detecting outliers.
• The independent variables are all linearly independent (no variable dependents of
the other variables); to check plot the independent values against each other and
look for a correlation.
• For multiple regression there should be at least five times as many pairs of data
than dependent variables.


![[DSC Europe 25] Andrzej Kowalczyk - AI - how to start small and grow in the f...](https://cdn.slidesharecdn.com/ss_thumbnails/oy1zmo94qv6vpcqjvno2-andrzej-kowalczyk-ai-how-to-start-small-and-grow-in-the-future-1-260119121559-cf093b23-thumbnail.jpg?width=640&height=640&fit=bounds)


![[DSC Europe 25] Bojan Djuricic - Predictive Design Process.pdf](https://cdn.slidesharecdn.com/ss_thumbnails/5awdrbedqdek3gqu2ezy-4-the-predictive-design-bojan-djuricic-260120105856-6c399e9b-thumbnail.jpg?width=640&height=640&fit=bounds)


![[DSC Europe 25] Elena Menshikova - AI-Powered Operational Excellence: Revolut...](https://cdn.slidesharecdn.com/ss_thumbnails/es6nholbqy3zaao2c2yd-2-elena-menshikova-data-ai-in-decision-making-260115093812-4fba8b38-thumbnail.jpg?width=640&height=640&fit=bounds)

