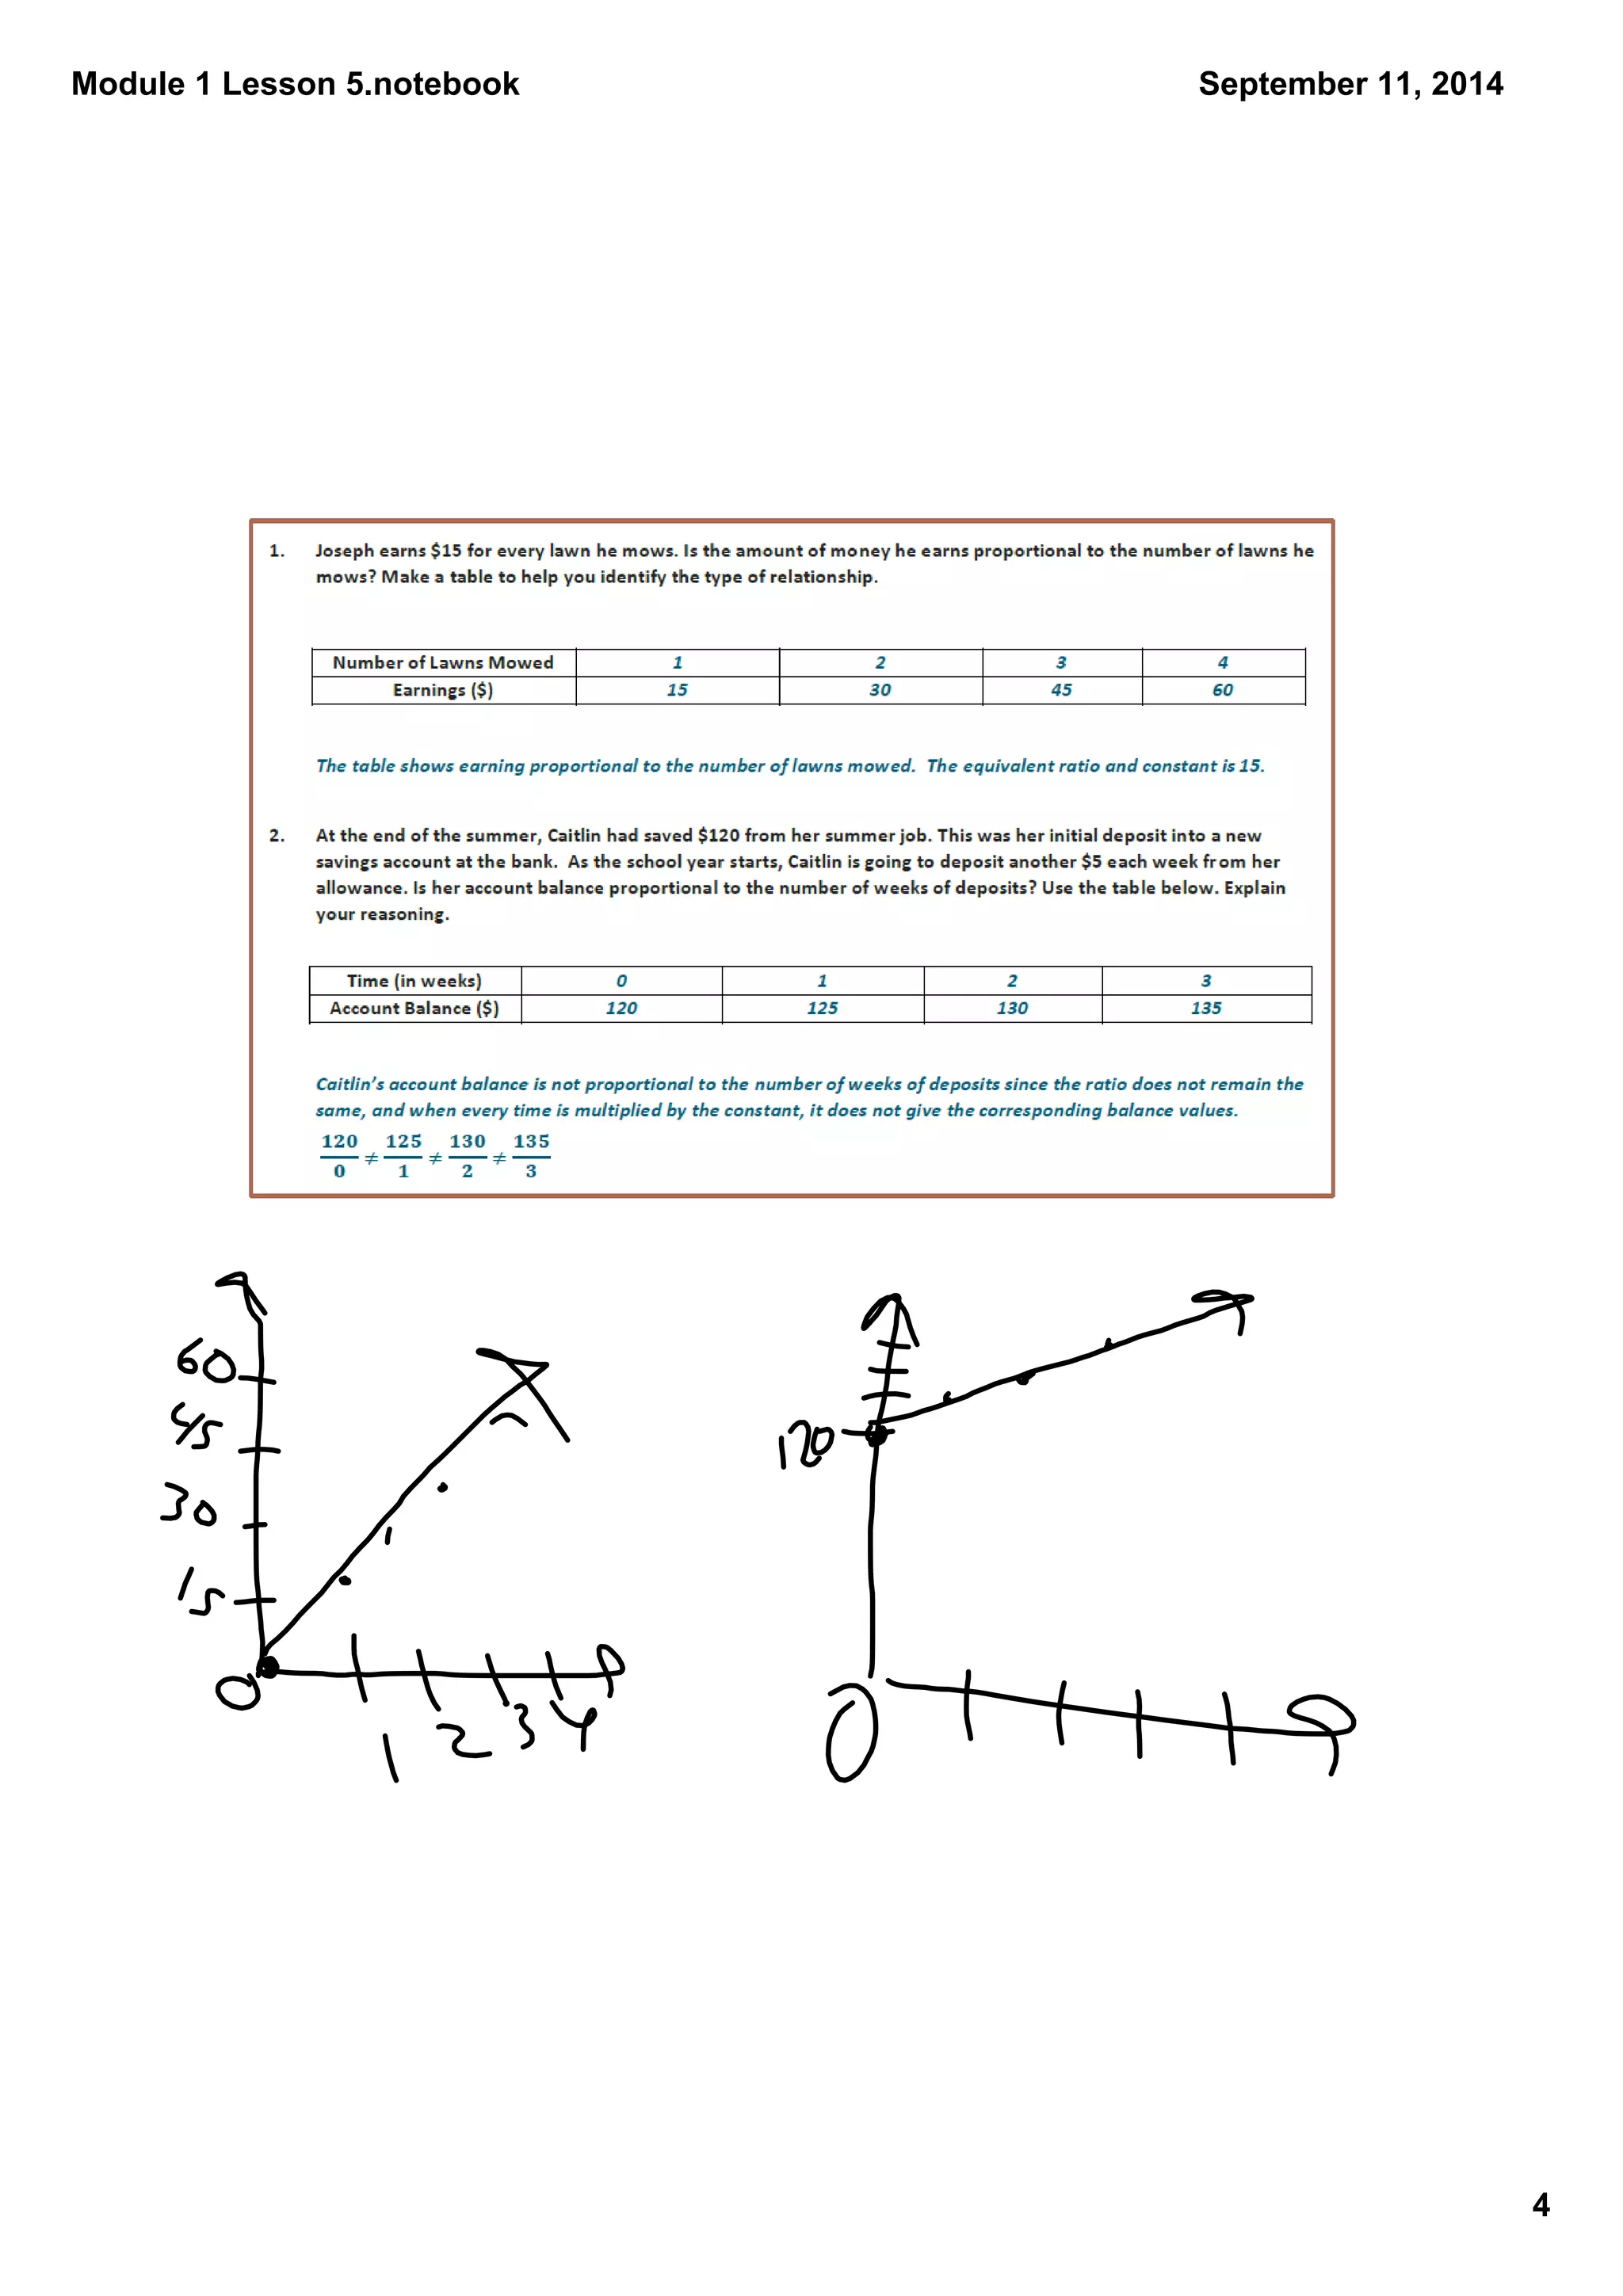
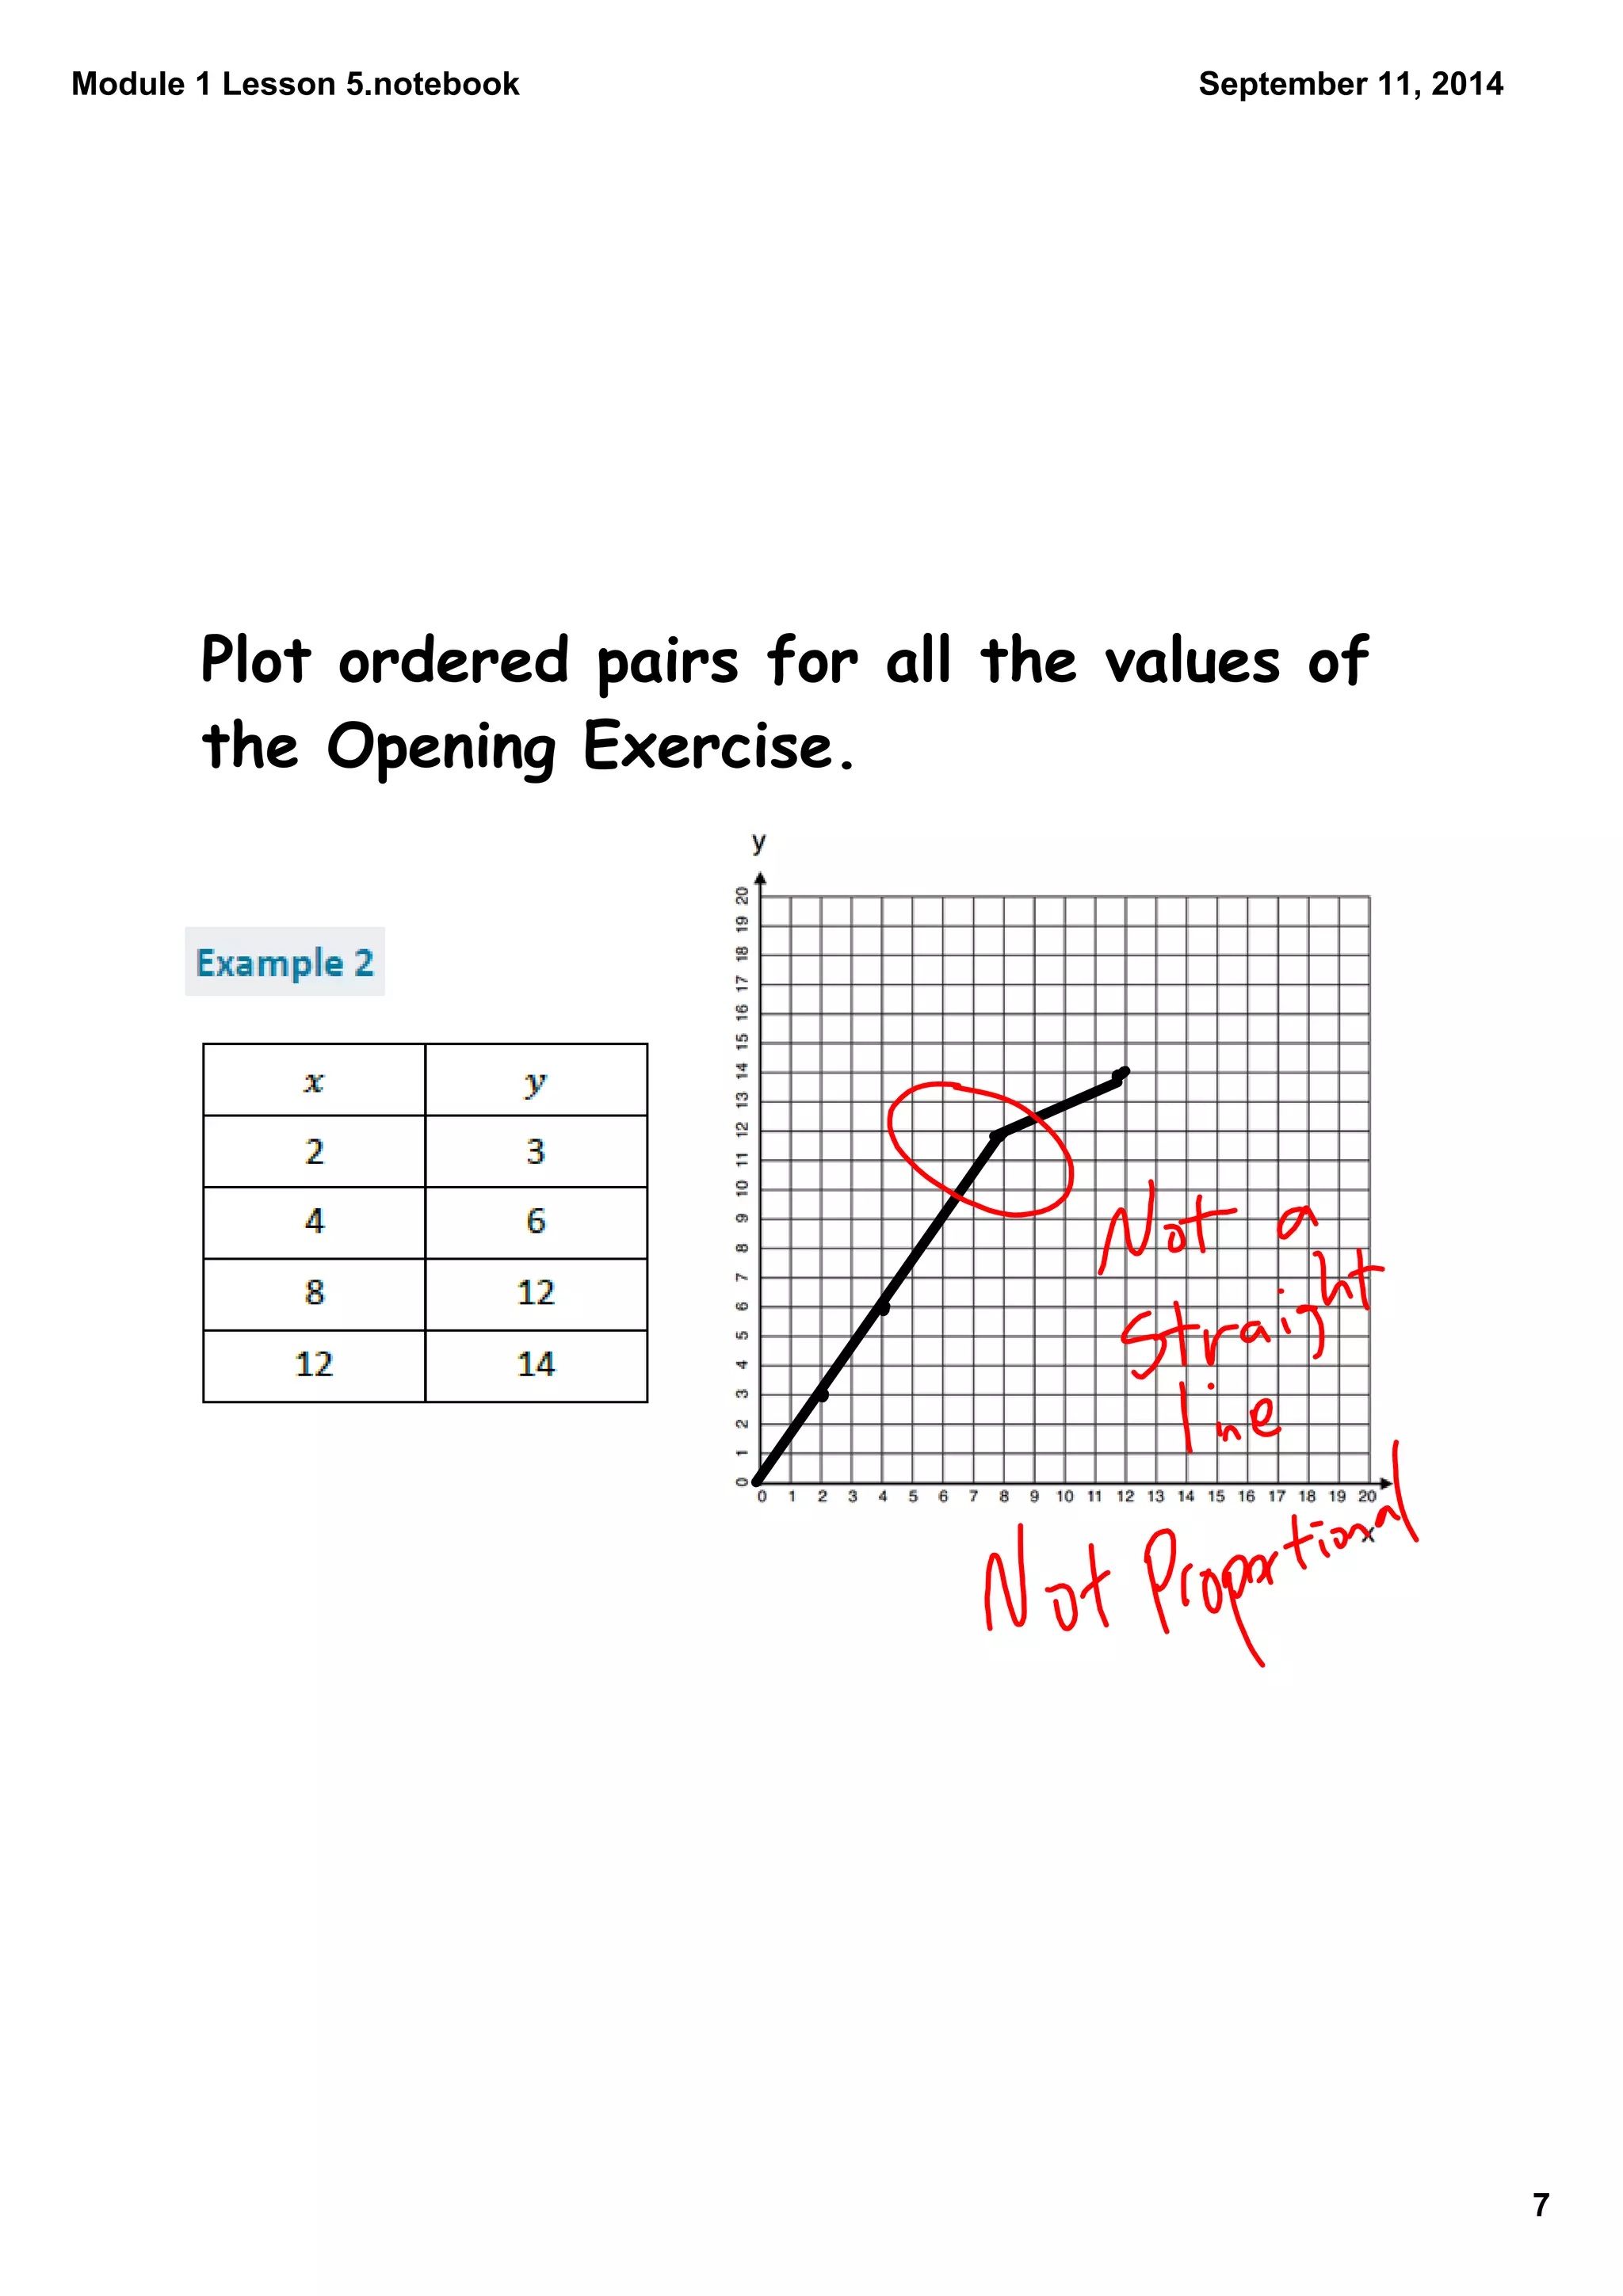
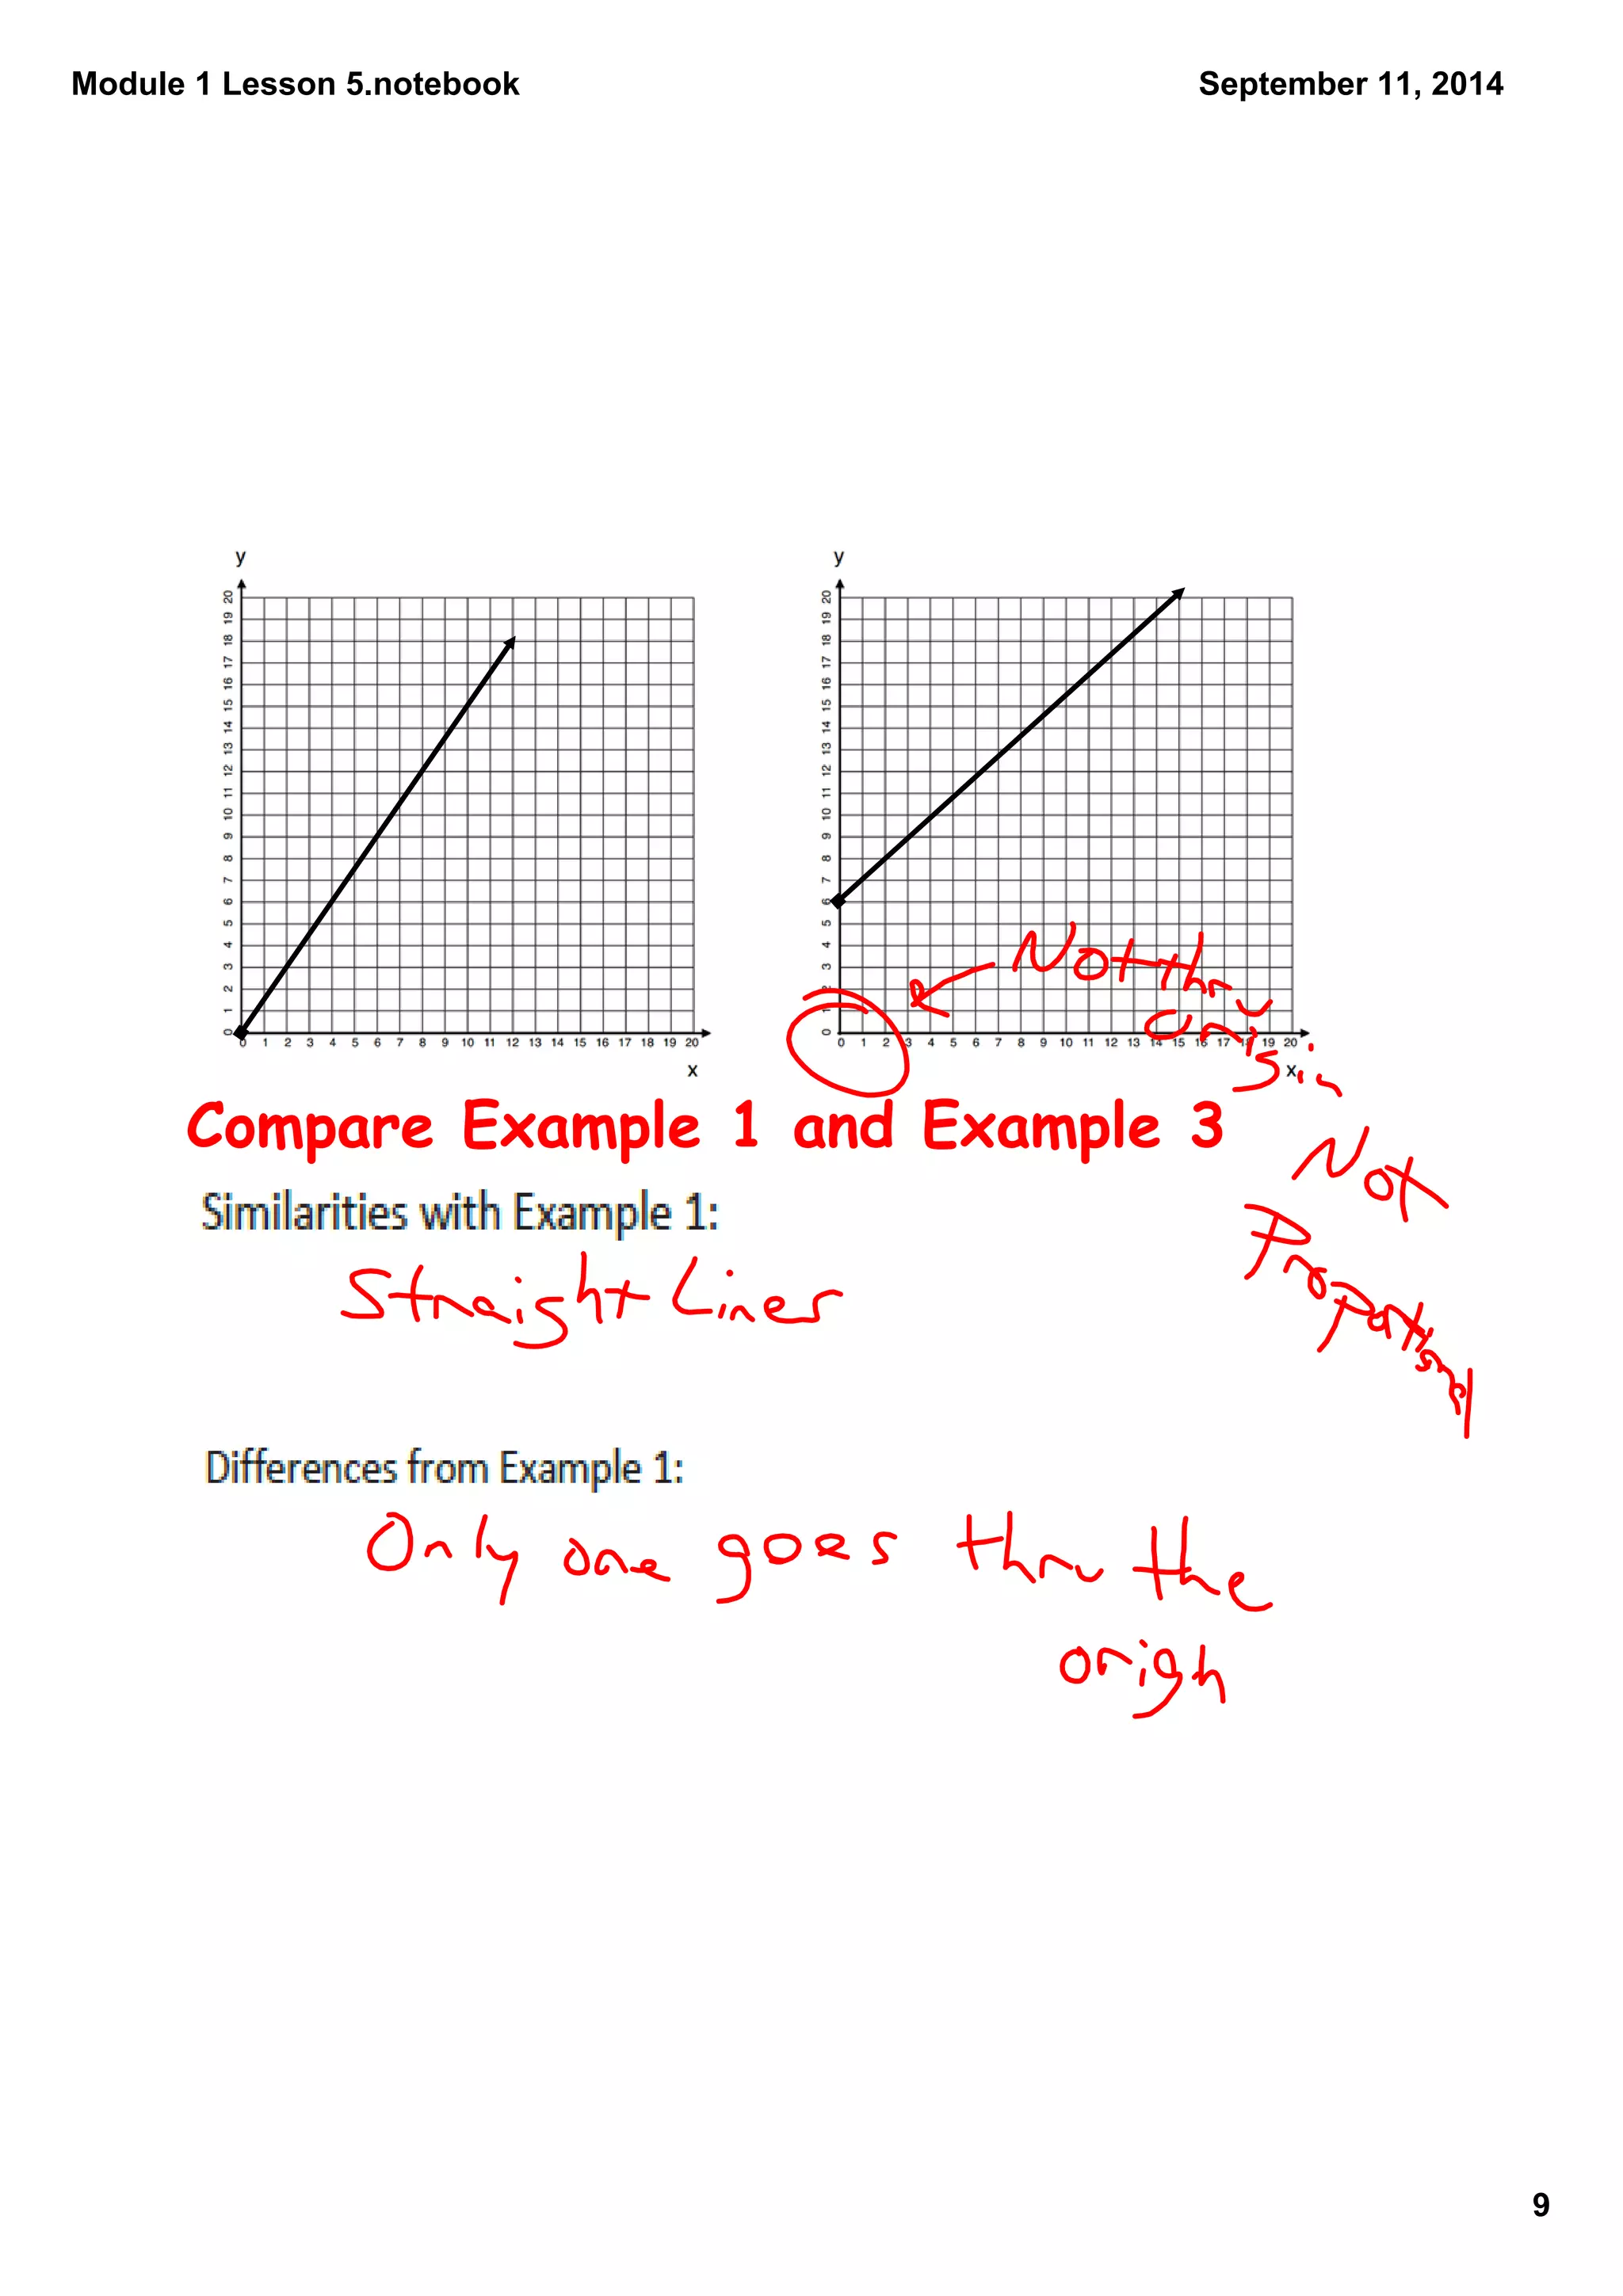
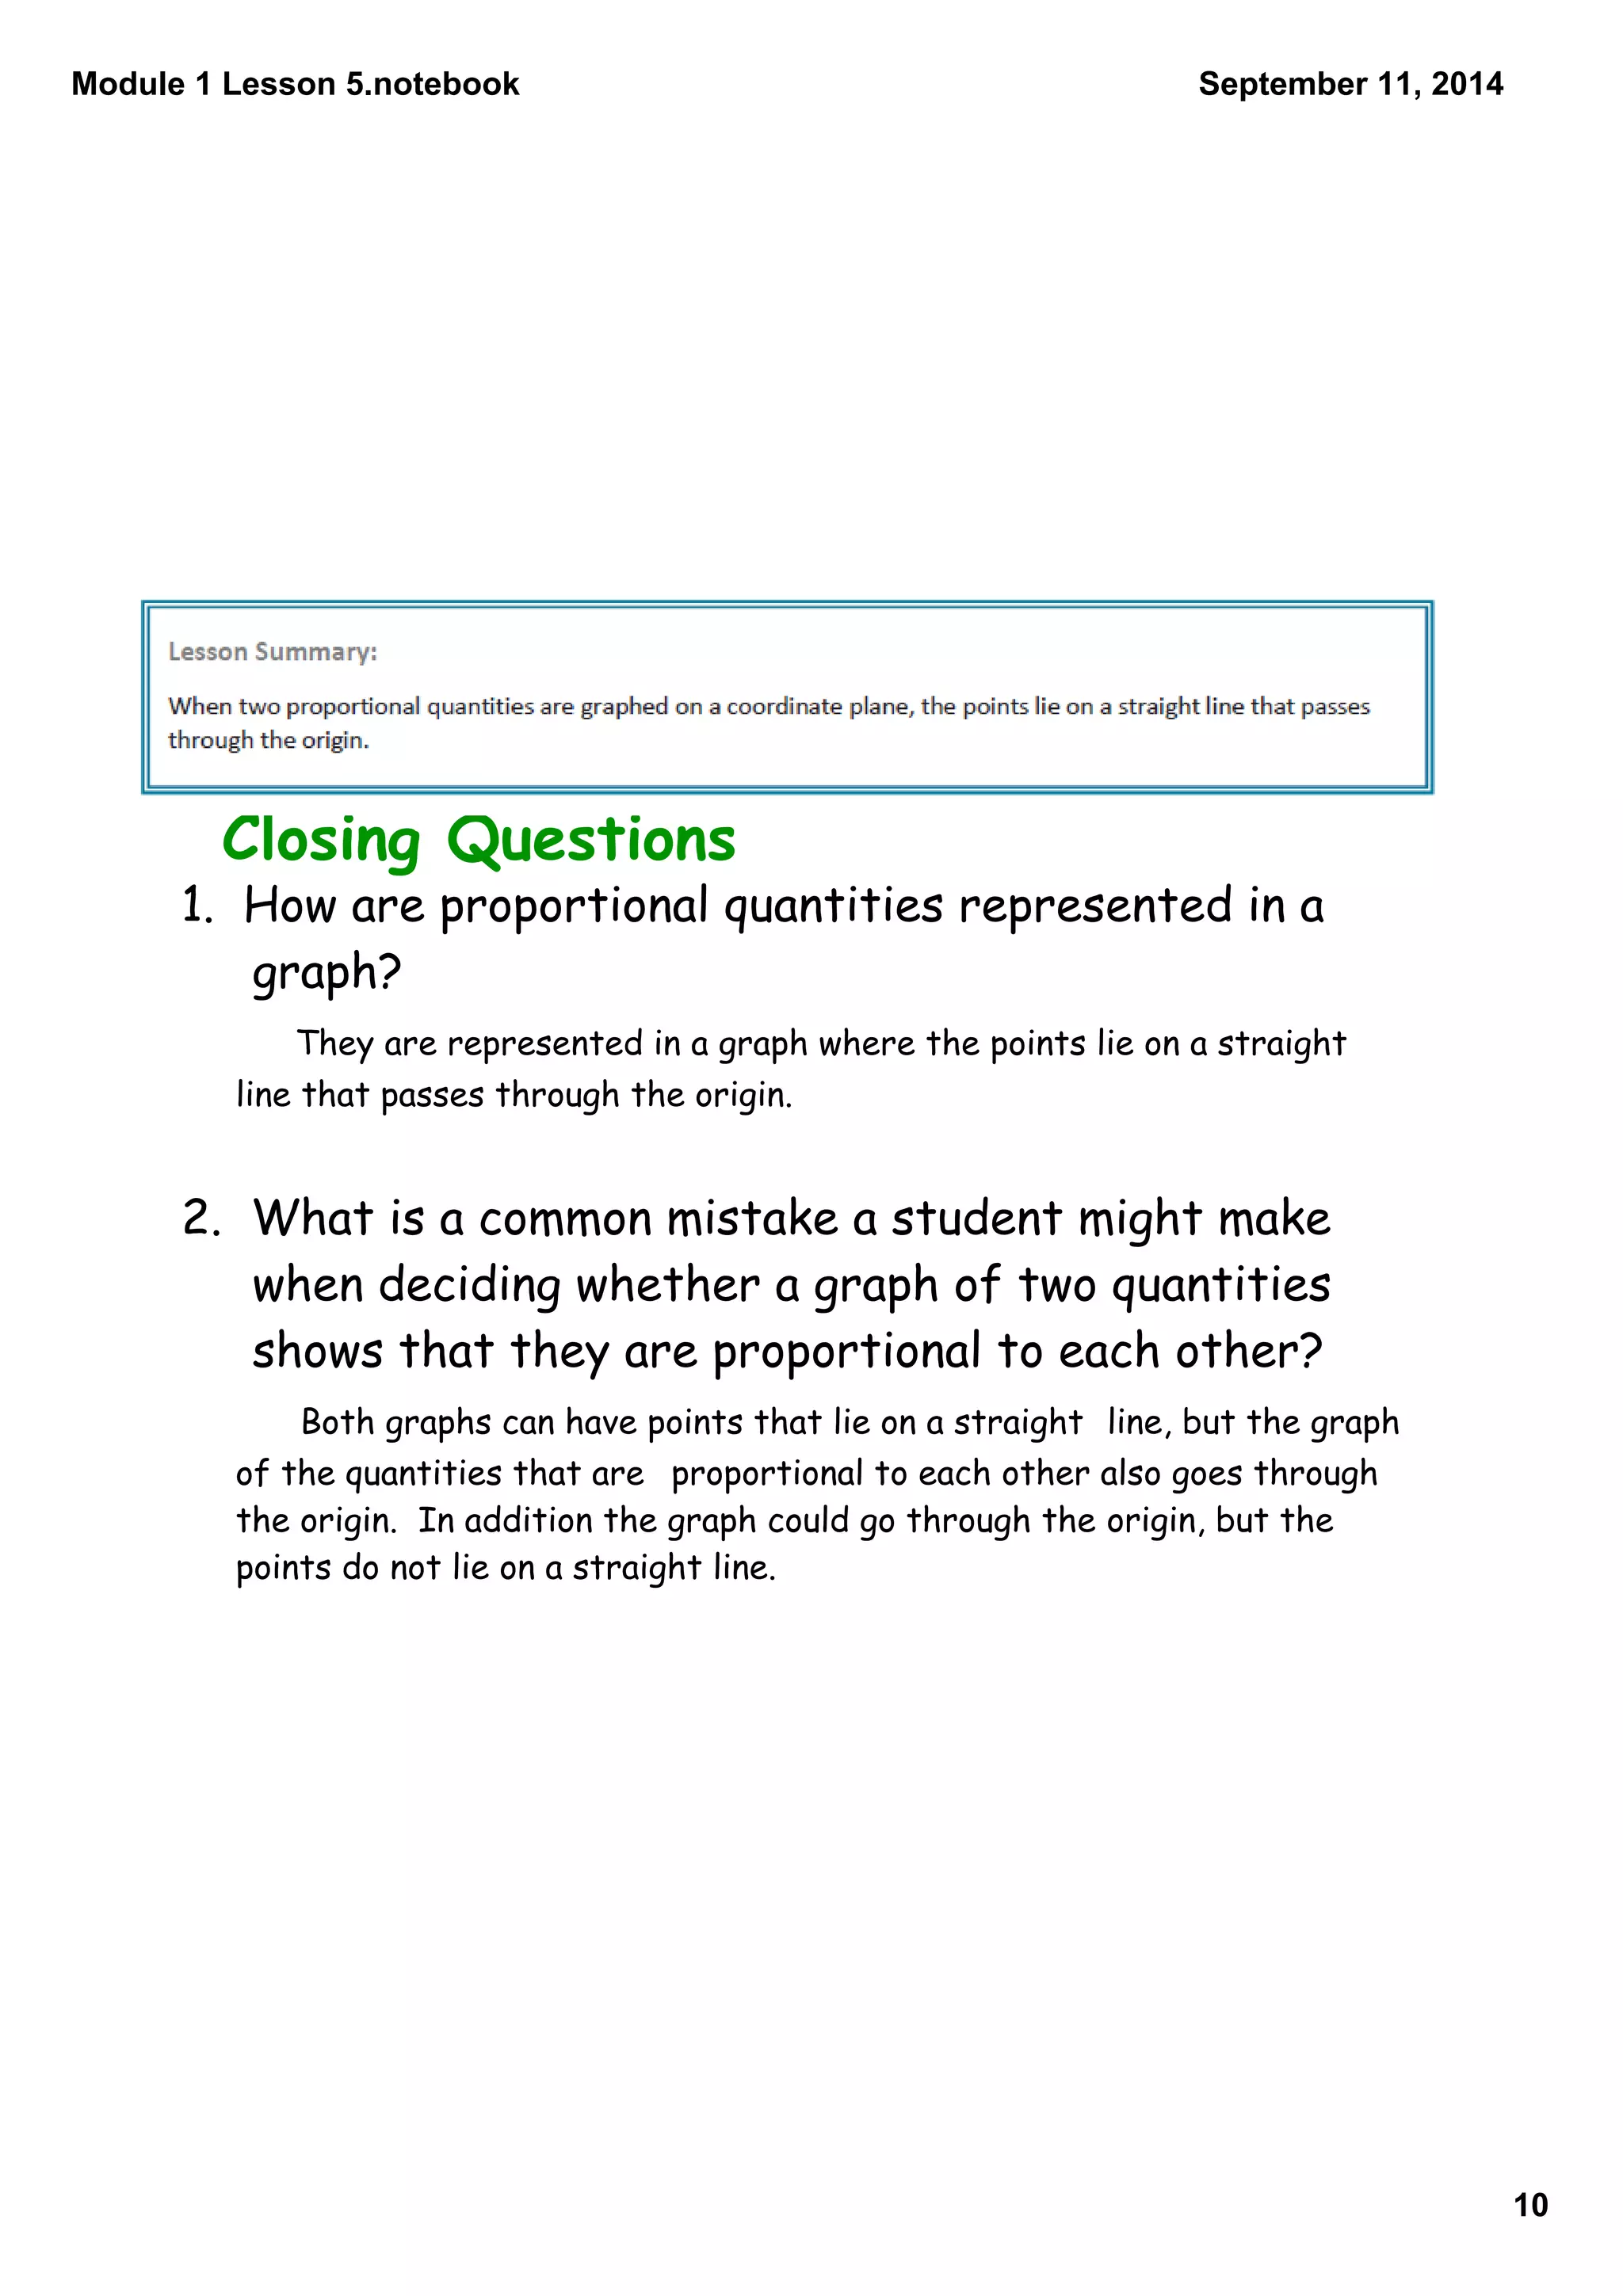
Module 1 Lesson 5.notebook 
1 
September 11, 2014 
Module 1, Lesson 5 09/11/14 
Identifying Proportional and 
Non-Proportional Relationships in Graphs 
Homework: 
Lesson 5 Problem Set 
#1 and 3 
Do Now 
Exit Ticket for Lesson 4
Module 1 Lesson 5.notebook 
2 
September 11, 2014
Module 1 Lesson 5.notebook 
3 
September 11, 2014 
Lesson 4 Exit Ticket Review
Module 1 Lesson 5.notebook 
4 
September 11, 2014
Module 1 Lesson 5.notebook 
5 
September 11, 2014
Module 1 Lesson 5.notebook 
6 
September 11, 2014 
Fill in the table below so that y is 
proportional to x.
Module 1 Lesson 5.notebook 
7 
September 11, 2014 
Plot ordered pairs for all the values of 
the Opening Exercise.
Module 1 Lesson 5.notebook 
8 
September 11, 2014
Module 1 Lesson 5.notebook 
9 
September 11, 2014 
Compare Example 1 and Example 3
Module 1 Lesson 5.notebook 
10 
September 11, 2014 
Closing Questions 
1. How are proportional quantities represented in a 
graph? 
They are represented in a graph where the points lie on a straight 
line that passes through the origin. 
2. What is a common mistake a student might make 
when deciding whether a graph of two quantities 
shows that they are proportional to each other? 
Both graphs can have points that lie on a straight line, but the graph 
of the quantities that are proportional to each other also goes through 
the origin. In addition the graph could go through the origin, but the 
points do not lie on a straight line.
Module 1 Lesson 5.notebook 
11 
September 11, 2014
Module 1 Lesson 5.notebook 
12 
September 11, 2014 
Important Note: 
Characteristics of graphs of proportional relationships: 
1. Points lie in a straight line. 
2. Line goes through the origin.

Module 1 lesson 5

  • 1.
    Module 1 Lesson5.notebook 1 September 11, 2014 Module 1, Lesson 5 09/11/14 Identifying Proportional and Non-Proportional Relationships in Graphs Homework: Lesson 5 Problem Set #1 and 3 Do Now Exit Ticket for Lesson 4
  • 2.
    Module 1 Lesson5.notebook 2 September 11, 2014
  • 3.
    Module 1 Lesson5.notebook 3 September 11, 2014 Lesson 4 Exit Ticket Review
  • 4.
    Module 1 Lesson5.notebook 4 September 11, 2014
  • 5.
    Module 1 Lesson5.notebook 5 September 11, 2014
  • 6.
    Module 1 Lesson5.notebook 6 September 11, 2014 Fill in the table below so that y is proportional to x.
  • 7.
    Module 1 Lesson5.notebook 7 September 11, 2014 Plot ordered pairs for all the values of the Opening Exercise.
  • 8.
    Module 1 Lesson5.notebook 8 September 11, 2014
  • 9.
    Module 1 Lesson5.notebook 9 September 11, 2014 Compare Example 1 and Example 3
  • 10.
    Module 1 Lesson5.notebook 10 September 11, 2014 Closing Questions 1. How are proportional quantities represented in a graph? They are represented in a graph where the points lie on a straight line that passes through the origin. 2. What is a common mistake a student might make when deciding whether a graph of two quantities shows that they are proportional to each other? Both graphs can have points that lie on a straight line, but the graph of the quantities that are proportional to each other also goes through the origin. In addition the graph could go through the origin, but the points do not lie on a straight line.
  • 11.
    Module 1 Lesson5.notebook 11 September 11, 2014
  • 12.
    Module 1 Lesson5.notebook 12 September 11, 2014 Important Note: Characteristics of graphs of proportional relationships: 1. Points lie in a straight line. 2. Line goes through the origin.