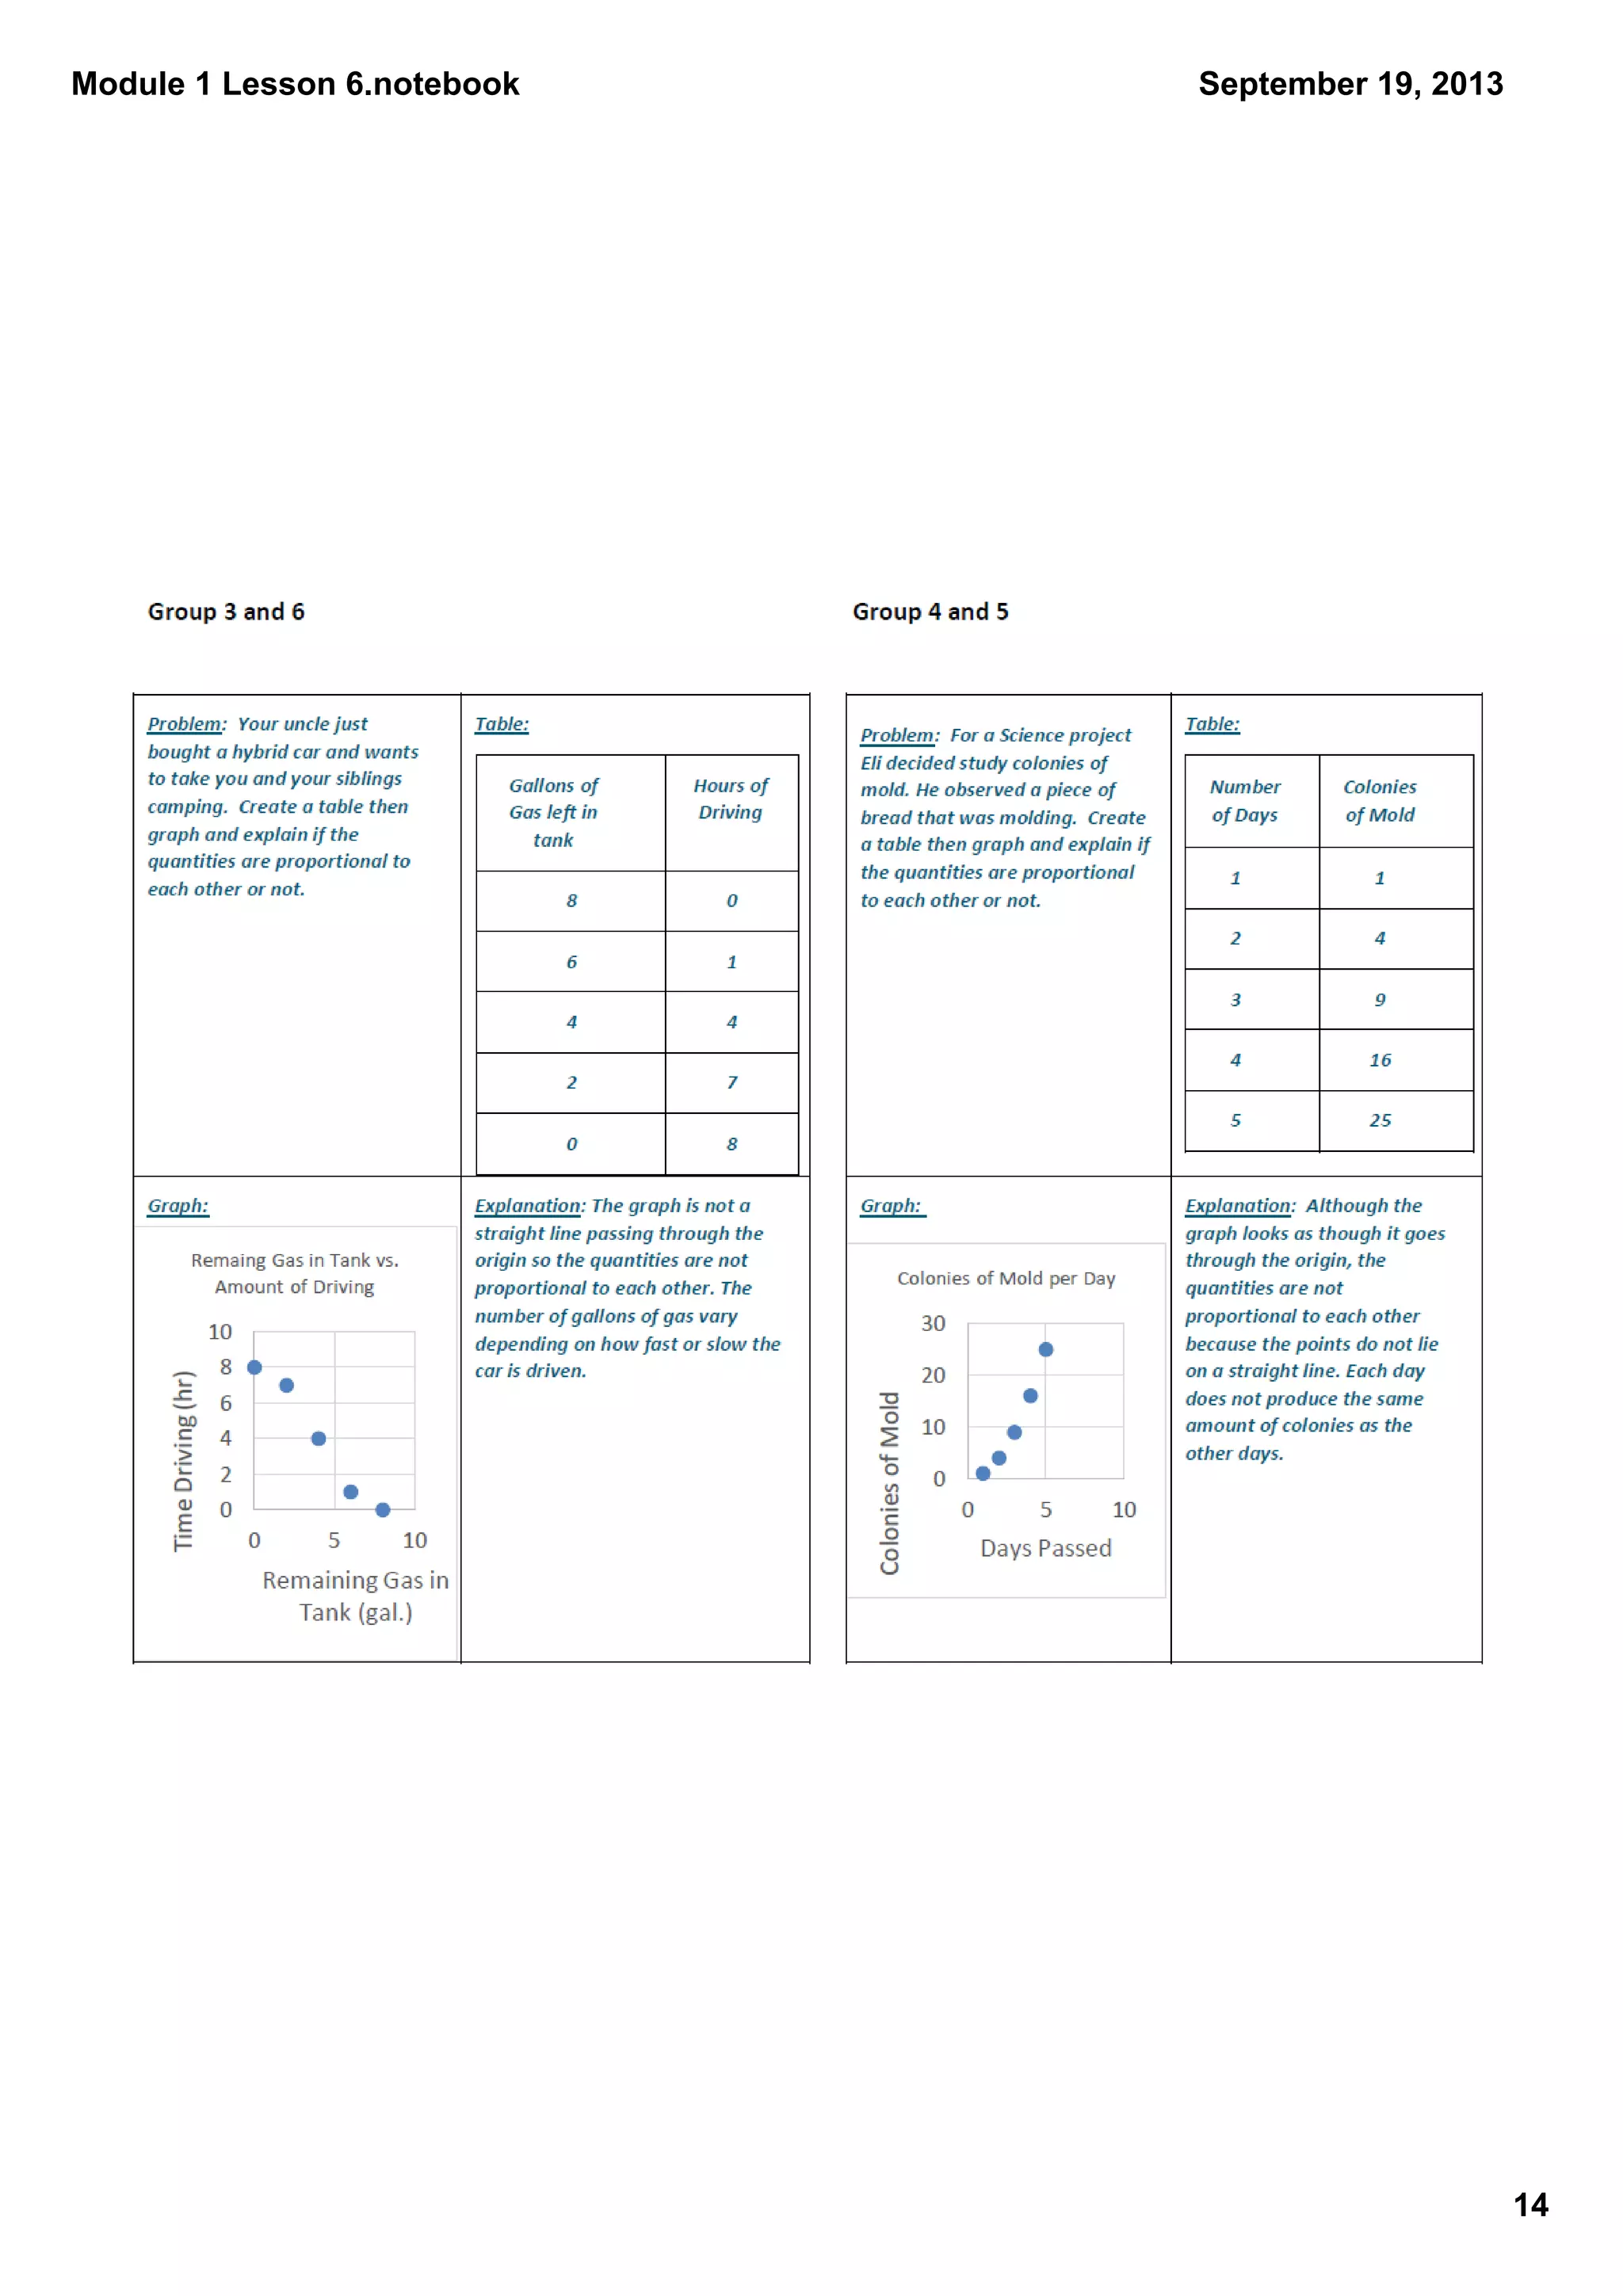
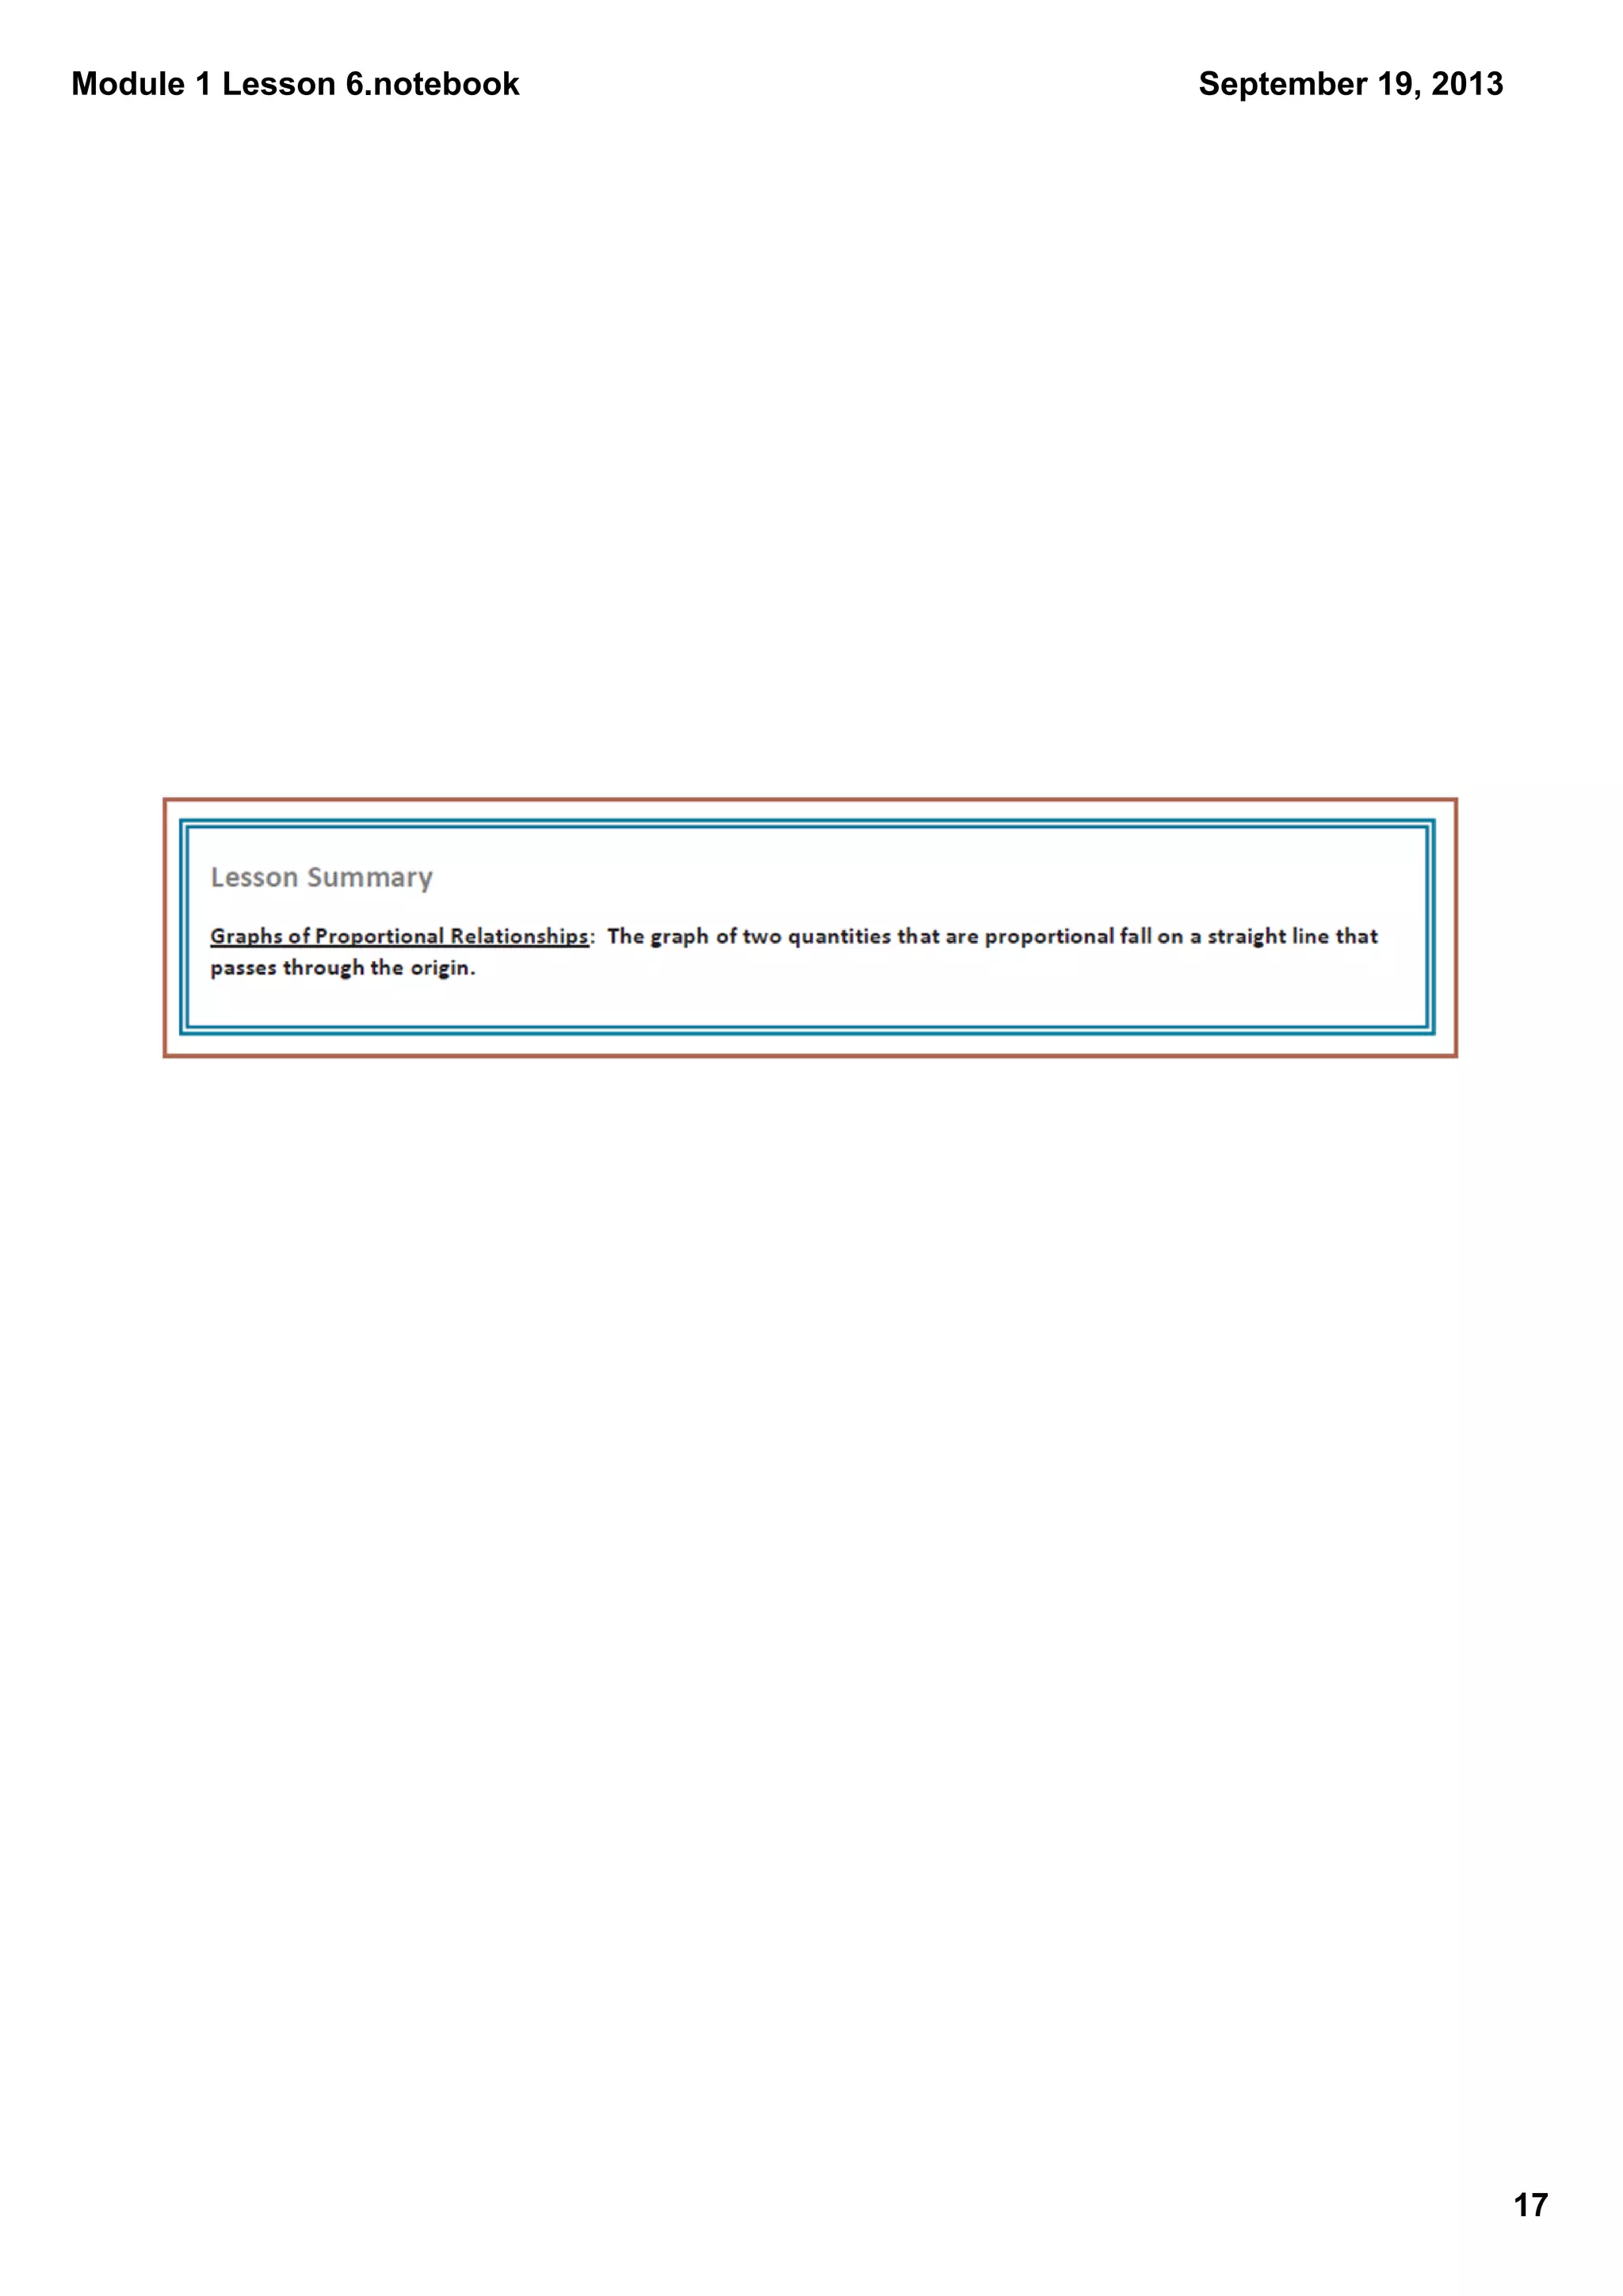
This document summarizes a math lesson on identifying proportional and non-proportional relationships in graphs. The lesson involved students working in groups to create posters analyzing different ratios and their graphical representations. They then presented their posters around the room like an art gallery for other groups to review. The discussion focused on ensuring the posters were visually appealing and informative for teaching the concepts to outsiders. Students completed an exit ticket evaluating the activity.


![43636623 evaluation-test-1-5ano[1]](https://cdn.slidesharecdn.com/ss_thumbnails/43636623-evaluation-test-1-5ano1-130303092612-phpapp01-thumbnail.jpg?width=640&height=640&fit=bounds)


![Day 26 surface area day 2]](https://cdn.slidesharecdn.com/ss_thumbnails/day26surfaceareaday2-130520095200-phpapp01-thumbnail.jpg?width=640&height=640&fit=bounds)


