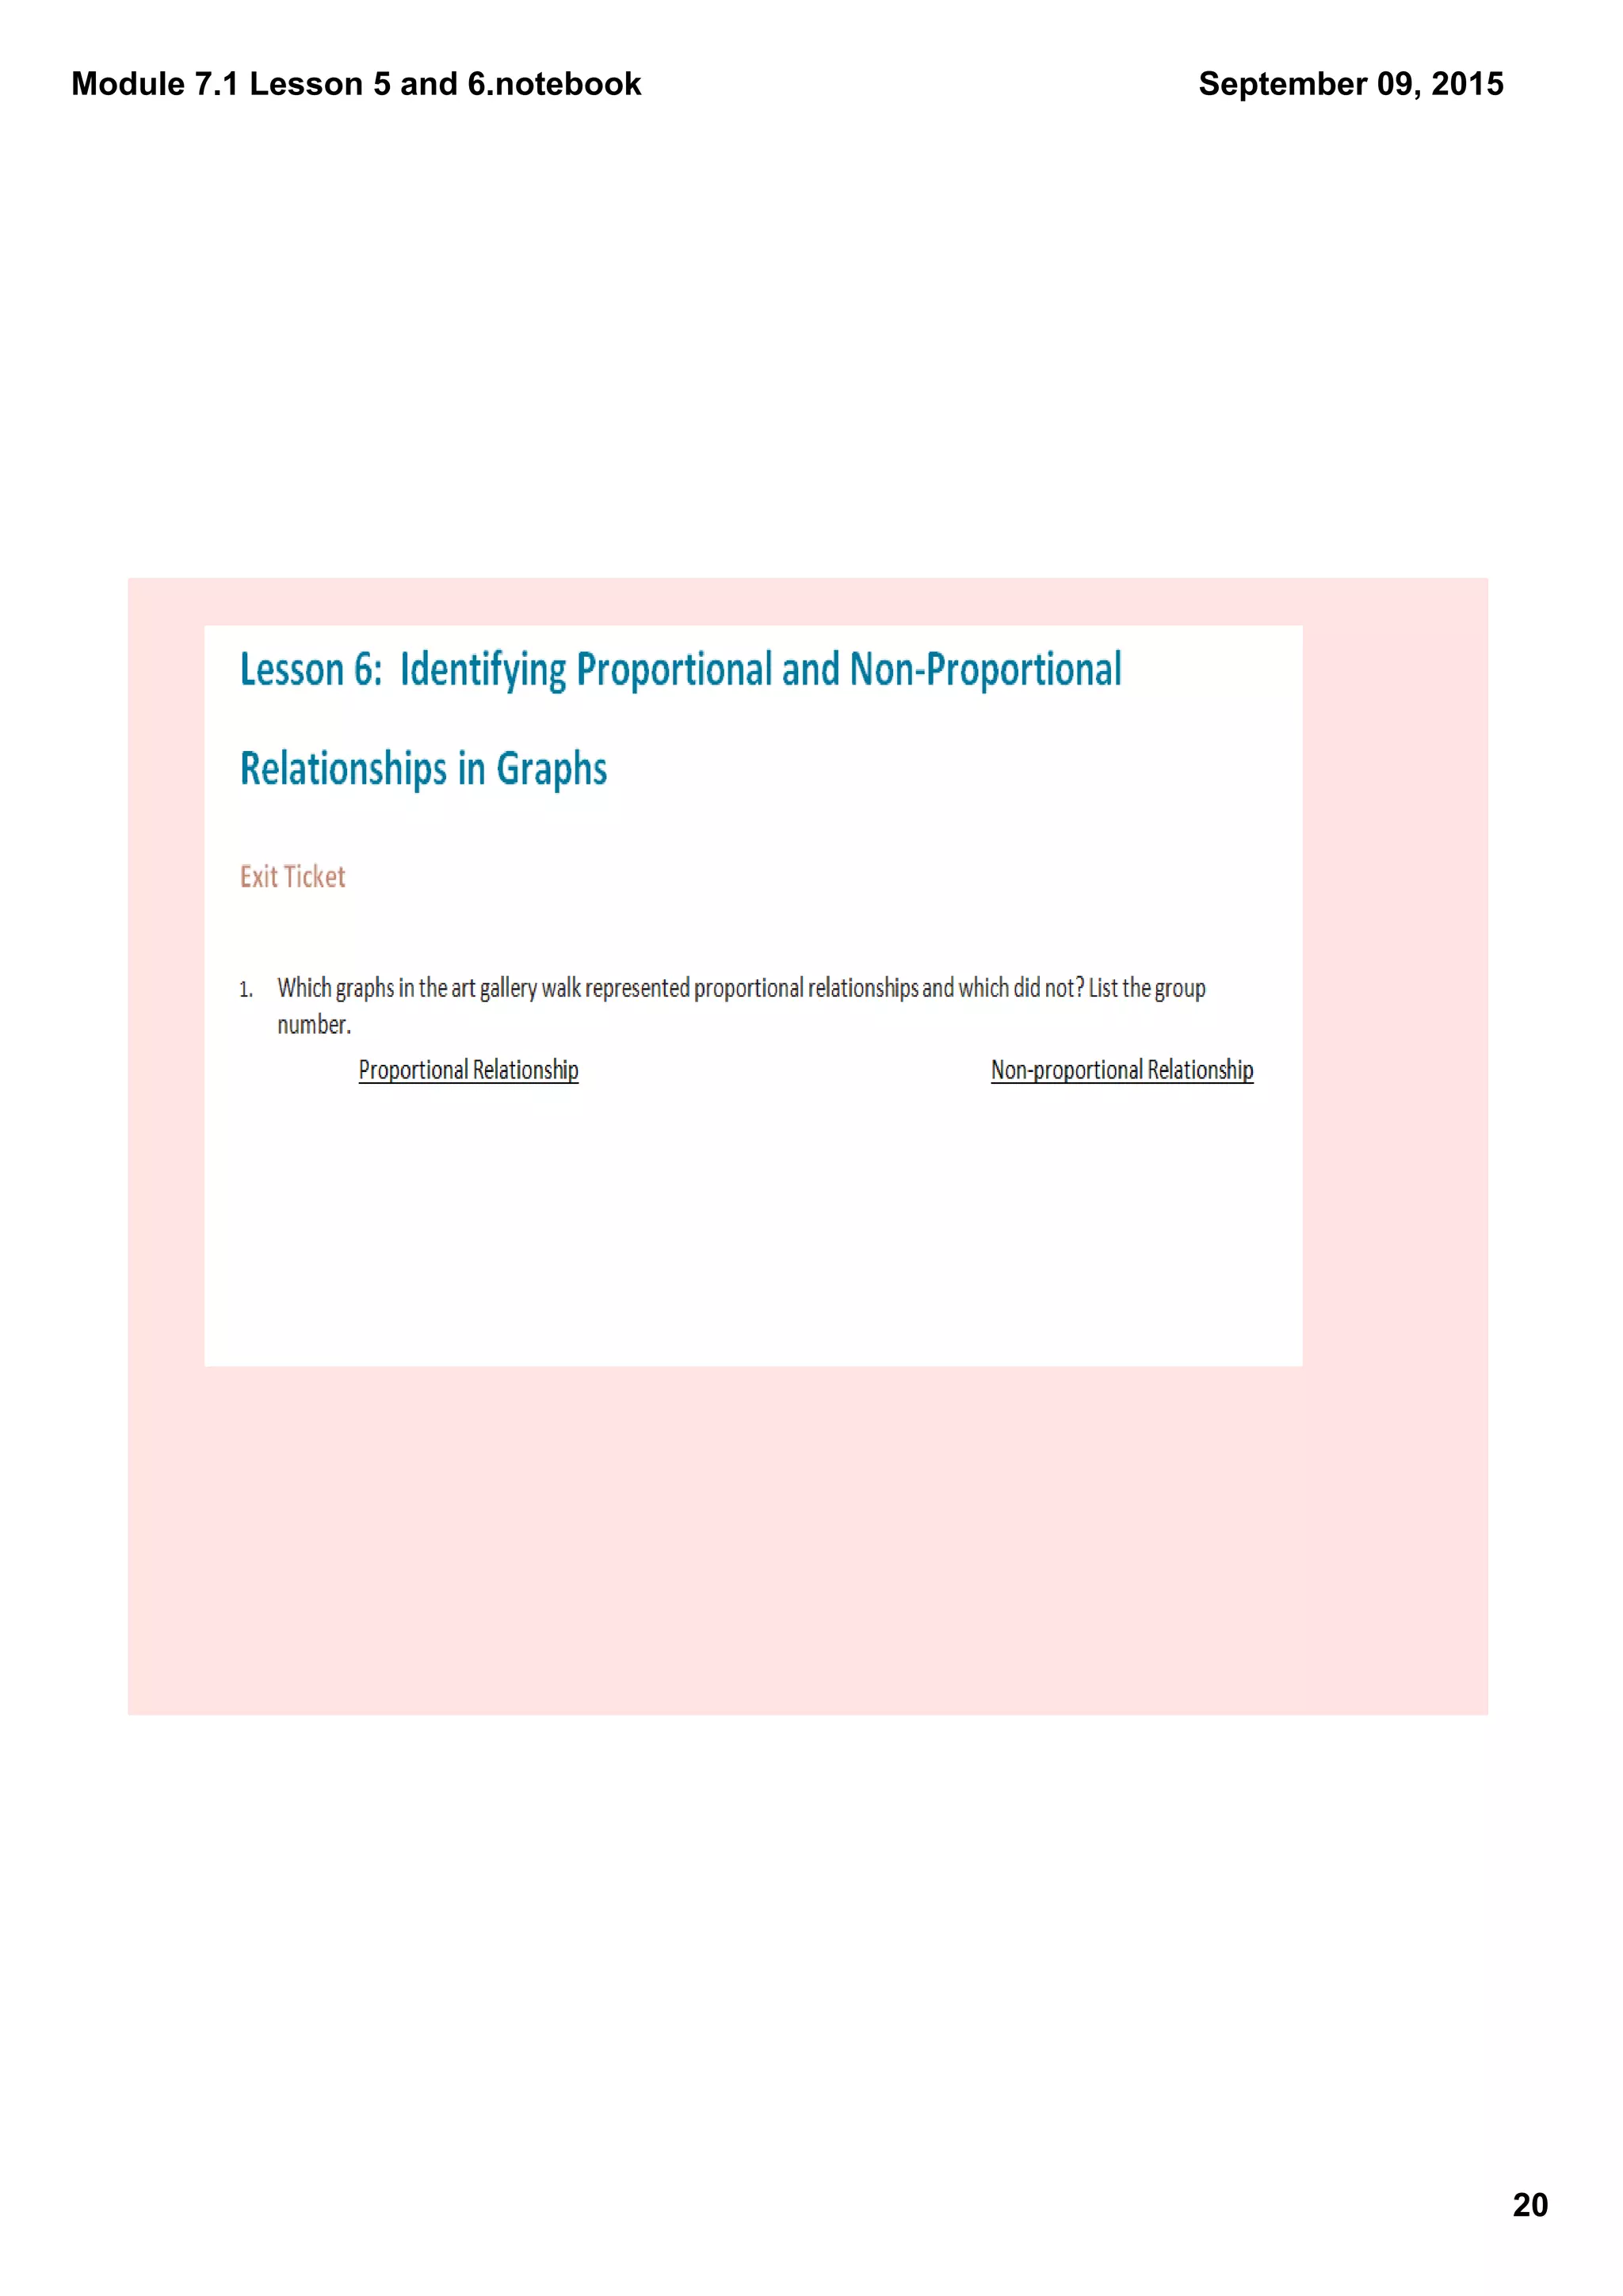
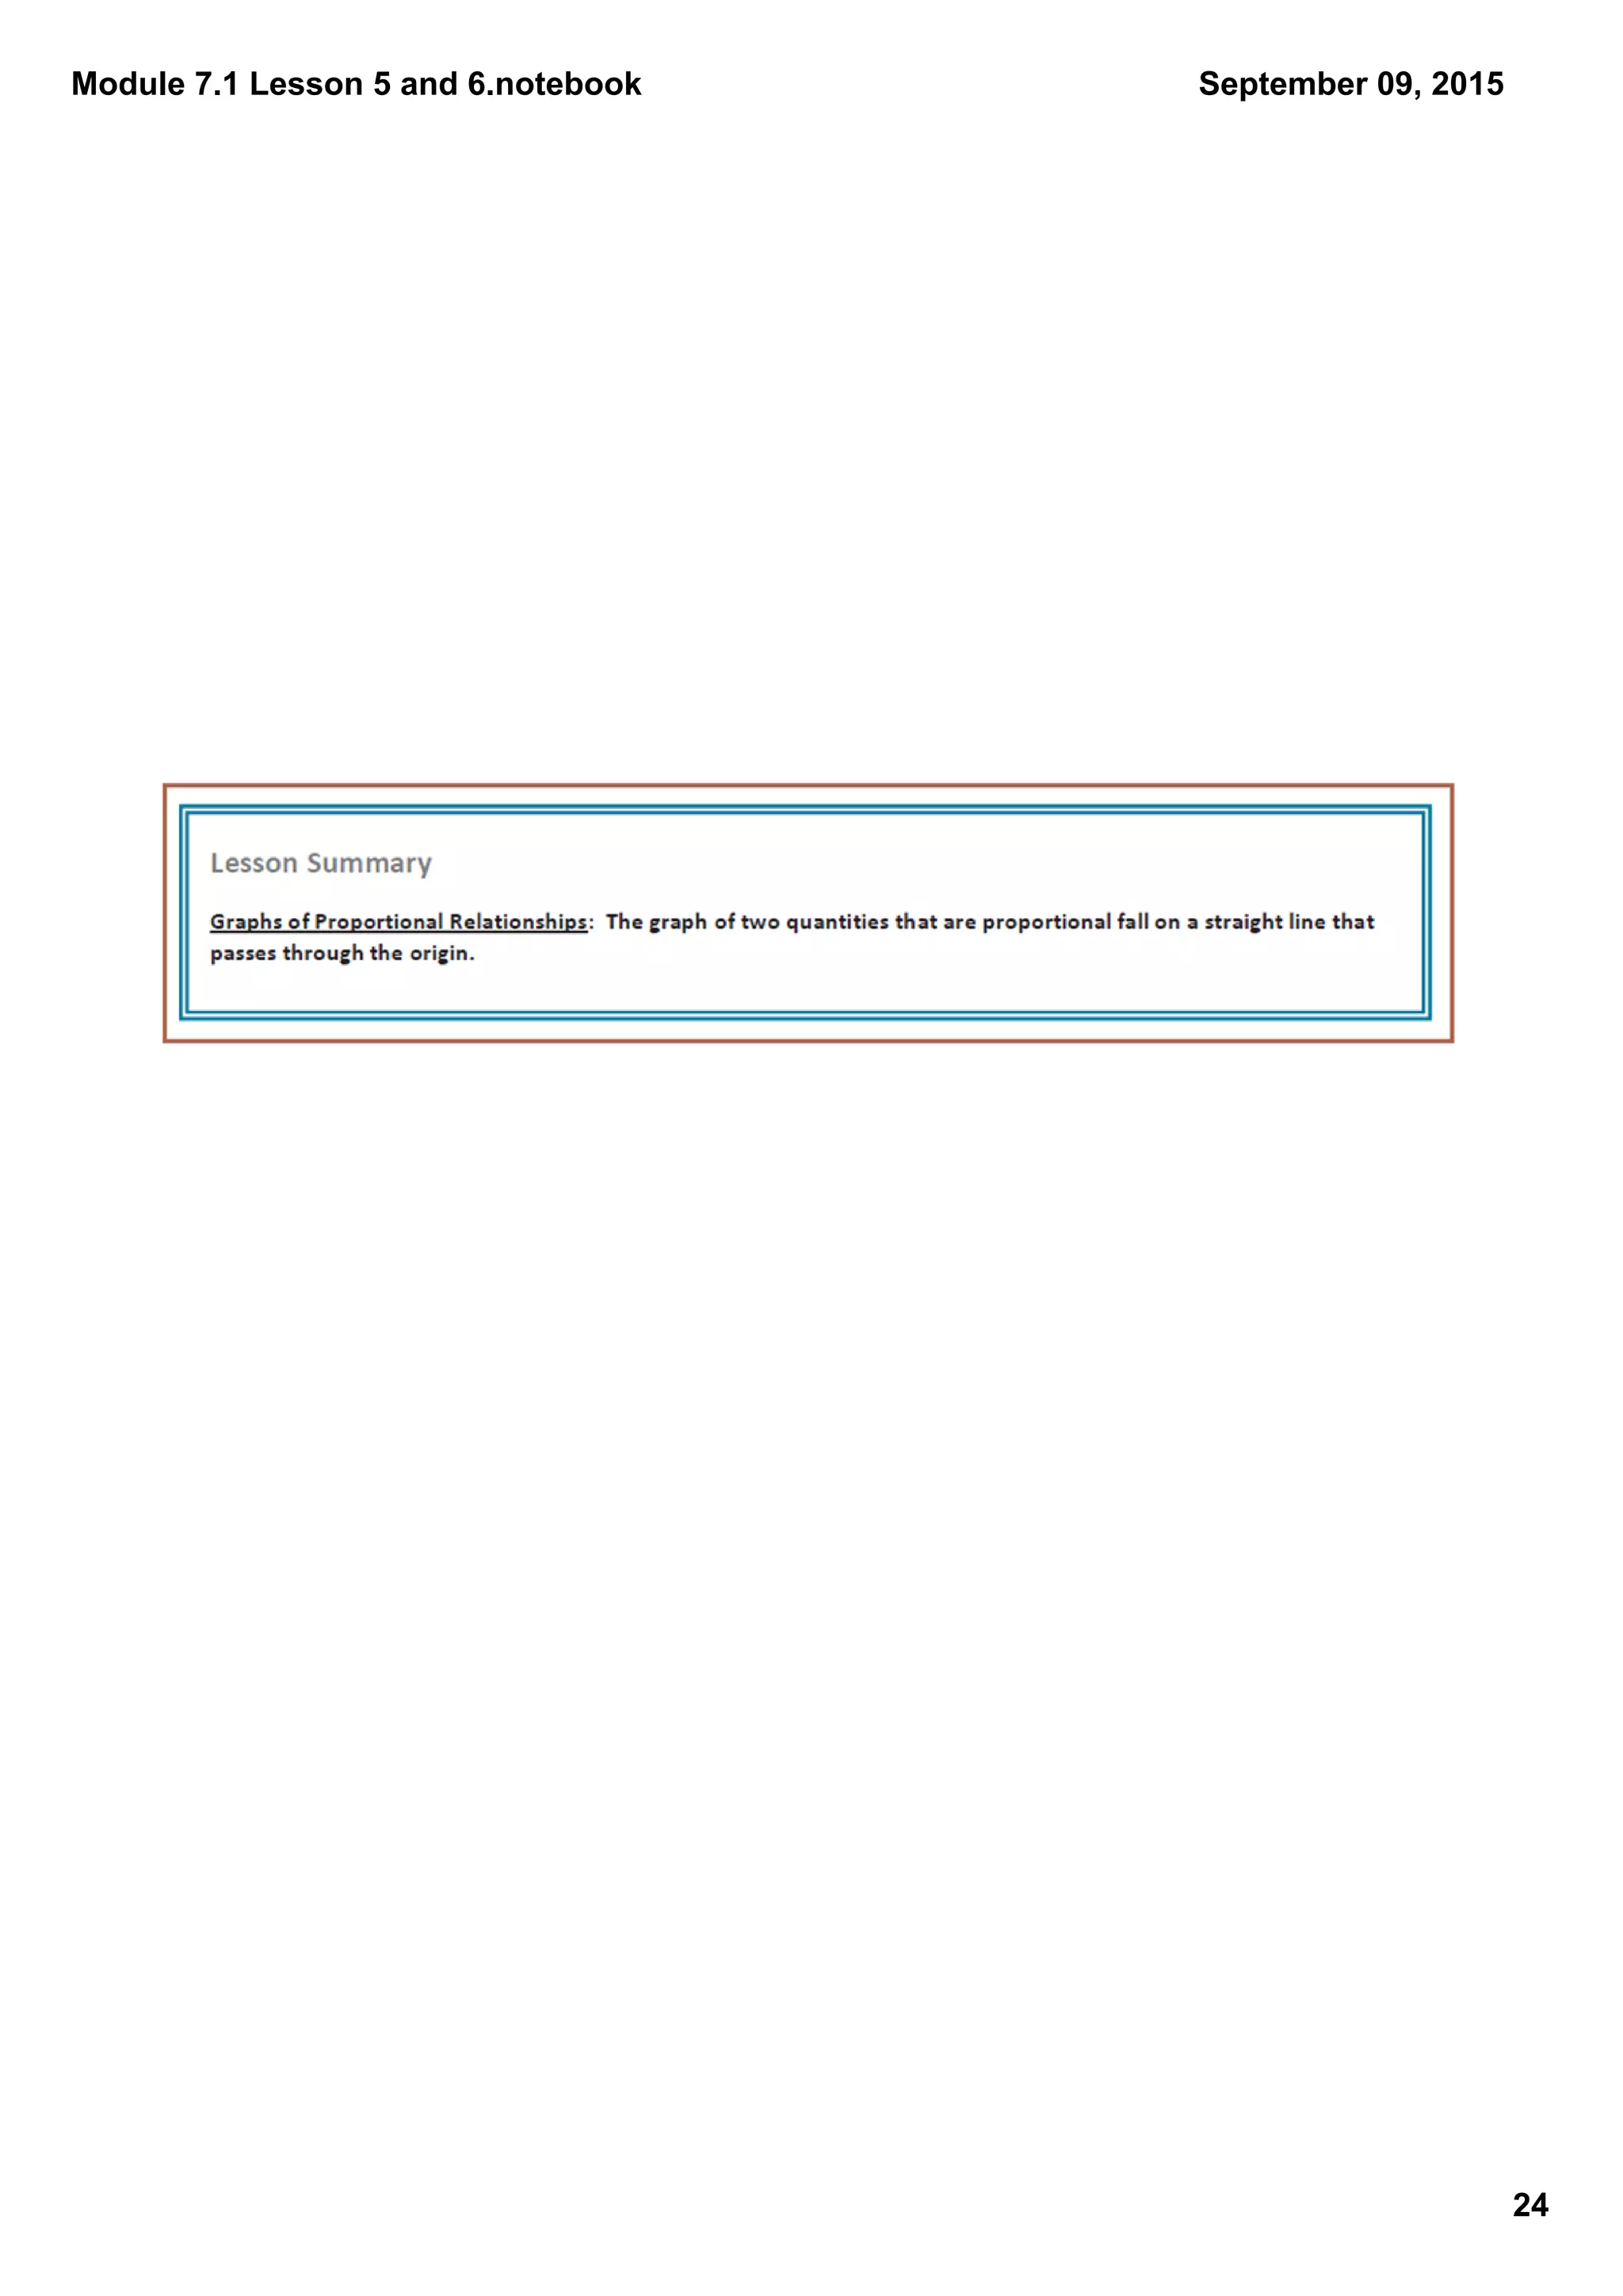
1) The document appears to be notes from a math lesson on identifying proportional and non-proportional relationships in graphs.
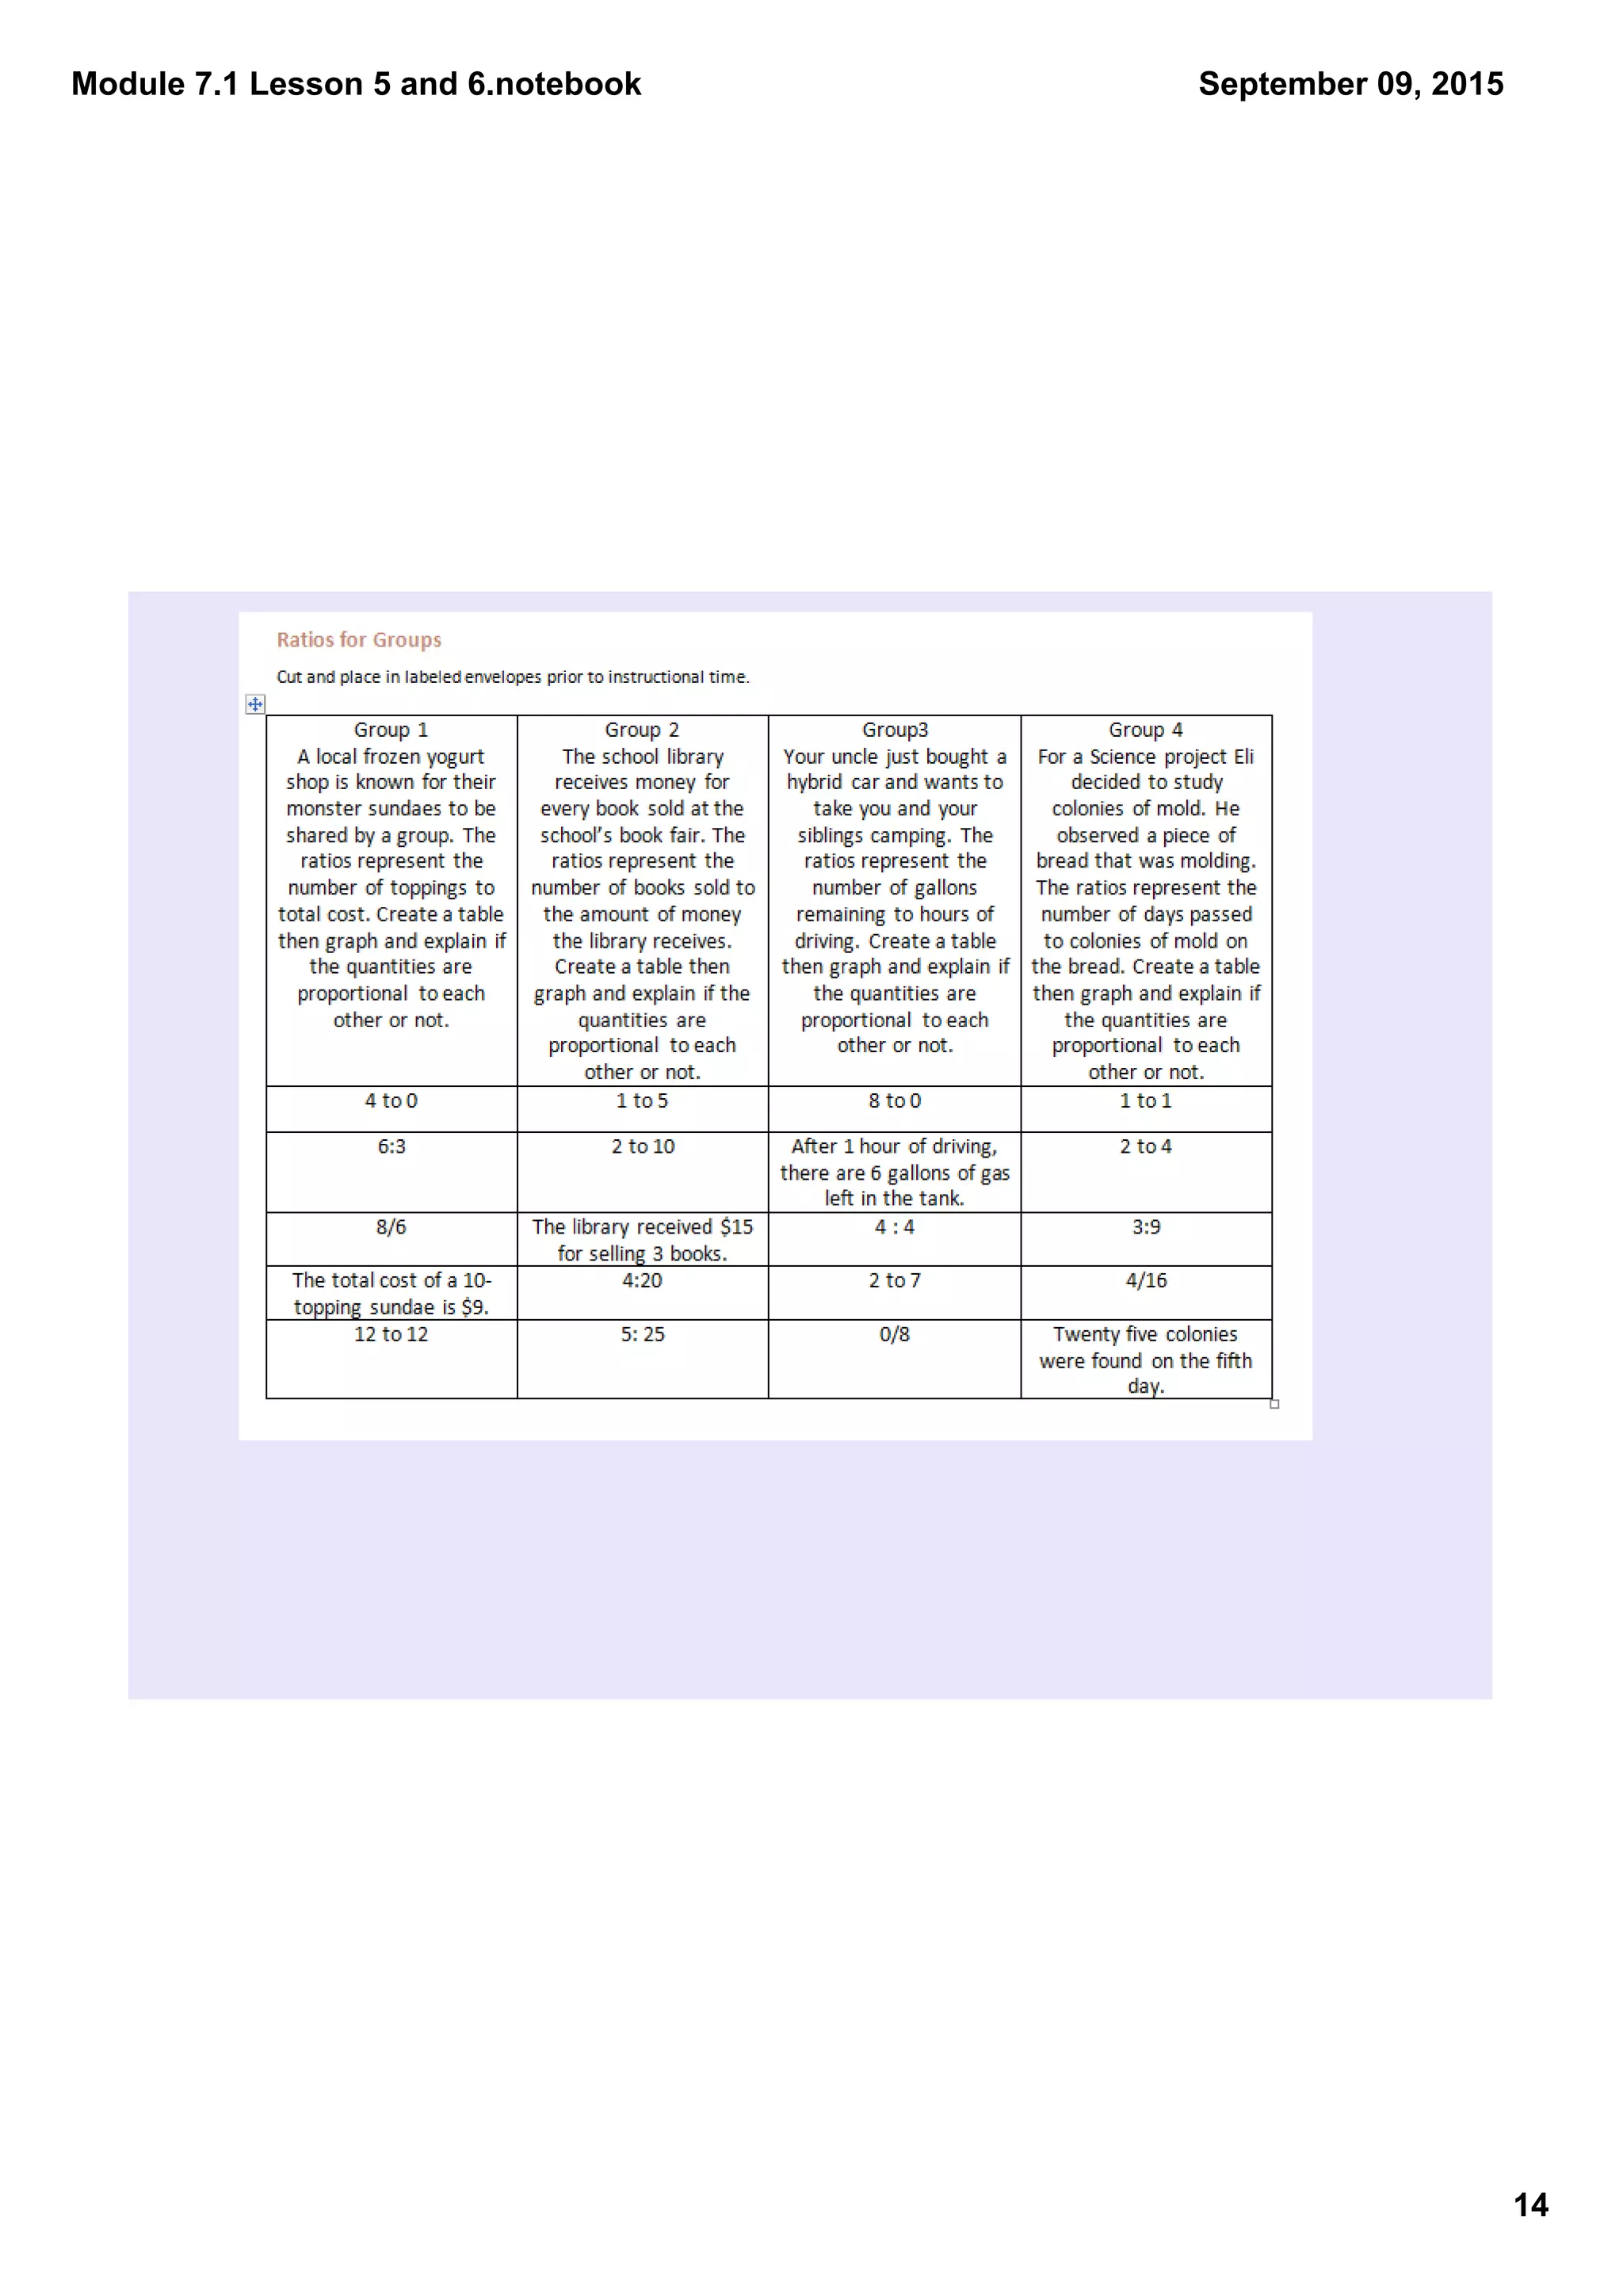
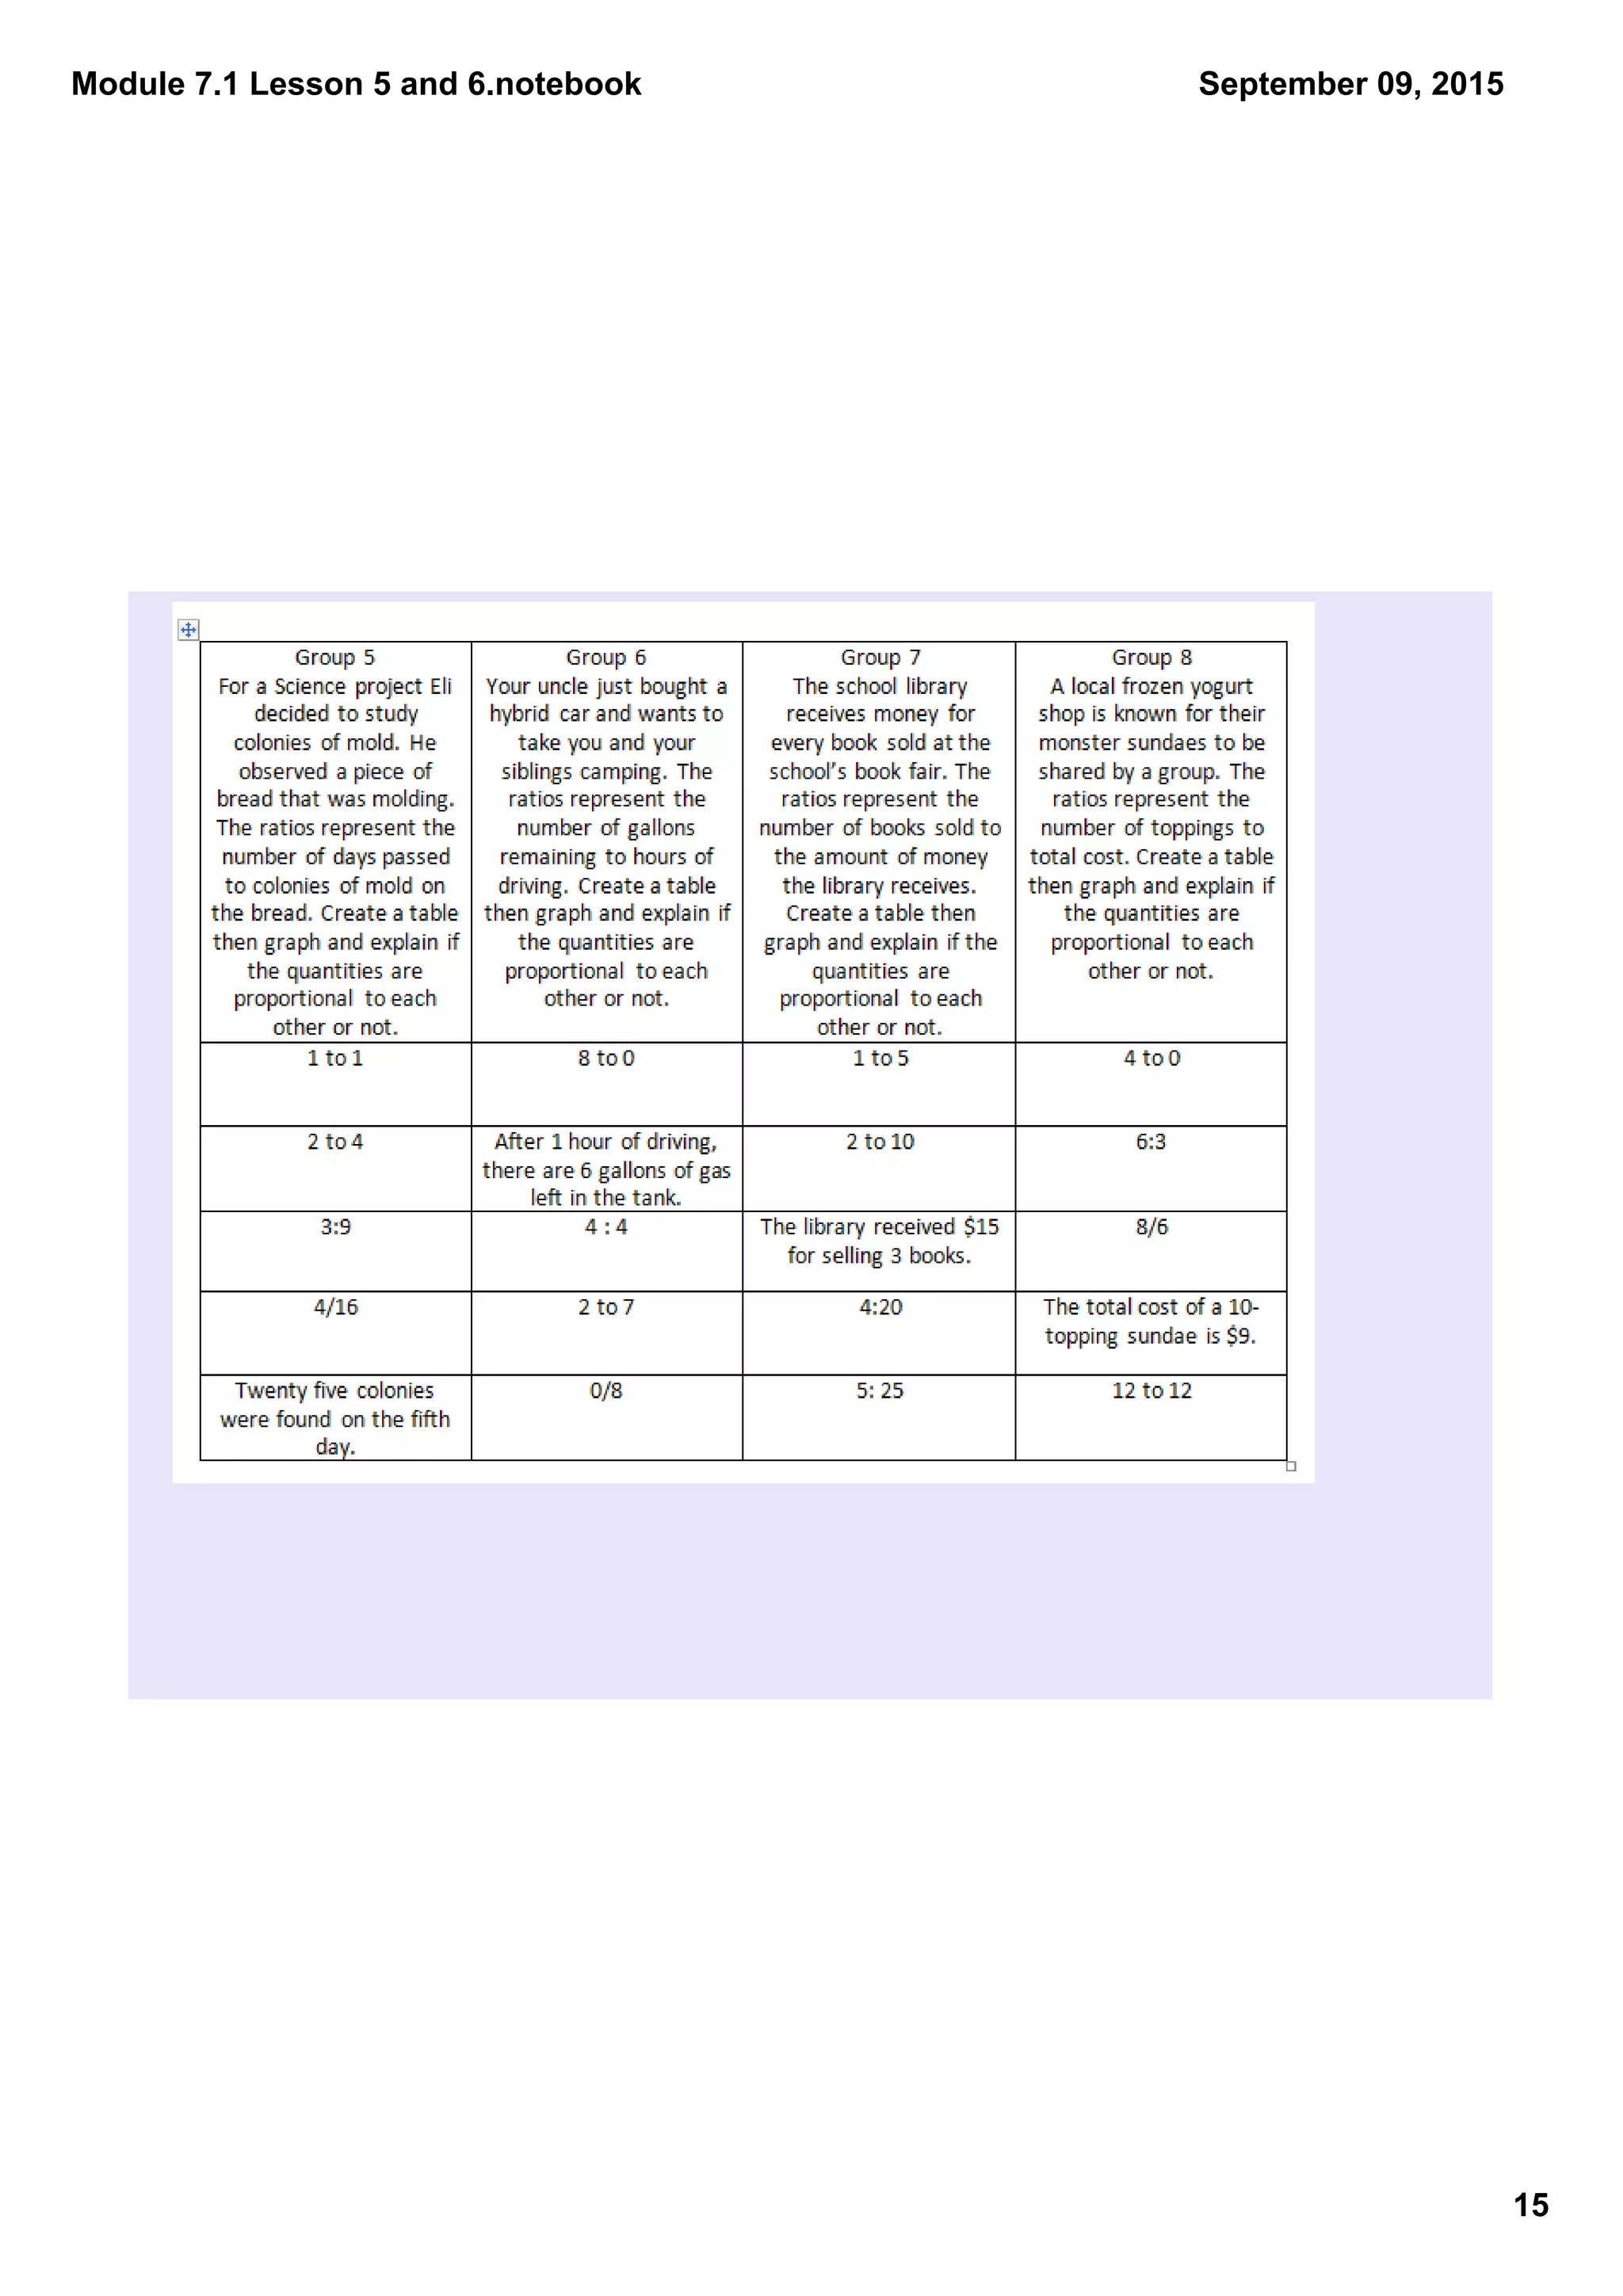
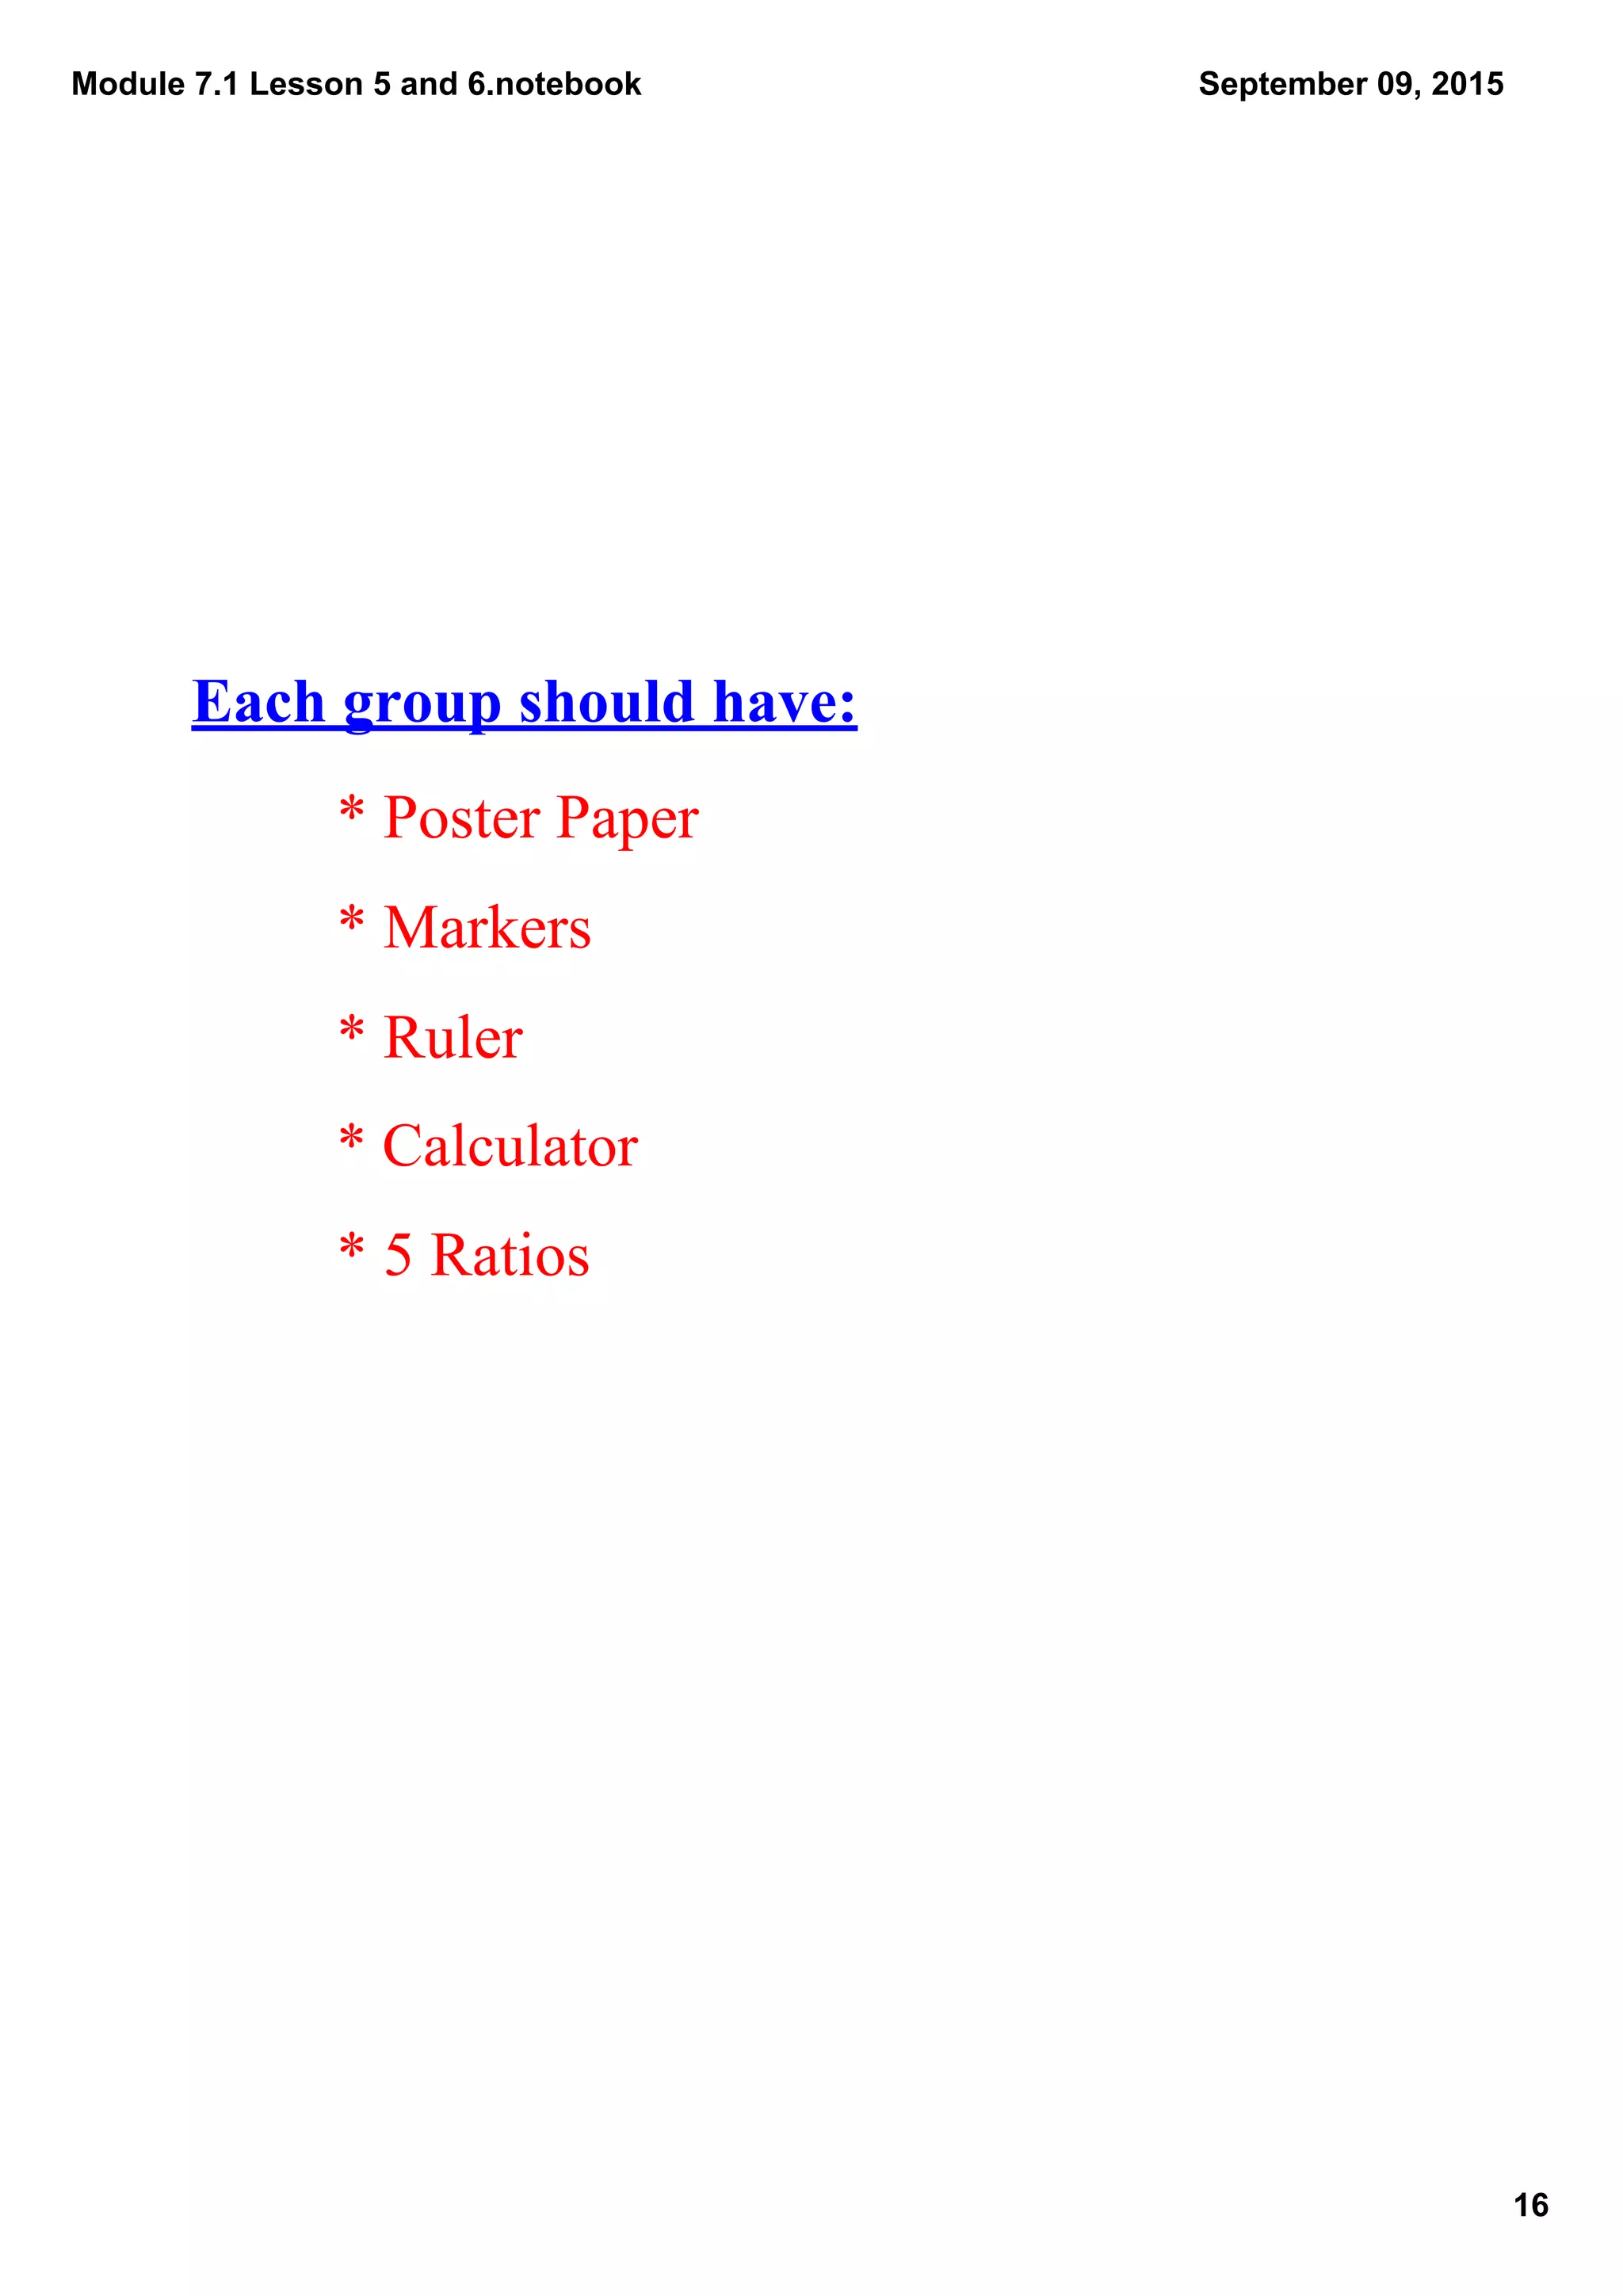
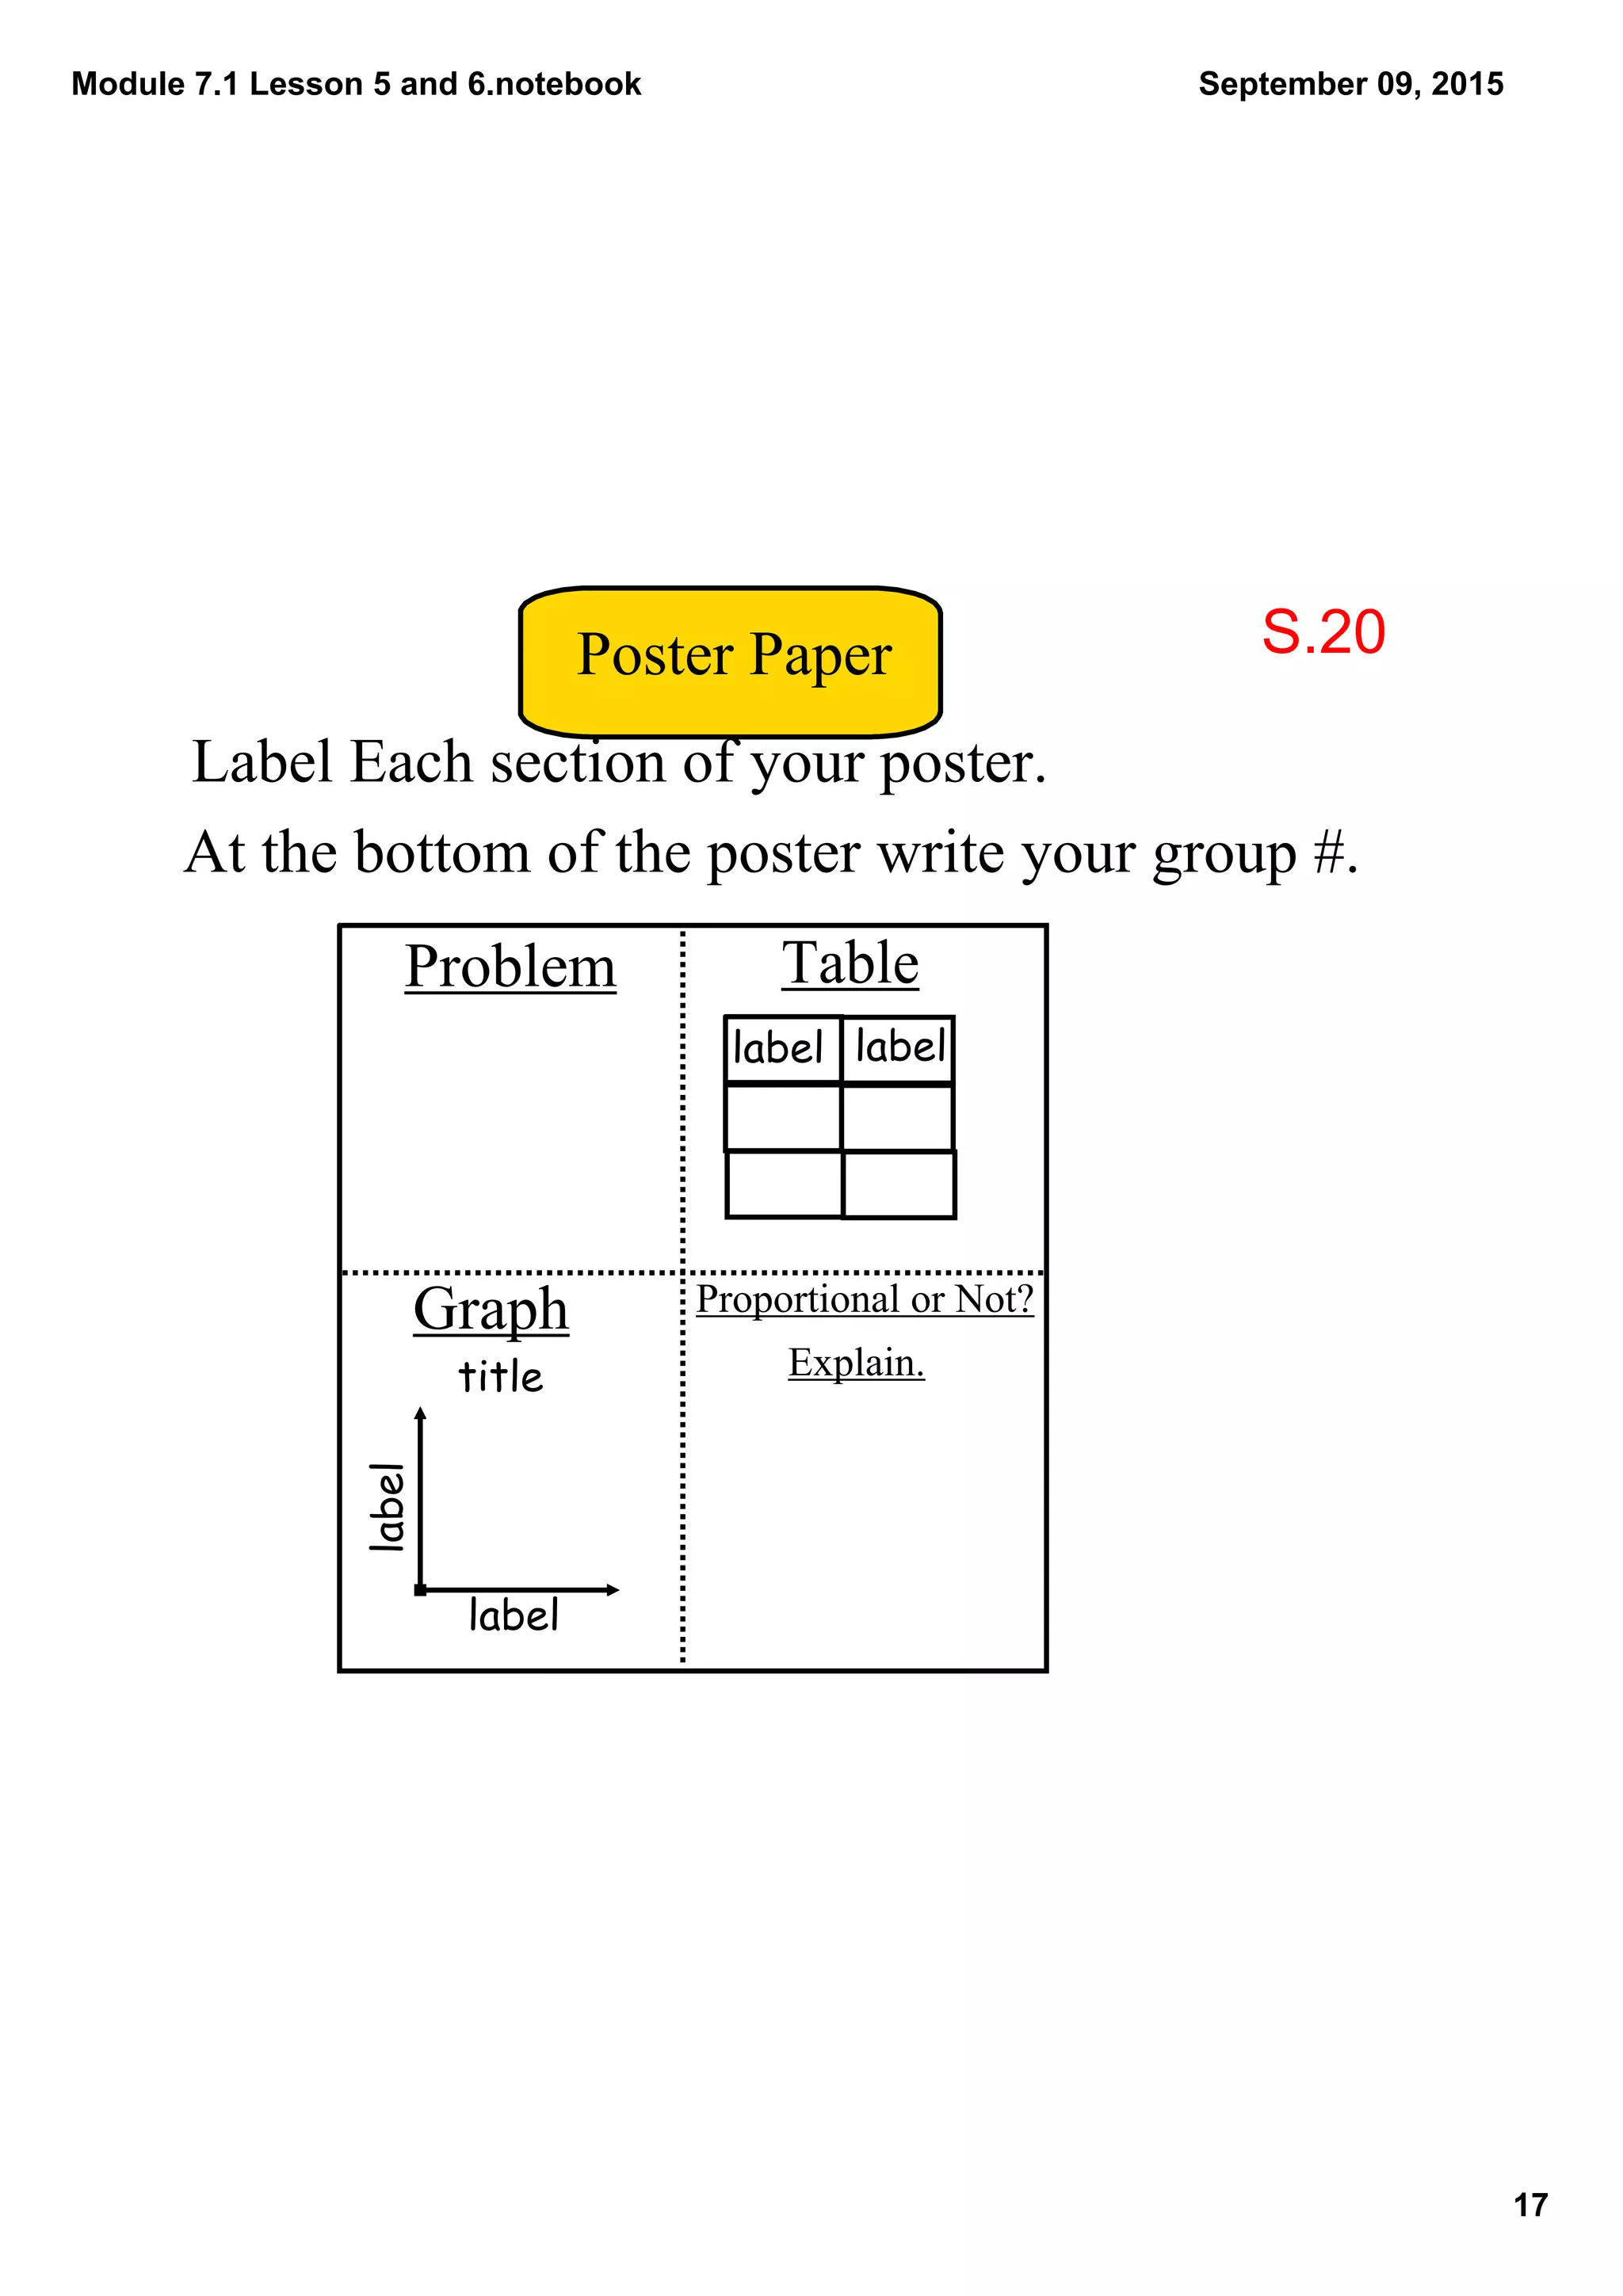
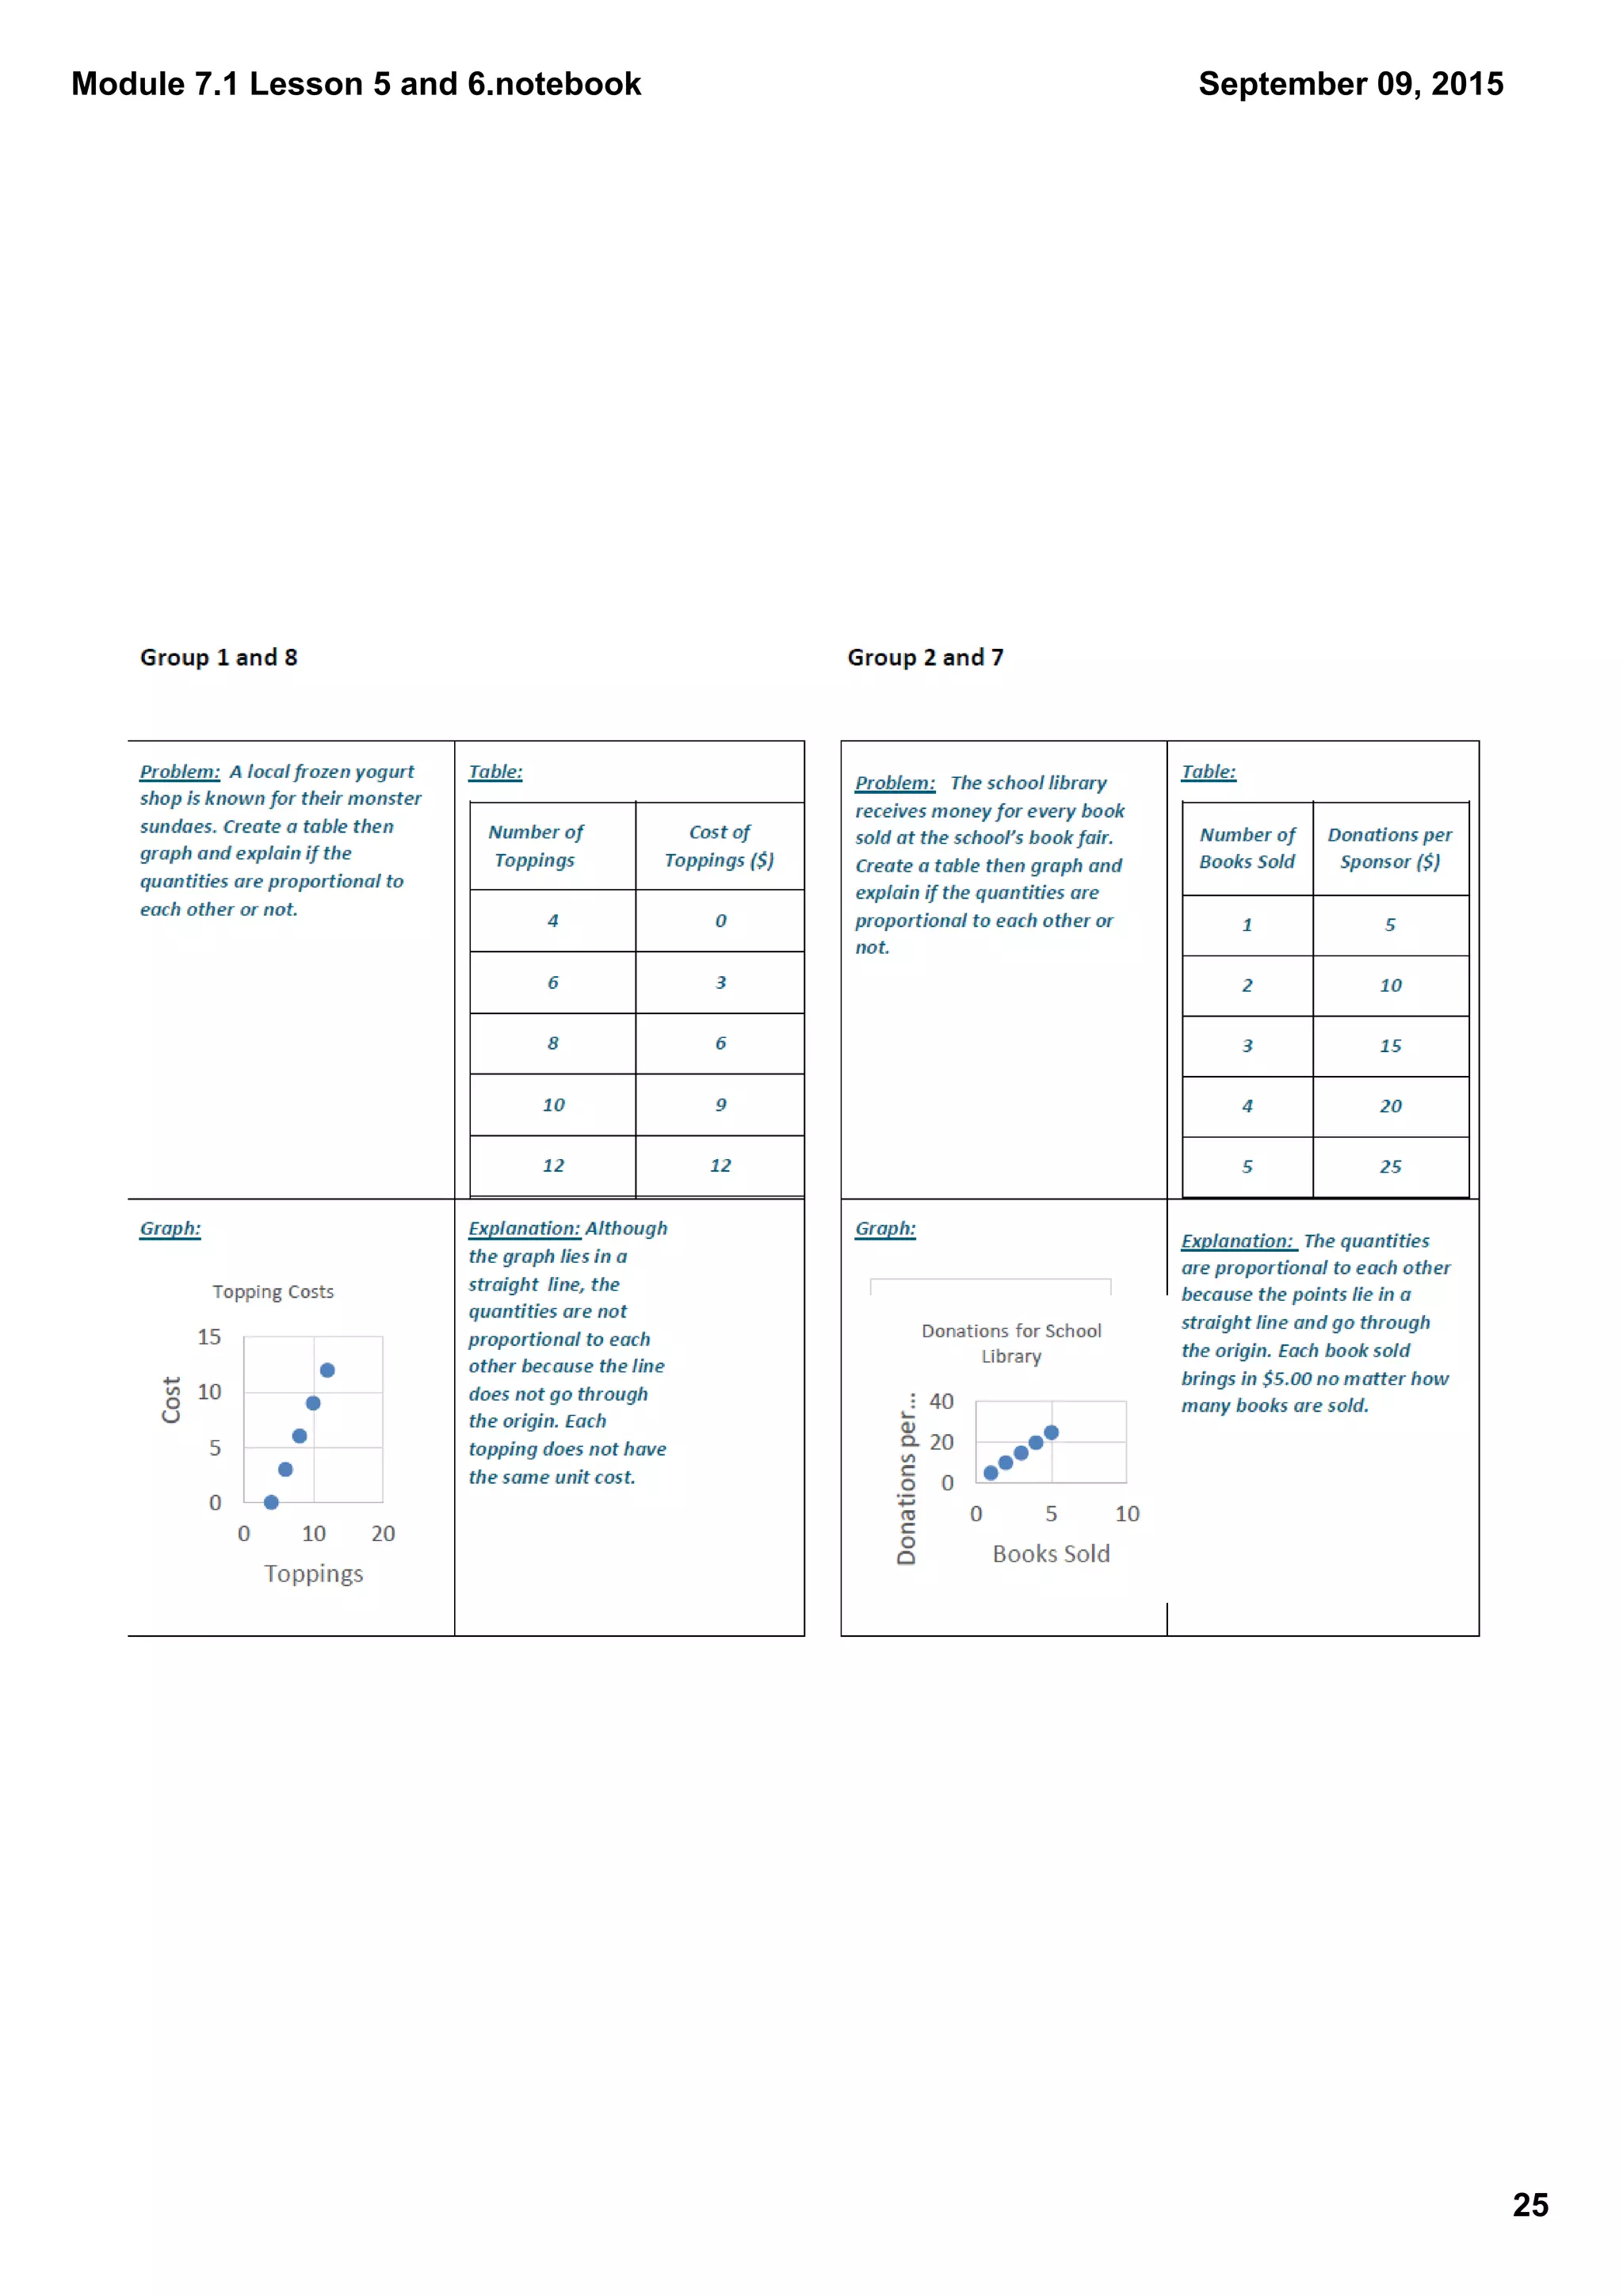
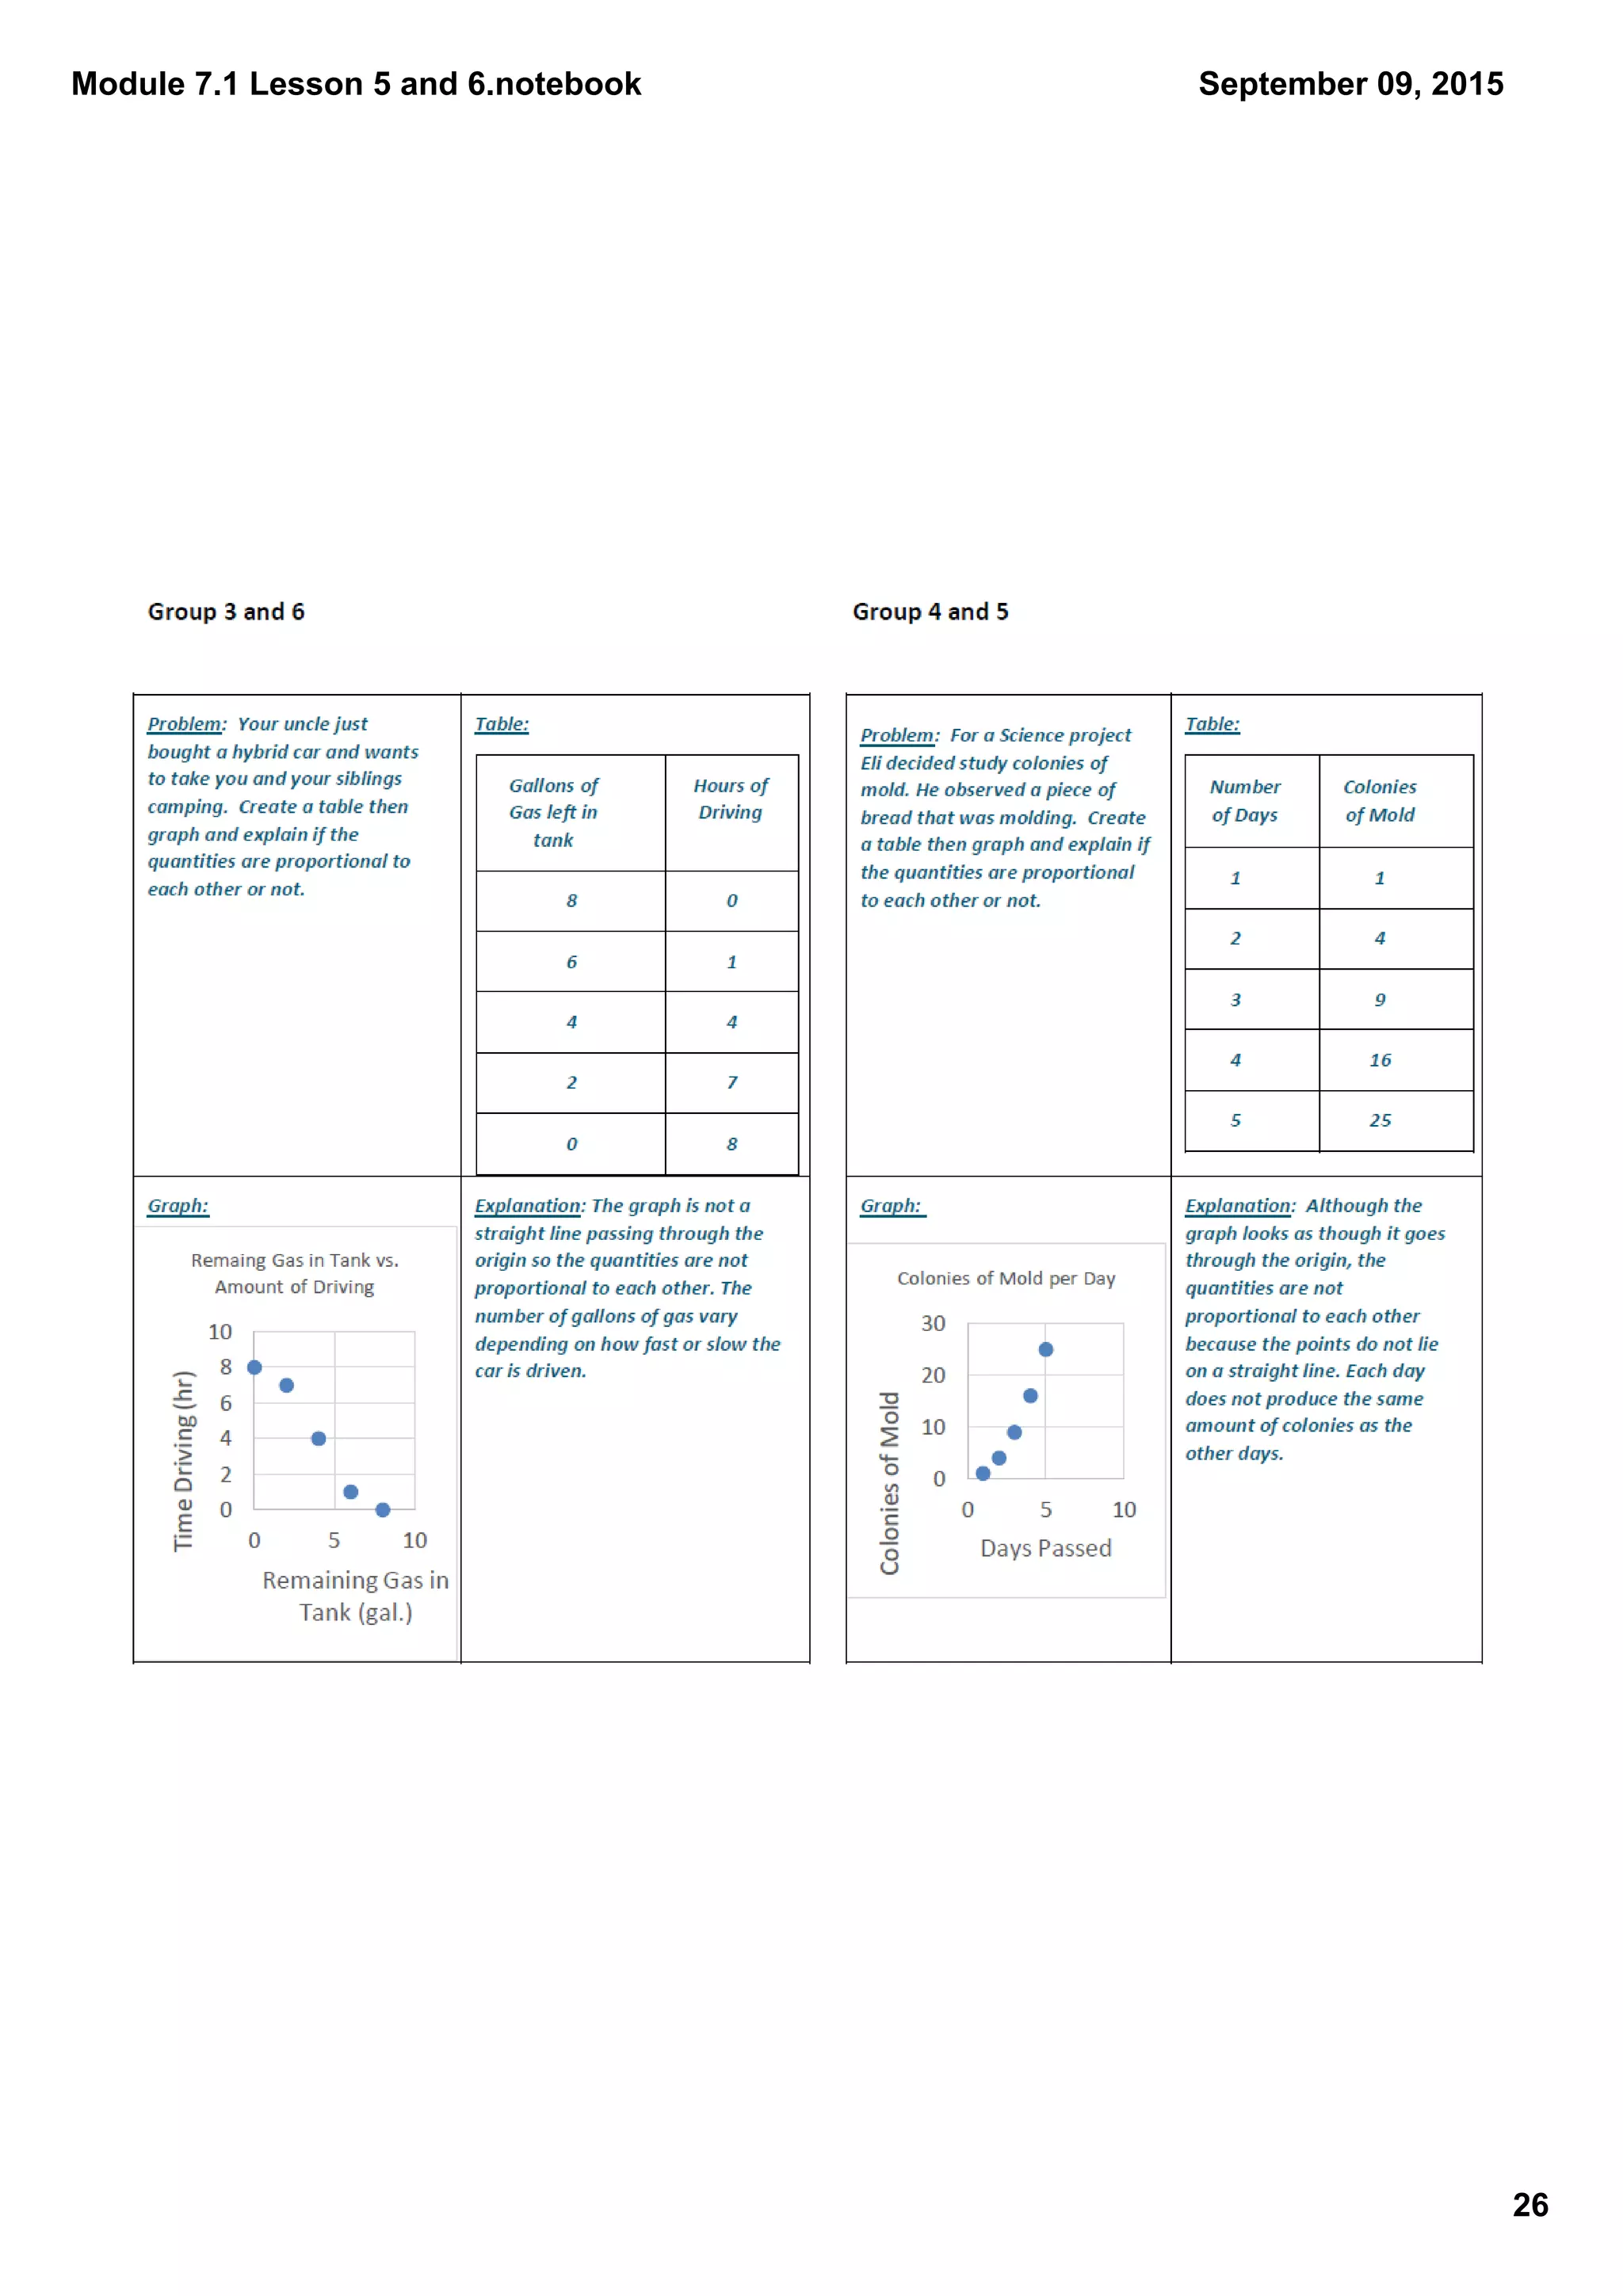
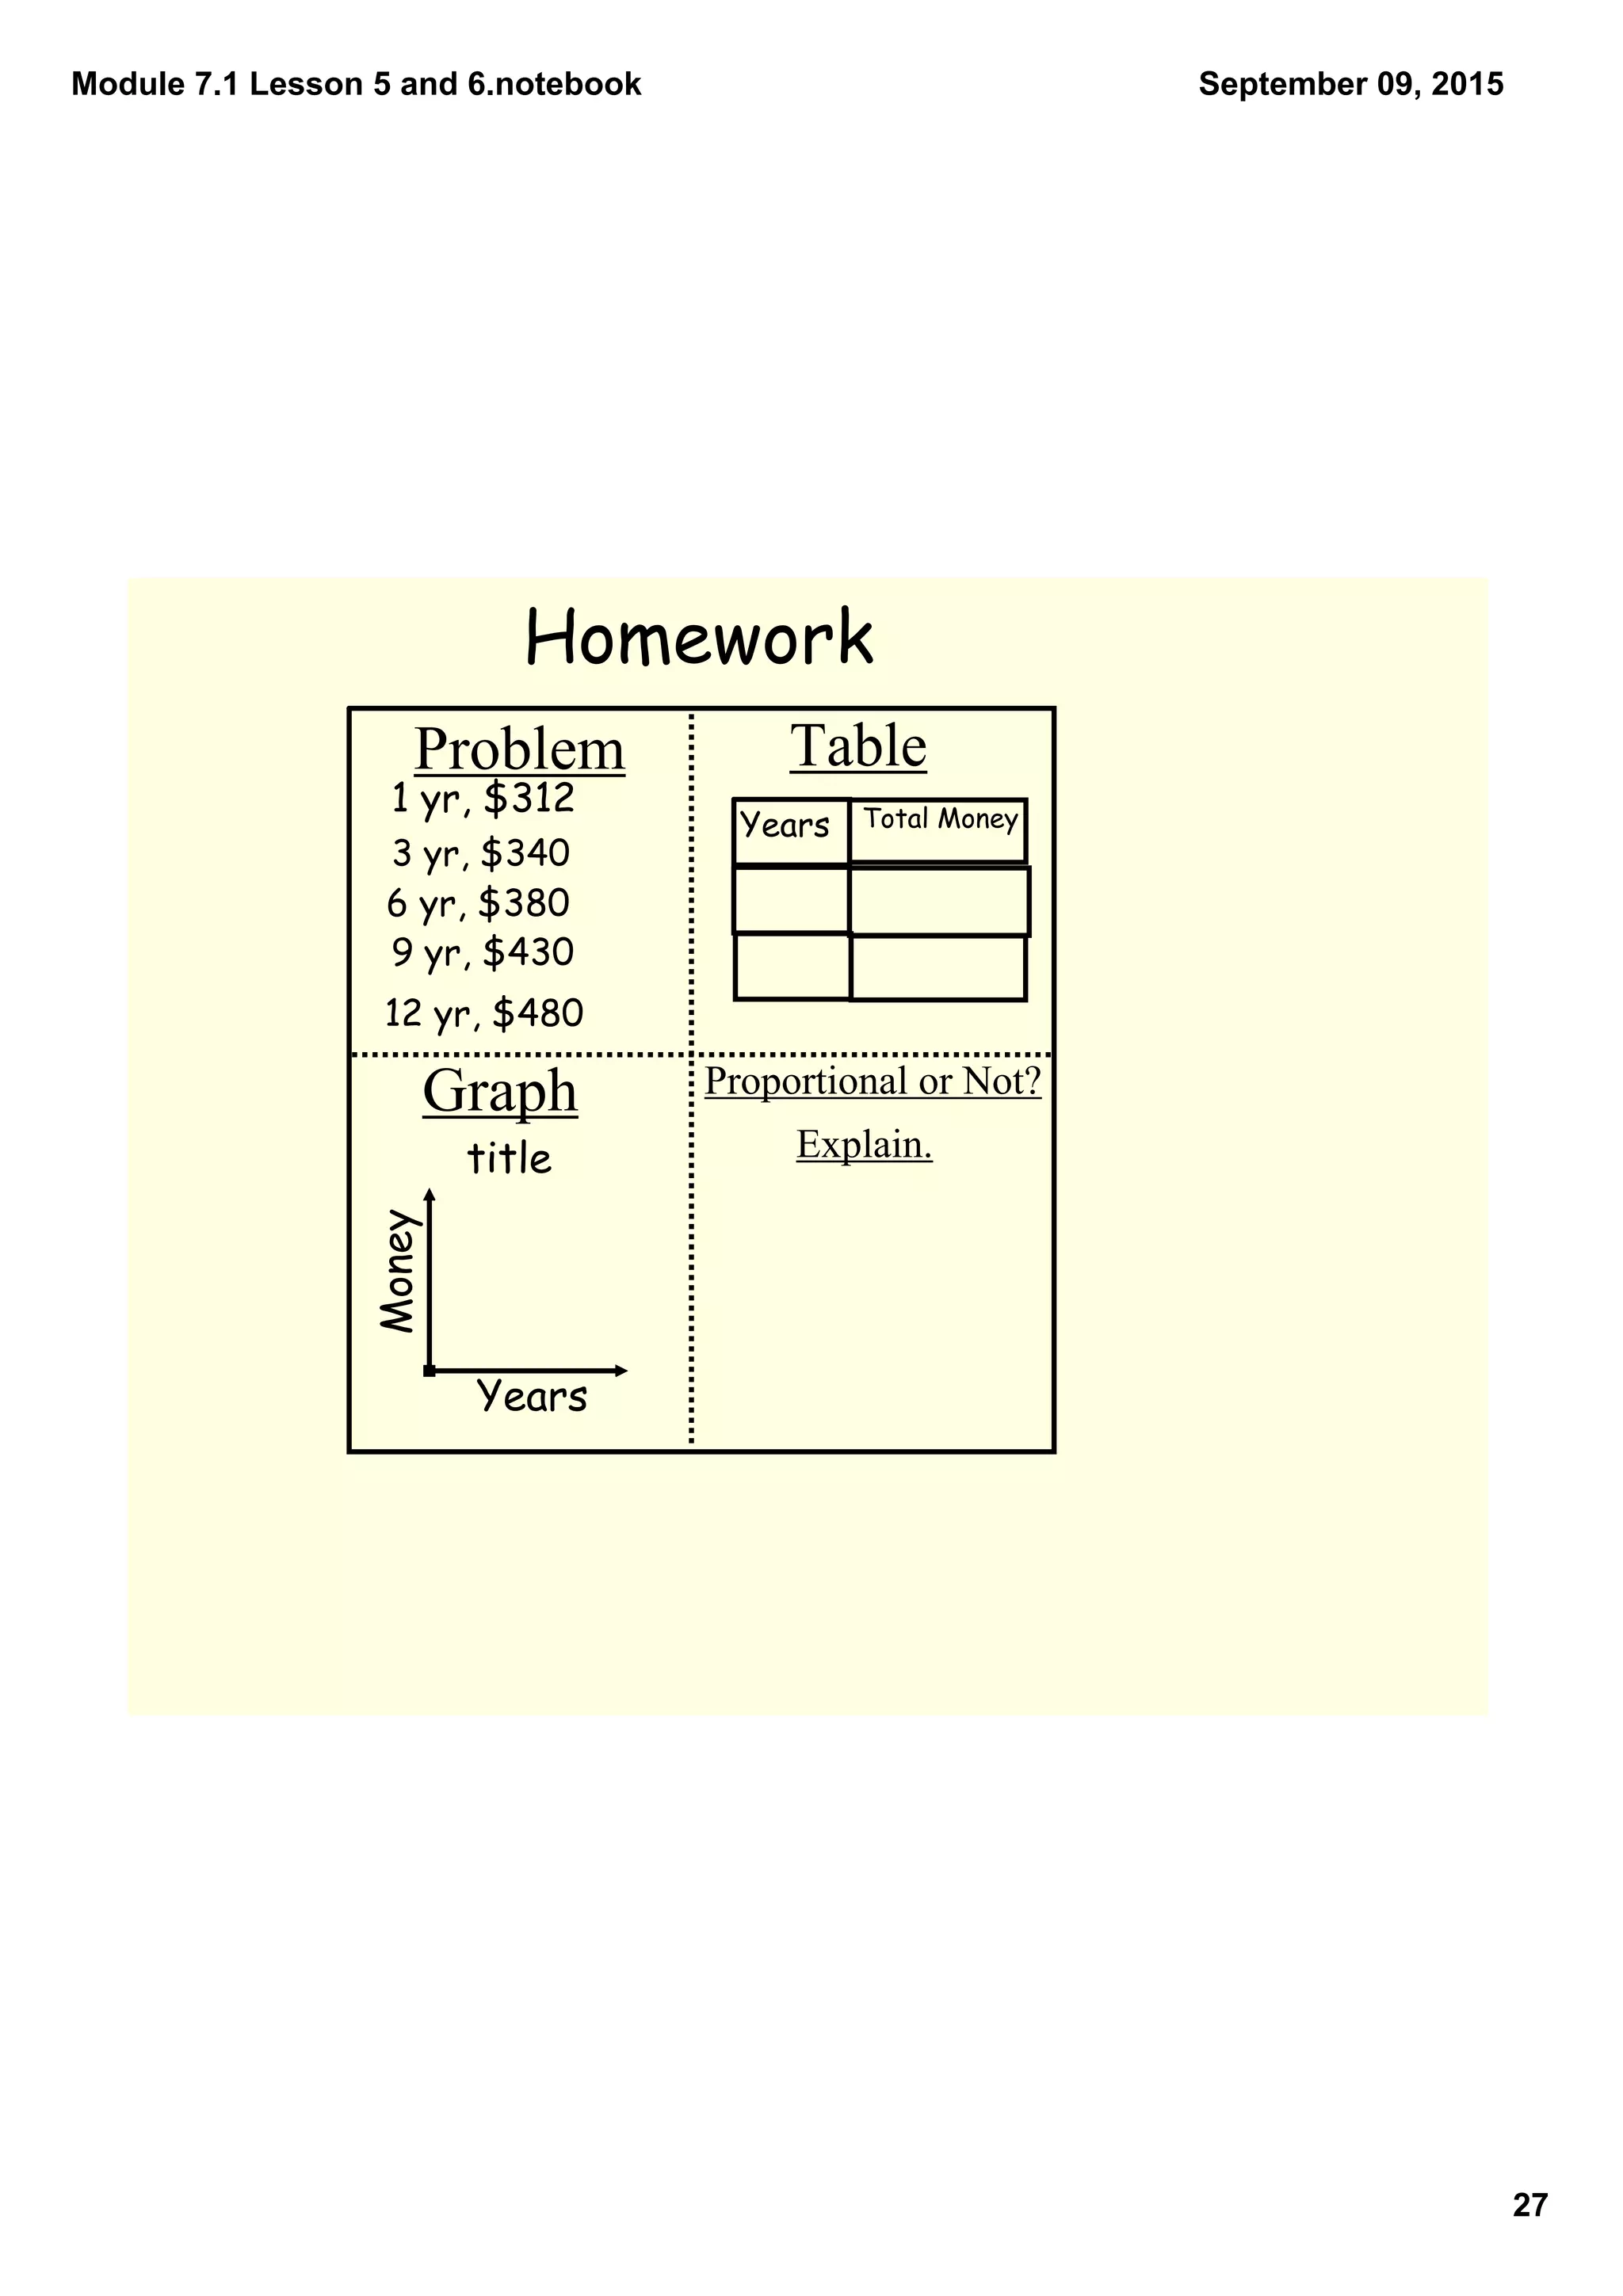
2) Students worked in groups to create posters showing ratios and whether the relationships were proportional or not based on their graphs.
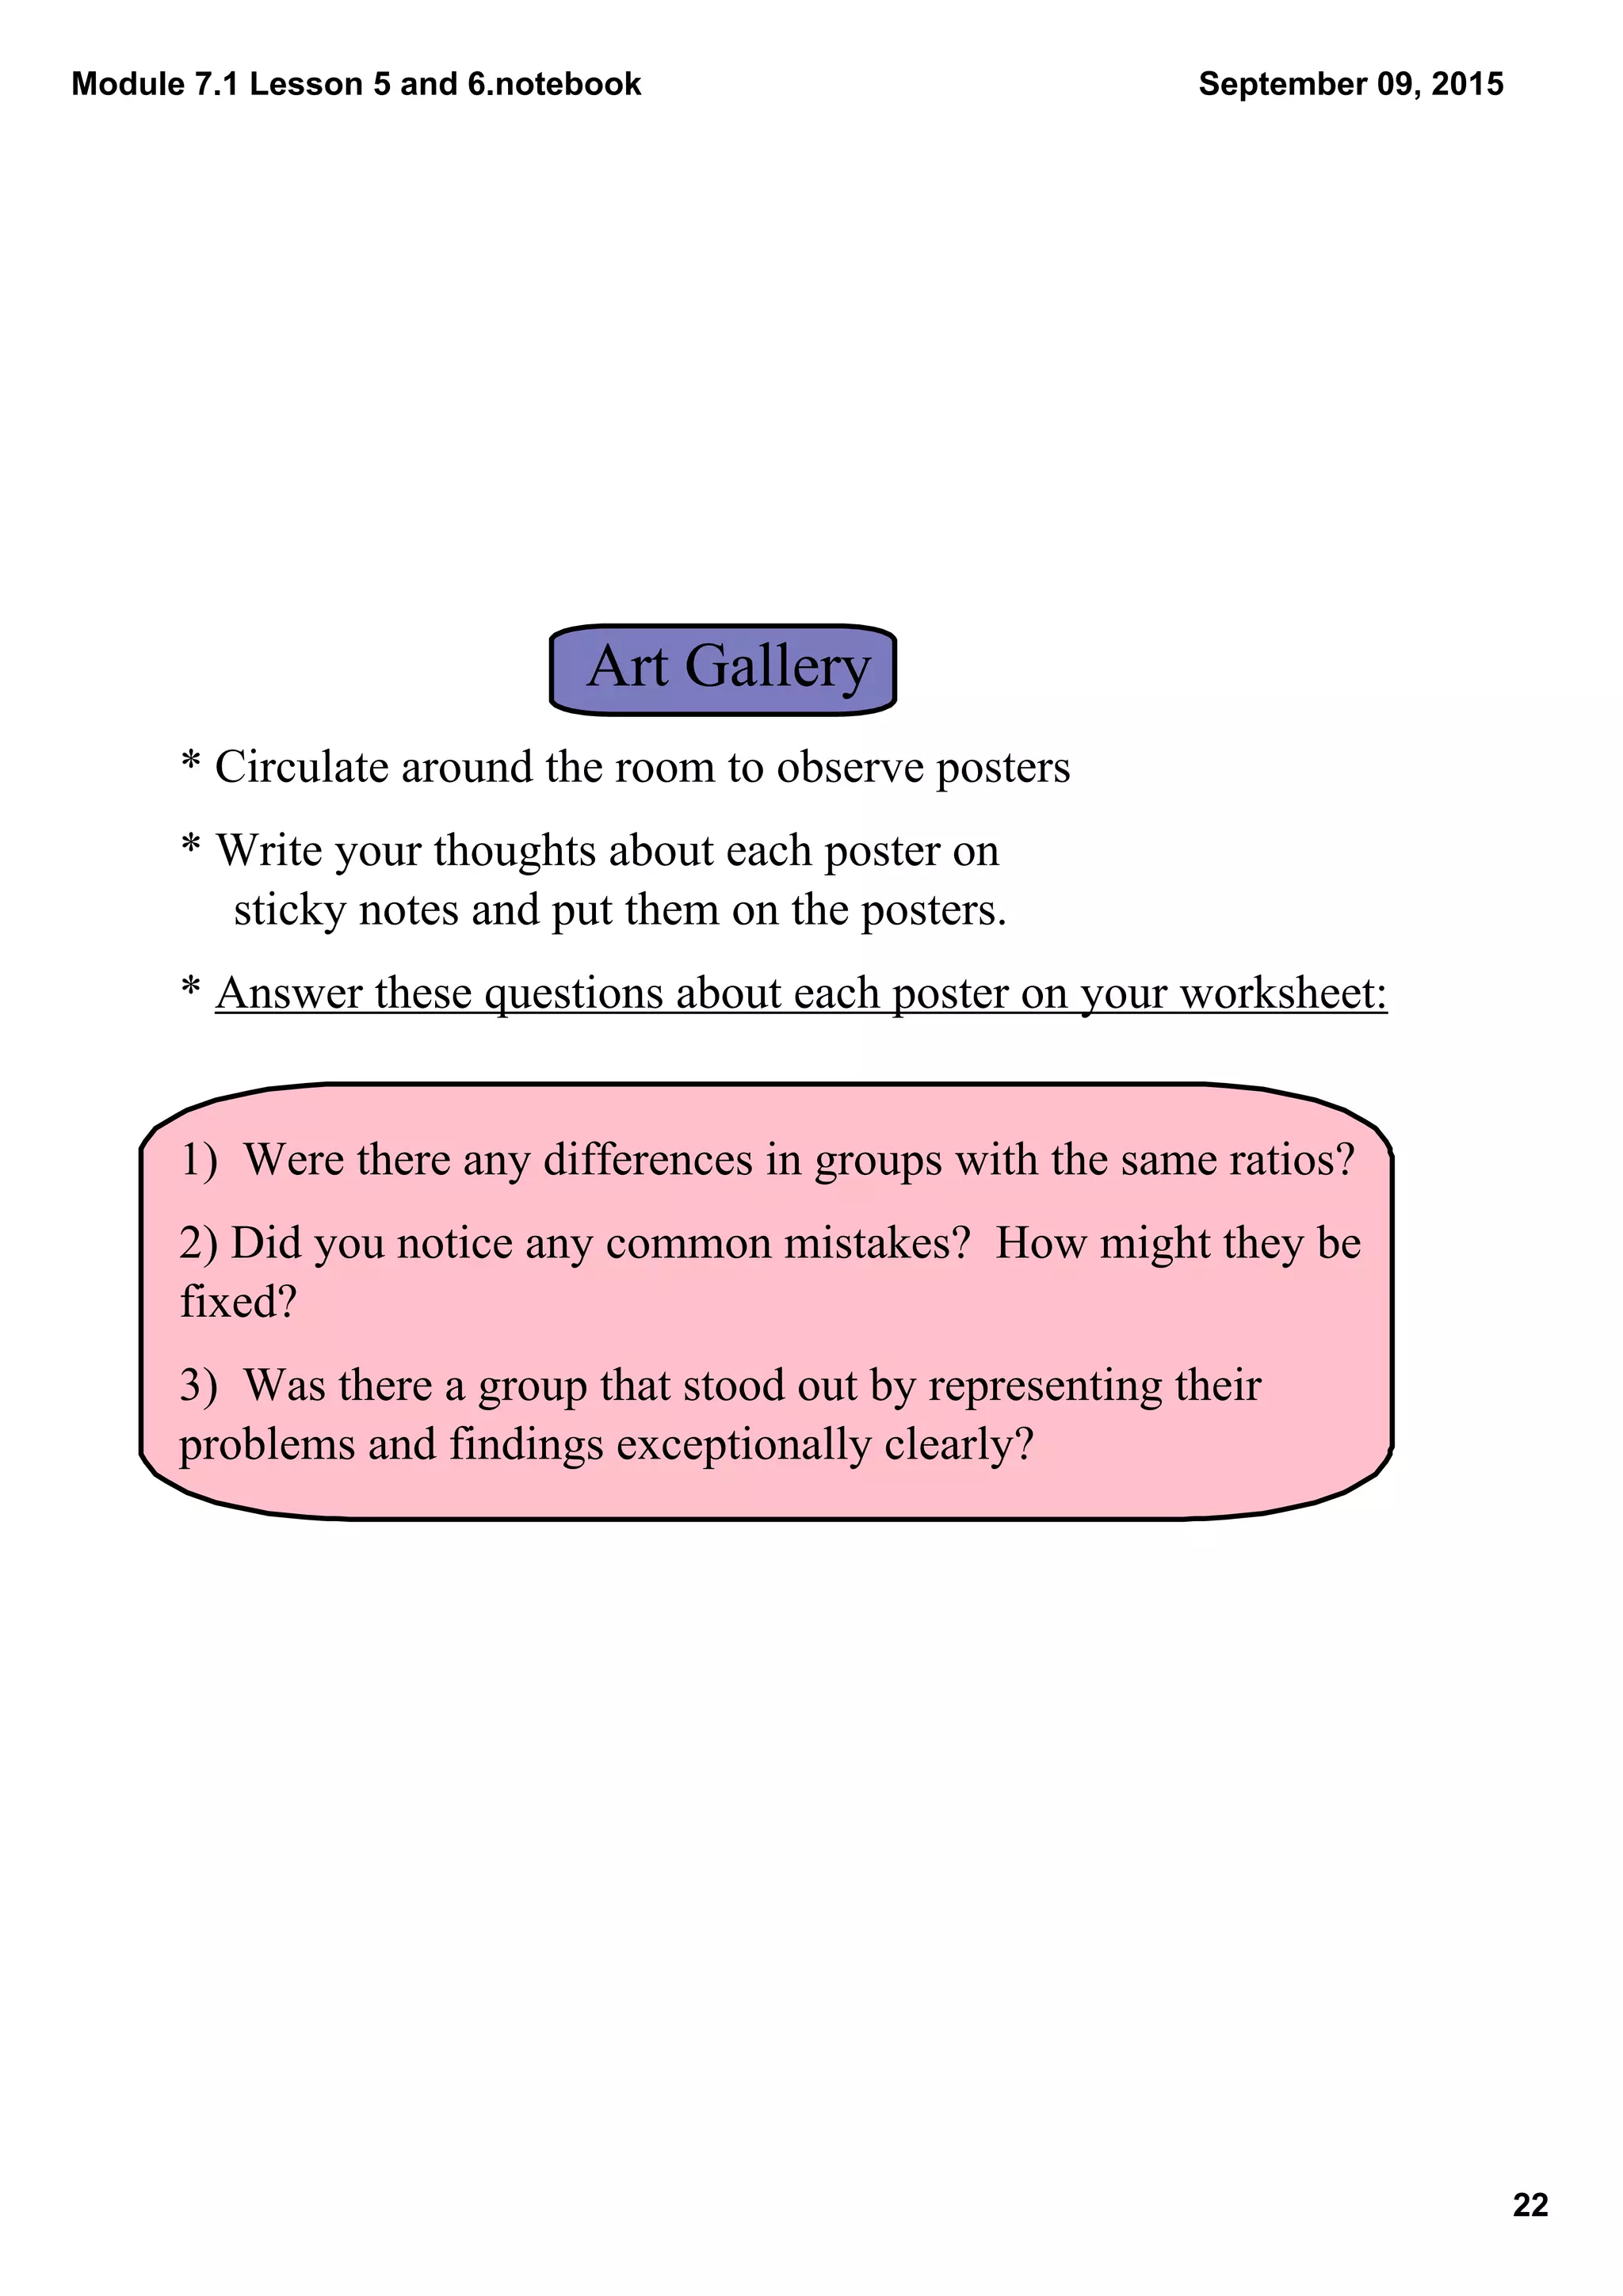
3) The class then participated in an "art gallery" where they viewed and provided feedback on each other's posters.