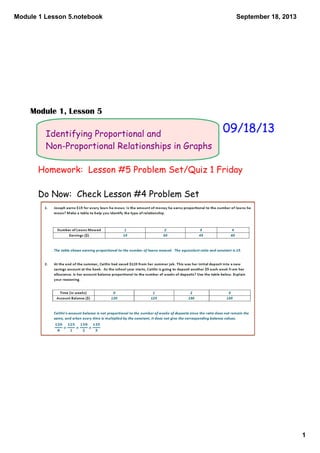
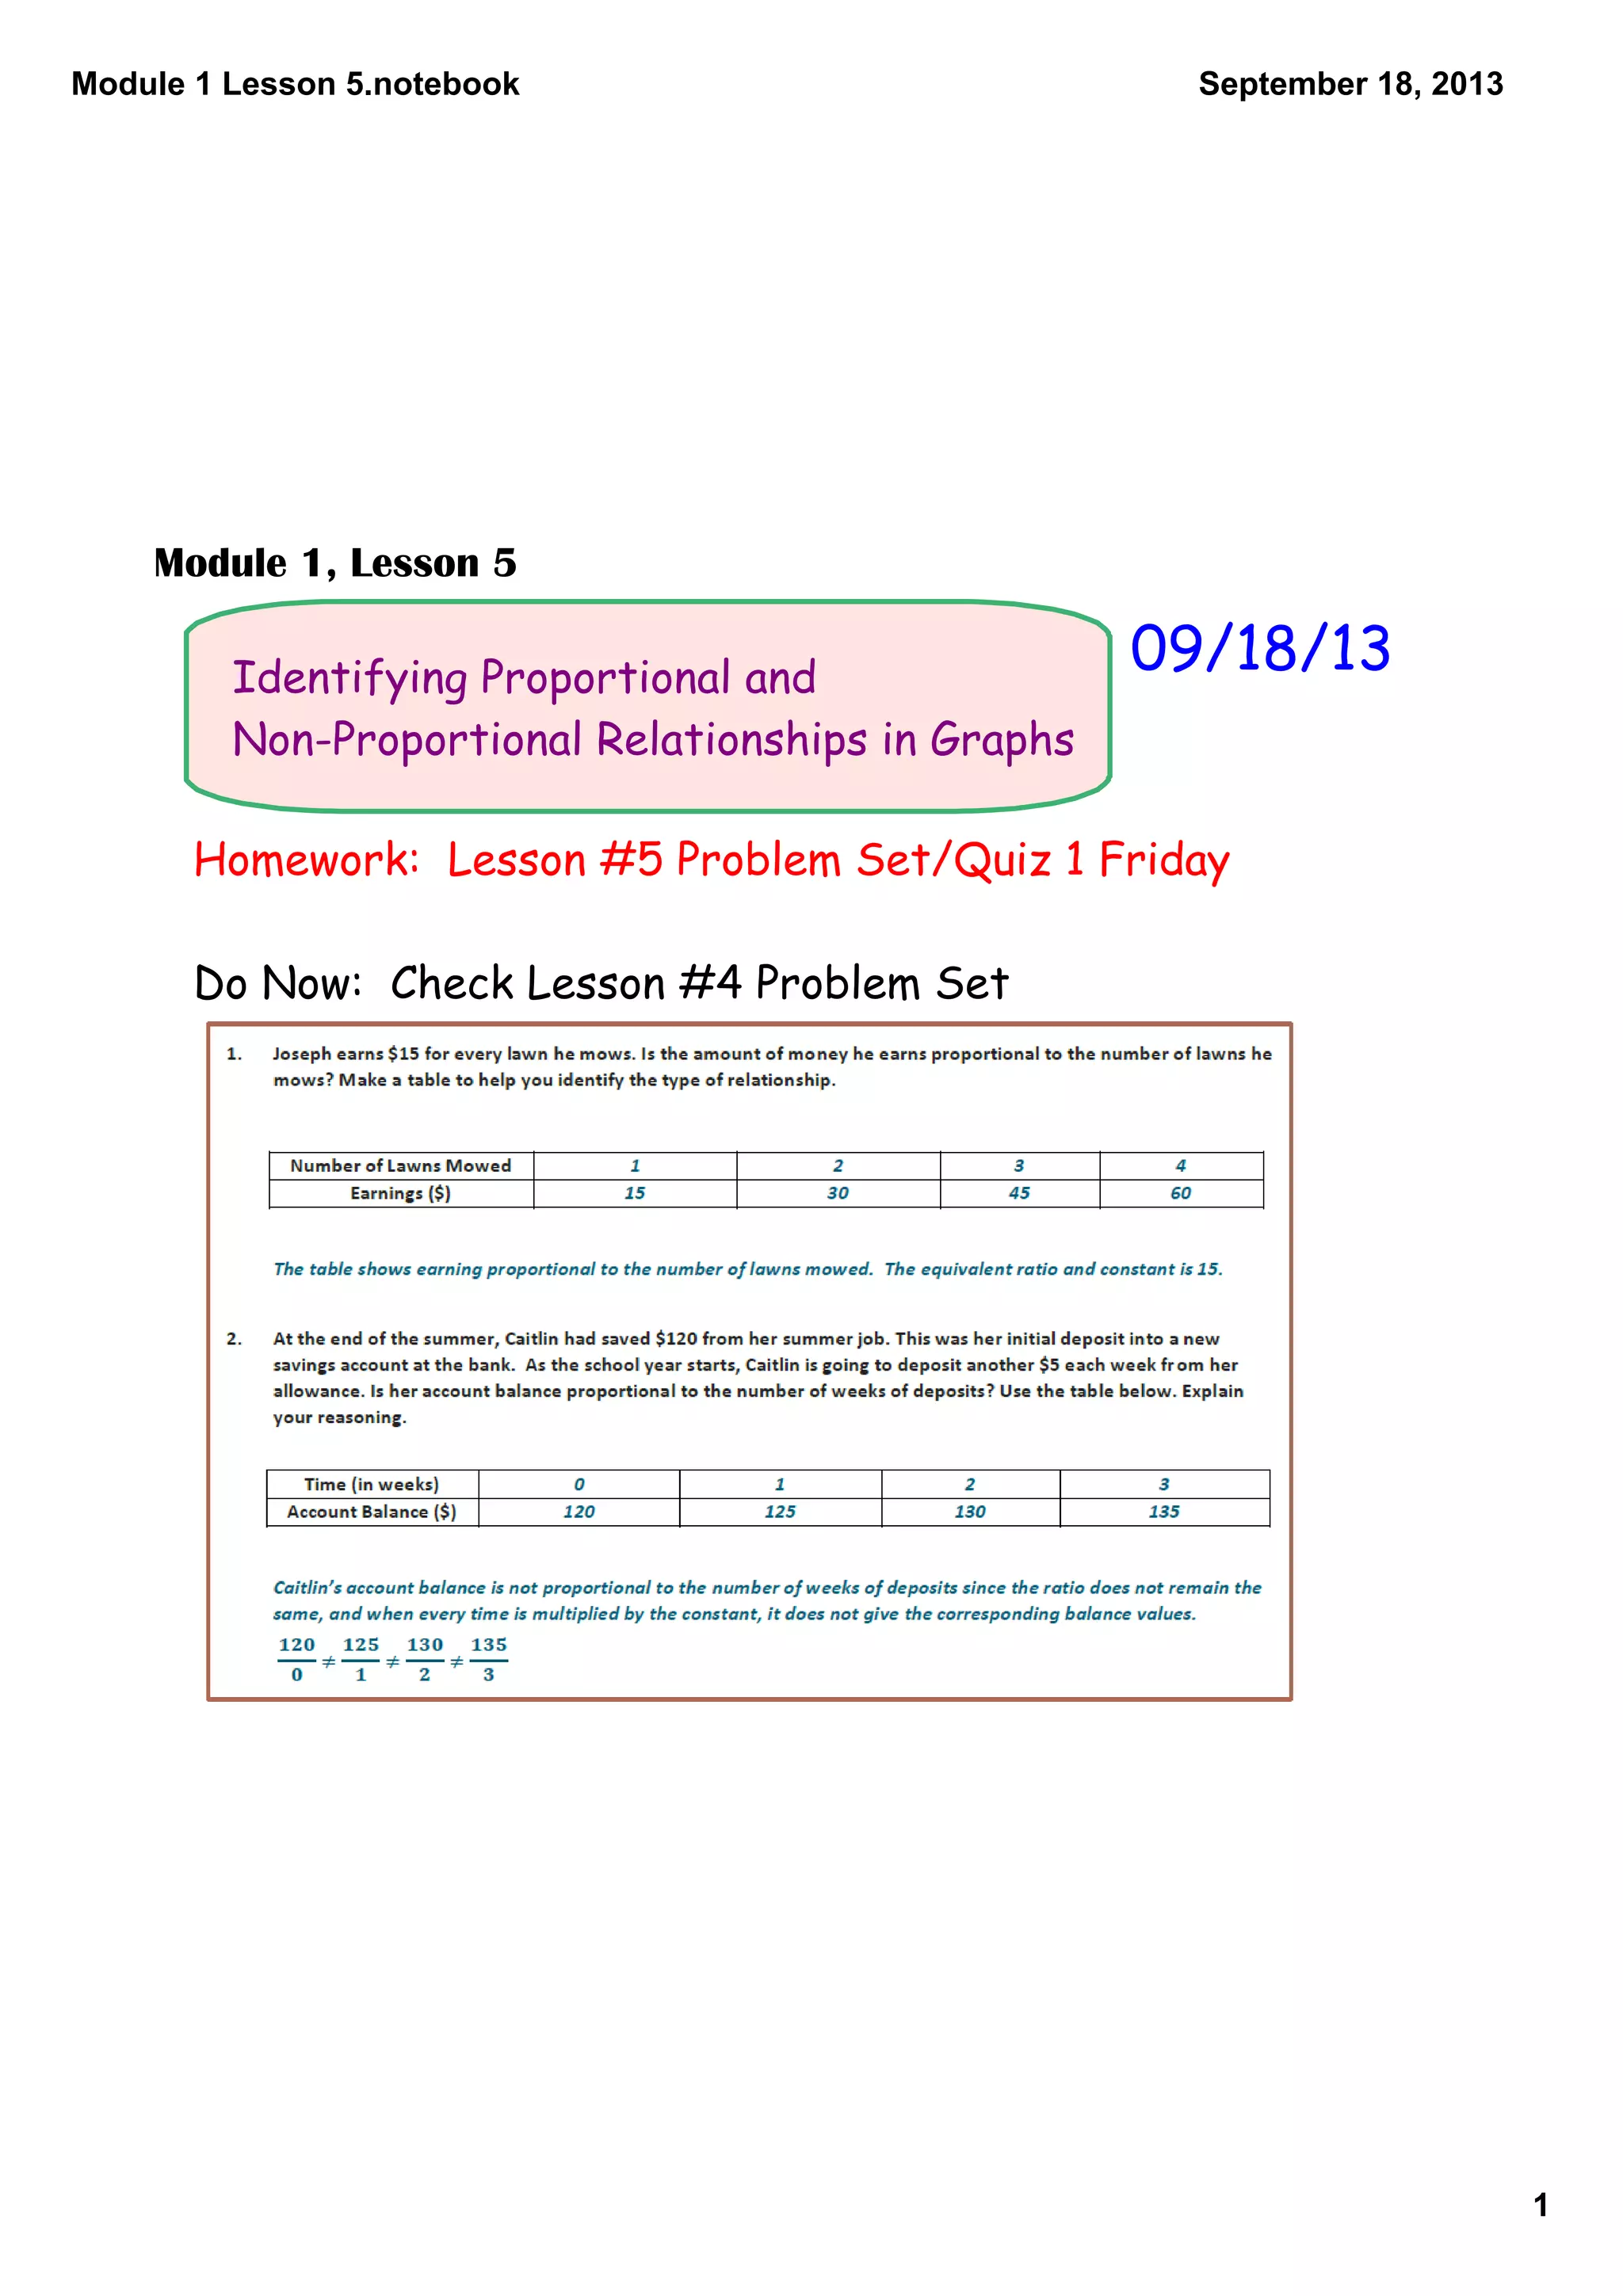
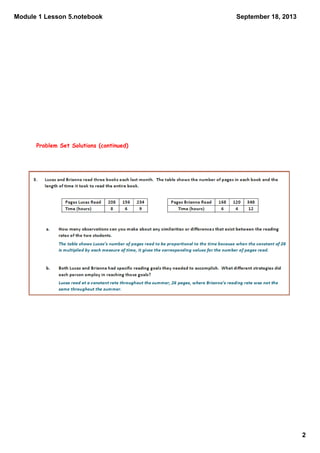
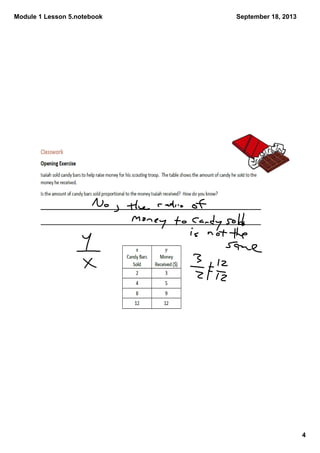
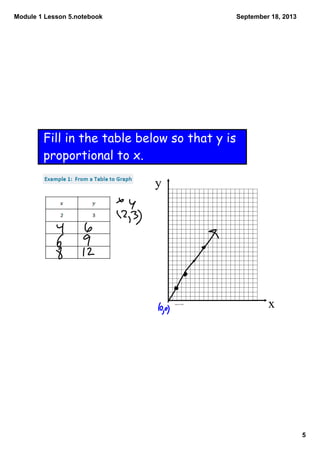
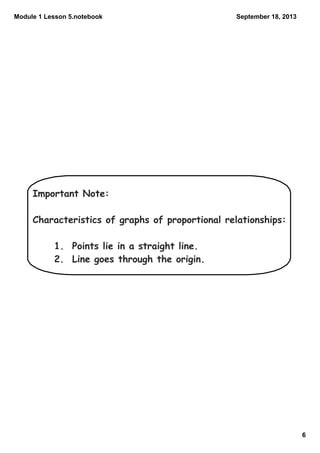
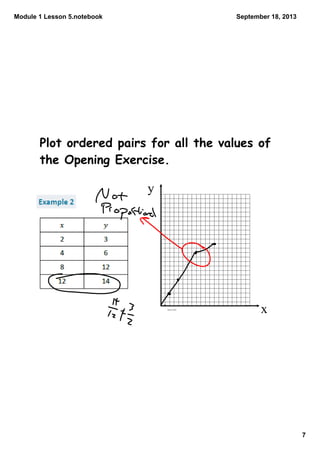
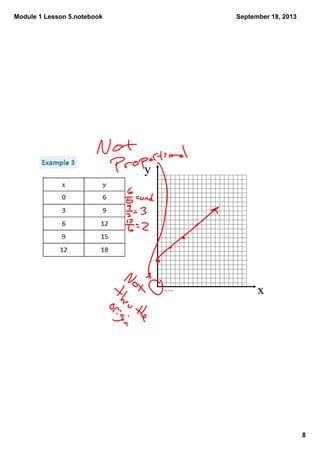
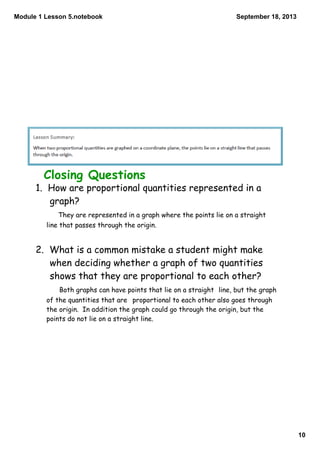
This document contains notes from a math lesson on identifying proportional and non-proportional relationships in graphs. It includes examples of filling in tables with proportional values and plotting those points on a graph. It emphasizes that for quantities to be proportional, their graph must be a straight line passing through the origin. The closing questions review that proportional relationships are represented by graphs with points on a line through the origin, and that a common mistake is thinking quantities are proportional if their graph is a straight line but does not pass through the origin.


![Getting Started with Apache Spark: Big Data Made Simple [Free Meetup]](https://cdn.slidesharecdn.com/ss_thumbnails/apachesparkgettingstarted-260203175547-8361bcc3-thumbnail.jpg?width=640&height=640&fit=bounds)


