Downloaded 461 times


![ABC
A
N
A
L
Y
S
I
S
WORK
SHEET
1
90000
90000
2
50000
140000
20000
160000
4
7500
167500
5
7500
175000
5000
180000
4500
184500
8
4000
188500
9
2750
191250
10
1750
193000
11
1500
194500
12
70 %
CUMMULATIVE
COST [Rs.]
7
20 %
ANNUAL COST
[Rs.]
6
10 %
ITEM
3
ITEM %
1500
196000
13
500
196500
14
500
197000
15
500
197500
16
500
198000
17
500
198500
18
500
199000
19
500
199500
20
500
200000
COST %
70 %
20 %
10 %](https://image.slidesharecdn.com/modernmanagementtechniques-140114100347-phpapp01/75/Modern-management-techniques-part-1-48-2048.jpg)


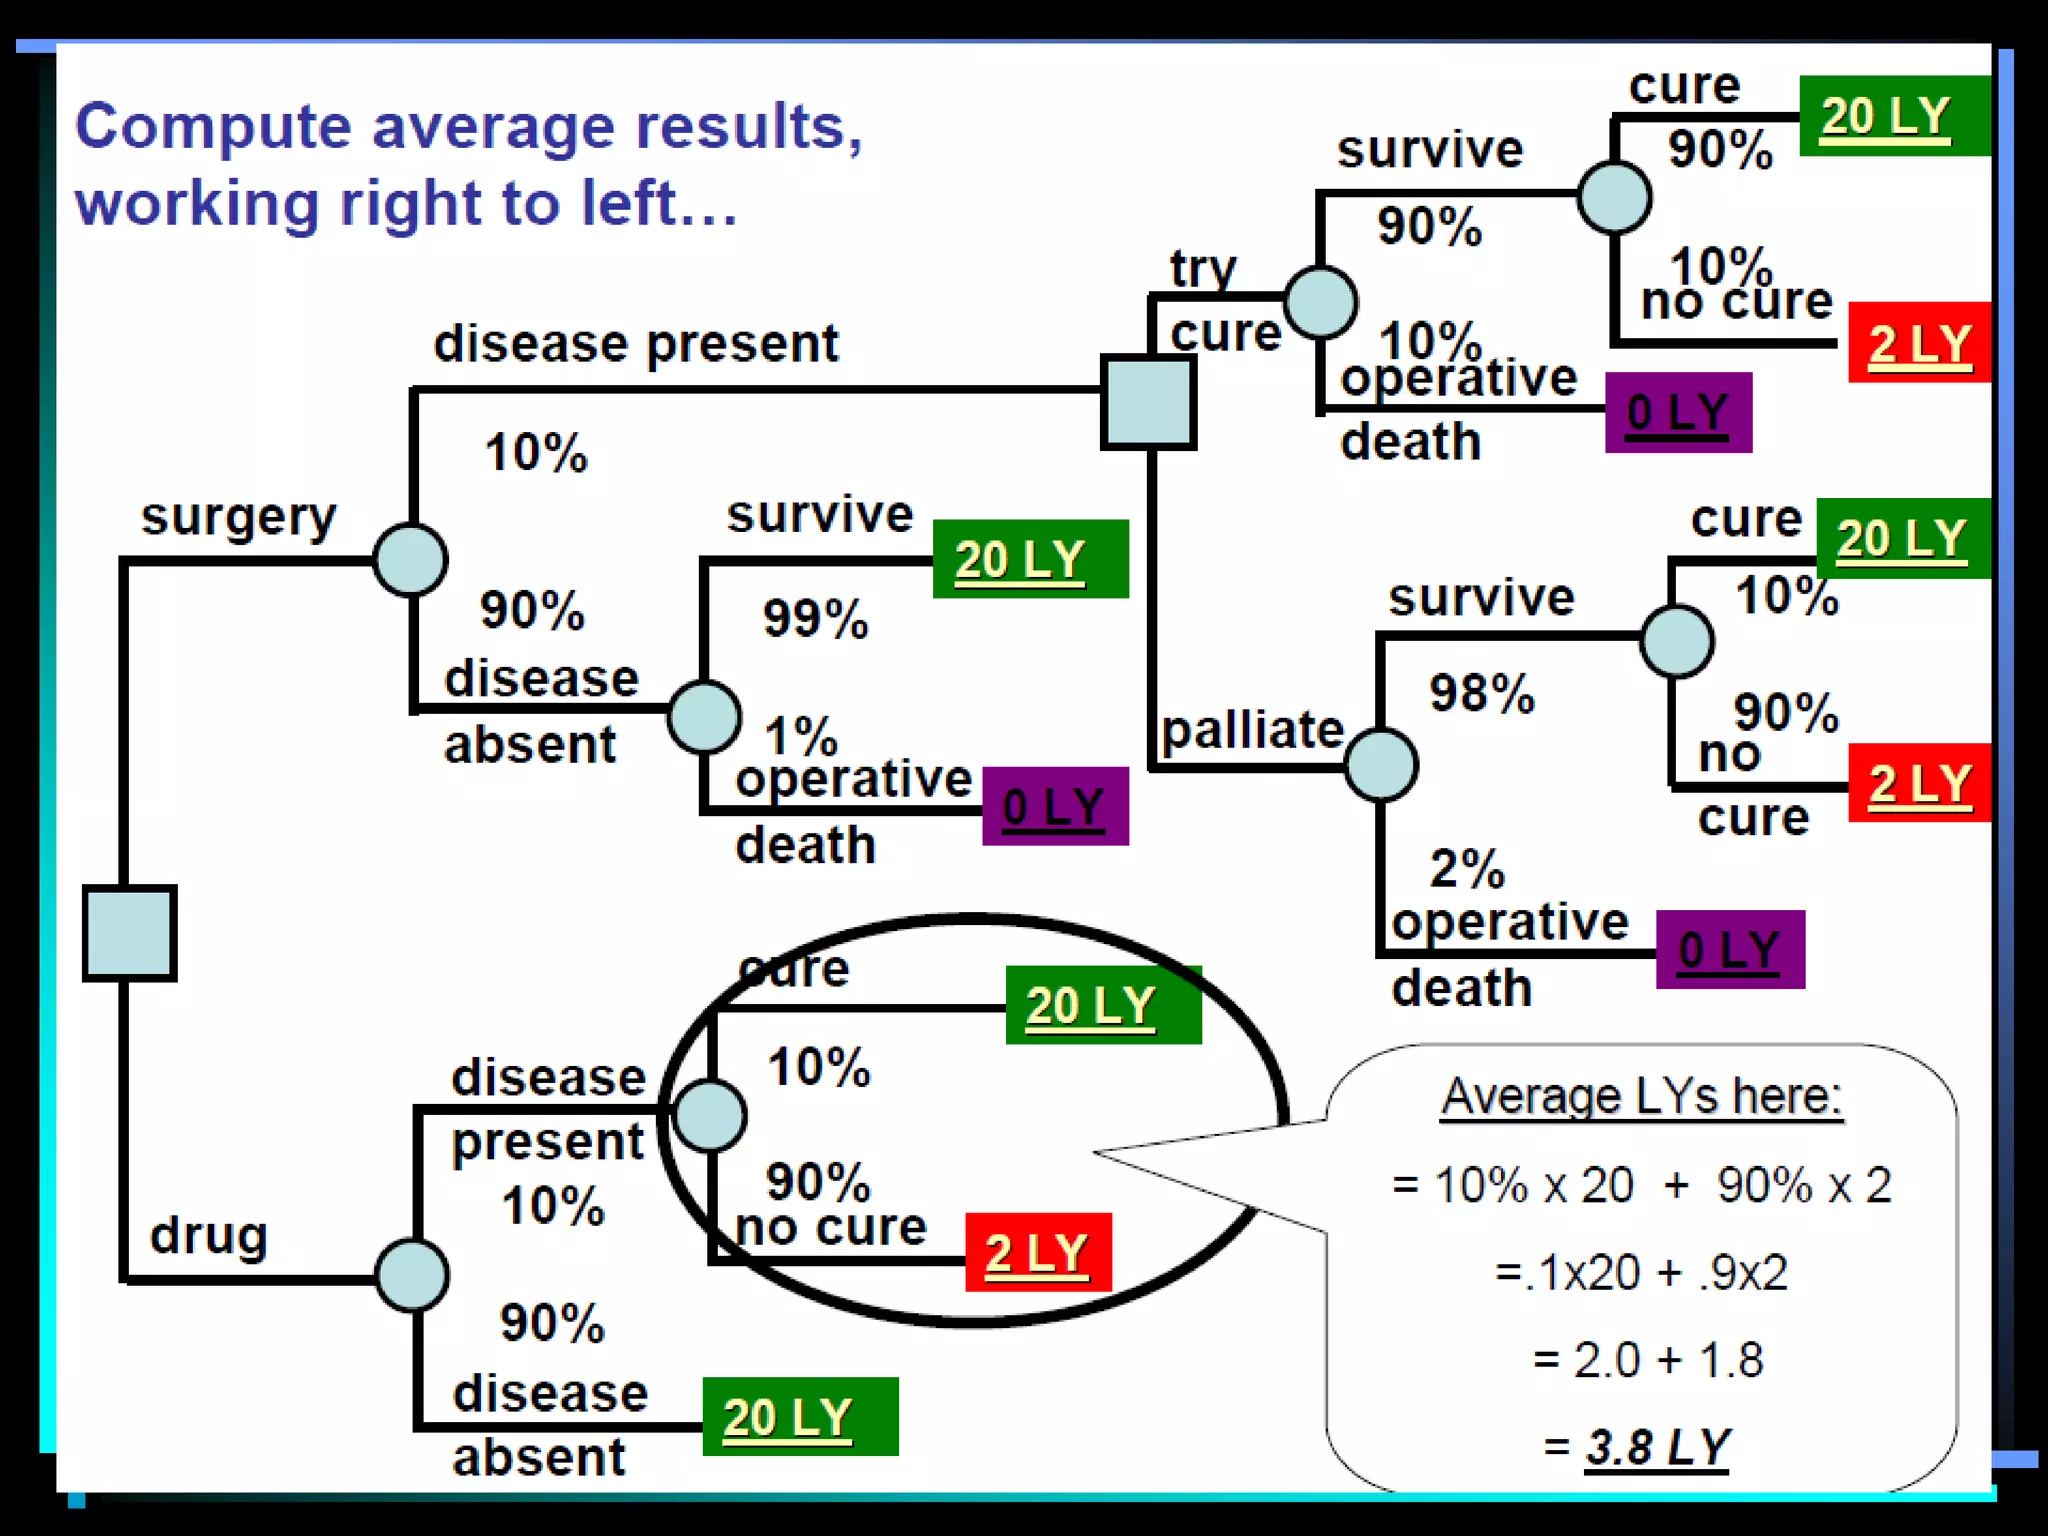
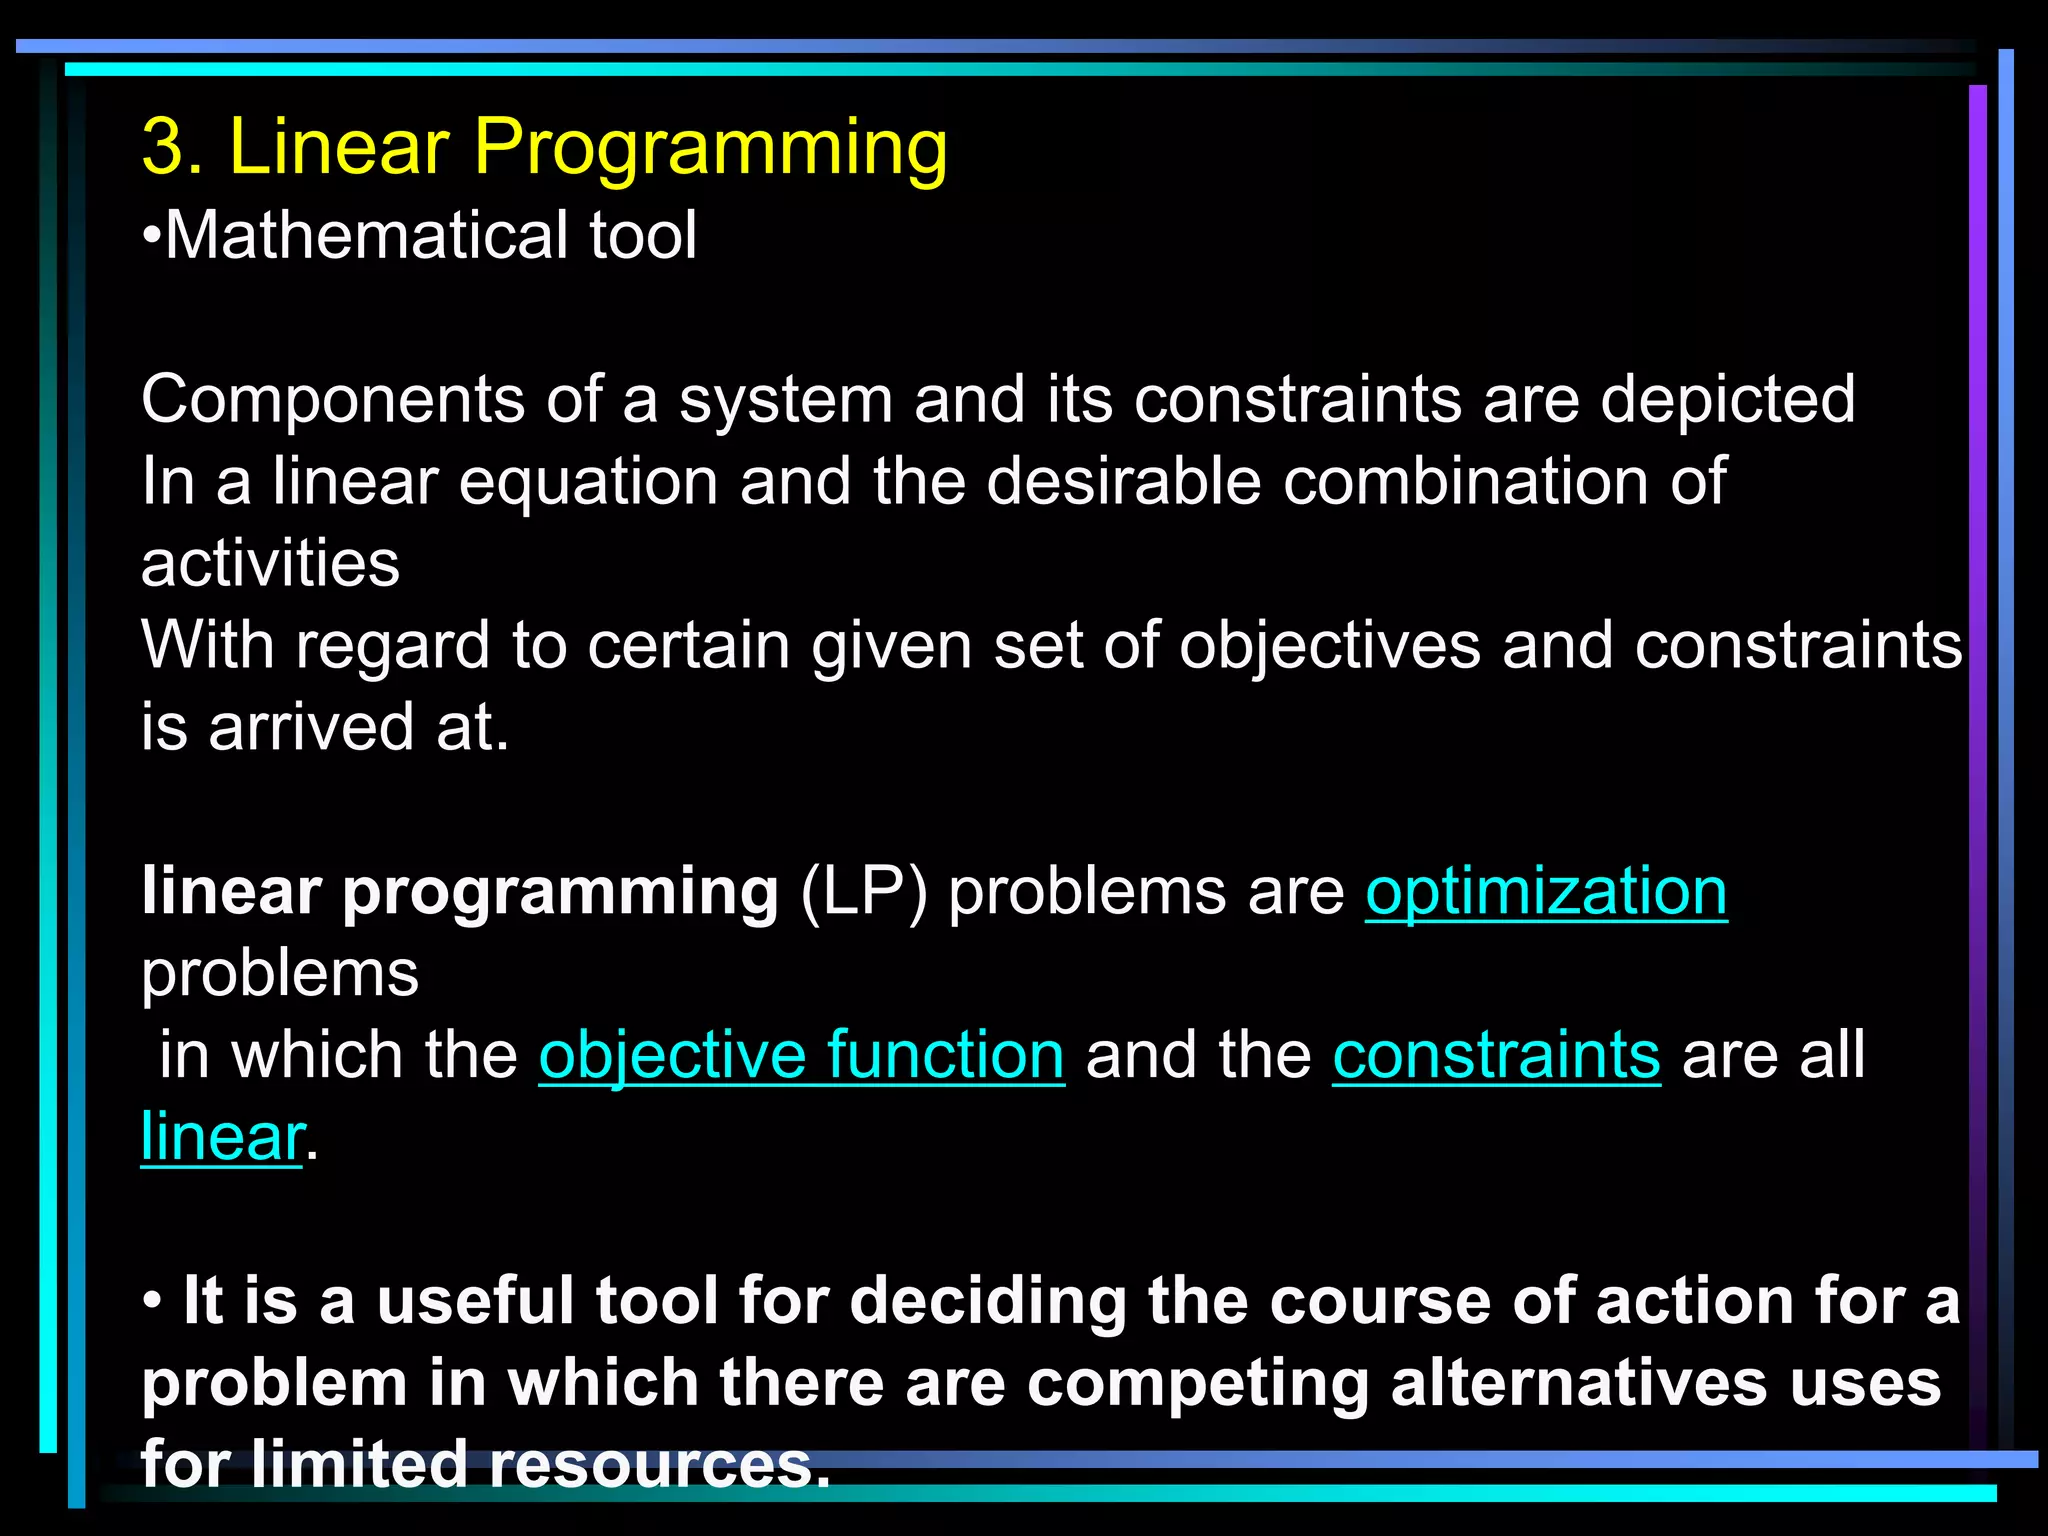
D A items Tight control, low safety stock B items Ordinary control measures, moderate safety stock C items High safety stock, purchase based on usage This document discusses various modern management techniques used in healthcare. It begins with definitions of management and describes traditional versus modern techniques. It then provides details on statistical techniques like decision trees, activity analysis methods like time motion studies and queuing theory. It also discusses mathematical techniques such as simulation, linear programming and inventory control methods like ABC and VED analysis. The document aims to explain how these quantitative methods can improve efficiency and ensure better healthcare.


![Vibe Coding vs. Spec-Driven Development [Free Meetup]](https://cdn.slidesharecdn.com/ss_thumbnails/vibecodingvsspecdrivendevelopment-251209105622-43f455e7-thumbnail.jpg?width=640&height=640&fit=bounds)


