Download as PDF, PPTX


![Mobile Spectrum and Network Evolution to 2025
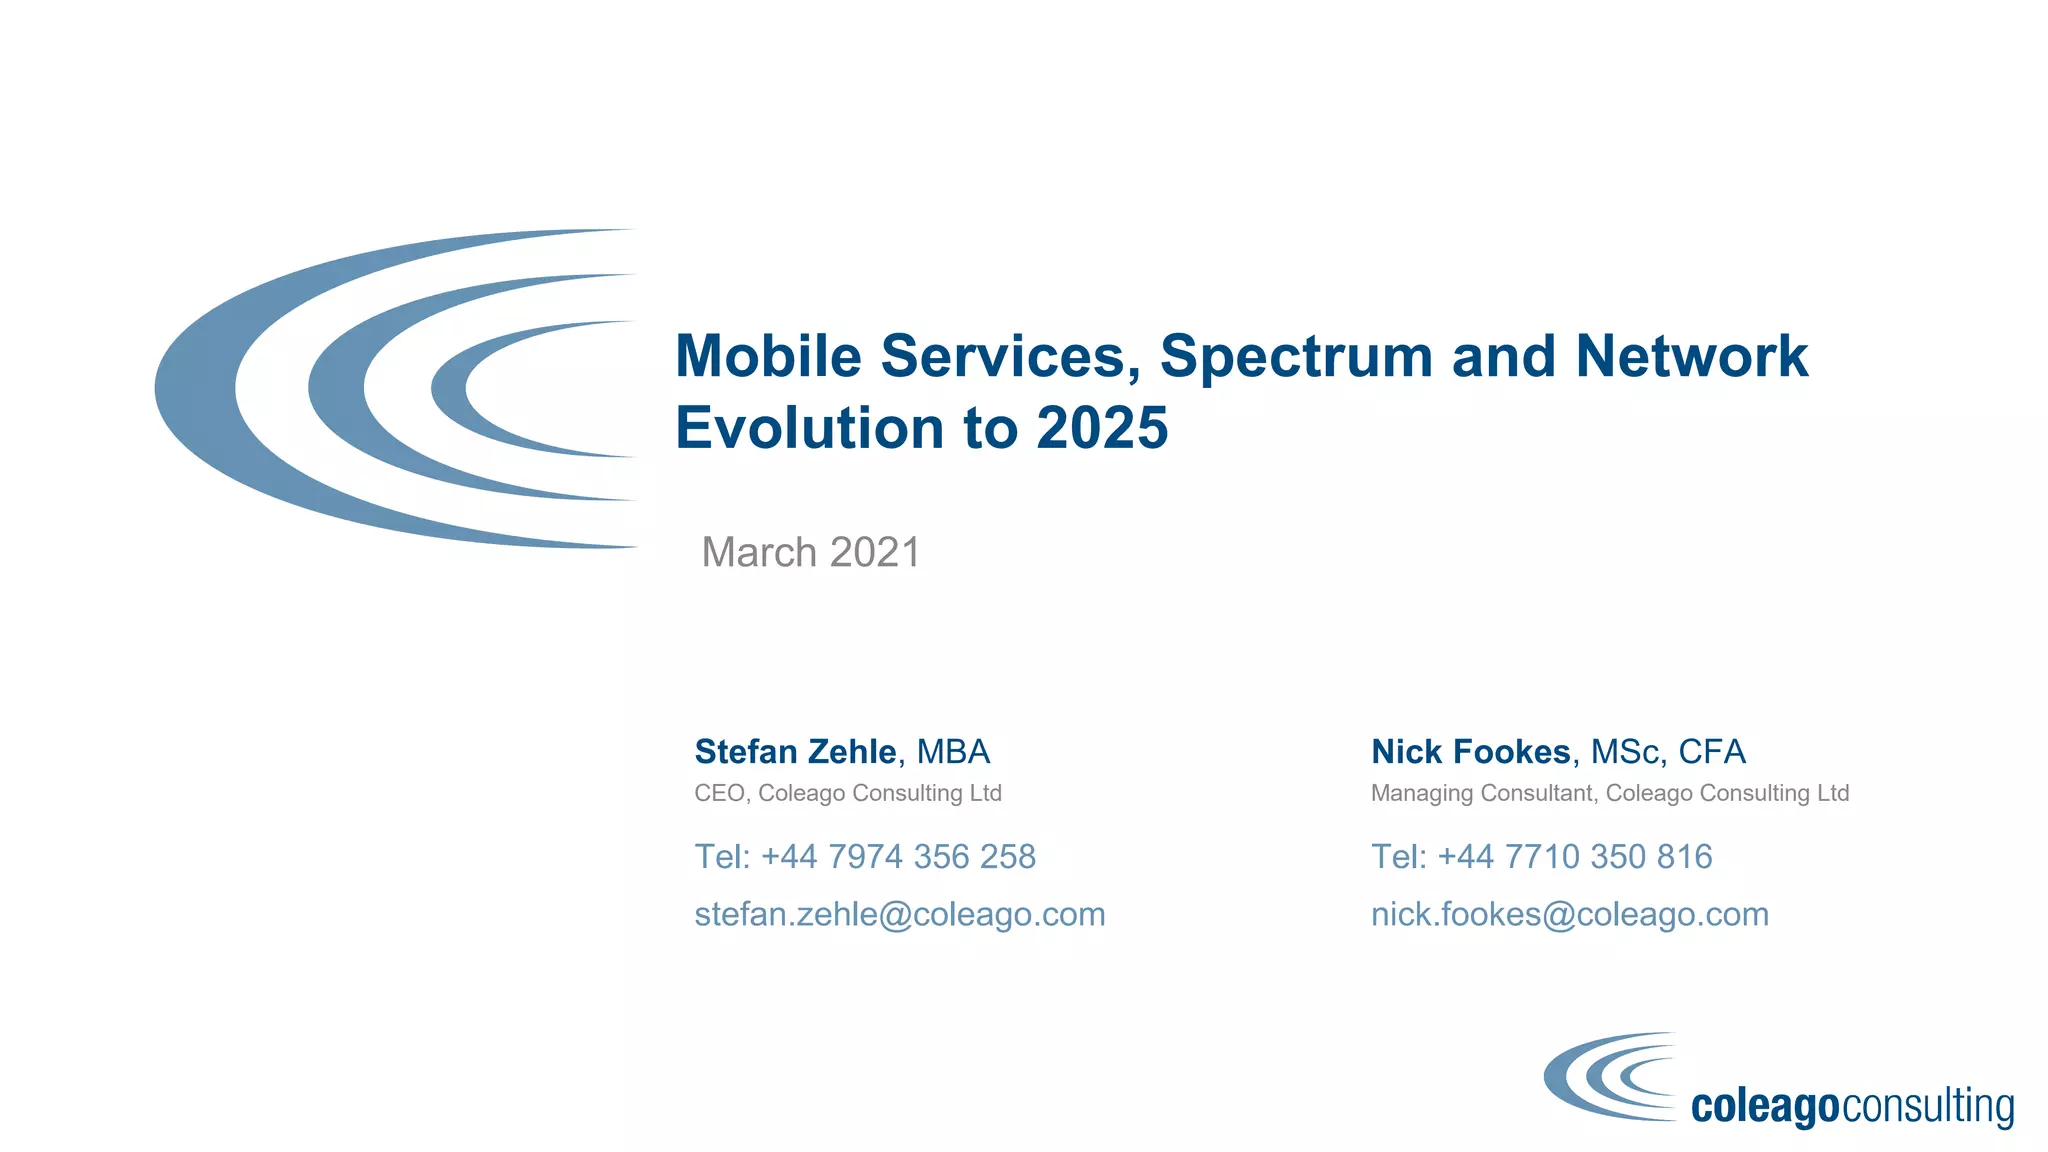
Total low and mid-band spectrum need (MHz) to meet DL requirement
Spectrum needed to meet the 100Mbit/s downlink speed requirement (2)
52
Our analysis suggests
that additional mid-
band spectrum would
enable the 5G-NR
experienced data rate
of 100 Mbit/s anytime,
anywhere, citywide.
Spectrum demand 2020-2025
© copyright Coleago Consulting, 2021, all rights reserved
Activity factor
%Traffic offload 50% 30% 0% 50% 30% 0% 50% 30% 0% 50% 30% 0% 50% 30% 0%
Karachi central 1160 1420 1680 1800 2320 2840 2450 3230 4010 3100 4140 5170 3750 5040 6340
Paris 1000 1160 1350 1450 1820 2190 1910 2480 3040 2380 3130 3880 2850 3790 4720
Madrid 1000 1140 1330 1420 1780 2140 1870 2410 2960 2320 3050 3780 2780 3690 4590
Rabat central 850 990 1130 1200 1470 1750 1540 1950 2370 1890 2440 2990 2230 2920 3610
Rome 1000 1000 1040 1100 1340 1580 1400 1750 2110 1690 2170 2640 1990 2580 3180
Berlin 1000 1000 1000 1030 1240 1450 1290 1600 1920 1550 1970 2380 1810 2330 2850
Amsterdam 1000 1000 1000 1000 1020 1170 1060 1280 1500 1240 1540 1830 1430 1790 2160
Aman central 670 730 790 830 950 1080 1000 1170 1360 1140 1400 1650 1300 1620 1930
Khartoum 610 650 690 700 780 860 1000 1000 1040 1000 1060 1210 1000 1190 1390
Spectrum need
Activity factor 25%
< 1000 MHz 1000 to 1500 MHz 1500 - 2000 MHz 2000-3000 MHz > 3000 MHz
Spectrum need - to meet the DL requirement [MHz]
Activity factor 5% Activity factor 10% Activity factor 15% Activity factor 20%](https://image.slidesharecdn.com/mobilespectrumandnetworkevolutionto2025slides-coleago-24mar21-210704172214/75/Mobile-spectrum-and-network-evolution-to-2025-slides-coleago-24-mar-21-53-2048.jpg)
![Mobile Spectrum and Network Evolution to 2025
Spectrum needed to meet the 50Mbit/s uplink speed requirement
53
The uplink speed
requirement could add
between 0 and 30% to
total spectrum need.
Spectrum demand 2020-2025
© copyright Coleago Consulting, 2021, all rights reserved
Activity factor
%Traffic offload 50% 30% 0% 50% 30% 0% 50% 30% 0% 50% 30% 0% 50% 30% 0%
Karachi central 100 170 310 290 420 700 460 670 1080 630 910 1480 800 1160 1860
Paris 50 110 210 180 280 490 310 460 760 440 640 1050 560 810 1330
Madrid 40 110 200 170 270 470 300 450 740 430 620 1010 540 780 1280
Rabat central 20 50 130 110 190 330 210 330 540 300 450 750 400 580 950
Rome 0 20 110 90 150 280 170 270 460 260 380 640 330 500 810
Berlin 0 0 80 70 130 240 140 230 390 210 320 550 280 430 710
Amsterdam 0 0 0 0 70 150 80 140 260 130 200 360 170 280 470
Aman central 0 0 20 0 40 110 50 110 220 100 170 310 140 230 410
Khartoum 0 0 0 0 0 40 0 20 100 0 70 170 60 120 220
Extra need < 1000 MHz 1000 to 1500 MHz 1500 - 2000 MHz 2000-3000 MHz > 3000 MHz
UL additional spectrum need - addressed with UL-only spectrum MHz]
Activity factor 5% Activity factor 10% Activity factor 15% Activity factor 20% Activity factor 25%
Total extra low and mid-band spectrum need (MHz) to meet UL requirement
In areas with lower traffic densities, the uplink portion of the spectrum is sufficient to cover the UL requirement
In areas of very high traffic density, the average uplink portion of spectrum is insufficient to meet the UL requirement, because TDD
(with a 3:1 DL-to-UL ratio) becomes a large part of the proportion of the overall mix
– In this case, extra spectrum is needed to satisfy the UL requirement in addition to the DL requirement](https://image.slidesharecdn.com/mobilespectrumandnetworkevolutionto2025slides-coleago-24mar21-210704172214/75/Mobile-spectrum-and-network-evolution-to-2025-slides-coleago-24-mar-21-54-2048.jpg)
![Mobile Spectrum and Network Evolution to 2025
Total low and mid-band spectrum need (MHz) to meet the DL as well as the UL requirement
Where the estimated low and mid-band spectrum demand exceed the available supply of IMT frequencies up to 6GHz, the shortfall would
entail either:
A failure to meet the IMT-2020 Requirements in exceptionally concentrated population areas; or
Costly measures to overcome the shortfall, including higher than assumed network densification and/or deployment of technology
enhancements that deliver significantly higher spectral efficiency gains than projected; and/or
An even greater reliance on traffic offloading to high frequencies and/or indoor cells
Spectrum needed to meet the both the 100Mbit/s DL and 50Mbit/s UL speed requirement
54
Bandwidth shortfalls
caused by a failure to
release sufficient IMT-
designated spectrum
could result in
substantial socio-
economic harm.
Spectrum demand 2020-2025
© copyright Coleago Consulting, 2021, all rights reserved
Activity factor
%Traffic offload 50% 30% 0% 50% 30% 0% 50% 30% 0% 50% 30% 0% 50% 30% 0%
Karachi central 1260 1590 1990 2090 2740 3540 2910 3900 5090 3730 5050 6650 4550 6200 8200
Paris 1050 1270 1560 1630 2100 2680 2220 2940 3800 2820 3770 4930 3410 4600 6050
Madrid 1040 1250 1530 1590 2050 2610 2170 2860 3700 2750 3670 4790 3320 4470 5870
Rabat central 870 1040 1260 1310 1660 2080 1750 2280 2910 2190 2890 3740 2630 3500 4560
Rome 1000 1020 1150 1190 1490 1860 1570 2020 2570 1950 2550 3280 2320 3080 3990
Berlin 1000 1000 1080 1100 1370 1690 1430 1830 2310 1760 2290 2930 2090 2760 3560
Amsterdam 1000 1000 1000 1000 1090 1320 1140 1420 1760 1370 1740 2190 1600 2070 2630
Aman central 670 730 810 830 990 1190 1050 1280 1580 1240 1570 1960 1440 1850 2340
Khartoum 610 650 690 700 780 900 1000 1020 1140 1000 1130 1380 1060 1310 1610
Spectrum need < 1000 MHz 1000 to 1500 MHz 1500 - 2000 MHz 2000-3000 MHz > 3000 MHz
Total spectrum need - to meet both DL and UL requirements [MHz]
Activity factor 5% Activity factor 10% Activity factor 15% Activity factor 20% Activity factor 25%
= plausible lower-bound of spectrum need in 2025](https://image.slidesharecdn.com/mobilespectrumandnetworkevolutionto2025slides-coleago-24mar21-210704172214/75/Mobile-spectrum-and-network-evolution-to-2025-slides-coleago-24-mar-21-55-2048.jpg)


![Mobile Spectrum and Network Evolution to 2025
Trade-off between licence fees and socio-economic outcomes (2)
63
In Finland, the
annualised cost of
spectrum amounts to
a mere 1.4% of mobile
industry revenue.
As a result, mobile
operators in Finland
have built a very high-
density mobile
network which delivers
excellent availability
and high download
speeds.
Spectrum management and pricing
© copyright Coleago Consulting, 2021, all rights reserved
There is extensive direct historical evidence that high spectrum fees harm welfare
Netherlands and Austria multiband awards (2012, 2013)
Finland
“Was nothing learned from previous auctions for UMTS [3G] frequencies, when the
share price of KPN dropped substantially and the ecosystem of small supply
companies in the telecom sector was severely damaged? … Telecom companies
paid high prices. KPN saw a further decline in its credit rating. Prices for
attracting money for infrastructure investments are expected to rise. The
rollout of high-speed internet will slow down and the suppliers will be put out of
business. This ‘Christmas gift’ could be a huge burden for the sector, and for all
other businesses, entrepreneurs and citizens who need super-fast mobile internet”
CCA format used in both countries
Total spectrum cost between 25%
and 33% of total Enterprise Value
Netherlands: allocation entirely
consistent with relative market
positions, yet high price paid
– Spiteful bidding1 can result in
collective overpayment
European Commission reaction2:
1 Spiteful bidding in a CCA: overstate bids for larger packages to drive prices paid by rivals ‒ to avoid embarrassing price differentials.
2 Neelie Kroes, Vice President European Commission and Digital Agenda Commissioner, in January 2013.
Outcome: 3 of the top 4 best performing MBB networks are in Finland (2018)
Finland has consistently pursued a
policy of low spectrum fees in to
allow operators to invest more in
their networks
Annualised cost of spectrum
amounts to a mere 1.4% of mobile
industry revenue](https://image.slidesharecdn.com/mobilespectrumandnetworkevolutionto2025slides-coleago-24mar21-210704172214/75/Mobile-spectrum-and-network-evolution-to-2025-slides-coleago-24-mar-21-64-2048.jpg)
![Mobile Spectrum and Network Evolution to 2025
Research in the US based on data from 1991-2008 shows that
welfare gains from mobile dwarf social gains from auction fees
Results obtained by Hazlett, Munoz et al (2012)
On this basis, the ratio of social gains was 240-to-1 in favour of
mobile services over licence revenues
This puts spectrum pricing policy into sharp focus; according to the
authors:
Trade-off between licence fees and socio-economic outcomes (3)
64
As of 2009, the ratio of
social gains was
around 240-to-1 in
favour of mobile
services over licence
revenues in the US.
‒‒
Based on 2017 cross-
country research,
increases in welfare
exceed foregone
mobile licence fee
receipts by an
average of 2.5-to-1.
Spectrum management and pricing
© copyright Coleago Consulting, 2021, all rights reserved
Quantitative research by NERA shows that welfare gains exceed
reductions in licence fees by 2.5x on average
Ratio of increases in welfare to reductions in licence fees
Based on a sample of 15 countries
NERA analysis shows that reductions in licence fees would be
more than offset by increases in CS; according to the authors:
2009 CS1: $4000 bn present value
80x total auction revenue up to 2008
With 33% deadweight losses, the net social
gains from the $50bn in auction revenues is
just $17bn (0.4% of the CS)
“…to maximise consumer welfare, [telecoms policy]
should avoid being distracted by side issues like
government licence revenues.”
“A policy that has an enormous impact in increasing
license revenues need impose only tiny proportional
costs in output markets to undermine its social utility. So,
for example, a new auction design that (heroically)
doubled auction revenues would, if it reduced
consumer surplus by just one-half of one percent,
produce costs in excess of benefits”.
1 CS: Consumer Surplus (welfare).
“…where governments adopt policies that extract
excessive financial value from the mobile sector in the
form of high fees for spectrum, a significant share of this
burden is passed onto customers through higher prices
for mobile and lower quality data services.”](https://image.slidesharecdn.com/mobilespectrumandnetworkevolutionto2025slides-coleago-24mar21-210704172214/75/Mobile-spectrum-and-network-evolution-to-2025-slides-coleago-24-mar-21-65-2048.jpg)


The document explores the evolution of mobile services, spectrum, and networks anticipated by 2025, highlighting key trends such as a significant increase in mobile data traffic, driven primarily by video and cloud gaming. It discusses the implications of 5G technology, projection of billions of IoT devices, and how these developments could affect societal connectivity and economic opportunities. Additionally, the document outlines the challenges and opportunities for mobile operators as they navigate the shifting landscape of data consumption and service provision.


