Download to read offline


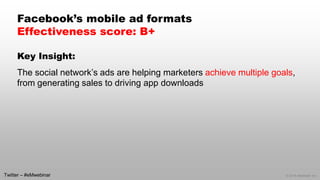
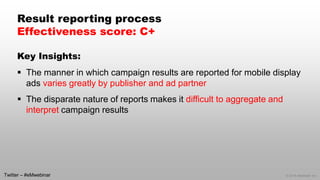
![© 2014 eMarketer Inc.
Brand building was the objective of MINI USA’s
mobile sponsorship campaign with UrbanDaddy
“ The [sponsorship] experience was
about brand building, and it
proved very successful for us.
We looked at interactions within the
app, how many people signed up to
be a participant in the ‘MINI Night Out’
program and how many provided
[contact details] to get more
information.”
—Lee Nadler, marketing communications
manager for MINI USA](https://image.slidesharecdn.com/emarketerwebinarmobileadeffectiveness-140821131719-phpapp01-150817033840-lva1-app6891/85/Mobile-Ad-Effectiveness-22-320.jpg)
![© 2014 eMarketer Inc.
Need to measure more than ad engagement
“ The analytics are there for
engagement and understanding
impressions. But it’s hard to track
[the ad] to a transaction, and that’s
where it falls down.”
—Laura Jakobsen, senior vice president,
marketing and design at Pinkberry](https://image.slidesharecdn.com/emarketerwebinarmobileadeffectiveness-140821131719-phpapp01-150817033840-lva1-app6891/85/Mobile-Ad-Effectiveness-29-320.jpg)


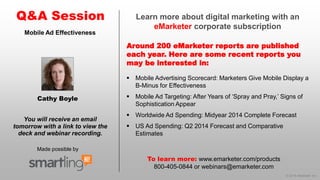

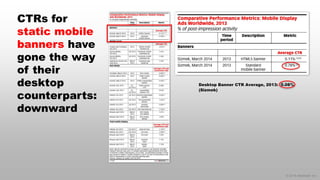
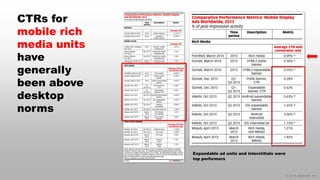
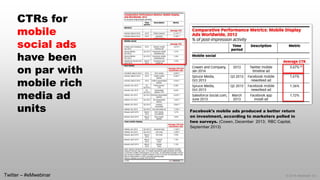
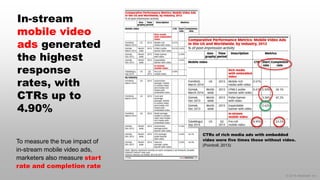
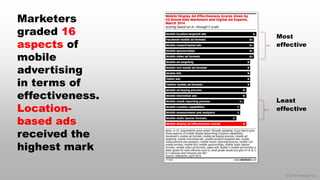
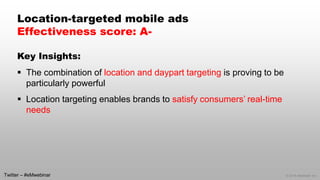
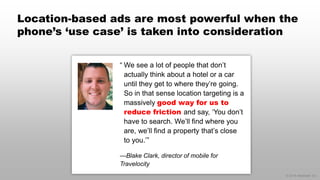
Cathy Boyle presented on mobile ad effectiveness. She discussed trends showing clickthrough rates and cost-per-impressions for various mobile ad formats like banners, rich media, video and social ads. Location-based ads received the highest grades for effectiveness while measurement and analytics received lower grades. Improving mobile ad effectiveness further will require better creative, data integration, standards, and measurement tools.


