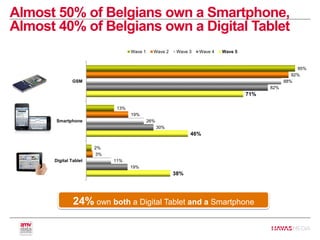
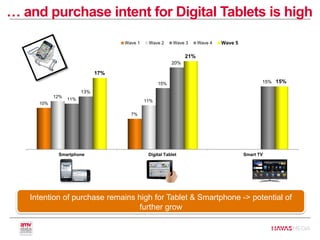
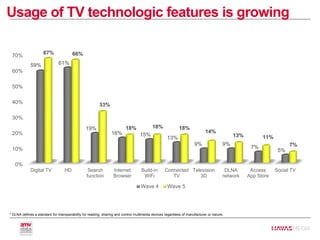
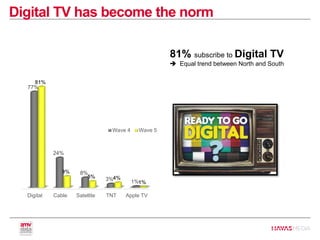
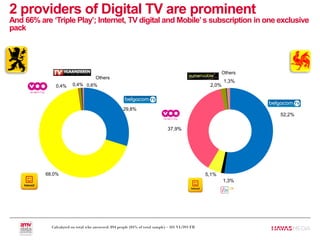
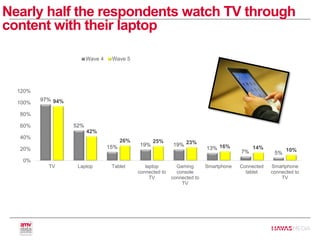
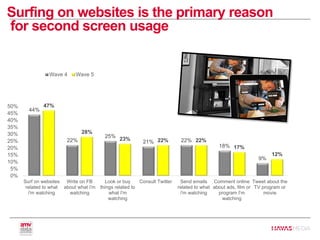
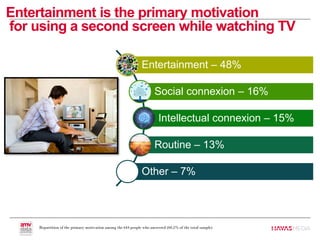
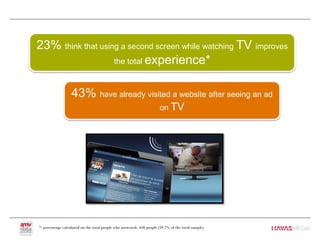
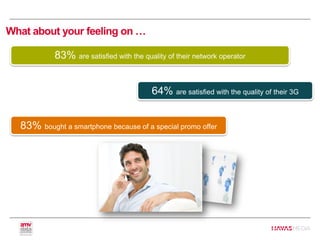
MMS 2014 – 5TH WAVE
MULTI-SCREEN & MOBILE SURVEY
APRIL2014
EXECUTIVE SUMMARY
• Mobile phones (as we knew them) are on the road to extinction.
• Smartphones and tablets continue their upward trend.
• Digital TV operators market is different in the North and the South, both in terms of
presence and share of providers ( , , ).
• There is a large coherence between what’s being watched on TV and what is consumed
on the second screen.
• Second screen is an opportunity to generate an extended watching/surfing experience;
second screen is an opportunity for marketeers.
• 83% are happy (or very happy) with the quality of their network operator.
Executive summary
METHODOLOGY
Methodology summary
Contractor :
•18+ living in BelgiumReference Universe :
•Method: at random, based on Internet panelSample :
•Online questionnaire
•Average duration of the interview : 10'
Data Collection :
Wave 5
Feb’14
1 064 ind.
Wave 4
Dec’12
1 006 ind.
Wave 3
Nov’11
969 ind.
Wave 2
Jan’11
1 067 ind.
Wave 1
Nov’10
1 072 ind.
MAIN RESULTS
Digital Tablet
Smartphone
GSM
38%
46%
71%
19%
30%
82%
11%
26%
88%
3%
19%
92%
2%
13%
95%
Wave 1 Wave 2 Wave 3 Wave 4 Wave 5
24% own both a Digital Tablet and a Smartphone
Almost 50% of Belgians own a Smartphone,
Almost 40% of Belgians own a Digital Tablet
Smartphone Digital Tablet Smart TV
10%
7%
12%
11%11%
15%
13%
20%
15%
17%
21%
15%
Wave 1 Wave 2 Wave 3 Wave 4 Wave 5
… and purchase intent for Digital Tablets is high
Intention of purchase remains high for Tablet & Smartphone -> potential of
further grow
Usage of TV technologic features is growing
0%
10%
20%
30%
40%
50%
60%
70%
Digital TV HD Search
function
Internet
Browser
Build-in
WiFi
Connected
TV
Television
3D
DLNA
network
Access
App Store
Social TV
59% 61%
19%
16% 15%
13%
9% 9%
7%
5%
67% 66%
33%
18% 18% 18%
14%
13% 11%
7%
Wave 4 Wave 5
* DLNA defines a standard for interoperability for reading, sharing and control multimedia devices regardless of manufacturer or nature.
Digital TV has become the norm
Digital Cable Satellite TNT Apple TV
77%
24%
8%
3% 1%
81%
9%
5% 4%
1%
Wave 4 Wave 5
81% subscribe to Digital TV
 Equal trend between North and South
2 providers of Digital TV are prominent
And 66% are ‘Triple Play’; Internet, TV digital and Mobile’s subscription in one exclusive
pack
52,2%
1,3%
5,1%
37,9%
2,0%
1,3%
29,8%
68,0%
0,4% 0,4% 0,6%
Others
Others
Calculated on total who answered: 894 people (84% of total sample) – 501 VL/393 FR
Nearly half the respondents watch TV through
content with their laptop
97%
52%
15% 19% 19%
13%
7% 5%
94%
42%
26% 25% 23%
16% 14% 10%
0%
20%
40%
60%
80%
100%
120%
TV Laptop Tablet laptop
connected to
TV
Gaming
console
connected to
TV
Smartphone Connected
tablet
Smartphone
connected to
TV
Wave 4 Wave 5
Surfing on websites is the primary reason
for second screen usage
44%
22%
25%
21% 22%
18%
9%
47%
28%
23% 22% 22%
17%
12%
0%
5%
10%
15%
20%
25%
30%
35%
40%
45%
50%
Surf on websites
related to what
i'm watching
Write on FB
about what i'm
watching
Look or buy
things related to
what I'm
watching
Consult Twitter Send emails
related to what
i'm watching
Comment online
about ads, film or
program I'm
watching
Tweet about the
TV program or
movie
Wave 4 Wave 5
Entertainment is the primary motivation
for using a second screen while watching TV
Entertainment – 48%
Social connexion – 16%
Intellectual connexion – 15%
Routine – 13%
Other – 7%
Repartition of the primary motivation among the 644 people who answered (60,5% of the total sample)
23% think that using a second screen while watching TV improves
the total experience*
43% have already visited a website after seeing an ad
on TV
*: percentage calculated on the total people who answered; 636 people (59,7% of the total sample)
83% are satisfied with the quality of their network operator
64% are satisfied with the quality of their 3G
83% bought a smartphone because of a special promo offer
What about your feeling on …
THANK YOU

MMS 5th wave done by Havas Media

  • 1.
    MMS 2014 –5TH WAVE MULTI-SCREEN & MOBILE SURVEY APRIL2014
  • 2.
  • 3.
    • Mobile phones(as we knew them) are on the road to extinction. • Smartphones and tablets continue their upward trend. • Digital TV operators market is different in the North and the South, both in terms of presence and share of providers ( , , ). • There is a large coherence between what’s being watched on TV and what is consumed on the second screen. • Second screen is an opportunity to generate an extended watching/surfing experience; second screen is an opportunity for marketeers. • 83% are happy (or very happy) with the quality of their network operator. Executive summary
  • 4.
  • 5.
    Methodology summary Contractor : •18+living in BelgiumReference Universe : •Method: at random, based on Internet panelSample : •Online questionnaire •Average duration of the interview : 10' Data Collection : Wave 5 Feb’14 1 064 ind. Wave 4 Dec’12 1 006 ind. Wave 3 Nov’11 969 ind. Wave 2 Jan’11 1 067 ind. Wave 1 Nov’10 1 072 ind.
  • 6.
  • 7.
    Digital Tablet Smartphone GSM 38% 46% 71% 19% 30% 82% 11% 26% 88% 3% 19% 92% 2% 13% 95% Wave 1Wave 2 Wave 3 Wave 4 Wave 5 24% own both a Digital Tablet and a Smartphone Almost 50% of Belgians own a Smartphone, Almost 40% of Belgians own a Digital Tablet
  • 8.
    Smartphone Digital TabletSmart TV 10% 7% 12% 11%11% 15% 13% 20% 15% 17% 21% 15% Wave 1 Wave 2 Wave 3 Wave 4 Wave 5 … and purchase intent for Digital Tablets is high Intention of purchase remains high for Tablet & Smartphone -> potential of further grow
  • 9.
    Usage of TVtechnologic features is growing 0% 10% 20% 30% 40% 50% 60% 70% Digital TV HD Search function Internet Browser Build-in WiFi Connected TV Television 3D DLNA network Access App Store Social TV 59% 61% 19% 16% 15% 13% 9% 9% 7% 5% 67% 66% 33% 18% 18% 18% 14% 13% 11% 7% Wave 4 Wave 5 * DLNA defines a standard for interoperability for reading, sharing and control multimedia devices regardless of manufacturer or nature.
  • 10.
    Digital TV hasbecome the norm Digital Cable Satellite TNT Apple TV 77% 24% 8% 3% 1% 81% 9% 5% 4% 1% Wave 4 Wave 5 81% subscribe to Digital TV  Equal trend between North and South
  • 11.
    2 providers ofDigital TV are prominent And 66% are ‘Triple Play’; Internet, TV digital and Mobile’s subscription in one exclusive pack 52,2% 1,3% 5,1% 37,9% 2,0% 1,3% 29,8% 68,0% 0,4% 0,4% 0,6% Others Others Calculated on total who answered: 894 people (84% of total sample) – 501 VL/393 FR
  • 12.
    Nearly half therespondents watch TV through content with their laptop 97% 52% 15% 19% 19% 13% 7% 5% 94% 42% 26% 25% 23% 16% 14% 10% 0% 20% 40% 60% 80% 100% 120% TV Laptop Tablet laptop connected to TV Gaming console connected to TV Smartphone Connected tablet Smartphone connected to TV Wave 4 Wave 5
  • 13.
    Surfing on websitesis the primary reason for second screen usage 44% 22% 25% 21% 22% 18% 9% 47% 28% 23% 22% 22% 17% 12% 0% 5% 10% 15% 20% 25% 30% 35% 40% 45% 50% Surf on websites related to what i'm watching Write on FB about what i'm watching Look or buy things related to what I'm watching Consult Twitter Send emails related to what i'm watching Comment online about ads, film or program I'm watching Tweet about the TV program or movie Wave 4 Wave 5
  • 14.
    Entertainment is theprimary motivation for using a second screen while watching TV Entertainment – 48% Social connexion – 16% Intellectual connexion – 15% Routine – 13% Other – 7% Repartition of the primary motivation among the 644 people who answered (60,5% of the total sample)
  • 15.
    23% think thatusing a second screen while watching TV improves the total experience* 43% have already visited a website after seeing an ad on TV *: percentage calculated on the total people who answered; 636 people (59,7% of the total sample)
  • 16.
    83% are satisfiedwith the quality of their network operator 64% are satisfied with the quality of their 3G 83% bought a smartphone because of a special promo offer What about your feeling on …
  • 17.