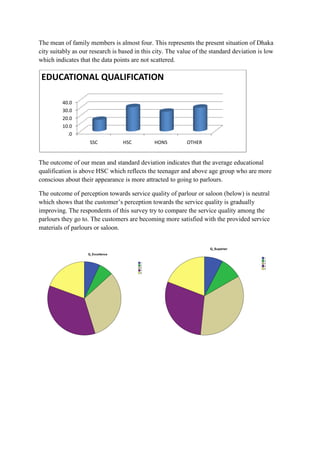
MKT 201

Research on Customer
Citizenship Behaviour
Husian Salilul Akareem
Lecturer of BRAC University

Submitted by
Group I:
Anika Tahsin-11104061(#23)
Maria Islam-11104085 (#27)
Fatima Momin-11104132 (#35)
Mehbuba Yasmin Tamanna-11104108 (#32)
Tabassum Anwar Subha-11104116 (#33)
Samiya Yesmin 11304043 (#37)

Date of submission: August 7, 2012

Signature
Summary
This paper presents the importance of Customer Citizenship Behaviour (CCB) which
is reflected in both the customers and the marketers, both of which creates value for each
other in a lot of ways. Also, we have included the findings of other people about CCB such as
customer citizenship behaviour r directed at service personnel, the role of service worker in
encouraging CCB,
impact of customer
perception
of employee identification, the antecedents and consequences of service customer citizenship,
loyalty ripple effect, factors of CCB. For conducting this research, we have used descriptive
method with the help of a particular sample size. A questionnaire has been designed with a
good number of variables to get satisfactory response from the respondents‟. We collected the
data and analyzed to show changes in CCB with regards to our variables to find how
consumer preferences change as conditions applicable to them changes. Finally, we have also
mentioned about the managerial obligations which highlights how managers may influence
CCB in an organization for its profitability and success.

Customer Citizenship Behaviour and
Importance
Customer citizenship behavior is defined as voluntary and discretionary behaviour of
individual customers which an important factor for contributing to the overall success of the
service organization. Service organizations must understand how they can get the maximum
potential of their customers contributing to the service delivery. As a result, loyal customer
may perform extra-role behavior such as word of mouth, product improvement suggestions
and proactive communication of anticipated problems. Groth (2005) introduced customer
citizenship behavior (CCB) among customers based on face to face interaction towards the
internet business. CCB is defined as “voluntary and discretionary behaviors that are not
required for the successful production and/or delivery of the service but that, in the aggregate,
help the service organization overall” (Groth, 2005, p. 11).
In recent years, there has been an increasing focus on customer citizenship behaviour
in the managerial and marketing literature. Like organizational employees, customer may
engage in a variety of citizenship behaviour directed toward a specific organization. (Yi &
Gong) argues that “a central difference between service and manufacturing firms is that
customers are often physically present when the service is provided, quite unlike
manufacturing firms where customers are only rarely present during production.” Therefore,
both customers and employees constitute the human resource of the service organization.
Customers often perform the work that employees might otherwise perform, so that
customers may even replace employees in service based organizations (Yi & Gong)
Many terms have been used to describe customer citizenship behaviour, including customer
discretionary behaviour (Yi & Gong) customer voluntary performance.
The service literatures suggest various forms of customer citizenship behaviour. Growth
identified three dimensions of customer citizenship behaviour
1. Feedback: Providing feedback to the organization, which means providing solicited
information to organizations that helps them improve their service delivery process.
2. Helping other customers, this closely parallels to altruism dimension found in
organizational citizenship behaviour.
3. Word-of-mouth: refers to the recommendations that customers give to their friends
and relatives after they are satisfied with the services provided by the firms.
(Yi & Gong) also suggested that customers who exhibit citizenship behaviour may
demonstrate commitment to the service organization and report potential safety
problems to employee. Customer tolerance of service failures is another dimension of
customer citizenship behaviour. It is defined as customer willingness to put up with or
to be patient about service on counters that are not performed as expect. This
acquiescent attitude results in continued patronage of the store and not spreading
negative that common features of CCB include voluntary feedback discretionary
behaviour and helping organization.

IMPORTANCE OF CCB:
Toward marketers: Customer citizenship behaviours (CCB) are highly valued by firms,
particularly in the present environment where there is a push to encourage greater customer
participation in service delivery to decrease organizational labour costs and increase
productivity. Also, CCB helps us to get ideas about the changing wants, needs and demands
of the market as time changes. This helps companies decide on product changes as well as
qualities of the products to keep up with the market and competition demands. Building
customer loyalty can lead to an increase in the company‟s profitable sales and will also
enhance their long-term growth.
Toward customers: Customer Citizenship Behaviour includes feedback from the customers
after they use a service or purchase a product. This helps the customer to get desired and
improved services. Through word-of-mouth, existing customers can influence other
customers to use a product or service. This in turn helps new customers to gain knowledge
about a product and also influence them to purchase. This therefore increases the value of the
companies.
Literature Review
Bove & Garma 2009)
customer citizenship behaviour CCB
directed at service personnel (CCB-SP) based on the theory of social exchange
helpful voluntarily
performed by customers
benefit service personnel
CCB-SP
five
--- advocacy, sportsmanship, consultancy and
dimensions
assuming employee role,
social support
identified 31 of the 69 items
clearly belonged to one of the five dimensions.

Bove, Pervan, Beatty, & Shiu 2008) introduced the role of the individual service
worker in encouraging customer organizational citizenship behaviours.They separeted the
differences between the customer in-role and extra role behaviours. Customer in-role
behaviours include performing the service delivery such as arriving on time for an
appointment, providing a description of needs, even paying for the service. In contrast, extrarole behaviours are voluntary, helpful behaviours enacted towards the firm, service worker,
or other customers which provide assistance to effective organizational functioning. These
behaviours can positively affect the performance of service workers and the organization.
They also said that customer‟s commitment to service worker, customers‟ perception about
service worker‟s creditability and benevolence and finally customers‟ personal loyalty to
service worker are the strongest predictor of customer OCBs.
Devrani & Tuzun

impact of customerperception of employee identification
behaviour
identification
allows
to become psychologically attached to and care about the organization
perception of employee identification is significantly and
positively correlated with CCB
moderates the relationship between
identification and u
(Yi & Gong, 2006) have researched about the background and consequences of
service customer citizenship and badness behaviour. Customer badness behaviour refers to
dysfunctional customers who damage the company in some way. Negative effect, perceived
justice, and commitment are considered as the antecedents and perceived service quality as
the consequence. Perceive justice and commitment exert a positive influence on customer
citizenship behaviour. On the other hand, negative affect will increase customer badness
behaviour.
According to Wingwon, B, & Piriyakul, M. (2010) the factors that affect customer
citizenship behaviour are customer satisfaction and the corporate affection. The customer
satisfaction was the emotional reaction of consumers toward the product usage and the
corporate affection was the positive attitude of them toward the corporate. They said that the
customer satisfaction has direct effect but the corporate affection has indirect effect because
of the mediator.
Customer behaviour exhibits “loyalty ripple effect” which can add value to a firm‟s
service quality. This effect at first initiates service loyalty which may be defined as "the
degree to which a customer exhibits repeat purchasing behaviour towards service provider,
possesses a positive attitudinal disposition toward the provider, and considers using only this
provider when a need for this service arises" (Brown & Gremler)This effect includes the
following phase:
Word-of-mouth communication: When satisfied with a service provided by a firm,
customers would be encouraged to talk about that service.
Customer citizenship behaviour: When loyal customers give advice regarding the
service of a firm, it shows that they are exhibiting behaviours that add value to the firm.
Co-production: Loyal customers may, because of their experience with and
knowledge of the provider, contribute to the co-production of the service (Bowen 1986;
Lengnick-Hall 1996) by assisting in service delivery.
Social relationships: For some services, loyal customers may provide social benefits
to other customers in the form of friendships (Goodwin 1994; Goodwin and Gremler 1996;
Grove and Fisk 1997).
Mentoring of other customers: Finally, loyal customers may serve as mentors to other
less experienced customers (Zeithaml and Bitner 1996) thereby making the service delivery
process easier for all parties involved.

Methodology
Research Type:
Descriptive research have been used which describes data and characteristics about
the population or phenomenon being studied. Descriptive research methodology
describes situations, they do not make accurate predictions, and they do not determine cause
and effect relationships. There are three main types of descriptive methods: observational
methods, case-study methods and survey methods.
In this research, we have used Survey method of Descriptive research methodology to
conduct our research where we talked about customers‟ perception on services provided by
parlors or saloons and also tried to describe the extent of customer citizenship behavior in
parlors and saloons. (Hale, 2011)
Sample size and survey:
A total of 407 people from four categories of age groups such as below 21, 21-30, 3145 and above 45 were selected as our sample for research. All these people responded
differently to the variables related to the service quality of parlors and also the extent of their
customer citizenship behavior.
We included Convenience sampling (Castillo, 2009) which is a non-probability
sampling technique for our research. This is because it is not possible to survey every
individual among the age groups provided in our questionnaire. Therefore, non-probability
sampling techniques were used that is not the representative of the target population because
sample units were only selected if they could be accessed easily and conveniently
Questionnaire Design:
For the data collections purpose, a close ended questionnaire was designed.
Appropriate numbers of research questions were arranged with numerous variables to get
satisfactory response from the respondents. Also, the questions were designed according to
the need of the research. This was done to overcome the respondents‟ unwillingness to give a
response.
The questionnaire began with questions reflecting their personal information and
gradually started with questions related to the general perception on the subject of our
research. The answers were marked on a particular scale called “Likert scale”. It is the most
widely used approach to scaling responses in survey research. In the first section of the
questionnaire, we asked about the monthly income, their monthly expenditure and
educational qualification. In the second section we followed the Likert scale format in which
responses are scored along a range. In that section, respondents were asked to give points on a
five point scale, on questions related to their perception on service quality of parlors and their
CCB.
Also, „Validity test‟ was used while doing the survey „Validity‟ refers to the degree to
which evidence and theory support the interpretations of test scores entailed by proposed uses
of tests. The questionnaires have questions to measure the reliability of the answers in an
attempt to check whether the respondents answered the survey with full honesty or not.
Data collection:
Data was collected from both primary and secondary sources for conducting the
research. The survey was used as the primary data source. Secondary sources included
research papers.
Data Analysis:
We have used uni-variate method to analyze the survey results. This method includes
tests that compare samples from different groups. Typically uni-variate methods are designed
to evaluate one variable at a time, although a second variable used to group or sort the
variables may be implied. (http://www.epa.gov/bioindicators/statprimer/univariate.html,
2010)
At first, the mean and standard deviation of each variable was calculated. Then, we
have constructed pie-charts for variables such as age and number of family members. Next,
we constructed bar-charts for analyzing variables such as educational qualification and three
perception variables such as superior, excellent and standard quality. We also analyzed the
mean and standard deviation to find the variables with high and low means.
Correlation and regression are more accurately called bi-variate methods because they
involve the full range of both variables rather than just using one variable to categorize
another. Regression is used to predict the values of one variable from another while
correlation is used to test the strength of association between two variables.
Since we analyzed single variables independently, in our result analysis we used the
uni-variate method. This method helped to give a satisfying estimation from the response of
the sample provided.
Result analysis:
Analysis from the descriptive statistics
Descriptive Statistics

Age
Family members
Educational qualification
Service quality : Excellence
Service quality : Superior

Mean
2.47
3.99
2.78
3.54
3.43

Std. Deviation
1.116
1.067
1.204
1.086
1.127

Service quality : Standard

3.60

1.153

I suggest the parlour or saloon to customize their service
I recommend for the delivery time to the provider
I recommend in deciding the delivery place to the provider
I help other customers in comparing among parlours or saloons
I assist other customers by suggesting price
I assist other customers by telling the consequences of the service
I voluntarily help other customers whenever I see they need it
I teach other customers to use the service correctly
I discuss about advantages of the service with others
I say positive things about the parlour or saloon to others
I recommend service employee to others
I share useful ideas to improve the service after purchase
I inform the employees, if I experience any problem
I stay patience if I get poor service
I don‟t recommend about the delivery place to the provider
I suggest the parlour or saloon to add supportive features
I suggest in choosing service employee to other consumers
I assist customers if they are in a problem choosing the right service
I help other customers by making them aware of optional features
I help other customers by suggesting delivery time
I assist other customers by suggesting location of the parlour or saloon
I help other customers if they ask for my help
I recommend the service to others if I am satisfied with it
I encourage my friend and relatives to take this service
I encourage my family and friends about this parlour or saloon
I share my feelings to the provider after consuming the service
I fill customer satisfaction survey provided by the parlour or saloon

3.63

1.261

3.32

1.290

2.82

1.344

3.27

1.252

3.07

1.328

3.33

1.283

3.02

1.351

2.79

1.343

3.56

1.156

3.67

1.062

3.51

1.157

3.33

1.310

4.15

1.037

2.47

1.309

3.08

1.440

3.20

1.233

3.03

1.262

2.84

1.220

2.62

1.214

3.46

1.215

3.94

1.108

3.94

.985

3.79

1.137

3.95

2.196

3.59

1.132

3.17

1.250

2.96

1.297
Descriptive statistics
The statistics are used to describe only the observe group or sample which they are derived.
Summary statistics such as percent average and measure of variability that are computed on a
particular group of individual. Measure of variability means the standard deviation.

Age
<21
21-30
31-45
>45

The result of average age reflects that the age group of 21-30 are the ones who visit the
parlour or saloon frequently. The reason behind this is that this group of people are mostly
students or job seekers who are interested in fashion and beauty conscious. The value of the
standard deviation is low which indicates that the data points tend to be very close the mean.
So the result is satisfactory.

No. of Family Members

1
2
3
4

5
>5
The mean of family members is almost four. This represents the present situation of Dhaka
city suitably as our research is based in this city. The value of the standard deviation is low
which indicates that the data points are not scattered.

EDUCATIONAL QUALIFICATION
40.0
30.0
20.0
10.0
.0
SSC

HSC

HONS

OTHER

The outcome of our mean and standard deviation indicates that the average educational
qualification is above HSC which reflects the teenager and above age group who are more
conscious about their appearance is more attracted to going to parlours.
The outcome of perception towards service quality of parlour or saloon (below) is neutral
which shows that the customer‟s perception towards the service quality is gradually
improving. The respondents of this survey try to compare the service quality among the
parlours they go to. The customers are becoming more satisfied with the provided service
materials of parlours or saloon.
Variables with Low Means:
The variables “I stay patience if I get poor service” and “I fill customer satisfaction
survey provided by the parlour or saloon” have low means indicating disagreement of due to
the fact that it comes under a negative dimension with regards to the parlour services. And
the low standard deviation indicates that most people do have this opinion.
Variable with High Means:
The variable “encouraging family and friends about the service” , “I assist other
customers by suggesting location of the parlour or saloon” , “I help other customers if they
ask for my help” and “I recommend the service (not any specific provider) to others if I am
satisfied with it” are under the dimension of positive word of mouth which represents that the
customers are satisfied with the service provided by the parlour and for this reason they are
encouraged to talk about it to other customers. Also high traffic jams in Dhaka immobile
people thus parlours are most likely to have maximum of their customers from its own
locality. And as we all form a part of the polite society we are least likely to turn people down
when asked for help directly. Most customers are also very likely to promote services due to
the fact that positive action leads to positive results and parlour is such places that people do
bond over personal conversations regarding their skin care and the parlour. Ultimately, it will
create greater value for the parlour or saloon. On the other hand, the value of the standard
deviation shows that the data points are scattered from the mean.
The variable “informing the employees if they experience any problem” is known as
voice dimension of CCB which indicates the customers want to get proper satisfaction from
the service. They want to make the best worth out of the money they are paying that‟s why
their patience against the poor service is very low.
Analysis from frequency table:
Frequency Table

Percent
48.4

Cumulative
Percent
48.4

1

Percent
27.0

Cumulative
Percent
27.0

Male

51.6

100.0

2

24.8

51.8

Total

100.0

3

24.6

76.4

<21

25.8

15.7

92.1

25.6

4
MONTHLY
51.4 EXPENDETURE 5

21-30

4.4

96.6

31-45

24.8

76.2

6

2.2

98.8

45<

23.8

100.0

7

1.2

100.0

Total

100.0

Female

GENDER

AGE

25.8

Total

100.0

Business

11.1

1

6.9

6.9

Others

OCCUPATION

11.1
20.4

31.7

2

6.4

13.3

Service

19.9

51.6

3

31.9

45.2

4

35.4

80.6

5

19.4

100.0

Student
Total

48.4

100.0

EXCELENCE

100.0

1

2.0

Total

2

4.7

6.6

1

6.9

6.9

3

FAMILY
MEMBERS

2.0

23.8

30.5

2

6.4

13.3

4

39.8

70.3

3

31.9

45.2

4

35.4

80.6

5

19.4

100.0

5

21.9

92.1

>5

7.9

SUPERIOR

100.0

Total

100.0

<SSC

14.5

14.5

1

5.4

5.4

HSC

EDUCATION

30.7

45.2

2

9.8

15.2

Hon‟s

24.8

70.0

3

32.2

47.4

4

24.3

71.7

5

28.3

100.0

Masters
Total

30.0

Total

100.0

100.0

100.0

1

2.2

2

9.1

11.3

3

MONTHLY
INCOME

2.2

15.0

26.3

4

18.7

45.0

5

19.2

64.1

6

15.5

79.6

7

20.4

100.0

Total

100.0

STANDARD

Total

100.0

100.0
Frequency Statistics:
This table shows different demographics in percentages of total population that are found
using frequency method.

Gender
Female
Male

After doing the survey, we found that the practices of parlour or salon are almost equivalent
by both men and women. It means both men and women are very conscious about their looks.
Here the percentage of male who practices the saloon is 51.6% and the female who practices
parlour is 48.4% which is shown by the pie chart.
b
11%

Occupation

o
20%

st
49%

sr
20%

The practices of parlour or salon can vary from profession to
profession. In this survey, we found that the practices of this service are very high among the
student. The most probable reason could be of high practices of this service is their early age
and most of the time we see that at this age people are very beauty conscious. Another reason
may be students are free from responsibility. So, they have enough time to practice this
service easily. On the other hand this practice is very low among the business people and the
Frequency

probable reason behind it may be that they are very busy with their works. So, they do not
have enough time. The rest of the people who are service holder and from different
occupation practice this service almost at the same rate. After doing this survey, we found
that the percentage of visiting parlour or salon among the student is 48.4%, for business
people it is 11.1%, for service holder it is 19.9% and the rest of the people is 20.4%. The
graphical representation of this percentage is given above.

30.0
25.0
20.0
15.0
10.0
5.0
.0

Monthly Income
As you can see from the above graph, the highest frequency of monthly income in our survey
is of the last group of above tk 100000. This is due to the fact that we being private university students
come from well off families most of whom have been used to amass data for this research.

30.0
25.0

Frequency

20.0
15.0
10.0
5.0
.0

Monthly Expenditure
As we have used almost equal number of people to conduct our survey, the first two age
groups being students. That being the case, they are dependents who only have a very limited amount
of allowance and thus a minimum expenditure of below tk 10,000 has the maximum frequency.
Conclusion
By studying the entire research results on CCB, we can recommend the following
Managers should view customers as a valuable resource for collecting information
regarding their wants and needs
Management should devise strategies to increase employees‟ skills by establishing deep
and meaningful employee-company interactions.
Managers should be aware of the types of messages that employees send regarding the
service process.
Management can increase “the word of mouth‟‟ practice by increasing enough space in
parlour or saloon and parking facilities. These service facilities will encourage the
customers to be committed and encourage new customers about the location about the
parlour.
Management can also encourage CCB by establishing information desk at parlour to
create direct relationship with customers where they can find information and get instant
feedback.
Management can get performance review of parlour by introducing customer
satisfaction survey.
Again management should provide proper training to the employees on their norms,
behaviour so that they exhibit common courtesy and say greeting words towards the
customers.
Bibliography

Bove, L. L., & Garma, R. (2009). Customer Citizenship Behaviours Directed at Service Personnel:.
Bove, L. L., Pervan, S. J., Beatty, S. E., & Shiu, E. (2008). Service worker role in encouraging customer
organizational citizenship behaviors . Journal of Business Research .
Brown, S. W., & Gremler, D. D. (n.d.). Worth Beyond Revenue:The Full Value of a Loyal Customer.
Arizona State University, USA .
Castillo, J. J. (2009). http://www.experiment-resources.com/convenience-sampling.html.
Hale, J. (2011, Aug 7). The 3 Basic Types of Descriptive Research Methods. Retrieved from
http://www.experiment-resources.com/convenience-sampling.html
http://www.epa.gov/bioindicators/statprimer/univariate.html. (2010, Dec. 09).
Piriyakul, M., & Wingwon, B. (2010). Determinants of Perceived Performance Perceived CSR,
Perceived Product and Service Quality, Customer Citizenship Behavior of Modern Trade in Northern
Region THAILAND. (pp. 1-19). Yogyakarta: International College of Mekong Region.
Tuzun, I. K., & Devrani, T. K. (2011). The impact of perceived employee identification on the
relationship between customer company-identification and customer citizenship behaviour: Practice
from Turkish Hotels. African Journal of Business Management Vol. 5(5) , pp. 1781-1786.
Yi, Y., & Gong, T. (2006). The Antecedents and Consequences of Service Customer Citizenship and
Badness Behavior. Seoul Journal of Business .

MKT201--term paper--Research on Customer Citizenship Behaviour

  • 1.
    MKT 201 Research onCustomer Citizenship Behaviour Husian Salilul Akareem Lecturer of BRAC University Submitted by Group I: Anika Tahsin-11104061(#23) Maria Islam-11104085 (#27) Fatima Momin-11104132 (#35) Mehbuba Yasmin Tamanna-11104108 (#32) Tabassum Anwar Subha-11104116 (#33) Samiya Yesmin 11304043 (#37) Date of submission: August 7, 2012 Signature
  • 2.
    Summary This paper presentsthe importance of Customer Citizenship Behaviour (CCB) which is reflected in both the customers and the marketers, both of which creates value for each other in a lot of ways. Also, we have included the findings of other people about CCB such as customer citizenship behaviour r directed at service personnel, the role of service worker in encouraging CCB, impact of customer perception of employee identification, the antecedents and consequences of service customer citizenship, loyalty ripple effect, factors of CCB. For conducting this research, we have used descriptive method with the help of a particular sample size. A questionnaire has been designed with a good number of variables to get satisfactory response from the respondents‟. We collected the data and analyzed to show changes in CCB with regards to our variables to find how consumer preferences change as conditions applicable to them changes. Finally, we have also mentioned about the managerial obligations which highlights how managers may influence CCB in an organization for its profitability and success. Customer Citizenship Behaviour and Importance Customer citizenship behavior is defined as voluntary and discretionary behaviour of individual customers which an important factor for contributing to the overall success of the service organization. Service organizations must understand how they can get the maximum potential of their customers contributing to the service delivery. As a result, loyal customer may perform extra-role behavior such as word of mouth, product improvement suggestions and proactive communication of anticipated problems. Groth (2005) introduced customer citizenship behavior (CCB) among customers based on face to face interaction towards the internet business. CCB is defined as “voluntary and discretionary behaviors that are not required for the successful production and/or delivery of the service but that, in the aggregate, help the service organization overall” (Groth, 2005, p. 11). In recent years, there has been an increasing focus on customer citizenship behaviour in the managerial and marketing literature. Like organizational employees, customer may engage in a variety of citizenship behaviour directed toward a specific organization. (Yi & Gong) argues that “a central difference between service and manufacturing firms is that customers are often physically present when the service is provided, quite unlike manufacturing firms where customers are only rarely present during production.” Therefore, both customers and employees constitute the human resource of the service organization. Customers often perform the work that employees might otherwise perform, so that customers may even replace employees in service based organizations (Yi & Gong) Many terms have been used to describe customer citizenship behaviour, including customer discretionary behaviour (Yi & Gong) customer voluntary performance.
  • 3.
    The service literaturessuggest various forms of customer citizenship behaviour. Growth identified three dimensions of customer citizenship behaviour 1. Feedback: Providing feedback to the organization, which means providing solicited information to organizations that helps them improve their service delivery process. 2. Helping other customers, this closely parallels to altruism dimension found in organizational citizenship behaviour. 3. Word-of-mouth: refers to the recommendations that customers give to their friends and relatives after they are satisfied with the services provided by the firms. (Yi & Gong) also suggested that customers who exhibit citizenship behaviour may demonstrate commitment to the service organization and report potential safety problems to employee. Customer tolerance of service failures is another dimension of customer citizenship behaviour. It is defined as customer willingness to put up with or to be patient about service on counters that are not performed as expect. This acquiescent attitude results in continued patronage of the store and not spreading negative that common features of CCB include voluntary feedback discretionary behaviour and helping organization. IMPORTANCE OF CCB: Toward marketers: Customer citizenship behaviours (CCB) are highly valued by firms, particularly in the present environment where there is a push to encourage greater customer participation in service delivery to decrease organizational labour costs and increase productivity. Also, CCB helps us to get ideas about the changing wants, needs and demands of the market as time changes. This helps companies decide on product changes as well as qualities of the products to keep up with the market and competition demands. Building customer loyalty can lead to an increase in the company‟s profitable sales and will also enhance their long-term growth. Toward customers: Customer Citizenship Behaviour includes feedback from the customers after they use a service or purchase a product. This helps the customer to get desired and improved services. Through word-of-mouth, existing customers can influence other customers to use a product or service. This in turn helps new customers to gain knowledge about a product and also influence them to purchase. This therefore increases the value of the companies.
  • 4.
    Literature Review Bove &Garma 2009) customer citizenship behaviour CCB directed at service personnel (CCB-SP) based on the theory of social exchange helpful voluntarily performed by customers benefit service personnel CCB-SP five --- advocacy, sportsmanship, consultancy and dimensions assuming employee role, social support identified 31 of the 69 items clearly belonged to one of the five dimensions. Bove, Pervan, Beatty, & Shiu 2008) introduced the role of the individual service worker in encouraging customer organizational citizenship behaviours.They separeted the differences between the customer in-role and extra role behaviours. Customer in-role behaviours include performing the service delivery such as arriving on time for an appointment, providing a description of needs, even paying for the service. In contrast, extrarole behaviours are voluntary, helpful behaviours enacted towards the firm, service worker, or other customers which provide assistance to effective organizational functioning. These behaviours can positively affect the performance of service workers and the organization. They also said that customer‟s commitment to service worker, customers‟ perception about service worker‟s creditability and benevolence and finally customers‟ personal loyalty to service worker are the strongest predictor of customer OCBs. Devrani & Tuzun impact of customerperception of employee identification behaviour identification allows to become psychologically attached to and care about the organization perception of employee identification is significantly and positively correlated with CCB moderates the relationship between identification and u (Yi & Gong, 2006) have researched about the background and consequences of service customer citizenship and badness behaviour. Customer badness behaviour refers to dysfunctional customers who damage the company in some way. Negative effect, perceived justice, and commitment are considered as the antecedents and perceived service quality as the consequence. Perceive justice and commitment exert a positive influence on customer citizenship behaviour. On the other hand, negative affect will increase customer badness behaviour. According to Wingwon, B, & Piriyakul, M. (2010) the factors that affect customer citizenship behaviour are customer satisfaction and the corporate affection. The customer satisfaction was the emotional reaction of consumers toward the product usage and the corporate affection was the positive attitude of them toward the corporate. They said that the customer satisfaction has direct effect but the corporate affection has indirect effect because of the mediator.
  • 5.
    Customer behaviour exhibits“loyalty ripple effect” which can add value to a firm‟s service quality. This effect at first initiates service loyalty which may be defined as "the degree to which a customer exhibits repeat purchasing behaviour towards service provider, possesses a positive attitudinal disposition toward the provider, and considers using only this provider when a need for this service arises" (Brown & Gremler)This effect includes the following phase: Word-of-mouth communication: When satisfied with a service provided by a firm, customers would be encouraged to talk about that service. Customer citizenship behaviour: When loyal customers give advice regarding the service of a firm, it shows that they are exhibiting behaviours that add value to the firm. Co-production: Loyal customers may, because of their experience with and knowledge of the provider, contribute to the co-production of the service (Bowen 1986; Lengnick-Hall 1996) by assisting in service delivery. Social relationships: For some services, loyal customers may provide social benefits to other customers in the form of friendships (Goodwin 1994; Goodwin and Gremler 1996; Grove and Fisk 1997). Mentoring of other customers: Finally, loyal customers may serve as mentors to other less experienced customers (Zeithaml and Bitner 1996) thereby making the service delivery process easier for all parties involved. Methodology Research Type: Descriptive research have been used which describes data and characteristics about the population or phenomenon being studied. Descriptive research methodology describes situations, they do not make accurate predictions, and they do not determine cause and effect relationships. There are three main types of descriptive methods: observational methods, case-study methods and survey methods. In this research, we have used Survey method of Descriptive research methodology to conduct our research where we talked about customers‟ perception on services provided by parlors or saloons and also tried to describe the extent of customer citizenship behavior in parlors and saloons. (Hale, 2011) Sample size and survey: A total of 407 people from four categories of age groups such as below 21, 21-30, 3145 and above 45 were selected as our sample for research. All these people responded differently to the variables related to the service quality of parlors and also the extent of their customer citizenship behavior. We included Convenience sampling (Castillo, 2009) which is a non-probability sampling technique for our research. This is because it is not possible to survey every individual among the age groups provided in our questionnaire. Therefore, non-probability
  • 6.
    sampling techniques wereused that is not the representative of the target population because sample units were only selected if they could be accessed easily and conveniently Questionnaire Design: For the data collections purpose, a close ended questionnaire was designed. Appropriate numbers of research questions were arranged with numerous variables to get satisfactory response from the respondents. Also, the questions were designed according to the need of the research. This was done to overcome the respondents‟ unwillingness to give a response. The questionnaire began with questions reflecting their personal information and gradually started with questions related to the general perception on the subject of our research. The answers were marked on a particular scale called “Likert scale”. It is the most widely used approach to scaling responses in survey research. In the first section of the questionnaire, we asked about the monthly income, their monthly expenditure and educational qualification. In the second section we followed the Likert scale format in which responses are scored along a range. In that section, respondents were asked to give points on a five point scale, on questions related to their perception on service quality of parlors and their CCB. Also, „Validity test‟ was used while doing the survey „Validity‟ refers to the degree to which evidence and theory support the interpretations of test scores entailed by proposed uses of tests. The questionnaires have questions to measure the reliability of the answers in an attempt to check whether the respondents answered the survey with full honesty or not. Data collection: Data was collected from both primary and secondary sources for conducting the research. The survey was used as the primary data source. Secondary sources included research papers. Data Analysis: We have used uni-variate method to analyze the survey results. This method includes tests that compare samples from different groups. Typically uni-variate methods are designed to evaluate one variable at a time, although a second variable used to group or sort the variables may be implied. (http://www.epa.gov/bioindicators/statprimer/univariate.html, 2010) At first, the mean and standard deviation of each variable was calculated. Then, we have constructed pie-charts for variables such as age and number of family members. Next, we constructed bar-charts for analyzing variables such as educational qualification and three perception variables such as superior, excellent and standard quality. We also analyzed the mean and standard deviation to find the variables with high and low means.
  • 7.
    Correlation and regressionare more accurately called bi-variate methods because they involve the full range of both variables rather than just using one variable to categorize another. Regression is used to predict the values of one variable from another while correlation is used to test the strength of association between two variables. Since we analyzed single variables independently, in our result analysis we used the uni-variate method. This method helped to give a satisfying estimation from the response of the sample provided.
  • 8.
    Result analysis: Analysis fromthe descriptive statistics Descriptive Statistics Age Family members Educational qualification Service quality : Excellence Service quality : Superior Mean 2.47 3.99 2.78 3.54 3.43 Std. Deviation 1.116 1.067 1.204 1.086 1.127 Service quality : Standard 3.60 1.153 I suggest the parlour or saloon to customize their service I recommend for the delivery time to the provider I recommend in deciding the delivery place to the provider I help other customers in comparing among parlours or saloons I assist other customers by suggesting price I assist other customers by telling the consequences of the service I voluntarily help other customers whenever I see they need it I teach other customers to use the service correctly I discuss about advantages of the service with others I say positive things about the parlour or saloon to others I recommend service employee to others I share useful ideas to improve the service after purchase I inform the employees, if I experience any problem I stay patience if I get poor service I don‟t recommend about the delivery place to the provider I suggest the parlour or saloon to add supportive features I suggest in choosing service employee to other consumers I assist customers if they are in a problem choosing the right service I help other customers by making them aware of optional features I help other customers by suggesting delivery time I assist other customers by suggesting location of the parlour or saloon I help other customers if they ask for my help I recommend the service to others if I am satisfied with it I encourage my friend and relatives to take this service I encourage my family and friends about this parlour or saloon I share my feelings to the provider after consuming the service I fill customer satisfaction survey provided by the parlour or saloon 3.63 1.261 3.32 1.290 2.82 1.344 3.27 1.252 3.07 1.328 3.33 1.283 3.02 1.351 2.79 1.343 3.56 1.156 3.67 1.062 3.51 1.157 3.33 1.310 4.15 1.037 2.47 1.309 3.08 1.440 3.20 1.233 3.03 1.262 2.84 1.220 2.62 1.214 3.46 1.215 3.94 1.108 3.94 .985 3.79 1.137 3.95 2.196 3.59 1.132 3.17 1.250 2.96 1.297
  • 9.
    Descriptive statistics The statisticsare used to describe only the observe group or sample which they are derived. Summary statistics such as percent average and measure of variability that are computed on a particular group of individual. Measure of variability means the standard deviation. Age <21 21-30 31-45 >45 The result of average age reflects that the age group of 21-30 are the ones who visit the parlour or saloon frequently. The reason behind this is that this group of people are mostly students or job seekers who are interested in fashion and beauty conscious. The value of the standard deviation is low which indicates that the data points tend to be very close the mean. So the result is satisfactory. No. of Family Members 1 2 3 4 5 >5
  • 10.
    The mean offamily members is almost four. This represents the present situation of Dhaka city suitably as our research is based in this city. The value of the standard deviation is low which indicates that the data points are not scattered. EDUCATIONAL QUALIFICATION 40.0 30.0 20.0 10.0 .0 SSC HSC HONS OTHER The outcome of our mean and standard deviation indicates that the average educational qualification is above HSC which reflects the teenager and above age group who are more conscious about their appearance is more attracted to going to parlours. The outcome of perception towards service quality of parlour or saloon (below) is neutral which shows that the customer‟s perception towards the service quality is gradually improving. The respondents of this survey try to compare the service quality among the parlours they go to. The customers are becoming more satisfied with the provided service materials of parlours or saloon.
  • 11.
    Variables with LowMeans: The variables “I stay patience if I get poor service” and “I fill customer satisfaction survey provided by the parlour or saloon” have low means indicating disagreement of due to the fact that it comes under a negative dimension with regards to the parlour services. And the low standard deviation indicates that most people do have this opinion. Variable with High Means: The variable “encouraging family and friends about the service” , “I assist other customers by suggesting location of the parlour or saloon” , “I help other customers if they ask for my help” and “I recommend the service (not any specific provider) to others if I am satisfied with it” are under the dimension of positive word of mouth which represents that the customers are satisfied with the service provided by the parlour and for this reason they are encouraged to talk about it to other customers. Also high traffic jams in Dhaka immobile people thus parlours are most likely to have maximum of their customers from its own locality. And as we all form a part of the polite society we are least likely to turn people down when asked for help directly. Most customers are also very likely to promote services due to the fact that positive action leads to positive results and parlour is such places that people do bond over personal conversations regarding their skin care and the parlour. Ultimately, it will create greater value for the parlour or saloon. On the other hand, the value of the standard deviation shows that the data points are scattered from the mean. The variable “informing the employees if they experience any problem” is known as voice dimension of CCB which indicates the customers want to get proper satisfaction from the service. They want to make the best worth out of the money they are paying that‟s why their patience against the poor service is very low.
  • 12.
    Analysis from frequencytable: Frequency Table Percent 48.4 Cumulative Percent 48.4 1 Percent 27.0 Cumulative Percent 27.0 Male 51.6 100.0 2 24.8 51.8 Total 100.0 3 24.6 76.4 <21 25.8 15.7 92.1 25.6 4 MONTHLY 51.4 EXPENDETURE 5 21-30 4.4 96.6 31-45 24.8 76.2 6 2.2 98.8 45< 23.8 100.0 7 1.2 100.0 Total 100.0 Female GENDER AGE 25.8 Total 100.0 Business 11.1 1 6.9 6.9 Others OCCUPATION 11.1 20.4 31.7 2 6.4 13.3 Service 19.9 51.6 3 31.9 45.2 4 35.4 80.6 5 19.4 100.0 Student Total 48.4 100.0 EXCELENCE 100.0 1 2.0 Total 2 4.7 6.6 1 6.9 6.9 3 FAMILY MEMBERS 2.0 23.8 30.5 2 6.4 13.3 4 39.8 70.3 3 31.9 45.2 4 35.4 80.6 5 19.4 100.0 5 21.9 92.1 >5 7.9 SUPERIOR 100.0 Total 100.0 <SSC 14.5 14.5 1 5.4 5.4 HSC EDUCATION 30.7 45.2 2 9.8 15.2 Hon‟s 24.8 70.0 3 32.2 47.4 4 24.3 71.7 5 28.3 100.0 Masters Total 30.0 Total 100.0 100.0 100.0 1 2.2 2 9.1 11.3 3 MONTHLY INCOME 2.2 15.0 26.3 4 18.7 45.0 5 19.2 64.1 6 15.5 79.6 7 20.4 100.0 Total 100.0 STANDARD Total 100.0 100.0
  • 13.
    Frequency Statistics: This tableshows different demographics in percentages of total population that are found using frequency method. Gender Female Male After doing the survey, we found that the practices of parlour or salon are almost equivalent by both men and women. It means both men and women are very conscious about their looks. Here the percentage of male who practices the saloon is 51.6% and the female who practices parlour is 48.4% which is shown by the pie chart. b 11% Occupation o 20% st 49% sr 20% The practices of parlour or salon can vary from profession to profession. In this survey, we found that the practices of this service are very high among the student. The most probable reason could be of high practices of this service is their early age and most of the time we see that at this age people are very beauty conscious. Another reason may be students are free from responsibility. So, they have enough time to practice this service easily. On the other hand this practice is very low among the business people and the
  • 14.
    Frequency probable reason behindit may be that they are very busy with their works. So, they do not have enough time. The rest of the people who are service holder and from different occupation practice this service almost at the same rate. After doing this survey, we found that the percentage of visiting parlour or salon among the student is 48.4%, for business people it is 11.1%, for service holder it is 19.9% and the rest of the people is 20.4%. The graphical representation of this percentage is given above. 30.0 25.0 20.0 15.0 10.0 5.0 .0 Monthly Income As you can see from the above graph, the highest frequency of monthly income in our survey is of the last group of above tk 100000. This is due to the fact that we being private university students come from well off families most of whom have been used to amass data for this research. 30.0 25.0 Frequency 20.0 15.0 10.0 5.0 .0 Monthly Expenditure As we have used almost equal number of people to conduct our survey, the first two age groups being students. That being the case, they are dependents who only have a very limited amount of allowance and thus a minimum expenditure of below tk 10,000 has the maximum frequency.
  • 15.
    Conclusion By studying theentire research results on CCB, we can recommend the following Managers should view customers as a valuable resource for collecting information regarding their wants and needs Management should devise strategies to increase employees‟ skills by establishing deep and meaningful employee-company interactions. Managers should be aware of the types of messages that employees send regarding the service process. Management can increase “the word of mouth‟‟ practice by increasing enough space in parlour or saloon and parking facilities. These service facilities will encourage the customers to be committed and encourage new customers about the location about the parlour. Management can also encourage CCB by establishing information desk at parlour to create direct relationship with customers where they can find information and get instant feedback. Management can get performance review of parlour by introducing customer satisfaction survey. Again management should provide proper training to the employees on their norms, behaviour so that they exhibit common courtesy and say greeting words towards the customers.
  • 16.
    Bibliography Bove, L. L.,& Garma, R. (2009). Customer Citizenship Behaviours Directed at Service Personnel:. Bove, L. L., Pervan, S. J., Beatty, S. E., & Shiu, E. (2008). Service worker role in encouraging customer organizational citizenship behaviors . Journal of Business Research . Brown, S. W., & Gremler, D. D. (n.d.). Worth Beyond Revenue:The Full Value of a Loyal Customer. Arizona State University, USA . Castillo, J. J. (2009). http://www.experiment-resources.com/convenience-sampling.html. Hale, J. (2011, Aug 7). The 3 Basic Types of Descriptive Research Methods. Retrieved from http://www.experiment-resources.com/convenience-sampling.html http://www.epa.gov/bioindicators/statprimer/univariate.html. (2010, Dec. 09). Piriyakul, M., & Wingwon, B. (2010). Determinants of Perceived Performance Perceived CSR, Perceived Product and Service Quality, Customer Citizenship Behavior of Modern Trade in Northern Region THAILAND. (pp. 1-19). Yogyakarta: International College of Mekong Region. Tuzun, I. K., & Devrani, T. K. (2011). The impact of perceived employee identification on the relationship between customer company-identification and customer citizenship behaviour: Practice from Turkish Hotels. African Journal of Business Management Vol. 5(5) , pp. 1781-1786. Yi, Y., & Gong, T. (2006). The Antecedents and Consequences of Service Customer Citizenship and Badness Behavior. Seoul Journal of Business .