Sampling Distribution and Confidence Intervals
•
0 likes•343 views

Formulas compiled for Statistics for economics For Mr. Iftekharul Haque's class

Recommended
More Related Content
What's hot
What's hot (20)
Viewers also liked
Viewers also liked (19)
Similar to Sampling Distribution and Confidence Intervals
Similar to Sampling Distribution and Confidence Intervals (20)
Recently uploaded
Recently uploaded (20)
Sampling Distribution and Confidence Intervals
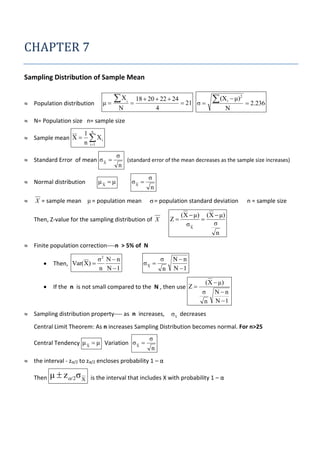
- 1. CHAPTER 7 Sampling Distribution of Sample Mean Population distribution μ X N i 18 20 22 24 21 σ 4 (X i μ)2 N 2.236 N= Population size n= sample size Sample mean X 1 n Xi n i 1 Standard Error of mean σ X μX μ Normal distribution σ (standard error of the mean decreases as the sample size increases) n σX X = sample mean μ = population mean σ n σ = population standard deviation Z Then, Z-value for the sampling distribution of X n = sample size (X μ) (X μ) σ σX n Finite population correction----n > 5% of N σ2 N n n N 1 σX σ n Nn N 1 Then, Var( X) If the n is not small compared to the N , then use Z Sampling distribution property---- as n increases, (X μ) σ Nn n N 1 σ x decreases Central Limit Theorem: As n increases Sampling Distribution becomes normal. For n>25 Central Tendency μ X μ Variation σ X σ n the interval - zα/2 to zα/2 encloses probability 1 – α Then μ z/2σ X is the interval that includes X with probability 1 – α
- 2. Sampling Distribution of Sample Proportion: P= population proportion ˆ X ˆ P = sample proportion P n ˆ 0≤ P≤1 ˆ P has a binomial distribution, but can be approximated by a normal distribution when nP(1 – P) > 9 ˆ E( P) p Z X P(1 P) σ 2 Var ˆ P n n ˆ PP σP ˆ ˆ PP P(1 P) n Chapter 8 If P(a < < b) = 1 - (1 - ) is called the confidence level then the interval from a to b is called a 100(1 - )% confidence interval of . Confidence Intervals for σ2 Known: z table Point Estimate ± (Reliability Factor)(Standard Error) x z α/2 σ n Where margin of error= ME z α/2 σ n W= 2ME The margin of error can be reduced if the population standard deviation can be reduced (σ↓) The sample size is increased (n↑) The confidence level is decreased, (1 – ) ↓ Confidence Intervals for σ2 Unknown: t table x μ x =mean, s=standard deviation s/ n t degrees of freedom= v= n-1 P(t n 1 t n 1,α/2 ) α/2
- 3. x t n -1,α/2 S S μ x t n -1,α/2 n n where tn-1,α/2 is the critical value Confidence Intervals for the Population Proportion, p: P(1 P) n σP ˆ p z α/2 ˆ ˆ ˆ ˆ p(1 p) p(1 p) ˆ P p z α/2 n n Chapter 10 Key: Outcome (Probability) The power of a test is the probability of rejecting a null hypothesis that is false Power = P(Reject H0 | H1 is true) Power of the test increases as the sample size increases If Calculated z < Critical zα = Do not reject Ho If Calculated z > Critical zα = Reject Ho
- 4. p-Value Approach to Testing Smallest value of for which H0 can be rejected For two-tail Tests of the Population Proportion: σp ˆ P(1 P) n