Download as PDF, PPTX
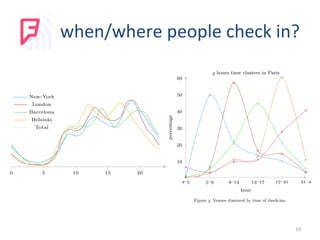
![when/where
people
check
in?
datasets
City Name Category Entropy
Barcelona
Castellers de Barcelona Non-Profit 0.0139
Café de la Pompeu Café 0.0172
Ràdio Radio Station 0.0176
Paris
Boutique Orange Electronics Store 0.0099
Métro Goncourt [] Subway 0.0105
Blue Acacia Office 0.0112
Barcelona
Plaça de Catalunya Plaza 0.5835
Sants Estació Train Station 0.6298
Sagrada Família Government Building 0.6309
Camp Nou Stadium 0.6852
Paris
Gare SNCF : Gare de Lyon Train Station 0.6725
Gare SNCF : Paris Nord Train Station 0.6911
Musée du Louvre Museum 0.6924
Tour Eiffel Government Building 0.7167
(a) Venues in Paris and Barcelona with lowest and highest user en-
tropy.
14](https://image.slidesharecdn.com/t61-151016081741-lva1-app6891/85/Mining-the-Social-Web-Lecture-1-T61-6020-lecture-01-slides-14-320.jpg)


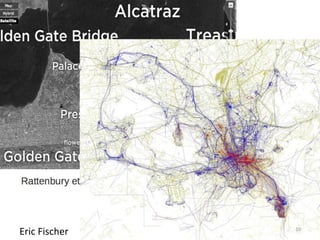
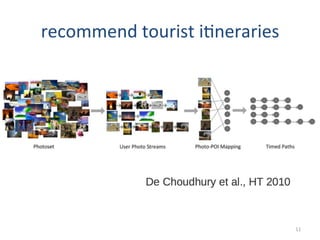
This document provides an introduction to mining data from the social web. It discusses various social media platforms like Facebook, Twitter, LinkedIn, Foursquare, and Flickr that enable users to produce, consume and interact with content. The document explores what insights can be gained from analyzing the large amounts of social data, such as understanding social behavior, political sentiment, how cities are experienced, and career trends. It outlines existing research on analyzing data from Twitter and photos to detect events, trends, opinions and more. The document concludes by discussing potential student project ideas involving hypothesis testing, exploring questions, solving problems, or analyzing interesting datasets.


