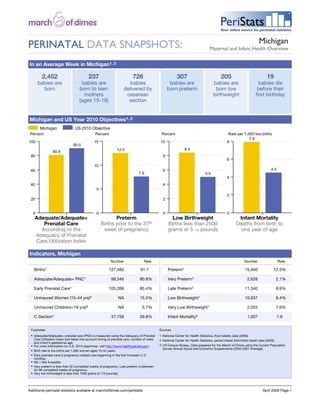
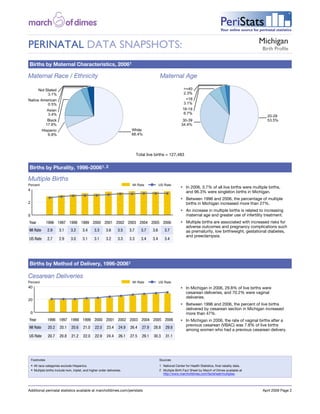
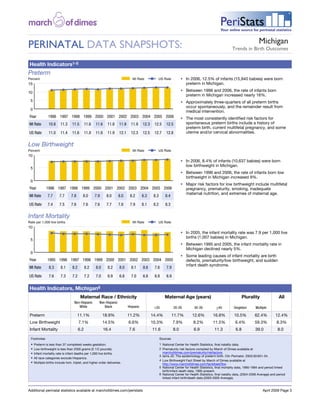
1. Image description. March of Dimes Logo End of image description. Image description. Peristats Logo End of image description.
PeriStats
Your online source for perinatal statistics
Michigan
PERINATAL DATA SNAPSHOTS: Maternal and Infant Health Overview
In an Average Week in Michigan1, 2
2,452 237 726 307 205 19
babies are babies are babies babies are babies are babies die
born born to teen delivered by born preterm born low before their
mothers cesarean birthweight first birthday
(ages 15-19) section
Michigan and US Year 2010 Objectives1, 2
Michigan US 2010 Objective
Adequate/Adequate+ Preterm Low Birthweight Infant Mortality
Prenatal Care Births prior to the 37th Births less than 2500 Deaths from birth to
According to the week of pregnancy grams or 5 1/2 pounds one year of age
Adequacy of Prenatal
Care Utilization Index
Indicators, Michigan
Number Rate Number Rate
Births1 127,483 61.7 Preterm1 15,940 12.5%
Adequate/Adequate+ PNC1 99,546 80.8% Very Preterm1 2,628 2.1%
Early Prenatal Care1 105,268 85.4% Late Preterm1 11,340 8.9%
Uninsured Women (15-44 yrs)3 NA 15.5% Low Birthweight1 10,637 8.4%
Uninsured Children(<19 yrs)3 NA 5.7% Very Low Birthweight1 2,022 1.6%
C Section1 37,758 29.8% Infant Mortality2 1,007 7.9
Footnotes Sources
• Adequate/Adequate+ prenatal care (PNC) is measured using the Adequacy of Prenatal 1 National Center for Health Statistics, final natality data (2006).
Care Utilization Index and takes into account timing of prenatal care, number of visits, 2 National Center for Health Statistics, period linked birth/infant death data (2005).
and infant's gestational age.
• For more information on U.S. 2010 objectives, visit http://www.healthypeople.gov/. 3 US Census Bureau. Data prepared for the March of Dimes using the Current Population
Survey Annual Social and Economic Supplements (2005-2007 Average).
• Birth rate is live births per 1,000 women aged 15-44 years.
• Early prenatal care is pregnancy-related care beginning in the first trimester (1-3
months).
• NA = Not Available.
• Very preterm is less than 32 completed weeks of pregnancy. Late preterm is between
34-36 completed weeks of pregnancy.
• Very low birthweight is less than 1500 grams (3 1/3 pounds).
Additional perinatal statistics available at marchofdimes.com/peristats April 2009 Page 1
2. Image description. March of Dimes Logo End of image description. Image description. Peristats Logo End of image description.
PeriStats
Your online source for perinatal statistics
Michigan
PERINATAL DATA SNAPSHOTS: Birth Profile
Births by Maternal Characteristics, 20061
Maternal Race / Ethnicity Maternal Age
Total live births = 127,483
Births by Plurality, 1996-20061, 2
Multiple Births
• In 2006, 3.7% of all live births were multiple births,
and 96.3% were singleton births in Michigan.
• Between 1996 and 2006, the percentage of multiple
births in Michigan increased more than 27%.
• An increase in multiple births is related to increasing
maternal age and greater use of infertility treatment.
Year 1996 1997 1998 1999 2000 2001 2002 2003 2004 2005 2006 • Multiple births are associated with increased risks for
adverse outcomes and pregnancy complications such
MI Rate 2.9 3.1 3.2 3.4 3.3 3.6 3.5 3.7 3.7 3.6 3.7 as prematurity, low birthweight, gestational diabetes,
and preeclampsia.
US Rate 2.7 2.9 3.0 3.1 3.1 3.2 3.3 3.3 3.4 3.4 3.4
Births by Method of Delivery, 1996-20061
Cesarean Deliveries
• In Michigan in 2006, 29.8% of live births were
cesarean deliveries, and 70.2% were vaginal
deliveries.
• Between 1996 and 2006, the percent of live births
delivered by cesarean section in Michigan increased
more than 47%.
Year 1996 1997 1998 1999 2000 2001 2002 2003 2004 2005 2006 • In Michigan in 2006, the rate of vaginal births after a
previous cesarean (VBAC) was 7.8% of live births
MI Rate 20.2 20.1 20.6 21.0 22.0 23.4 24.9 26.4 27.9 28.8 29.8
among women who had a previous cesarean delivery.
US Rate 20.7 20.8 21.2 22.0 22.9 24.4 26.1 27.5 29.1 30.3 31.1
Footnotes Sources
• All race categories exclude Hispanics. 1 National Center for Health Statistics, final natality data.
• Multiple births include twin, triplet, and higher order deliveries. 2 Multiple Birth Fact Sheet by March of Dimes available at
http://www.marchofdimes.com/factsheet/multiples.
Additional perinatal statistics available at marchofdimes.com/peristats April 2009 Page 2
3. Image description. March of Dimes Logo End of image description. Image description. Peristats Logo End of image description.
PeriStats
Your online source for perinatal statistics
Michigan
PERINATAL DATA SNAPSHOTS: Trends in Birth Outcomes
Health Indicators1-5
Preterm
• In 2006, 12.5% of infants (15,940 babies) were born
preterm in Michigan.
• Between 1996 and 2006, the rate of infants born
preterm in Michigan increased nearly 16%.
• Approximately three-quarters of all preterm births
occur spontaneously, and the remainder result from
medical intervention.
Year 1996 1997 1998 1999 2000 2001 2002 2003 2004 2005 2006 • The most consistently identified risk factors for
MI Rate 10.8 11.3 11.5 11.6 11.6 11.8 11.9 11.9 12.3 12.5 12.5 spontaneous preterm births include a history of
preterm birth, current multifetal pregnancy, and some
US Rate 11.0 11.4 11.6 11.8 11.6 11.9 12.1 12.3 12.5 12.7 12.8 uterine and/or cervical abnormalities.
Low Birthweight
• In 2006, 8.4% of infants (10,637 babies) were born
low birthweight in Michigan.
• Between 1996 and 2006, the rate of infants born low
birthweight in Michigan increased 9%.
• Major risk factors for low birthweight include multifetal
Year 1996 1997 1998 1999 2000 2001 2002 2003 2004 2005 2006 pregnancy, prematurity, smoking, inadequate
maternal nutrition, and extremes of maternal age.
MI Rate 7.7 7.7 7.8 8.0 7.9 8.0 8.0 8.2 8.3 8.3 8.4
US Rate 7.4 7.5 7.6 7.6 7.6 7.7 7.8 7.9 8.1 8.2 8.3
Infant Mortality
• In 2005, the infant mortality rate was 7.9 per 1,000 live
births (1,007 babies) in Michigan.
• Between 1995 and 2005, the infant mortality rate in
Michigan declined nearly 5%.
• Some leading causes of infant mortality are birth
Year 1995 1996 1997 1998 1999 2000 2001 2002 2003 2004 2005 defects, prematurity/low birthweight, and sudden
infant death syndrome.
MI Rate 8.3 8.1 8.2 8.2 8.0 8.2 8.0 8.1 8.6 7.6 7.9
US Rate 7.6 7.3 7.2 7.2 7.0 6.9 6.8 7.0 6.8 6.8 6.9
Health Indicators, Michigan6
Maternal Race / Ethnicity Maternal Age (years) Plurality All
Non-Hispanic Non-Hispanic
White Black Hispanic <20 20-29 30-39 >40 Singleton Multiple
Preterm 11.1% 18.9% 11.2% 14.4% 11.7% 12.6% 16.8% 10.5% 62.4% 12.4%
Low Birthweight 7.1% 14.5% 6.6% 10.3% 7.9% 8.2% 11.5% 6.4% 59.3% 8.3%
Infant Mortality 6.2 16.4 7.6 11.6 8.0 6.9 11.3 6.8 39.0 8.0
Footnotes Sources
• Preterm is less than 37 completed weeks gestation. 1 National Center for Health Statistics, final natality data.
• Low birthweight is less than 2500 grams (5 1/2 pounds). 2 Prematurity risk factors compiled by March of Dimes available at
• Infant mortality rate is infant deaths per 1,000 live births. marchofdimes.com/prematurity/riskfactors.
3 Iams JD. The epidemiology of preterm birth. Clin Perinatol. 2003;30:651-54.
• All race categories exclude Hispanics.
4 Low Birthweight Fact Sheet by March of Dimes available at
• Multiple births include twin, triplet, and higher order deliveries.
http://www.marchofdimes.com/factsheet/lbw.
5 National Center for Health Statistics, final mortality data, 1990-1994 and period linked
birth/infant death data, 1995-present.
6 National Center for Health Statistics, final natality data, (2004-2006 Average) and period
linked infant birth/death data (2003-2005 Average).
Additional perinatal statistics available at marchofdimes.com/peristats April 2009 Page 3
4. Image description. March of Dimes Logo End of image description. Image description. Peristats Logo End of image description.
PeriStats
Your online source for perinatal statistics
United States
PERINATAL DATA SNAPSHOTS: Birth Defects
Birth Defects Monitoring Program1-3
• In the United States, birth defects have been the leading cause • Hospital costs for stays due to birth defects totaled $2.6 billion
of infant mortality for the past 20 years, accounting for 1 in 5 for all birth defects and all ages. More than half of all hospital
infant deaths. costs were related to cardiac and circulatory birth defects.
Associated costs of physician care and other outpatient
• Each year at least 120,000 babies are born with major
medical services are not included in this figure.
structural birth defects in the United States (about 3% of live
births). • Three-quarters (37) of states have some type of birth defects
surveillance program, while another eight and the District of
Columbia are planning one. For more information on state birth
defects surveillance programs, please visit the National Birth
Defects Prevention Network.
Folic Acid Knowledge and Behavior, United States4
Daily Use of Vitamin Containing Folic Acid
Percent of women ages 18-45
• Up to 70% of neural tube defects--birth defects of the
brain and spinal cord--may be prevented if women
consume 400 micrograms of folic acid daily, prior to
and during the early weeks of conception.
• While 84% of women ages 18-45 surveyed in 2008
had heard of folic acid, only 11% of these women
knew to take folic acid before pregnancy.
• In 2008, 39% of women surveyed reported taking a
vitamin containing folic acid daily.
Footnotes Sources
• Annual number of birth defects based on estimates from the Centers for Disease 1 Centers for Disease Control and Prevention (2007).
Control and Prevention. 2 National Center for Health Statistics, period linked birth/infant death data (2005).
• March of Dimes Folic Acid Surveys are nationally representative telephone surveys
3 Russo CA and Elixhauser, A. Hospitalizations for Birth Defects, 2004. HCUP Statistical
targeting approximately 2000 English-speaking women ages 18-45 each year. Margin
of error is +/-3%. Brief #24. January 2007. Agency for Healthcare Research and Quality.
• Folic acid data shown for all available years. 4 March of Dimes Folic Acid Surveys, conducted by Gallup.
Additional perinatal statistics available at marchofdimes.com/peristats April 2009 Page 4
5. Image description. March of Dimes Logo End of image description. Image description. Peristats Logo End of image description.
PeriStats
Your online source for perinatal statistics
Michigan
PERINATAL DATA SNAPSHOTS: Trends in Risk Indicators
Selected Risk Indicators 1-3
Women of childbearing age can take steps before and during pregnancy to improve birth outcomes. Some steps include adopting a healthy
lifestyle that includes moderate exercise and a healthy diet; reducing stress; and avoiding exposure to smoking, alcohol, illegal drugs, and
some medications that can harm a developing fetus. Women can also achieve a healthy weight before pregnancy to increase their chances
of having a healthy baby. Examples of trends in smoking, binge alcohol use, and obesity are shown below. For more information on what to
avoid and how to stay healthy during pregnancy, visit http://www.marchofdimes.com/healthypregnancy.
Smoking
• In Michigan in 2007, 24.1% of women ages 18-44
reported smoking, compared to 21.2% overall in the
U.S.
• Smoking is an important determinant of health status
and a major contributor to prematurity and low
Year 1997 1998 1999 2000 2001 2002 2003 2004 2005 2006 2007 birthweight.
MI Rate 28.8 32.4 30.1 27.5 30.6 27.9 29.2 28.1 25.0 24.5 24.1
US Rate 26.3 26.0 26.4 27.1 26.3 25.5 24.9 22.8 23.5 22.4 21.2
Binge Alcohol Use
• In Michigan in 2007, 18.1% of women ages 18-44
reported binge drinking in the past month, compared
to 14.6% overall in the U.S.
• Drinking alcohol during pregnancy particularly binge
drinking can cause birth defects and mental
Year 1997 1999 2001 2002 2003 2004 2005 2006 2007 retardation.
MI Rate 14.3 14.5 16.4 15.3 17.4 14.0 15.1 17.2 18.1
US Rate 10.5 11.8 12.3 13.3 13.8 12.0 11.4 15.5 14.6
Obesity
• In Michigan in 2007, 24.3% of women ages 18-44
were obese, compared to 23.6% overall in the U.S.
• Obesity increases the risk of poor pregnancy
outcomes. Obesity can cause serious pregnancy-
related medical complications such as hypertension
Year 1997 1998 1999 2000 2001 2002 2003 2004 2005 2006 2007 and diabetes that contribute to prematurity and
increase the likelihood of cesarean section.
MI Rate 18.4 19.9 18.0 16.7 18.8 22.7 21.9 23.2 22.1 24.4 24.3
US Rate 14.5 15.3 15.2 16.4 17.6 17.8 19.2 20.2 21.4 21.7 23.6
Footnotes Sources
• Smoking is defined as current smokers who have ever smoked >100 cigarettes. 1 Behavioral Risk Factor Surveillance System, Centers for Disease Control and Prevention.
• Binge alcohol use is defined as >= 4 drinks on at least 1 occasion in the past month 2 Smoking during Pregnancy Fact Sheet by March of Dimes available at
beginning in 2006, and >= 5 drinks on at least 1 occasion in the past month prior to http://www.marchofdimes.com/factsheet/smoking.
2006. 3 Drinking Alcohol during Pregnancy Fact Sheet by March of Dimes available at
• Obesity is defined as a Body Mass Index of 30 or more. http://www.marchofdimes.com/factsheet/alcohol.
• Hawaii did not conduct BRFSS surveillance in 2004 and is not included in the U.S. rate 4 Maternal Obesity and Pregnancy, Medical Perspectives on Prematurity by March of Dimes
for this year. available at http://www.marchofdimes.com/mp/maternalobesity.
Additional perinatal statistics available at marchofdimes.com/peristats April 2009 Page 5
6. Image description. March of Dimes Logo End of image description. Image description. Peristats Logo End of image description.
PeriStats
Your online source for perinatal statistics
Michigan
PERINATAL DATA SNAPSHOTS: Health Insurance and Poverty
Uninsured Women and Children, 2005-2007 Average1-3
Percent
• Among Michigan women ages 15-44, 15.5% (about 1 in 7) were
uninsured compared with 20.1% of women in the U.S. (2005-
2007 average).
• Among Michigan children under age 19, 5.7% (about 1 in 18)
were uninsured compared with 11.5% of children in the U.S.
(2005-2007 average).
• An Institute of Medicine study concluded uninsured women
receive fewer prenatal services and report greater difficulty in
obtaining needed care than women with insurance.
Women Children • Health insurance status is the single most important influence in
(Ages 15-44) (Under Age 19)
determining whether health care is accessible to children when
they need it, according to another Institute of Medicine study.
Michigan US
Medicaid Enrollment and Expenditures, Michigan, 20044, 5
Percent
• Medicaid is a major public source of financing health care
services provided to pregnant women, infants and children.
• While women ages 19-44 and children in Michigan made up
almost 69% of Medicaid enrollees in 2004, they accounted for
only 35% of all Medicaid spending.
• In Michigan, 33.0% of all live births were funded by Medicaid in
Enrollment Expenditures 2002.
(Total= 2 Million) (Total= $7 Billion)
Disabled Adults or All Children Women 19-44 (non
Elderly disabled)
Other
Poverty, 2005-2007 Average1
Percent
• Persons in poverty are defined as those who make less than
100% of the poverty threshold established by the US Census
Bureau. The poverty threshold for a family of three was $15,577
in 2005, $16,079 in 2006, and $16,530 in 2007.
• About 1 in 7 women ages 15-44 in Michigan (15.1%) lived in
families with incomes below the poverty threshold (2005-2007
average) compared to 15.1% in the U.S.
• About 1 in 6 children under age 19 in Michigan (16.3%) lived in
Women Children families with incomes below the poverty threshold (2005-2007
average) compared to 17.0% in the U.S.
(Ages 15-44) (Under Age 19)
Michigan US
Footnotes Sources
• The federal poverty thresholds shown here are used by the U.S. Census Bureau for 1 US Census Bureau. Data prepared for the March of Dimes using the Current Population
statistical purposes. They differ from the federal poverty guidelines used to determine Survey Annual Social and Economic Supplements (2005-2007 Average).
an individual’s eligibility for Medicaid and S-CHIP. The federal poverty guidelines used 2 Institute of Medicine. 2002. Health Insurance Is a Family Matter. National Academy Press,
for these programs can be found at http://aspe.hhs.gov/poverty/index.shtml. Washington, D.C.
• Medicaid enrollment and expenditure percentages may not total 100 percent due to 3 Institute of Medicine. 1998. America's Children: Health Insurance and Access to Care.
rounding. National Academy Press, Washington, D.C.
4 Centers for Medicare and Medicaid Services, MSIS Statistical Report for Federal Fiscal
Year (2004). Data prepared by March of Dimes.
5 Data collected by the National Governors Association, December 2005 - February 2006.
Additional perinatal statistics available at marchofdimes.com/peristats April 2009 Page 6