SlideShare a Scribd company logo
1 of 8
Download to read offline
Second Quarter 2005 July 27, 2005
100 Crescent Court, Suite 400 • Dallas, Texas 75201• (214)871-6720 • (214)871-6713 Fax
FY04 Apr-05 May-05 Jun-05 2Q05 YTD05
WRHE Gross 27.1% -0.9% 1.3% 4.0% 4.4% 0.4%
WRHE Class A, Net1
20.5% -0.8% 0.9% 3.1% 3.2% -0.3%
WRHE Class B, Net1
21.2% -0.8% 1.0% 3.2% 3.3% -0.3%
S&P 500 9.0% -2.0% 3.0% 0.0% 0.9% -1.6%
NASDAQ Composite 8.7% -3.9% 7.6% -0.5% 2.9% -5.5%
1
Class A shares are subject to a one year lockup and a 20% performance fee; Class B shares are subject to a three year lockup and a 17% performance fee.
Don’t Confuse an Opportunity with a Strategy
Dear Partners:
For the second quarter, Western Reserve Hedged Equity (WRHE) gained 3% net of all fees and
expenses and stands even through the first half of 2005. The broader averages all lost ground
through the first half of the year, with the growthier NASDAQ down almost 6%. WRHE’s
trailing twelve-month return stands at a profit of 17% net v. the S&P’s 4% gain and the
NASDAQ’s flat showing. Since our January 2004 inception, Western Reserve has returned a
profit of 20% net v. the S&P 500’s 7% advance and the NASDAQ’s 3% gain. On balance,
WRHE continues to deliver upon our long-term goal of ’twice the return for half the risk’ and in
an environment rather hostile to our growth and services strategy. We think better times lie
ahead for growth style investing and the first half was merely a prelude to a better second half.
The fund closed the second quarter invested roughly 160% gross, including 106% long and 56%
short. WRHE stays fully invested in our hedged strategy regardless of market conditions or
whether our style is in-favor or not. Through the first half of 2005, the fund’s average long
position has outperformed the average short position on a dollar equal basis by over 2-to-1. In
2004, the fund’s longs outperformed shorts by almost 3-to-1 on a dollar equal basis. So, the
research team continues to deliver alpha both long and short. Thus far, 2005 feels like much of
2004, and we believe the fund is equally well positioned to leverage our research strengths.
The Federal Reserve’s open market committee has continued to weigh upon the stock market for
a rather extended fifteen months, and they seem quite content to do so for at least a few more.
However, one might sense they are rounding third at this point. A protracted Fed overhang is
July 27, 2005
agonizing to investors, causes conventional trade flows to slow and creates inefficiencies in
stocks and stock groups as it stretches out. Inefficiency, of course, is good for fundamental-
based strategies such as ours, yet patience and persistence are required. On balance, the Fed
seems to be doing their part to keep the research team excited about long and short ideas
contemporaneously.
Investors largely have parked their capital in cyclical and defensive sectors like materials, hard
assets, healthcare and real estate, wishing to avoid “fighting the Fed.” Because of the extended
duration of the current tightening, several stock groups have begun to exhibit their own mini
bubbles in our view. Conversely, secular services areas like information technology and
financial services have become materially under-invested and trade at highly attractive Fed-
aversion valuations. The momentum crowd is nowhere near these stocks, and we are loaded-up
long as a result.
Value Bubble?
The current market tenets appear similar to 1995 and 2000. With the Fed nearing the end of a
tightening cycle, momentum players have crowded into and overpriced the early-stage economic
beneficiaries of this economic cycle. While cyclical (product) technology dominated between
1998 and early 2000, more traditional cyclicals like materials and industrials have dominated the
current period, thus creating a type of conventional value stock bubble. We see an oxymoron at
play where conventional value trades at growth valuations and growth trades at value multiples.
A clear momentum mentality among analysts and investors is present inside of conventional
value sectors like commodities, real estate, utilities, and industrials & manufacturing. Like their
cyclical technology predecessors of 1999, the current cyclical leaders have the worrisome
combination of high valuations concurrent with potentially peak margins and earnings. Perhaps
because investors believe that these businesses will experience a longer cycle or are now
magically quality businesses, the old adage of applying high P/E multiples to cyclically low
margins and earnings and low P/E’s to peak economics has been set aside. Such was the case for
semiconductors and telecommunications equipment in 1999. We suspect the current valuation
paradox has more to do with increased momentum investing strategies being employed. And it
seems the majority of money managers, value and growth alike, are all bullish on the same
stocks. This is a dangerous combination.
At a recent investor meeting we attended, a roofing supply distribution company stated that they
believed they were in a “secular growth cycle” for roofing. The use of the term “secular” struck
us, but in connection with the term “growth,” astonished us. Many technology product firms
said similar things in 2000. Didn’t Cisco guide to 50% growth forever? This particular roofing
supply company’s stock trades at over 25x, nearly 2x the market multiple, yet with perilously
thin 2% operating margins. Their guidance of double digit earnings growth comes as a result of
rapid fire acquisitions, accretive only through the magic of GAAP’s purchase accounting
treatment, where acquisition costs are evergreened to the balance sheet and ignored on the
income statement. Twenty-five times accounting juiced earnings is ridiculous for roofing
100 Crescent Court, Suite 400 • Dallas, Texas 75201• (214)871-6720 • (214)871-6713 Fax
July 27, 2005
supplies at 2% margins even if one did buy into the notion that construction was leading a new
paradigm of secular growth. We’re not terribly keen on new paradigms. The investor meeting
was for growth stock managers by the way. Growth roofers? Growth multiple for sure!
On a recent research trip through the Midwest, we met with several so-called “growth cyclical”
companies. We found most management teams to be quite sanguine about peaking margins and
fading earnings growth. Yet we wondered why we weren’t hearing this from Wall Street. Are
the folks bidding-up these stocks not talking to the management teams? The P/E multiples
afforded companies making bolts, wing nuts, tool belts and crowbars in businesses with margins
well under 10% are astonishing to us. There were “pick and axe” stocks in the Internet bubble,
too. Corning Glass comes to mind.
One might note that we have increased our short portfolio in the industrial space. We believe we
are still early and expect more to come. A cursory review of the following table may surprise
some as to how expensive these lower quality businesses have become. It’s a conventional value
bubble in our view.
Select “Growth Cyclical” Stocks as of June 30:
2005E
P/E
Growth
Rate
LTM
Growth
Rate
NTM
Growth
From
Acquisitions
Operating
Margin
Historic
Margin Peak-
to-Trough
BECN (roofing) 25x 25% 12% >75% 2% unknown
WSO (HVAC equipment) 22x 23% 14% >75% 4% 4% to 2%
FAST (screws and bolts) 28x 23% 16% 0% 11% 11% to 8%
RBA (yellow iron auctions) 33x 21% 15% 0% 21% 21% to 11%
ITW (bolts, plastics etc.) 17x 13% 10% >75% 11% 11% to 8%
LFUS (fuses) 27x Negative N/A >75% 7% 8% to 2%
MSM (machine tools) 18x 37% 16% >50% 9% 9% to 4%
AXE (cables and wires) 18x 25% 16% >75% 2% 2% to 1%
*Western Reserve estimates
Contemporaneous with evidence of a potential value stock bubble, leveraged buyout funds
(LBO’s) have made a big comeback lately as well. LBO funds are raising capital with as much
ease as their venture capital counterparts during the tech stock bubble in the late 90’s. If we had
any latent doubts about our value bubble thesis, the Chinese coming after domestic value icons
like Maytag (washers and dryers) and Unocal (gasoline) erased such doubt. To be sure, timing
is a significant risk; however, managing this risk is part of our core competency with the aide of
our proprietary loss mitigation program.
100 Crescent Court, Suite 400 • Dallas, Texas 75201• (214)871-6720 • (214)871-6713 Fax
July 27, 2005
Stock Compensation Vigils on Wall Street
A sigh of relief was felt across parts of Wall Street several weeks ago when the Financial
Accounting Standards Board (FASB) again delayed the mandatory implementation date for their
Statement 123, which requires companies to expense stock options. One sell-side analyst
actually upgraded a stock we are short based on the delay, as if the company had received an
eleventh-hour stay of execution. For researchers like us, it’s easy to spot the companies most
negatively exposed to FAS 123 adoption risk – they are the ones who continue to delay adoption.
Western Reserve’s research team is not as focused on GAAP as we are on cash flow, and thus
the FAS 123 debate is of little interest to us per se. However, the real cash flow dilution
resulting from stock-based compensation is of significant importance to our cash flow versus
earnings estimates and valuation models therein. The “blind-eye” of Wall Street on this issue
(and the attempts by Congress to block expensing for that matter) does not alter the economic
dilution of diverting cash-based compensation for employees into stock. We believe Wall Street
analysts haven’t done enough constructive analysis on the impact of options on cash flow. For
some firms with high levels of employee stock options, one must analyze the entire cash flow
statement to understand the materially dilutive impact to free cash flow. If the cash flow analysis
stops at the operating line, then one is living a potentially large lie when analyzing some
companies.
And as it relates to FAS 123, many companies, with material GAAP expensing hits to earnings,
appear to have “altered” their discounting assumptions. The result has been to effectively dilute
the impact of FAS 123 ahead of implementation next year. The most common trick is to lower
the volatility assumption in the model used to value the options, and we have identified several
companies that have employed such trickery.
Of equal concern is the underlying cash flow dilution to shareholders that has arisen via
managements’ solution to the issue of highly dilutive ‘share creep’ as options vest. To fight off
share dilution as stock options have begun to vest, many companies have been buying stock in
the open market. While ostensibly a valiant show of support for their company, this action has
been under-investigated by analysts and seriously detrimental to free cash flow per share for
shareholders.
We intend to focus on such issues more in the coming months and simply wanted to highlight a
few of the topics of importance to our fundamental research effort. Meanwhile, we will leave
you with a few specific examples of firms with material stock-based compensation overhang.
100 Crescent Court, Suite 400 • Dallas, Texas 75201• (214)871-6720 • (214)871-6713 Fax
July 27, 2005
Select Estimated Valuation & Cash Flow Impact from Stock-based Compensation Dilution
2005E P/E
GAAP
2005E SFAS
123 adjusted
P/E**
LTM
Cash Flow***
to Net Income
LTM P/Cash
Flow**
ABCO 35x 57x Negative Negative
EXBD 44x 65x 115% 38x
ACN 15x 20x Negative Negative
SAPE 28x 70x Negative Negative
CSGP 72x Negative Negative Negative
FORR 28x 50x 50% 65x
AMZN 57x Negative Negative Negative
*
Western Reserve estimates
**
Reported net income less estimated options expense per FAS 123.
***
Reported net income plus depreciation, deferred taxes, and net change in deferred revenue less net change in
client/membership fee receivables, deferred incentive compensation, CapEx, and purchase of treasury stock.
“Strategy” vs. “Opportunity”
“Strategy” for us comes down to identifying fundamental long-term growth themes that are
undervalued and underappreciated by the stock market. Chasing steel prices, guessing what the
Chinese might do, or playing the momentum of roofing contractor roll-up stocks does not enter
into our definition of strategy. Such “opportunities” lack long-term potential and are far from
cheap, thus creating a risk/reward imbalance.
But what of credit default swaps or collateralized debt obligations? These two concepts have
terrific long-term growth potential, are key drivers of liquidity in our increasingly efficient
economy, and lack broad-based investor sponsorship. As such, the stocks of the companies
investing in real estate debt securities are trading for a song.
One might consider WRHE’s exposure to real estate services unusually high for a growth
manager. Notably, however, the portfolio has zero exposure to traditional equity REITs. We
feel that some of the most widely inefficient pricings in some time can be found in real estate
equity securities at present. Accordingly, we are long several high quality specialty REITs that
invest in real estate debt securities versus the more common (and we believe overvalued)
traditional equity REITs. Our portfolio companies are investing at lower risk, higher up in the
capital structure and offer twice the yields offered by the underlying equity REIT. Like any
REIT, these specialty debt REITs pass along the majority of their cash flows to investors in the
form of dividends to shareholders. Yet given the current expensive valuation levels of traditional
equity REITs, their pass through dividend is much lower than the undervalued debt equivalents
your fund is long. The following data may surprise you…
100 Crescent Court, Suite 400 • Dallas, Texas 75201• (214)871-6720 • (214)871-6713 Fax
July 27, 2005
As of June 30, 2005:
2006E
Dividend
Yield
Dividend
Growth
Rate Price/Book
Price-to-yield
7%
Upside at 7%
Yield
Western Reserve Longs:
KFN ($25) 12.0% 50% 1.2x $43 72%
DFR ($19) 14.0% 75% 1.2x $36 89%
NRF ($11) 9.0% 105% 1.6x $14.50 36%
Private A @cost >12.0% >100% 1.1x 80%
Private B @cost >10.0% >70% 1.1x 70%
Private C @cost >10.0% >80% 1.1x 70%
Debt REIT Peers:
SFI ($42) 7.0% 8% 1.8x $42 0%
ABR ($28) 8.0% 15% 1.8x $32 12%
GKK ($25) 8.0% 25% 1.7x $28 12%
RAS 8.4% 7% 1.4x $35 20%
Traditional Equity REITs:
VNO ($79) 4.5% 0% 2.8x $55 -30%
EOP ($34) 5.8% -3% 1.5x $31 -10%
MLS ($59) 4.9% 10% 6.5x $41 -30%
GGP ($40) 5.3% 10% 4.5x $30 -20%
SPG ($72) 4.4% 8% 4.8x $45 -30%
NAREIT 4.5% <5% 3.3x -30%
10 Year Treas. Note 3.9%
* Western Reserve estimates
While the fund is not yet short traditional equity REITS, we do expect a good short entry point to
develop in time as this mini bubble builds.
Traditional equity REITs have appreciated materially over the past few years as long-term
interest rates have fallen. It’s worth noting that FFO and dividend growth for equity REITs have
been stagnant in this economic expansion and virtually all of the gains in equity REITs have
come courtesy of valuation expansion. Such valuation-only advances in price usually end badly
for investors stepping in at the wrong time. The conventional yield spread between equity
REITS and the “riskless” rate offered on 10-year Treasury notes runs about 200 to 300 basis
points. Currently, equity REITs offer a mere 50-60 basis point spread. We would expect a 25%-
30% correction at some point in the future and are waiting for the LBO players to back away,
thereby cooling down private market bids and presenting us with a list of short candidates in the
group.
100 Crescent Court, Suite 400 • Dallas, Texas 75201• (214)871-6720 • (214)871-6713 Fax
July 27, 2005
REIT Debt and Equity Securities
Rank-Order
by Risk Un Levered Yield
Underwritten
LTV
Type of
Investment
A-notes 5% 60% Banks
B-notes 7%-8% 70% Debt REIT
Mezzanine 10%-11% 80% Debt REIT
Equity 4%-5% 100% Equity REIT
*Western Reserve estimates
Similar to 2004, the first half of 2005 has given us plenty of opportunity to upgrade the portfolio
due to the short-term trading orientation of the tape and the growing cyclical and conventional
value stock frenzy. As one hedge fund-of-funds manager said to us, some managers seem to be
willing to “whip it around” out there. And that’s where this quarter’s adage comes from – don’t
confuse an opportunity with a strategy.
As we have often noted, Western Reserve’s investment strategy never strays. We pride
ourselves on the consistency and fundamental logic of our investment program. The market may
swing to extremes like the value bubble today and the tech bubble in 1999, but we keep our nose
to the grindstone and repeat our investment program. The market offers various and sundry
“opportunities” from time to time, but timing opportunities is precarious at best, and market
timing always a great risk. Many see commodities, roll-ups, cyclicals and traditional property
REITs as great trading opportunities at present. And they have lots of company. But, we view
the investing landscape more consistently and simplistically – apply what our experience has
taught us works cycle-in and cycle-out and never confuse an opportunity with an investment
strategy.
Regards,
Michael P. Durante
Managing Partner
100 Crescent Court, Suite 400 • Dallas, Texas 75201• (214)871-6720 • (214)871-6713 Fax
July 27, 2005
Long
Short
Total (Gross)
Total Class A (Net)2
Total Class B (Net)2
Long
Short
Total (Gross)
Total Class A (Net)2
Total Class B (Net)2
Jan-05 Feb-05 Mar-05 Apr-05 May-05 Jun-05 YTD
WRHE Gross 0.4% -1.9% -2.3% -0.9% 1.3% 4.0% 0.4%
WRHE Class A Net 0.2% -1.6% -2.0% -0.8% 0.9% 3.1% -0.3%
WRHE Class B Net 0.3% -1.7% -2.1% -0.8% 1.0% 3.2% -0.3%
S&P 500 -2.5% 1.9% -1.9% -2.0% 3.0% 0.0% -1.6%
NASDAQ -5.2% -0.5% -2.6% -3.9% 7.6% -0.5% -5.5%
Jun-05 May-05 Apr-05 Mar-05 Feb-05 Jan-05 Dec-04 Nov-04 Oct-04 Sep-04 Aug-04 Jul-04 TTM
Inception
To Date3
WRHE Gross 4.0% 1.3% -0.9% -2.3% -1.9% 0.4% 7.8% 7.7% 2.7% 4.6% 0.6% -2.1% 23.2% 27.6%
WRHE Class A Net 3.1% 0.9% -0.8% -2.0% -1.6% 0.2% 6.1% 6.0% 2.0% 3.6% 0.4% -1.8% 17.3% 19.6%
WRHE Class B Net 3.2% 1.0% -0.8% -2.1% -1.7% 0.3% 6.3% 6.3% 2.1% 3.7% 0.4% -1.9% 18.0% 20.3%
S&P 500 0.0% 3.0% -2.0% -1.9% 1.9% -2.5% 3.3% 3.9% 1.4% 0.9% 0.2% -3.4% 4.5% 7.2%
NASDAQ -0.5% 7.6% -3.9% -2.6% -0.5% -5.2% 3.8% 6.2% 4.1% 3.2% -2.6% -7.8% 0.5% 2.7%
Sector Long Short Gross Net
Business Services 12% 3% 15% 10% Capital One Financial Long
Consumer 1% 9% 10% -8% Comstock Homebuilding
Financial Institutions 23% 3% 27% 20% Alliance Data Systems
Financial Services 22% 9% 31% 12% Euronet Worldwide
Healthcare 2% 1% 3% 1% MBNA
Industrial 2% 12% 14% -11%
Technology 8% 10% 17% -2%
Technology Services 16% 8% 24% 8% Long Short
Real Estate 20% 0% 20% 20% Top 5 24.1% 9.9%
106% 56% 162% 50% 37.3% 18.4%
Summary for the Quarter Ended
June 30, 2005
Western Reserve Hedged Equity, LP
Quarter Ended
June 30, 2005
Positions1
Performance Ending Exposure1
54 6.8% 106%
37 -2.4% 56%
91 4.4% 162%
3.2% 50%
3.3% 50%
Trailing Twelve Months (TTM)
Performance Average Exposure1
29.1% 95%
-5.3% 47%
23.2% 141%
17.3% 48%
18.0% 48%
Year to Date Comparative Returns2
Trailing Twelve Months Comparative Returns2
Composition by Sector (% of Capital) Key Positions
Chicago Mercantile JDA Software
Top 5 Winners YTD
Short
MBNA eSpeed
Percent of Capital
Largest Long Positions
Top 10 Positions
SI International Jack in the Box
Trammell Crow Zebra Technologies
Compucredit Superior Industries
Western Reserve Hedged Equity, LP
Cumulative Performance Since Inception (Gross)
-9%
-5%
-1%
4%
8%
12%
16%
20%
24%
28%
D
ec
Jan
Feb
M
ar
Apr
M
ay
Jun
Jul
Aug
Sep
O
ct
N
ov
D
ec
Jan
Feb
M
ar
Apr
M
ay
Jun
Western Reserve
S&P 500
NASDAQ
1
Freely tradable securities. Immaterial position sizes omitted.
2
Class A shares are subject to a one year lock-up and a 20% performance fee; Class B shares are subject to a three year lock-up and a 17% performance fee.
3
Western Reserve Hedged Equity, LP's inception date is January 1, 2004.
Please be advised that the past performance of Western Reserve Hedged Equity, LP (the “Fund) is not necessarily indicative of future results. Depending on the timing of a
person’s investment in one of the Funds, actual investment returns in the Fund may vary from the returns stated herein. Performance results are estimated, based on both audited
and unaudited results, net of management and performance fees and operating expenses. Such performance results assume that a partner invested in the Fund at the inception of
the Fund and has not made additional contributions or withdrawals. There is no assurance that at any time the securities held by the Fund will be securities which comprise any of
the indices listed above, and the Fund may have substantial cash balances and investments in relatively illiquid securities at any time when compared to the securities comprising a
listed index. This report is provided for informational purposes only and is not authorized for use as an offer of sale or a solicitation of an offer to purchase investments in the Fund
or any affiliated entity. This report is qualified in its entirety by the more complete information contained in the Fund’s Confidential Private Placement Memorandum and related
subscription materials. This report is confidential and may not be reproduced for any purpose. Western Reserve Capital Management, LP serves as the Fund’s investment
manager. Its Form ADV Part II and Privacy Policy are available to investors upon request.
100 Crescent Court, Suite 400 • Dallas, Texas 75201• (214)871-6720 • (214)871-6713 Fax

More Related Content

What's hot

Portfolio Risk Management And Suitability PowerPoint Presentation Slides
Portfolio Risk Management And Suitability PowerPoint Presentation Slides Portfolio Risk Management And Suitability PowerPoint Presentation Slides
Portfolio Risk Management And Suitability PowerPoint Presentation Slides SlideTeam
 
Athens Stock Exchange 1996-2014: An alternative approach
Athens Stock Exchange 1996-2014: An alternative approachAthens Stock Exchange 1996-2014: An alternative approach
Athens Stock Exchange 1996-2014: An alternative approachIlias Lekkos
 
Asset allocation facts_and_fiction_v03
Asset allocation facts_and_fiction_v03Asset allocation facts_and_fiction_v03
Asset allocation facts_and_fiction_v03Wesley Gray
 
Dynamic Factor Rotation
Dynamic Factor RotationDynamic Factor Rotation
Dynamic Factor RotationIlan Gleiser
 
Combining the Best Stock Selection Factors by Patrick O'Shaughnessy at QuantC...
Combining the Best Stock Selection Factors by Patrick O'Shaughnessy at QuantC...Combining the Best Stock Selection Factors by Patrick O'Shaughnessy at QuantC...
Combining the Best Stock Selection Factors by Patrick O'Shaughnessy at QuantC...Quantopian
 
Why Pillar Capital (Investment approach)
Why Pillar Capital (Investment approach)Why Pillar Capital (Investment approach)
Why Pillar Capital (Investment approach)Michael Johnson
 
Investment – risk & return
Investment – risk & returnInvestment – risk & return
Investment – risk & returnRakesh K.G.
 
Trading Strategies Based on Market Impact of Macroeconomic Announcements by A...
Trading Strategies Based on Market Impact of Macroeconomic Announcementsby A...Trading Strategies Based on Market Impact of Macroeconomic Announcementsby A...
Trading Strategies Based on Market Impact of Macroeconomic Announcements by A...Quantopian
 
AlternativeEdgeSnapshot-CTA-Perf-H1-2014
AlternativeEdgeSnapshot-CTA-Perf-H1-2014AlternativeEdgeSnapshot-CTA-Perf-H1-2014
AlternativeEdgeSnapshot-CTA-Perf-H1-2014Walter Estlander
 
"Is Momentum Still Relevant for Today’s Markets?" by Anthony Ng, Senior Lecturer
"Is Momentum Still Relevant for Today’s Markets?" by Anthony Ng, Senior Lecturer"Is Momentum Still Relevant for Today’s Markets?" by Anthony Ng, Senior Lecturer
"Is Momentum Still Relevant for Today’s Markets?" by Anthony Ng, Senior LecturerQuantopian
 
Competition and Bias by Harrison Hong and Marcin Kacperczyk
Competition and Bias by Harrison Hong and Marcin KacperczykCompetition and Bias by Harrison Hong and Marcin Kacperczyk
Competition and Bias by Harrison Hong and Marcin KacperczykMichael-Paul James
 

What's hot (19)

Portfolio Risk Management And Suitability PowerPoint Presentation Slides
Portfolio Risk Management And Suitability PowerPoint Presentation Slides Portfolio Risk Management And Suitability PowerPoint Presentation Slides
Portfolio Risk Management And Suitability PowerPoint Presentation Slides
 
Athens Stock Exchange 1996-2014: An alternative approach
Athens Stock Exchange 1996-2014: An alternative approachAthens Stock Exchange 1996-2014: An alternative approach
Athens Stock Exchange 1996-2014: An alternative approach
 
Asset allocation facts_and_fiction_v03
Asset allocation facts_and_fiction_v03Asset allocation facts_and_fiction_v03
Asset allocation facts_and_fiction_v03
 
Dynamic Factor Rotation
Dynamic Factor RotationDynamic Factor Rotation
Dynamic Factor Rotation
 
The Power of Economic Science 2012
The Power of Economic Science 2012The Power of Economic Science 2012
The Power of Economic Science 2012
 
The Power of Economic Science
The Power of Economic ScienceThe Power of Economic Science
The Power of Economic Science
 
Combining the Best Stock Selection Factors by Patrick O'Shaughnessy at QuantC...
Combining the Best Stock Selection Factors by Patrick O'Shaughnessy at QuantC...Combining the Best Stock Selection Factors by Patrick O'Shaughnessy at QuantC...
Combining the Best Stock Selection Factors by Patrick O'Shaughnessy at QuantC...
 
Size and value effects for stocks thru 2009
Size and value effects for stocks thru 2009Size and value effects for stocks thru 2009
Size and value effects for stocks thru 2009
 
Why Pillar Capital (Investment approach)
Why Pillar Capital (Investment approach)Why Pillar Capital (Investment approach)
Why Pillar Capital (Investment approach)
 
Investment – risk & return
Investment – risk & returnInvestment – risk & return
Investment – risk & return
 
Intermarket analysis
Intermarket  analysisIntermarket  analysis
Intermarket analysis
 
Trading Strategies Based on Market Impact of Macroeconomic Announcements by A...
Trading Strategies Based on Market Impact of Macroeconomic Announcementsby A...Trading Strategies Based on Market Impact of Macroeconomic Announcementsby A...
Trading Strategies Based on Market Impact of Macroeconomic Announcements by A...
 
AlternativeEdgeSnapshot-CTA-Perf-H1-2014
AlternativeEdgeSnapshot-CTA-Perf-H1-2014AlternativeEdgeSnapshot-CTA-Perf-H1-2014
AlternativeEdgeSnapshot-CTA-Perf-H1-2014
 
"Is Momentum Still Relevant for Today’s Markets?" by Anthony Ng, Senior Lecturer
"Is Momentum Still Relevant for Today’s Markets?" by Anthony Ng, Senior Lecturer"Is Momentum Still Relevant for Today’s Markets?" by Anthony Ng, Senior Lecturer
"Is Momentum Still Relevant for Today’s Markets?" by Anthony Ng, Senior Lecturer
 
Competition and Bias by Harrison Hong and Marcin Kacperczyk
Competition and Bias by Harrison Hong and Marcin KacperczykCompetition and Bias by Harrison Hong and Marcin Kacperczyk
Competition and Bias by Harrison Hong and Marcin Kacperczyk
 
Global Economics Update - August 2015
Global Economics Update - August 2015Global Economics Update - August 2015
Global Economics Update - August 2015
 
3946545
39465453946545
3946545
 
Global Economics Update - November 2014
Global Economics Update - November 2014Global Economics Update - November 2014
Global Economics Update - November 2014
 
My publication
My publicationMy publication
My publication
 

Viewers also liked

When to stop TKI in Chronic Myelogenous Leukemia?
When to stop TKI in Chronic Myelogenous Leukemia?When to stop TKI in Chronic Myelogenous Leukemia?
When to stop TKI in Chronic Myelogenous Leukemia?spa718
 
8000 0830 kian aan gap overview
8000 0830 kian aan gap overview8000 0830 kian aan gap overview
8000 0830 kian aan gap overviewspa718
 
POST TRANSPLANT THERAPY FOR AML: Marcos Delima
POST TRANSPLANT THERAPY FOR AML: Marcos DelimaPOST TRANSPLANT THERAPY FOR AML: Marcos Delima
POST TRANSPLANT THERAPY FOR AML: Marcos Delimaspa718
 
1 orlowski targeted-therapies
1 orlowski targeted-therapies1 orlowski targeted-therapies
1 orlowski targeted-therapiesspa718
 
5 huang yihong
5 huang yihong5 huang yihong
5 huang yihongspa718
 
Jakub Dąbkowski - Kto u mnie kupuje, a kto nie kupuje i dlaczego? Automatyzac...
Jakub Dąbkowski - Kto u mnie kupuje, a kto nie kupuje i dlaczego? Automatyzac...Jakub Dąbkowski - Kto u mnie kupuje, a kto nie kupuje i dlaczego? Automatyzac...
Jakub Dąbkowski - Kto u mnie kupuje, a kto nie kupuje i dlaczego? Automatyzac...#e-biznes festiwal
 
Nikola gulev-2014.eng
Nikola gulev-2014.engNikola gulev-2014.eng
Nikola gulev-2014.engSim Aleksiev
 
Michael Durante EBITDA Shortcomings
Michael Durante EBITDA ShortcomingsMichael Durante EBITDA Shortcomings
Michael Durante EBITDA ShortcomingsMichael Durante
 
Organisationalconflict
OrganisationalconflictOrganisationalconflict
OrganisationalconflictRahul Shinde
 
New deal and wwii
New deal and wwiiNew deal and wwii
New deal and wwiitcshistory
 
9 stephen mulligan
9 stephen mulligan9 stephen mulligan
9 stephen mulliganspa718
 
Команда единомышленников- создаем сайт доу
Команда единомышленников- создаем сайт доуКоманда единомышленников- создаем сайт доу
Команда единомышленников- создаем сайт доуSvetlana Pyshkova
 
Imatinib vs. 2nd gen TKI in newly diagnosed Chronic Myelogenous Leukemia 
Imatinib vs. 2nd gen TKI in newly diagnosed Chronic Myelogenous Leukemia Imatinib vs. 2nd gen TKI in newly diagnosed Chronic Myelogenous Leukemia 
Imatinib vs. 2nd gen TKI in newly diagnosed Chronic Myelogenous Leukemia spa718
 
Slide show intro
Slide show introSlide show intro
Slide show introkpitman22
 

Viewers also liked (20)

childrens act
childrens actchildrens act
childrens act
 
When to stop TKI in Chronic Myelogenous Leukemia?
When to stop TKI in Chronic Myelogenous Leukemia?When to stop TKI in Chronic Myelogenous Leukemia?
When to stop TKI in Chronic Myelogenous Leukemia?
 
Atomic structore
Atomic structoreAtomic structore
Atomic structore
 
Stage 1 Vocab
Stage 1 Vocab Stage 1 Vocab
Stage 1 Vocab
 
8000 0830 kian aan gap overview
8000 0830 kian aan gap overview8000 0830 kian aan gap overview
8000 0830 kian aan gap overview
 
POST TRANSPLANT THERAPY FOR AML: Marcos Delima
POST TRANSPLANT THERAPY FOR AML: Marcos DelimaPOST TRANSPLANT THERAPY FOR AML: Marcos Delima
POST TRANSPLANT THERAPY FOR AML: Marcos Delima
 
1 orlowski targeted-therapies
1 orlowski targeted-therapies1 orlowski targeted-therapies
1 orlowski targeted-therapies
 
ACE FORKLIFT
ACE FORKLIFTACE FORKLIFT
ACE FORKLIFT
 
Las vegas convention photographer
Las vegas convention photographerLas vegas convention photographer
Las vegas convention photographer
 
5 huang yihong
5 huang yihong5 huang yihong
5 huang yihong
 
Jakub Dąbkowski - Kto u mnie kupuje, a kto nie kupuje i dlaczego? Automatyzac...
Jakub Dąbkowski - Kto u mnie kupuje, a kto nie kupuje i dlaczego? Automatyzac...Jakub Dąbkowski - Kto u mnie kupuje, a kto nie kupuje i dlaczego? Automatyzac...
Jakub Dąbkowski - Kto u mnie kupuje, a kto nie kupuje i dlaczego? Automatyzac...
 
Nikola gulev-2014.eng
Nikola gulev-2014.engNikola gulev-2014.eng
Nikola gulev-2014.eng
 
Michael Durante EBITDA Shortcomings
Michael Durante EBITDA ShortcomingsMichael Durante EBITDA Shortcomings
Michael Durante EBITDA Shortcomings
 
Organisationalconflict
OrganisationalconflictOrganisationalconflict
Organisationalconflict
 
New deal and wwii
New deal and wwiiNew deal and wwii
New deal and wwii
 
9 stephen mulligan
9 stephen mulligan9 stephen mulligan
9 stephen mulligan
 
Команда единомышленников- создаем сайт доу
Команда единомышленников- создаем сайт доуКоманда единомышленников- создаем сайт доу
Команда единомышленников- создаем сайт доу
 
Imatinib vs. 2nd gen TKI in newly diagnosed Chronic Myelogenous Leukemia 
Imatinib vs. 2nd gen TKI in newly diagnosed Chronic Myelogenous Leukemia Imatinib vs. 2nd gen TKI in newly diagnosed Chronic Myelogenous Leukemia 
Imatinib vs. 2nd gen TKI in newly diagnosed Chronic Myelogenous Leukemia 
 
Wyzwania content marketingu
Wyzwania content marketinguWyzwania content marketingu
Wyzwania content marketingu
 
Slide show intro
Slide show introSlide show intro
Slide show intro
 

Similar to Michael Durante Western Reserve 2Q05 letter

Michael Durante Western Reserve 1Q05
Michael Durante Western Reserve 1Q05Michael Durante Western Reserve 1Q05
Michael Durante Western Reserve 1Q05Michael Durante
 
Michael Durante Western Reserve 1Q07
Michael Durante Western Reserve 1Q07Michael Durante Western Reserve 1Q07
Michael Durante Western Reserve 1Q07Michael Durante
 
Michael Durante Western Reserve 4Q05 letter
Michael Durante Western Reserve 4Q05 letterMichael Durante Western Reserve 4Q05 letter
Michael Durante Western Reserve 4Q05 letterMichael Durante
 
Michael Durante Western Reserve 3Q05 letter
Michael Durante Western Reserve 3Q05 letterMichael Durante Western Reserve 3Q05 letter
Michael Durante Western Reserve 3Q05 letterMichael Durante
 
Michael Durante Western Reserve 3Q07 letter
Michael Durante Western Reserve 3Q07 letterMichael Durante Western Reserve 3Q07 letter
Michael Durante Western Reserve 3Q07 letterMichael Durante
 
Michael Durante Western Reserve 4Q06 letter
Michael Durante Western Reserve 4Q06 letterMichael Durante Western Reserve 4Q06 letter
Michael Durante Western Reserve 4Q06 letterMichael Durante
 
Edelweiss MF Small Cap Fund
Edelweiss MF Small Cap FundEdelweiss MF Small Cap Fund
Edelweiss MF Small Cap Fundfinis76054
 
BoyarMiller Breakfast Forum: The Current State of the Capital Markets 2010
BoyarMiller Breakfast Forum: The Current State of the Capital Markets 2010BoyarMiller Breakfast Forum: The Current State of the Capital Markets 2010
BoyarMiller Breakfast Forum: The Current State of the Capital Markets 2010BoyarMiller
 
Milwaukee Growth Fund-February Client Meeting Materials
Milwaukee Growth Fund-February Client Meeting MaterialsMilwaukee Growth Fund-February Client Meeting Materials
Milwaukee Growth Fund-February Client Meeting MaterialsAlexander D. Sagal
 
Dotcom bubble and underpricing: conjectures and evidence
Dotcom bubble and underpricing: conjectures and evidenceDotcom bubble and underpricing: conjectures and evidence
Dotcom bubble and underpricing: conjectures and evidenceFGV Brazil
 
Merrill Lynch\'s Valuation
Merrill Lynch\'s ValuationMerrill Lynch\'s Valuation
Merrill Lynch\'s Valuationszrehman
 
DSP Equity Oppotunities Fund
DSP Equity Oppotunities FundDSP Equity Oppotunities Fund
DSP Equity Oppotunities FundDSP Mutual Fund
 
Asset Managers - Recession risks, Trust Banks & Asset Mgrs
Asset Managers - Recession risks, Trust Banks & Asset MgrsAsset Managers - Recession risks, Trust Banks & Asset Mgrs
Asset Managers - Recession risks, Trust Banks & Asset MgrsKevin Cheng, CFA
 
Michael Durante Western Reserve 2Q06 letter
Michael Durante Western Reserve 2Q06 letterMichael Durante Western Reserve 2Q06 letter
Michael Durante Western Reserve 2Q06 letterMichael Durante
 
Michael Durante Western Reserve June 2006 letter
Michael Durante Western Reserve June 2006 letterMichael Durante Western Reserve June 2006 letter
Michael Durante Western Reserve June 2006 letterMichael Durante
 
U_S_PORTFOLIO_STRATEGY_W_102803589
U_S_PORTFOLIO_STRATEGY_W_102803589U_S_PORTFOLIO_STRATEGY_W_102803589
U_S_PORTFOLIO_STRATEGY_W_102803589Barry Knapp
 

Similar to Michael Durante Western Reserve 2Q05 letter (20)

Michael Durante Western Reserve 1Q05
Michael Durante Western Reserve 1Q05Michael Durante Western Reserve 1Q05
Michael Durante Western Reserve 1Q05
 
Michael Durante Western Reserve 1Q07
Michael Durante Western Reserve 1Q07Michael Durante Western Reserve 1Q07
Michael Durante Western Reserve 1Q07
 
Michael Durante Western Reserve 4Q05 letter
Michael Durante Western Reserve 4Q05 letterMichael Durante Western Reserve 4Q05 letter
Michael Durante Western Reserve 4Q05 letter
 
Michael Durante Western Reserve 3Q05 letter
Michael Durante Western Reserve 3Q05 letterMichael Durante Western Reserve 3Q05 letter
Michael Durante Western Reserve 3Q05 letter
 
Michael Durante Western Reserve 3Q07 letter
Michael Durante Western Reserve 3Q07 letterMichael Durante Western Reserve 3Q07 letter
Michael Durante Western Reserve 3Q07 letter
 
Michael Durante Western Reserve 4Q06 letter
Michael Durante Western Reserve 4Q06 letterMichael Durante Western Reserve 4Q06 letter
Michael Durante Western Reserve 4Q06 letter
 
Edelweiss MF Small Cap Fund
Edelweiss MF Small Cap FundEdelweiss MF Small Cap Fund
Edelweiss MF Small Cap Fund
 
Wrhe 4 q2004 letter
Wrhe 4 q2004 letterWrhe 4 q2004 letter
Wrhe 4 q2004 letter
 
BoyarMiller Breakfast Forum: The Current State of the Capital Markets 2010
BoyarMiller Breakfast Forum: The Current State of the Capital Markets 2010BoyarMiller Breakfast Forum: The Current State of the Capital Markets 2010
BoyarMiller Breakfast Forum: The Current State of the Capital Markets 2010
 
Milwaukee Growth Fund-February Client Meeting Materials
Milwaukee Growth Fund-February Client Meeting MaterialsMilwaukee Growth Fund-February Client Meeting Materials
Milwaukee Growth Fund-February Client Meeting Materials
 
Dotcom bubble and underpricing: conjectures and evidence
Dotcom bubble and underpricing: conjectures and evidenceDotcom bubble and underpricing: conjectures and evidence
Dotcom bubble and underpricing: conjectures and evidence
 
Agf market outlook
Agf market outlookAgf market outlook
Agf market outlook
 
Merrill Lynch\'s Valuation
Merrill Lynch\'s ValuationMerrill Lynch\'s Valuation
Merrill Lynch\'s Valuation
 
PMCWeeklyReview_050815
PMCWeeklyReview_050815PMCWeeklyReview_050815
PMCWeeklyReview_050815
 
DSP Equity Oppotunities Fund
DSP Equity Oppotunities FundDSP Equity Oppotunities Fund
DSP Equity Oppotunities Fund
 
Asset Managers - Recession risks, Trust Banks & Asset Mgrs
Asset Managers - Recession risks, Trust Banks & Asset MgrsAsset Managers - Recession risks, Trust Banks & Asset Mgrs
Asset Managers - Recession risks, Trust Banks & Asset Mgrs
 
Michael Durante Western Reserve 2Q06 letter
Michael Durante Western Reserve 2Q06 letterMichael Durante Western Reserve 2Q06 letter
Michael Durante Western Reserve 2Q06 letter
 
Michael Durante Western Reserve June 2006 letter
Michael Durante Western Reserve June 2006 letterMichael Durante Western Reserve June 2006 letter
Michael Durante Western Reserve June 2006 letter
 
1st Quarter 2009 Powerpoint
1st Quarter 2009 Powerpoint1st Quarter 2009 Powerpoint
1st Quarter 2009 Powerpoint
 
U_S_PORTFOLIO_STRATEGY_W_102803589
U_S_PORTFOLIO_STRATEGY_W_102803589U_S_PORTFOLIO_STRATEGY_W_102803589
U_S_PORTFOLIO_STRATEGY_W_102803589
 

More from Michael Durante

Blackwall partners 2 qtr 2016- transient volatility part iii
Blackwall partners  2 qtr 2016- transient volatility part iiiBlackwall partners  2 qtr 2016- transient volatility part iii
Blackwall partners 2 qtr 2016- transient volatility part iiiMichael Durante
 
Michael Durante EBITDA Shortcomings - BlackwallPartners
Michael Durante EBITDA Shortcomings - BlackwallPartnersMichael Durante EBITDA Shortcomings - BlackwallPartners
Michael Durante EBITDA Shortcomings - BlackwallPartnersMichael Durante
 
Valuation Analysis - EBITDA Shortcomings
Valuation Analysis - EBITDA Shortcomings Valuation Analysis - EBITDA Shortcomings
Valuation Analysis - EBITDA Shortcomings Michael Durante
 
Michael Durante Western Reserve March 2011- Camel Race
Michael Durante Western Reserve March 2011- Camel RaceMichael Durante Western Reserve March 2011- Camel Race
Michael Durante Western Reserve March 2011- Camel RaceMichael Durante
 
Michael Durante Western Reserve Blackwall Partners 2011 outlook primer- final
Michael Durante Western Reserve Blackwall Partners   2011 outlook primer- finalMichael Durante Western Reserve Blackwall Partners   2011 outlook primer- final
Michael Durante Western Reserve Blackwall Partners 2011 outlook primer- finalMichael Durante
 
Michael Durante Western Reserve Basel III western reserve- commentary
Michael Durante Western Reserve Basel III   western reserve- commentaryMichael Durante Western Reserve Basel III   western reserve- commentary
Michael Durante Western Reserve Basel III western reserve- commentaryMichael Durante
 
Michael Durante Western Reserve spring 2010 review
Michael Durante Western Reserve  spring 2010 reviewMichael Durante Western Reserve  spring 2010 review
Michael Durante Western Reserve spring 2010 reviewMichael Durante
 
Michael Durante Western Reserve research compilation
Michael Durante Western Reserve  research compilationMichael Durante Western Reserve  research compilation
Michael Durante Western Reserve research compilationMichael Durante
 
Are bean counters to blame
Are bean counters to blameAre bean counters to blame
Are bean counters to blameMichael Durante
 
Study on mark to-market accounting
Study on mark to-market accountingStudy on mark to-market accounting
Study on mark to-market accountingMichael Durante
 
Michael Western Reserve financial reform primer- march 2010
Michael Western Reserve  financial reform primer- march 2010Michael Western Reserve  financial reform primer- march 2010
Michael Western Reserve financial reform primer- march 2010Michael Durante
 
Michael Durante Western Reserve research analysis- camel example
Michael Durante Western Reserve  research analysis- camel exampleMichael Durante Western Reserve  research analysis- camel example
Michael Durante Western Reserve research analysis- camel exampleMichael Durante
 
Michael Western Reserve spring 2010 review
Michael Western Reserve  spring 2010 reviewMichael Western Reserve  spring 2010 review
Michael Western Reserve spring 2010 reviewMichael Durante
 
Michael Durante Western Reserve research compilation
Michael Durante Western Reserve  research compilationMichael Durante Western Reserve  research compilation
Michael Durante Western Reserve research compilationMichael Durante
 
Michael Durante Western Reserve 2009 review and 2010 outlook
Michael Durante Western Reserve  2009 review and 2010 outlookMichael Durante Western Reserve  2009 review and 2010 outlook
Michael Durante Western Reserve 2009 review and 2010 outlookMichael Durante
 
Michael Durante Western Reserve 2009 review and 2010 outlook
Michael Durante Western Reserve  2009 review and 2010 outlookMichael Durante Western Reserve  2009 review and 2010 outlook
Michael Durante Western Reserve 2009 review and 2010 outlookMichael Durante
 
Michael Durante Western Reserve 1Q029 review
Michael Durante Western Reserve  1Q029 reviewMichael Durante Western Reserve  1Q029 review
Michael Durante Western Reserve 1Q029 reviewMichael Durante
 
Michael Durante Western Reserve Q109 update letter
Michael Durante Western Reserve  Q109 update letterMichael Durante Western Reserve  Q109 update letter
Michael Durante Western Reserve Q109 update letterMichael Durante
 
Western reserve q1 2009 client update letter
Western reserve  q1 2009 client update letterWestern reserve  q1 2009 client update letter
Western reserve q1 2009 client update letterMichael Durante
 

More from Michael Durante (20)

Blackwall partners 2 qtr 2016- transient volatility part iii
Blackwall partners  2 qtr 2016- transient volatility part iiiBlackwall partners  2 qtr 2016- transient volatility part iii
Blackwall partners 2 qtr 2016- transient volatility part iii
 
EBITDA Shortcomings
EBITDA ShortcomingsEBITDA Shortcomings
EBITDA Shortcomings
 
Michael Durante EBITDA Shortcomings - BlackwallPartners
Michael Durante EBITDA Shortcomings - BlackwallPartnersMichael Durante EBITDA Shortcomings - BlackwallPartners
Michael Durante EBITDA Shortcomings - BlackwallPartners
 
Valuation Analysis - EBITDA Shortcomings
Valuation Analysis - EBITDA Shortcomings Valuation Analysis - EBITDA Shortcomings
Valuation Analysis - EBITDA Shortcomings
 
Michael Durante Western Reserve March 2011- Camel Race
Michael Durante Western Reserve March 2011- Camel RaceMichael Durante Western Reserve March 2011- Camel Race
Michael Durante Western Reserve March 2011- Camel Race
 
Michael Durante Western Reserve Blackwall Partners 2011 outlook primer- final
Michael Durante Western Reserve Blackwall Partners   2011 outlook primer- finalMichael Durante Western Reserve Blackwall Partners   2011 outlook primer- final
Michael Durante Western Reserve Blackwall Partners 2011 outlook primer- final
 
Michael Durante Western Reserve Basel III western reserve- commentary
Michael Durante Western Reserve Basel III   western reserve- commentaryMichael Durante Western Reserve Basel III   western reserve- commentary
Michael Durante Western Reserve Basel III western reserve- commentary
 
Michael Durante Western Reserve spring 2010 review
Michael Durante Western Reserve  spring 2010 reviewMichael Durante Western Reserve  spring 2010 review
Michael Durante Western Reserve spring 2010 review
 
Michael Durante Western Reserve research compilation
Michael Durante Western Reserve  research compilationMichael Durante Western Reserve  research compilation
Michael Durante Western Reserve research compilation
 
Are bean counters to blame
Are bean counters to blameAre bean counters to blame
Are bean counters to blame
 
Study on mark to-market accounting
Study on mark to-market accountingStudy on mark to-market accounting
Study on mark to-market accounting
 
Michael Western Reserve financial reform primer- march 2010
Michael Western Reserve  financial reform primer- march 2010Michael Western Reserve  financial reform primer- march 2010
Michael Western Reserve financial reform primer- march 2010
 
Michael Durante Western Reserve research analysis- camel example
Michael Durante Western Reserve  research analysis- camel exampleMichael Durante Western Reserve  research analysis- camel example
Michael Durante Western Reserve research analysis- camel example
 
Michael Western Reserve spring 2010 review
Michael Western Reserve  spring 2010 reviewMichael Western Reserve  spring 2010 review
Michael Western Reserve spring 2010 review
 
Michael Durante Western Reserve research compilation
Michael Durante Western Reserve  research compilationMichael Durante Western Reserve  research compilation
Michael Durante Western Reserve research compilation
 
Michael Durante Western Reserve 2009 review and 2010 outlook
Michael Durante Western Reserve  2009 review and 2010 outlookMichael Durante Western Reserve  2009 review and 2010 outlook
Michael Durante Western Reserve 2009 review and 2010 outlook
 
Michael Durante Western Reserve 2009 review and 2010 outlook
Michael Durante Western Reserve  2009 review and 2010 outlookMichael Durante Western Reserve  2009 review and 2010 outlook
Michael Durante Western Reserve 2009 review and 2010 outlook
 
Michael Durante Western Reserve 1Q029 review
Michael Durante Western Reserve  1Q029 reviewMichael Durante Western Reserve  1Q029 review
Michael Durante Western Reserve 1Q029 review
 
Michael Durante Western Reserve Q109 update letter
Michael Durante Western Reserve  Q109 update letterMichael Durante Western Reserve  Q109 update letter
Michael Durante Western Reserve Q109 update letter
 
Western reserve q1 2009 client update letter
Western reserve  q1 2009 client update letterWestern reserve  q1 2009 client update letter
Western reserve q1 2009 client update letter
 

Recently uploaded

Islamabad Escorts | Call 03274100048 | Escort Service in Islamabad
Islamabad Escorts | Call 03274100048 | Escort Service in IslamabadIslamabad Escorts | Call 03274100048 | Escort Service in Islamabad
Islamabad Escorts | Call 03274100048 | Escort Service in IslamabadAyesha Khan
 
NewBase 19 April 2024 Energy News issue - 1717 by Khaled Al Awadi.pdf
NewBase  19 April  2024  Energy News issue - 1717 by Khaled Al Awadi.pdfNewBase  19 April  2024  Energy News issue - 1717 by Khaled Al Awadi.pdf
NewBase 19 April 2024 Energy News issue - 1717 by Khaled Al Awadi.pdfKhaled Al Awadi
 
8447779800, Low rate Call girls in Saket Delhi NCR
8447779800, Low rate Call girls in Saket Delhi NCR8447779800, Low rate Call girls in Saket Delhi NCR
8447779800, Low rate Call girls in Saket Delhi NCRashishs7044
 
India Consumer 2024 Redacted Sample Report
India Consumer 2024 Redacted Sample ReportIndia Consumer 2024 Redacted Sample Report
India Consumer 2024 Redacted Sample ReportMintel Group
 
Lowrate Call Girls In Sector 18 Noida ❤️8860477959 Escorts 100% Genuine Servi...
Lowrate Call Girls In Sector 18 Noida ❤️8860477959 Escorts 100% Genuine Servi...Lowrate Call Girls In Sector 18 Noida ❤️8860477959 Escorts 100% Genuine Servi...
Lowrate Call Girls In Sector 18 Noida ❤️8860477959 Escorts 100% Genuine Servi...lizamodels9
 
/:Call Girls In Indirapuram Ghaziabad ➥9990211544 Independent Best Escorts In...
/:Call Girls In Indirapuram Ghaziabad ➥9990211544 Independent Best Escorts In.../:Call Girls In Indirapuram Ghaziabad ➥9990211544 Independent Best Escorts In...
/:Call Girls In Indirapuram Ghaziabad ➥9990211544 Independent Best Escorts In...lizamodels9
 
Youth Involvement in an Innovative Coconut Value Chain by Mwalimu Menza
Youth Involvement in an Innovative Coconut Value Chain by Mwalimu MenzaYouth Involvement in an Innovative Coconut Value Chain by Mwalimu Menza
Youth Involvement in an Innovative Coconut Value Chain by Mwalimu Menzaictsugar
 
Call Us 📲8800102216📞 Call Girls In DLF City Gurgaon
Call Us 📲8800102216📞 Call Girls In DLF City GurgaonCall Us 📲8800102216📞 Call Girls In DLF City Gurgaon
Call Us 📲8800102216📞 Call Girls In DLF City Gurgaoncallgirls2057
 
RE Capital's Visionary Leadership under Newman Leech
RE Capital's Visionary Leadership under Newman LeechRE Capital's Visionary Leadership under Newman Leech
RE Capital's Visionary Leadership under Newman LeechNewman George Leech
 
Case study on tata clothing brand zudio in detail
Case study on tata clothing brand zudio in detailCase study on tata clothing brand zudio in detail
Case study on tata clothing brand zudio in detailAriel592675
 
Contemporary Economic Issues Facing the Filipino Entrepreneur (1).pptx
Contemporary Economic Issues Facing the Filipino Entrepreneur (1).pptxContemporary Economic Issues Facing the Filipino Entrepreneur (1).pptx
Contemporary Economic Issues Facing the Filipino Entrepreneur (1).pptxMarkAnthonyAurellano
 
Keppel Ltd. 1Q 2024 Business Update Presentation Slides
Keppel Ltd. 1Q 2024 Business Update  Presentation SlidesKeppel Ltd. 1Q 2024 Business Update  Presentation Slides
Keppel Ltd. 1Q 2024 Business Update Presentation SlidesKeppelCorporation
 
8447779800, Low rate Call girls in Rohini Delhi NCR
8447779800, Low rate Call girls in Rohini Delhi NCR8447779800, Low rate Call girls in Rohini Delhi NCR
8447779800, Low rate Call girls in Rohini Delhi NCRashishs7044
 
Call US-88OO1O2216 Call Girls In Mahipalpur Female Escort Service
Call US-88OO1O2216 Call Girls In Mahipalpur Female Escort ServiceCall US-88OO1O2216 Call Girls In Mahipalpur Female Escort Service
Call US-88OO1O2216 Call Girls In Mahipalpur Female Escort Servicecallgirls2057
 
Intro to BCG's Carbon Emissions Benchmark_vF.pdf
Intro to BCG's Carbon Emissions Benchmark_vF.pdfIntro to BCG's Carbon Emissions Benchmark_vF.pdf
Intro to BCG's Carbon Emissions Benchmark_vF.pdfpollardmorgan
 
Kenya’s Coconut Value Chain by Gatsby Africa
Kenya’s Coconut Value Chain by Gatsby AfricaKenya’s Coconut Value Chain by Gatsby Africa
Kenya’s Coconut Value Chain by Gatsby Africaictsugar
 
VIP Kolkata Call Girl Howrah 👉 8250192130 Available With Room
VIP Kolkata Call Girl Howrah 👉 8250192130  Available With RoomVIP Kolkata Call Girl Howrah 👉 8250192130  Available With Room
VIP Kolkata Call Girl Howrah 👉 8250192130 Available With Roomdivyansh0kumar0
 
Lean: From Theory to Practice — One City’s (and Library’s) Lean Story… Abridged
Lean: From Theory to Practice — One City’s (and Library’s) Lean Story… AbridgedLean: From Theory to Practice — One City’s (and Library’s) Lean Story… Abridged
Lean: From Theory to Practice — One City’s (and Library’s) Lean Story… AbridgedKaiNexus
 
Flow Your Strategy at Flight Levels Day 2024
Flow Your Strategy at Flight Levels Day 2024Flow Your Strategy at Flight Levels Day 2024
Flow Your Strategy at Flight Levels Day 2024Kirill Klimov
 
Future Of Sample Report 2024 | Redacted Version
Future Of Sample Report 2024 | Redacted VersionFuture Of Sample Report 2024 | Redacted Version
Future Of Sample Report 2024 | Redacted VersionMintel Group
 

Recently uploaded (20)

Islamabad Escorts | Call 03274100048 | Escort Service in Islamabad
Islamabad Escorts | Call 03274100048 | Escort Service in IslamabadIslamabad Escorts | Call 03274100048 | Escort Service in Islamabad
Islamabad Escorts | Call 03274100048 | Escort Service in Islamabad
 
NewBase 19 April 2024 Energy News issue - 1717 by Khaled Al Awadi.pdf
NewBase  19 April  2024  Energy News issue - 1717 by Khaled Al Awadi.pdfNewBase  19 April  2024  Energy News issue - 1717 by Khaled Al Awadi.pdf
NewBase 19 April 2024 Energy News issue - 1717 by Khaled Al Awadi.pdf
 
8447779800, Low rate Call girls in Saket Delhi NCR
8447779800, Low rate Call girls in Saket Delhi NCR8447779800, Low rate Call girls in Saket Delhi NCR
8447779800, Low rate Call girls in Saket Delhi NCR
 
India Consumer 2024 Redacted Sample Report
India Consumer 2024 Redacted Sample ReportIndia Consumer 2024 Redacted Sample Report
India Consumer 2024 Redacted Sample Report
 
Lowrate Call Girls In Sector 18 Noida ❤️8860477959 Escorts 100% Genuine Servi...
Lowrate Call Girls In Sector 18 Noida ❤️8860477959 Escorts 100% Genuine Servi...Lowrate Call Girls In Sector 18 Noida ❤️8860477959 Escorts 100% Genuine Servi...
Lowrate Call Girls In Sector 18 Noida ❤️8860477959 Escorts 100% Genuine Servi...
 
/:Call Girls In Indirapuram Ghaziabad ➥9990211544 Independent Best Escorts In...
/:Call Girls In Indirapuram Ghaziabad ➥9990211544 Independent Best Escorts In.../:Call Girls In Indirapuram Ghaziabad ➥9990211544 Independent Best Escorts In...
/:Call Girls In Indirapuram Ghaziabad ➥9990211544 Independent Best Escorts In...
 
Youth Involvement in an Innovative Coconut Value Chain by Mwalimu Menza
Youth Involvement in an Innovative Coconut Value Chain by Mwalimu MenzaYouth Involvement in an Innovative Coconut Value Chain by Mwalimu Menza
Youth Involvement in an Innovative Coconut Value Chain by Mwalimu Menza
 
Call Us 📲8800102216📞 Call Girls In DLF City Gurgaon
Call Us 📲8800102216📞 Call Girls In DLF City GurgaonCall Us 📲8800102216📞 Call Girls In DLF City Gurgaon
Call Us 📲8800102216📞 Call Girls In DLF City Gurgaon
 
RE Capital's Visionary Leadership under Newman Leech
RE Capital's Visionary Leadership under Newman LeechRE Capital's Visionary Leadership under Newman Leech
RE Capital's Visionary Leadership under Newman Leech
 
Case study on tata clothing brand zudio in detail
Case study on tata clothing brand zudio in detailCase study on tata clothing brand zudio in detail
Case study on tata clothing brand zudio in detail
 
Contemporary Economic Issues Facing the Filipino Entrepreneur (1).pptx
Contemporary Economic Issues Facing the Filipino Entrepreneur (1).pptxContemporary Economic Issues Facing the Filipino Entrepreneur (1).pptx
Contemporary Economic Issues Facing the Filipino Entrepreneur (1).pptx
 
Keppel Ltd. 1Q 2024 Business Update Presentation Slides
Keppel Ltd. 1Q 2024 Business Update  Presentation SlidesKeppel Ltd. 1Q 2024 Business Update  Presentation Slides
Keppel Ltd. 1Q 2024 Business Update Presentation Slides
 
8447779800, Low rate Call girls in Rohini Delhi NCR
8447779800, Low rate Call girls in Rohini Delhi NCR8447779800, Low rate Call girls in Rohini Delhi NCR
8447779800, Low rate Call girls in Rohini Delhi NCR
 
Call US-88OO1O2216 Call Girls In Mahipalpur Female Escort Service
Call US-88OO1O2216 Call Girls In Mahipalpur Female Escort ServiceCall US-88OO1O2216 Call Girls In Mahipalpur Female Escort Service
Call US-88OO1O2216 Call Girls In Mahipalpur Female Escort Service
 
Intro to BCG's Carbon Emissions Benchmark_vF.pdf
Intro to BCG's Carbon Emissions Benchmark_vF.pdfIntro to BCG's Carbon Emissions Benchmark_vF.pdf
Intro to BCG's Carbon Emissions Benchmark_vF.pdf
 
Kenya’s Coconut Value Chain by Gatsby Africa
Kenya’s Coconut Value Chain by Gatsby AfricaKenya’s Coconut Value Chain by Gatsby Africa
Kenya’s Coconut Value Chain by Gatsby Africa
 
VIP Kolkata Call Girl Howrah 👉 8250192130 Available With Room
VIP Kolkata Call Girl Howrah 👉 8250192130  Available With RoomVIP Kolkata Call Girl Howrah 👉 8250192130  Available With Room
VIP Kolkata Call Girl Howrah 👉 8250192130 Available With Room
 
Lean: From Theory to Practice — One City’s (and Library’s) Lean Story… Abridged
Lean: From Theory to Practice — One City’s (and Library’s) Lean Story… AbridgedLean: From Theory to Practice — One City’s (and Library’s) Lean Story… Abridged
Lean: From Theory to Practice — One City’s (and Library’s) Lean Story… Abridged
 
Flow Your Strategy at Flight Levels Day 2024
Flow Your Strategy at Flight Levels Day 2024Flow Your Strategy at Flight Levels Day 2024
Flow Your Strategy at Flight Levels Day 2024
 
Future Of Sample Report 2024 | Redacted Version
Future Of Sample Report 2024 | Redacted VersionFuture Of Sample Report 2024 | Redacted Version
Future Of Sample Report 2024 | Redacted Version
 

Michael Durante Western Reserve 2Q05 letter

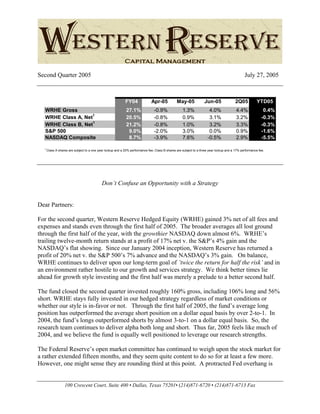
  • 1. Second Quarter 2005 July 27, 2005 100 Crescent Court, Suite 400 • Dallas, Texas 75201• (214)871-6720 • (214)871-6713 Fax FY04 Apr-05 May-05 Jun-05 2Q05 YTD05 WRHE Gross 27.1% -0.9% 1.3% 4.0% 4.4% 0.4% WRHE Class A, Net1 20.5% -0.8% 0.9% 3.1% 3.2% -0.3% WRHE Class B, Net1 21.2% -0.8% 1.0% 3.2% 3.3% -0.3% S&P 500 9.0% -2.0% 3.0% 0.0% 0.9% -1.6% NASDAQ Composite 8.7% -3.9% 7.6% -0.5% 2.9% -5.5% 1 Class A shares are subject to a one year lockup and a 20% performance fee; Class B shares are subject to a three year lockup and a 17% performance fee. Don’t Confuse an Opportunity with a Strategy Dear Partners: For the second quarter, Western Reserve Hedged Equity (WRHE) gained 3% net of all fees and expenses and stands even through the first half of 2005. The broader averages all lost ground through the first half of the year, with the growthier NASDAQ down almost 6%. WRHE’s trailing twelve-month return stands at a profit of 17% net v. the S&P’s 4% gain and the NASDAQ’s flat showing. Since our January 2004 inception, Western Reserve has returned a profit of 20% net v. the S&P 500’s 7% advance and the NASDAQ’s 3% gain. On balance, WRHE continues to deliver upon our long-term goal of ’twice the return for half the risk’ and in an environment rather hostile to our growth and services strategy. We think better times lie ahead for growth style investing and the first half was merely a prelude to a better second half. The fund closed the second quarter invested roughly 160% gross, including 106% long and 56% short. WRHE stays fully invested in our hedged strategy regardless of market conditions or whether our style is in-favor or not. Through the first half of 2005, the fund’s average long position has outperformed the average short position on a dollar equal basis by over 2-to-1. In 2004, the fund’s longs outperformed shorts by almost 3-to-1 on a dollar equal basis. So, the research team continues to deliver alpha both long and short. Thus far, 2005 feels like much of 2004, and we believe the fund is equally well positioned to leverage our research strengths. The Federal Reserve’s open market committee has continued to weigh upon the stock market for a rather extended fifteen months, and they seem quite content to do so for at least a few more. However, one might sense they are rounding third at this point. A protracted Fed overhang is
  • 2. July 27, 2005 agonizing to investors, causes conventional trade flows to slow and creates inefficiencies in stocks and stock groups as it stretches out. Inefficiency, of course, is good for fundamental- based strategies such as ours, yet patience and persistence are required. On balance, the Fed seems to be doing their part to keep the research team excited about long and short ideas contemporaneously. Investors largely have parked their capital in cyclical and defensive sectors like materials, hard assets, healthcare and real estate, wishing to avoid “fighting the Fed.” Because of the extended duration of the current tightening, several stock groups have begun to exhibit their own mini bubbles in our view. Conversely, secular services areas like information technology and financial services have become materially under-invested and trade at highly attractive Fed- aversion valuations. The momentum crowd is nowhere near these stocks, and we are loaded-up long as a result. Value Bubble? The current market tenets appear similar to 1995 and 2000. With the Fed nearing the end of a tightening cycle, momentum players have crowded into and overpriced the early-stage economic beneficiaries of this economic cycle. While cyclical (product) technology dominated between 1998 and early 2000, more traditional cyclicals like materials and industrials have dominated the current period, thus creating a type of conventional value stock bubble. We see an oxymoron at play where conventional value trades at growth valuations and growth trades at value multiples. A clear momentum mentality among analysts and investors is present inside of conventional value sectors like commodities, real estate, utilities, and industrials & manufacturing. Like their cyclical technology predecessors of 1999, the current cyclical leaders have the worrisome combination of high valuations concurrent with potentially peak margins and earnings. Perhaps because investors believe that these businesses will experience a longer cycle or are now magically quality businesses, the old adage of applying high P/E multiples to cyclically low margins and earnings and low P/E’s to peak economics has been set aside. Such was the case for semiconductors and telecommunications equipment in 1999. We suspect the current valuation paradox has more to do with increased momentum investing strategies being employed. And it seems the majority of money managers, value and growth alike, are all bullish on the same stocks. This is a dangerous combination. At a recent investor meeting we attended, a roofing supply distribution company stated that they believed they were in a “secular growth cycle” for roofing. The use of the term “secular” struck us, but in connection with the term “growth,” astonished us. Many technology product firms said similar things in 2000. Didn’t Cisco guide to 50% growth forever? This particular roofing supply company’s stock trades at over 25x, nearly 2x the market multiple, yet with perilously thin 2% operating margins. Their guidance of double digit earnings growth comes as a result of rapid fire acquisitions, accretive only through the magic of GAAP’s purchase accounting treatment, where acquisition costs are evergreened to the balance sheet and ignored on the income statement. Twenty-five times accounting juiced earnings is ridiculous for roofing 100 Crescent Court, Suite 400 • Dallas, Texas 75201• (214)871-6720 • (214)871-6713 Fax
  • 3. July 27, 2005 supplies at 2% margins even if one did buy into the notion that construction was leading a new paradigm of secular growth. We’re not terribly keen on new paradigms. The investor meeting was for growth stock managers by the way. Growth roofers? Growth multiple for sure! On a recent research trip through the Midwest, we met with several so-called “growth cyclical” companies. We found most management teams to be quite sanguine about peaking margins and fading earnings growth. Yet we wondered why we weren’t hearing this from Wall Street. Are the folks bidding-up these stocks not talking to the management teams? The P/E multiples afforded companies making bolts, wing nuts, tool belts and crowbars in businesses with margins well under 10% are astonishing to us. There were “pick and axe” stocks in the Internet bubble, too. Corning Glass comes to mind. One might note that we have increased our short portfolio in the industrial space. We believe we are still early and expect more to come. A cursory review of the following table may surprise some as to how expensive these lower quality businesses have become. It’s a conventional value bubble in our view. Select “Growth Cyclical” Stocks as of June 30: 2005E P/E Growth Rate LTM Growth Rate NTM Growth From Acquisitions Operating Margin Historic Margin Peak- to-Trough BECN (roofing) 25x 25% 12% >75% 2% unknown WSO (HVAC equipment) 22x 23% 14% >75% 4% 4% to 2% FAST (screws and bolts) 28x 23% 16% 0% 11% 11% to 8% RBA (yellow iron auctions) 33x 21% 15% 0% 21% 21% to 11% ITW (bolts, plastics etc.) 17x 13% 10% >75% 11% 11% to 8% LFUS (fuses) 27x Negative N/A >75% 7% 8% to 2% MSM (machine tools) 18x 37% 16% >50% 9% 9% to 4% AXE (cables and wires) 18x 25% 16% >75% 2% 2% to 1% *Western Reserve estimates Contemporaneous with evidence of a potential value stock bubble, leveraged buyout funds (LBO’s) have made a big comeback lately as well. LBO funds are raising capital with as much ease as their venture capital counterparts during the tech stock bubble in the late 90’s. If we had any latent doubts about our value bubble thesis, the Chinese coming after domestic value icons like Maytag (washers and dryers) and Unocal (gasoline) erased such doubt. To be sure, timing is a significant risk; however, managing this risk is part of our core competency with the aide of our proprietary loss mitigation program. 100 Crescent Court, Suite 400 • Dallas, Texas 75201• (214)871-6720 • (214)871-6713 Fax
  • 4. July 27, 2005 Stock Compensation Vigils on Wall Street A sigh of relief was felt across parts of Wall Street several weeks ago when the Financial Accounting Standards Board (FASB) again delayed the mandatory implementation date for their Statement 123, which requires companies to expense stock options. One sell-side analyst actually upgraded a stock we are short based on the delay, as if the company had received an eleventh-hour stay of execution. For researchers like us, it’s easy to spot the companies most negatively exposed to FAS 123 adoption risk – they are the ones who continue to delay adoption. Western Reserve’s research team is not as focused on GAAP as we are on cash flow, and thus the FAS 123 debate is of little interest to us per se. However, the real cash flow dilution resulting from stock-based compensation is of significant importance to our cash flow versus earnings estimates and valuation models therein. The “blind-eye” of Wall Street on this issue (and the attempts by Congress to block expensing for that matter) does not alter the economic dilution of diverting cash-based compensation for employees into stock. We believe Wall Street analysts haven’t done enough constructive analysis on the impact of options on cash flow. For some firms with high levels of employee stock options, one must analyze the entire cash flow statement to understand the materially dilutive impact to free cash flow. If the cash flow analysis stops at the operating line, then one is living a potentially large lie when analyzing some companies. And as it relates to FAS 123, many companies, with material GAAP expensing hits to earnings, appear to have “altered” their discounting assumptions. The result has been to effectively dilute the impact of FAS 123 ahead of implementation next year. The most common trick is to lower the volatility assumption in the model used to value the options, and we have identified several companies that have employed such trickery. Of equal concern is the underlying cash flow dilution to shareholders that has arisen via managements’ solution to the issue of highly dilutive ‘share creep’ as options vest. To fight off share dilution as stock options have begun to vest, many companies have been buying stock in the open market. While ostensibly a valiant show of support for their company, this action has been under-investigated by analysts and seriously detrimental to free cash flow per share for shareholders. We intend to focus on such issues more in the coming months and simply wanted to highlight a few of the topics of importance to our fundamental research effort. Meanwhile, we will leave you with a few specific examples of firms with material stock-based compensation overhang. 100 Crescent Court, Suite 400 • Dallas, Texas 75201• (214)871-6720 • (214)871-6713 Fax
  • 5. July 27, 2005 Select Estimated Valuation & Cash Flow Impact from Stock-based Compensation Dilution 2005E P/E GAAP 2005E SFAS 123 adjusted P/E** LTM Cash Flow*** to Net Income LTM P/Cash Flow** ABCO 35x 57x Negative Negative EXBD 44x 65x 115% 38x ACN 15x 20x Negative Negative SAPE 28x 70x Negative Negative CSGP 72x Negative Negative Negative FORR 28x 50x 50% 65x AMZN 57x Negative Negative Negative * Western Reserve estimates ** Reported net income less estimated options expense per FAS 123. *** Reported net income plus depreciation, deferred taxes, and net change in deferred revenue less net change in client/membership fee receivables, deferred incentive compensation, CapEx, and purchase of treasury stock. “Strategy” vs. “Opportunity” “Strategy” for us comes down to identifying fundamental long-term growth themes that are undervalued and underappreciated by the stock market. Chasing steel prices, guessing what the Chinese might do, or playing the momentum of roofing contractor roll-up stocks does not enter into our definition of strategy. Such “opportunities” lack long-term potential and are far from cheap, thus creating a risk/reward imbalance. But what of credit default swaps or collateralized debt obligations? These two concepts have terrific long-term growth potential, are key drivers of liquidity in our increasingly efficient economy, and lack broad-based investor sponsorship. As such, the stocks of the companies investing in real estate debt securities are trading for a song. One might consider WRHE’s exposure to real estate services unusually high for a growth manager. Notably, however, the portfolio has zero exposure to traditional equity REITs. We feel that some of the most widely inefficient pricings in some time can be found in real estate equity securities at present. Accordingly, we are long several high quality specialty REITs that invest in real estate debt securities versus the more common (and we believe overvalued) traditional equity REITs. Our portfolio companies are investing at lower risk, higher up in the capital structure and offer twice the yields offered by the underlying equity REIT. Like any REIT, these specialty debt REITs pass along the majority of their cash flows to investors in the form of dividends to shareholders. Yet given the current expensive valuation levels of traditional equity REITs, their pass through dividend is much lower than the undervalued debt equivalents your fund is long. The following data may surprise you… 100 Crescent Court, Suite 400 • Dallas, Texas 75201• (214)871-6720 • (214)871-6713 Fax
  • 6. July 27, 2005 As of June 30, 2005: 2006E Dividend Yield Dividend Growth Rate Price/Book Price-to-yield 7% Upside at 7% Yield Western Reserve Longs: KFN ($25) 12.0% 50% 1.2x $43 72% DFR ($19) 14.0% 75% 1.2x $36 89% NRF ($11) 9.0% 105% 1.6x $14.50 36% Private A @cost >12.0% >100% 1.1x 80% Private B @cost >10.0% >70% 1.1x 70% Private C @cost >10.0% >80% 1.1x 70% Debt REIT Peers: SFI ($42) 7.0% 8% 1.8x $42 0% ABR ($28) 8.0% 15% 1.8x $32 12% GKK ($25) 8.0% 25% 1.7x $28 12% RAS 8.4% 7% 1.4x $35 20% Traditional Equity REITs: VNO ($79) 4.5% 0% 2.8x $55 -30% EOP ($34) 5.8% -3% 1.5x $31 -10% MLS ($59) 4.9% 10% 6.5x $41 -30% GGP ($40) 5.3% 10% 4.5x $30 -20% SPG ($72) 4.4% 8% 4.8x $45 -30% NAREIT 4.5% <5% 3.3x -30% 10 Year Treas. Note 3.9% * Western Reserve estimates While the fund is not yet short traditional equity REITS, we do expect a good short entry point to develop in time as this mini bubble builds. Traditional equity REITs have appreciated materially over the past few years as long-term interest rates have fallen. It’s worth noting that FFO and dividend growth for equity REITs have been stagnant in this economic expansion and virtually all of the gains in equity REITs have come courtesy of valuation expansion. Such valuation-only advances in price usually end badly for investors stepping in at the wrong time. The conventional yield spread between equity REITS and the “riskless” rate offered on 10-year Treasury notes runs about 200 to 300 basis points. Currently, equity REITs offer a mere 50-60 basis point spread. We would expect a 25%- 30% correction at some point in the future and are waiting for the LBO players to back away, thereby cooling down private market bids and presenting us with a list of short candidates in the group. 100 Crescent Court, Suite 400 • Dallas, Texas 75201• (214)871-6720 • (214)871-6713 Fax
  • 7. July 27, 2005 REIT Debt and Equity Securities Rank-Order by Risk Un Levered Yield Underwritten LTV Type of Investment A-notes 5% 60% Banks B-notes 7%-8% 70% Debt REIT Mezzanine 10%-11% 80% Debt REIT Equity 4%-5% 100% Equity REIT *Western Reserve estimates Similar to 2004, the first half of 2005 has given us plenty of opportunity to upgrade the portfolio due to the short-term trading orientation of the tape and the growing cyclical and conventional value stock frenzy. As one hedge fund-of-funds manager said to us, some managers seem to be willing to “whip it around” out there. And that’s where this quarter’s adage comes from – don’t confuse an opportunity with a strategy. As we have often noted, Western Reserve’s investment strategy never strays. We pride ourselves on the consistency and fundamental logic of our investment program. The market may swing to extremes like the value bubble today and the tech bubble in 1999, but we keep our nose to the grindstone and repeat our investment program. The market offers various and sundry “opportunities” from time to time, but timing opportunities is precarious at best, and market timing always a great risk. Many see commodities, roll-ups, cyclicals and traditional property REITs as great trading opportunities at present. And they have lots of company. But, we view the investing landscape more consistently and simplistically – apply what our experience has taught us works cycle-in and cycle-out and never confuse an opportunity with an investment strategy. Regards, Michael P. Durante Managing Partner 100 Crescent Court, Suite 400 • Dallas, Texas 75201• (214)871-6720 • (214)871-6713 Fax
  • 8. July 27, 2005 Long Short Total (Gross) Total Class A (Net)2 Total Class B (Net)2 Long Short Total (Gross) Total Class A (Net)2 Total Class B (Net)2 Jan-05 Feb-05 Mar-05 Apr-05 May-05 Jun-05 YTD WRHE Gross 0.4% -1.9% -2.3% -0.9% 1.3% 4.0% 0.4% WRHE Class A Net 0.2% -1.6% -2.0% -0.8% 0.9% 3.1% -0.3% WRHE Class B Net 0.3% -1.7% -2.1% -0.8% 1.0% 3.2% -0.3% S&P 500 -2.5% 1.9% -1.9% -2.0% 3.0% 0.0% -1.6% NASDAQ -5.2% -0.5% -2.6% -3.9% 7.6% -0.5% -5.5% Jun-05 May-05 Apr-05 Mar-05 Feb-05 Jan-05 Dec-04 Nov-04 Oct-04 Sep-04 Aug-04 Jul-04 TTM Inception To Date3 WRHE Gross 4.0% 1.3% -0.9% -2.3% -1.9% 0.4% 7.8% 7.7% 2.7% 4.6% 0.6% -2.1% 23.2% 27.6% WRHE Class A Net 3.1% 0.9% -0.8% -2.0% -1.6% 0.2% 6.1% 6.0% 2.0% 3.6% 0.4% -1.8% 17.3% 19.6% WRHE Class B Net 3.2% 1.0% -0.8% -2.1% -1.7% 0.3% 6.3% 6.3% 2.1% 3.7% 0.4% -1.9% 18.0% 20.3% S&P 500 0.0% 3.0% -2.0% -1.9% 1.9% -2.5% 3.3% 3.9% 1.4% 0.9% 0.2% -3.4% 4.5% 7.2% NASDAQ -0.5% 7.6% -3.9% -2.6% -0.5% -5.2% 3.8% 6.2% 4.1% 3.2% -2.6% -7.8% 0.5% 2.7% Sector Long Short Gross Net Business Services 12% 3% 15% 10% Capital One Financial Long Consumer 1% 9% 10% -8% Comstock Homebuilding Financial Institutions 23% 3% 27% 20% Alliance Data Systems Financial Services 22% 9% 31% 12% Euronet Worldwide Healthcare 2% 1% 3% 1% MBNA Industrial 2% 12% 14% -11% Technology 8% 10% 17% -2% Technology Services 16% 8% 24% 8% Long Short Real Estate 20% 0% 20% 20% Top 5 24.1% 9.9% 106% 56% 162% 50% 37.3% 18.4% Summary for the Quarter Ended June 30, 2005 Western Reserve Hedged Equity, LP Quarter Ended June 30, 2005 Positions1 Performance Ending Exposure1 54 6.8% 106% 37 -2.4% 56% 91 4.4% 162% 3.2% 50% 3.3% 50% Trailing Twelve Months (TTM) Performance Average Exposure1 29.1% 95% -5.3% 47% 23.2% 141% 17.3% 48% 18.0% 48% Year to Date Comparative Returns2 Trailing Twelve Months Comparative Returns2 Composition by Sector (% of Capital) Key Positions Chicago Mercantile JDA Software Top 5 Winners YTD Short MBNA eSpeed Percent of Capital Largest Long Positions Top 10 Positions SI International Jack in the Box Trammell Crow Zebra Technologies Compucredit Superior Industries Western Reserve Hedged Equity, LP Cumulative Performance Since Inception (Gross) -9% -5% -1% 4% 8% 12% 16% 20% 24% 28% D ec Jan Feb M ar Apr M ay Jun Jul Aug Sep O ct N ov D ec Jan Feb M ar Apr M ay Jun Western Reserve S&P 500 NASDAQ 1 Freely tradable securities. Immaterial position sizes omitted. 2 Class A shares are subject to a one year lock-up and a 20% performance fee; Class B shares are subject to a three year lock-up and a 17% performance fee. 3 Western Reserve Hedged Equity, LP's inception date is January 1, 2004. Please be advised that the past performance of Western Reserve Hedged Equity, LP (the “Fund) is not necessarily indicative of future results. Depending on the timing of a person’s investment in one of the Funds, actual investment returns in the Fund may vary from the returns stated herein. Performance results are estimated, based on both audited and unaudited results, net of management and performance fees and operating expenses. Such performance results assume that a partner invested in the Fund at the inception of the Fund and has not made additional contributions or withdrawals. There is no assurance that at any time the securities held by the Fund will be securities which comprise any of the indices listed above, and the Fund may have substantial cash balances and investments in relatively illiquid securities at any time when compared to the securities comprising a listed index. This report is provided for informational purposes only and is not authorized for use as an offer of sale or a solicitation of an offer to purchase investments in the Fund or any affiliated entity. This report is qualified in its entirety by the more complete information contained in the Fund’s Confidential Private Placement Memorandum and related subscription materials. This report is confidential and may not be reproduced for any purpose. Western Reserve Capital Management, LP serves as the Fund’s investment manager. Its Form ADV Part II and Privacy Policy are available to investors upon request. 100 Crescent Court, Suite 400 • Dallas, Texas 75201• (214)871-6720 • (214)871-6713 Fax