
Recommended
Recommended
More Related Content
What's hot
What's hot (18)
Similar to U.S. Portfolio Strategy Weekly: Financial Repression and PE Multiples
Similar to U.S. Portfolio Strategy Weekly: Financial Repression and PE Multiples (20)
U.S. Portfolio Strategy Weekly: Financial Repression and PE Multiples
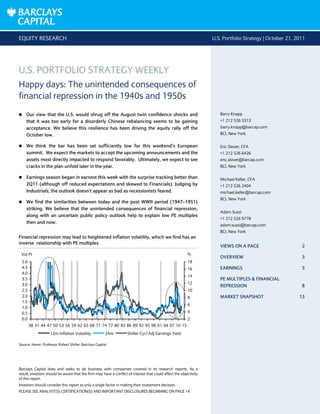
- 1. EQUITY RESEARCH U.S. Portfolio Strategy | October 21, 2011 Barclays Capital does and seeks to do business with companies covered in its research reports. As a result, investors should be aware that the firm may have a conflict of interest that could affect the objectivity of this report. Investors should consider this report as only a single factor in making their investment decision. PLEASE SEE ANALYST(S) CERTIFICATION(S) AND IMPORTANT DISCLOSURES BEGINNING ON PAGE 14. U.S. PORTFOLIO STRATEGY WEEKLY Happy days: The unintended consequences of financial repression in the 1940s and 1950s Our view that the U.S. would shrug off the August twin confidence shocks and that it was too early for a disorderly Chinese rebalancing seems to be gaining acceptance. We believe this resilience has been driving the equity rally off the October low. We think the bar has been set sufficiently low for this weekend’s European summit. We expect the markets to accept the upcoming announcements and the assets most directly impacted to respond favorably. Ultimately, we expect to see cracks in the plan unfold later in the year. Earnings season began in earnest this week with the surprise tracking better than 2Q11 (although off reduced expectations and skewed to Financials). Judging by Industrials, the outlook doesn’t appear as bad as recessionists feared. We find the similarities between today and the post WWII period (1947–1951) striking. We believe that the unintended consequences of financial repression, along with an uncertain public policy outlook help to explain low PE multiples then and now. Financial repression may lead to heightened inflation volatility, which we find has an inverse relationship with PE multiples 0.0 0.5 1.0 1.5 2.0 2.5 3.0 3.5 4.0 4.5 5.0 38 41 44 47 50 53 56 59 62 65 68 71 74 77 80 83 86 89 92 95 98 01 04 07 10 13 Vol Pt 2 4 6 8 10 12 14 16 18 12m Inflation Volatility 24m Shiller Cycl Adj Earnings Yield % Source: Haver, Professor Robert Shiller, Barclays Capital Barry Knapp +1 212 526 5313 barry.knapp@barcap.com BCI, New York Eric Slover, CFA +1 212 526 6426 eric.slover@barcap.com BCI, New York Michael Keller, CFA +1 212 526 2404 michael.keller@barcap.com BCI, New York Adam Sussi +1 212 526 9778 adam.sussi@barcap.com BCI, New York VIEWS ON A PAGE 2 OVERVIEW 3 EARNINGS 5 PE MULTIPLES & FINANCIAL REPRESSION 8 MARKET SNAPSHOT 13
- 2. Barclays Capital | U.S. Portfolio Strategy Weekly October 21, 2011 2 VIEWS ON A PAGE A rerating of the U.S. economic outlook was at the core of both the loss of upside equity market momentum this spring and the recent sharp correction. Associated economic uncertainty, along with political struggles in both Washington and Brussels in dealing with structural and cyclical public sector debt, have resulted in equity market valuations both on an absolute and relative basis that we consider attractive. Despite stabilization in the U.S. macroeconomic outlook and additional monetary policy accommodation, continued public policy uncertainty and the impact of slowing earnings momentum are significant factors in our decision to cut our 2011 year-end price target to 1260. European policy makers have made some degree of progress in stabilizing the financial system as the U.S. economy shrugged off the August public policy–related confidence shock. In addition, the Fed’s portfolio compositional changes should help loosen financial conditions; however, public policy uncertainty seems likely to weigh on business confidence for much of 2012. As a result, we are trimming our 2012 earnings forecast to $102 from $105. While our base case is for subdued growth, the risks are skewed to the downside. The combination of slowing earnings growth and asymmetric risks leads to our price target reduction. Our S&P 500 earnings forecast is $96 for 2011 (+15% y/y) and $102 for 2012 (+6% y/y) Full-Year 2010A Full-Year 2011E Full-Year 2012E S&P 500 Level y/y Level y/y Level y/y Operating EPS* $84 48% $96 15% $102 6% P/E 15.0x 7% 13.1x -13% Index 1,258 23% 1260 0% *Trailing-four-quarter EPS. Source: Barclays Capital To position ourselves for a late 4Q11 tactical rally, driven by macroeconomic stabilization and to a lesser extent some incremental monetary policy accommodation, we are following the roadmap from the fall 2010 rally. Technology, Industrials, Materials and Consumer Discretionary should lead the rebound while Staples and Utilities should lag. We’re tactically positioned for a rally, but with a negatively skewed distribution of outcomes, we’d rather be neutral two defensive sectors than underweight three. Industrials Technology Discretionary Materials Energy Telecom ↑ Health Care ↓ Financials Staples Utilities Underweight Marketweight- Marketweight Marketweight+ Overweight Note: ↑/↓ = increases/decreases on 9/16/11 to ratings in place since 8/11/11 or earlier. Source: Barclays Capital Overweight: The performance of the S&P 500 sector is expected to significantly outperform the performance of the S&P 500 index in the next 3–6 months. Marketweight Plus: The performance of the S&P 500 sector is expected to outperform the performance of the S&P 500 index in the next 3–6 months. Marketweight: The performance of the S&P 500 sector is expected to perform in line with the S&P 500 index in the next 3–6 months. Marketweight Minus: The performance of the S&P 500 sector is expected to underperform the performance of the S&P 500 index in the next 3–6 months.
- 3. Barclays Capital | U.S. Portfolio Strategy Weekly October 21, 2011 3 OVERVIEW Happy days: The unintended consequences of financial repression in the 1940s and 1950s; single-digit PE multiples Our view that the U.S. would shrug off the August twin confidence shocks and that it was too early for a disorderly Chinese rebalancing seems to be gaining acceptance. We believe this resilience has been driving the equity rally off the October low. We think the bar has been set sufficiently low for this weekend’s European summit. We expect the markets to accept the upcoming announcements and the assets most directly impacted to respond favorably. Ultimately, we expect to see cracks in the plan unfold later in the year. Earnings season began in earnest this week with the surprise tracking better than 2Q11, although off reduced expectations and heavily skewed towards Financials. Judging by Industrials, the outlook doesn’t appear as bad as recessionists feared. We find the similarities between today and the post WWII period (1947-51) striking. We believe that the unintended consequences of financial repression, along with an uncertain public policy outlook help to explain low PE multiples then and now. Reverse psychology Going into this weekend’s European summit, which is expected to last until Wednesday, we believe expectations are quite low for a constructive outcome—one that avoids overpromising and under delivering. Our view, based primarily on discussions with investors, is that the consensus is looking for: A bank recapitalization structure that results in asset sales rather than incremental equity and leads to a global credit crunch (hitting emerging markets and commodities disproportionately). A Greek restructuring that violates Hayek’s rule of law and penalizes private investors to the benefit of the public sector (leading to a loss of investor trust in sovereign and financial sector credit). An EFSF structure that either leads to a downgrade of France’s sovereign rating or is insufficient to ‘ring fence’ Spanish and Italian government debt. While we share the concerns expressed in these ‘consensus’ views we think the bar has been set sufficiently low such that the markets accept the announcements and the assets most directly impacted (sovereign government bonds, bank credit spreads and perhaps equities) respond favorably. Ultimately, we expect to see cracks in the plan unfold later in the year (such as spread widening across a variety of asset classes, including dollar basis swaps due to bank balance deleveraging through asset sales) and another wave of crisis early in 2012. Notwithstanding somewhat cynical comments about EU bank and sovereign bailouts, it seems likely that a guarantee structure for unsecured bank debt will be included (in whatever pronouncements result from the endless summit), which should lower the probability of disorderly bank deleveraging. Still, we believe that deleveraging will continue and would remind investors during the most acute phase of the deleveraging process in the U.S., the dollar went sharply higher (which at the time was quite unexpected). If EU region banks cut risk-weighted assets (sovereign debt has a zero-risk weighting under Basel Barry Knapp +1 212 526 5313 barry.knapp@barcap.com BCI, New York We think the bar has been set sufficiently low such that the markets accept the announcements. If EU region banks cut risk weighted assets we expect the path of least resistance for the euro to be higher.
- 4. Barclays Capital | U.S. Portfolio Strategy Weekly October 21, 2011 4 guidelines), we expect the path of least resistance for the euro to be higher, as repatriation drives demand for euros. Anecdotal evidence suggests that lines of credit for energy financing, combined with oil markets in backwardation, could drive crude prices higher as well. Additionally, a drop in the dollar could contribute to higher equity prices. So, we are reasonably certain that a ‘pain trade’ for most investors, in the near term, would be a rally in the euro, S&P 500 and in energy prices. Hence, we think this would be painful for the U.S. consumer (with a lag), setting the stage for a difficult start to 2012 for both the economy and markets. On a more positive note, our non-consensus view that the U.S. would shrug off the twin confidence shocks of August and that it was too early for a disorderly Chinese economic rebalancing (away from investment) seems to be gaining acceptance. We believe this resilience has been the catalyst behind the rally from the early October low (see Stabilization of US growth outlook drives performance of cyclical sectors, 10/18/11). While we much prefer the price investors pay for downside protection (index options protection strategies) rather than sentiment surveys to determine investor positioning, we find this week’s AAII data to be consistent with what we observed in the volatility markets (as well as anecdotal commentary from our client meetings). This week the percent bulls increased slightly to 35.8% from 34.4% (the lowest level since August 2010) while the bears dropped to 41.0% from 46.3% (the highest reading since March 2009). The corollary in index volatility is downside skew cheapening along with term-structure normalizing as correlation remains at high levels. Simply put, both indicators are suggesting that the rally has been about short covering, yet few investors have gotten long. The next two weeks are critical for bearishly biased investors; Europe’s ‘big’ extended weekend, earnings season, 3Q11 GDP, October ISM, auto sales and payrolls could combine to create a stable enough macroeconomic environment to draw longs back into cyclical equity sectors and riskier tiers of the credit market. The October U.S. economic data is of particular interest for us. If it is as least as strong as the September data (the strongest month of what is likely to be the strongest quarter of 2011) then all of the slowing growth dynamics that unfolded in early May (and culminated with the 2Q11 GDP and benchmark revisions in late July) may cause leading equity investors to reassess their bias towards defensive sectors. Figure 1: What we know about October so far is favorable; the 4wma of jobless claims is approaching the March low… Figure 2: … and the Empire State and Philly Fed manufacturing surveys showed strengthening new orders 300 350 400 450 500 550 600 650 700 08 09 10 11 12 000's Initial Claims (4wk ma) 1wk -50 -40 -30 -20 -10 0 10 20 30 40 50 08 09 10 11 12 Index Empire State Mfg Survey: New Orders Index SA Philly Fed Bus Outlook Survey: New Orders Index SA Source: Dept. of Labor, Haver, Barclays Capital Source: FRBPA, FBRNY, Haver, Barclays Capital Our view that the U.S. would shrug off the August confidence shocks and that it was too early for a disorderly rebalancing in China seems to be gaining acceptance. Indicators suggest the rally has been about short covering. October U.S. macro data is of particular interest for us; it may cause investors to reassess their bias towards defensive sectors.
- 5. Barclays Capital | U.S. Portfolio Strategy Weekly October 21, 2011 5 What we know about October so far is favorable; the weekly chain store surveys from ICSC and Redbook are tracking at similar rates to September (4 ½-5% y/y), the four-week moving average of jobless claims is approaching the post-Great Contraction low (reached in March 2011), the Empire State and Philly Fed manufacturing surveys showed strengthening new orders and shipments and even the NAHB Homebuilders survey positively surprised (see Figure 1 & 2). The macro trends gleaned from multi-industry manufacturing companies also appear favorable according to Barclays Capital analyst Scott Davis (Multi-Industry: What We Learned Today: October 20, 2011). To paraphrase his note, the early read on 4Q is encouraging; inventory destocking risks have abated, the sell-through in October is better than expected, and international weakness (so far) is isolated to Europe – risks remain, but increased visibility on good orders should improve investors’ comfort with the pace of 2012. In addition, comments from Parker Hannifin’s (PH) 3Q earnings call were consistent with our view that the drop in business confidence would not have much of an impact on corporate behaviour. “If we haven’t talked ourselves into a double dip by now, we probably won’t, because we’ve been talking about it for the better part of two quarters here.” – Donald Washkewicz, President, Chairman & CEO While equity investors may be suffering from ‘macro fatigue’ due to the constant stream of headlines from European policymakers, they do know how to interpret earnings reports. While there are some signs of deceleration in the sharp growth in earnings, current quarter results (as well as forward guidance) do not look consistent with the negative 2012 earnings growth which the market was pricing at the beginning of October. 3Q11 Earnings update Earnings season began in earnest this week (134 companies, 42% of market cap, have now reported 3Q11 results). The first significant week of reported earnings often sets the tone for the season and, historically, proves to be the most important period in gauging investors’ reactions. On the surface, the surprise (that is actual results relative to estimates) is even better than 2Q11, in part due to marked down analyst expectations. Financials have also played a major role in the positive results (currently accounting for 79% of the aggregate beat), much of which is a non-multiple-expanding item of adjustments to liabilities (CVA and DVA). However, relative to investor expectations in early October of a 2012 earnings decline (implied by market prices), these results serve to lower the probability of a double dip. Additionally, Industrials and Materials, two sectors vulnerable to a Chinese slowdown, have surprised positively on both the top and bottom line, suggesting analysts’ concerns and investor) about the global slowdown were somewhat excessive. Expectations for the balance of 2011 and 2012 were reduced coming out of 2Q11, reflecting macro concerns and a challenging operating environment. Since the end of the second quarter, the 3Q11 earnings estimate for the S&P 500 has fallen by ~4% while the estimate for 2012 declined by ~3% (a proxy for guidance expectations). Off these revised estimates, revenues and earnings have surprised by 1.5% and 6.6%, respectively (as compared to 1.7% and 5.0% in 2Q11), with the earnings surprise ratio tracking at 69% (slightly down relative to 2Q11’s 70%). 3Q11 results (both revenues and earnings) have been skewed heavily by Financials; excluding the sector, the current earnings surprise is only 1.8%. In our view, if earnings surprises were really high (or surprise ratios were above trend), it would suggest The current quarter results as well as forward guidance does not look consistent with negative 2012 earnings growth. 134 companies (42% of market cap) have reported 3Q11 results. The surprise is even better than 2Q11, in part due to marked down analyst expectations. 3Q11 have been skewed heavily by Financials; excluding the sector, the current earnings surprise is only 1.8%.
- 6. Barclays Capital | U.S. Portfolio Strategy Weekly October 21, 2011 6 that analysts may have reduced estimates too far; this might be true for certain sectors (i.e., Financials), but is not something we’re seeing universally across the aggregate index. Figure 3: Revenues and earnings are currently beating estimates by 1.5% and 6.6%, respectively Figure 4: The earnings surprise ratio for 3Q11 is currently tracking at 69% Sector 2Q11 3Q11 2Q11 3Q11 DIS 2.5 1.3 6.7 1.3 STA 2.2 2.1 1.3 4.1 ENR (0.1) 0.4 1.7 1.8 FIN 2.6 3.4 9.9 22.7 HLC 1.4 0.3 3.8 2.1 IND 1.6 1.3 3.7 1.0 TEC 2.9 (0.2) 10.5 1.7 MAT 2.3 6.2 3.6 1.5 TEL 0.6 (0.2) (9.5) 0.0 UTL (0.9) -- 3.4 -- SPX 1.7 1.5 5.0 6.6 SPX ex-FIN 1.5 1.0 4.4 1.8 SPX ex-ENR 2.0 1.6 5.7 6.8 SPX ex-FIN,ENR 1.9 1.1 5.0 1.8 Revenues, Surp % Earnings, Surp % 57 57 64 71 77 71 79 76 72 70 68 6970 50 55 60 65 70 75 80 85 3Q08 4Q08 1Q09 2Q09 3Q09 4Q09 1Q10 2Q10 3Q10 4Q10 1Q11 2Q11 3Q11 Ratio S&P 500 Earnings Surprise Ratio Avg = 69 Source: FactSet, Barclays Capital Note: ‘Earnings’ = EPS * Avg Shares Source: FactSet, Barclays Capital Note: Surprise Ratio = # Positive Surprise / Total # Reported So, while the current 3Q11 earnings trends look constructive (especially in light of recessionists’ fears), any early read on earnings is at best mixed. That said, the market appears to have priced in some excessive pessimism in many instances. For example, Manpower (MAN) reported solid 3Q11 results this morning but lowered guidance citing a weaker macroeconomic environment; however, the stock rallied as the company’s outlook for the labor market was apparently more favorable than that which the market had priced in. Investors remain focused on global growth. While the macro data appears to be pointed toward recovery, investors are looking to this quarter’s operating results to validate the forward outlook. We’ve been particularly focused on Industrials given that these are multinational companies with more exposure to the global real economy. In this morning’s earnings release, despite uninspiring 3Q results, General Electric (GE) cited strong momentum in organic growth carrying through to 4Q11 and into 2012 (guiding to double-digit earnings growth next year with expanding margins). The company’s CEO also went on to say that the situation in Europe “really does appear manageable” allaying some concerns about protracted European contagion. In the capital goods space, Parker Hannifin’s (PH) cited international strength and reduced pricing/cost headwinds (potentially now a tailwind for PH and other Industrials going forward). With respect to European optimism, the company noted that “we’re not as concerned about the smaller countries. Of course, we want to see strength across the board, but the major ones are all doing very well and remain strong for us.” As for constituents noting subdued prospects, their challenges appear to be more company specific (as opposed to macro focused). For example, Ingersoll-Rand (IR) beat 3Q expectations, but reduced its 4Q guidance just 20 days after lowering the outlook; however, the company cites mostly operational challenges in pursuing its “lean transformation” as it moves into 2012, not global growth (as international revenues were up 10% in 3Q11, versus -1% in the US). While 3Q11 trends look constructive, any early read on earnings is at best mixed. We’ve been particularly focused on Industrials given that these are multinational companies. GE cited strong momentum in organic growth carrying through to 4Q11 and into 2012. PH cited international strength and reduced pricing/cost headwinds. IR reduced guidance, but on company-specific factors, not global growth.
- 7. Barclays Capital | U.S. Portfolio Strategy Weekly October 21, 2011 7 On balance, given the general tone of managements’ commentary (around earnings and the 2012 outlook) and the current reads on October’s data (i.e., Fed manufacturing surveys), the outlook going forward doesn’t appear as bad as the recessionists might have you believe. However, exogenous shocks (and persistent uncertainty) still pose a risk; as our Multi-Industry analyst, Scott Davis, notes in his initiating report (U.S. Multi-Industry: Initiating Coverage: Cash Will Drive Outperformance - Scale in to Year-End, October 13, 2011), “an emerging markets collapse would drive us quickly towards a bear view. That’s the real risk to our call.” Blended growth and margins Blended 3Q11 y/y growth for the S&P is tracking at 11.5% for revenue and 15.0% for earnings. While Financials account for much of the current 3Q11 surprise, Energy contributes disproportionately to blended growth; excluding Energy, blended y/y revenue growth is tracking at 9.0% while that for earnings is tracking at 9.8%. Blended margins for the aggregate index are currently up ~30 bps (~16 bps excluding Energy). Figure 5: Blended 3Q11 y/y growth for the S&P is tracking at 11.5% for revenue and 9.7% for earnings Revenues, $Bn Earnings, $Bn Profit Margin S&P 500 sector 3Q10 (A) 3Q11 (Blend) y/y % 3Q10 (A) 3Q11 (Blend) y/y % 3Q10 (A) 3Q11 (Blend) y/y bp DIS 287.1 315.8 10.0 18.7 22.0 17.5 6.5 7.0 0.44 STA 358.1 391.5 9.3 22.9 24.7 8.0 6.4 6.3 (0.07) ENR 317.1 401.5 26.6 22.8 34.2 49.6 7.2 8.5 1.31 FIN 250.0 271.9 8.8 34.0 38.6 13.5 13.6 14.2 0.59 HLC 273.4 289.5 5.9 28.0 29.5 5.3 10.2 10.2 (0.06) IND 258.0 282.0 9.3 20.0 23.1 15.5 7.8 8.2 0.44 TEC 235.1 258.1 9.8 41.5 45.4 9.2 17.7 17.6 (0.09) MAT 82.9 94.8 14.3 5.9 7.5 28.2 7.1 7.9 0.86 TEL 71.9 76.5 6.5 4.5 5.0 10.0 6.3 6.5 0.21 UTL 84.1 90.6 7.7 10.1 9.8 (2.8) 12.0 10.8 (1.16) SPX 2,217.7 2,472.3 11.5 208.4 239.7 15.0 9.4 9.7 0.30 SPX ex-FIN 1,967.7 2,200.4 11.8 174.4 201.1 15.3 8.9 9.1 0.27 SPX ex-ENR 1,900.6 2,070.8 9.0 185.6 205.5 10.7 9.8 9.9 0.16 SPX ex-FIN,ENR 1,650.6 1,798.9 9.0 151.6 166.9 10.1 9.2 9.3 0.10 Source: FactSet, Barclays Capital On balance, the outlook going forward doesn’t appear as bad as the recessionists might have you believe.
- 8. Barclays Capital | U.S. Portfolio Strategy Weekly October 21, 2011 8 Unintended consequences of financial repression help explain low equity multiples A common argument is that equities are cheap relative to historical averages and should eventually revert to the mean. While this might be true, multiples have tended to move in secular ‘super cycle’ trends (the trend through the last cycle was lower). We’ve argued that changes in growth expectations drive changes in multiples, but we also recognize there are other forces at work that drive valuation trends. To help investors think about the future trajectory of multiples, we looked to the past. The late 1940s and early 1950s, noted by Bernanke as “the most striking episode of bond- price pegging [by the Fed]” (Bernanke 2002). A combination of public policy uncertainty and monetary policy missteps (the unintended consequences of financial repression) coupled with a series of geopolitical events, led to extraordinary levels of price instability and uncertainty. This substantially raised equity risk premiums and compressed valuations. During the recession of 1949, S&P 500 PE multiples reached a low of 6x. The parallels with today are striking: a crisis is fresh on the minds of investors, accommodative monetary with exceptionally low rates and lingering public policy uncertainty). Figure 6: In the 40s/50s, a combination of public policy uncertainty and monetary policy missteps led to extraordinary levels of price instability and uncertainty … Figure 7: … which substantially raised equity risk premiums and compressed valuations. S&P 500 PE multiples reached a low of 6x 0 5 10 15 20 25 30 40 42 44 46 48 50 52 54 56 58 % Real Long Bond ERP 0 5 10 15 20 25 40 42 44 46 48 50 52 54 56 58 x S&P 500 PE Multiple Source: Barclays Capital Source: Barclays Capital 1938–1945: financing the war As the threat of WWII heightened, the Fed determined that it should support security prices (largely based on Europe’s experiences of rising rates in WWI) and in 1939 it was authorized to buy securities. The start of WWII was largely anticipated (asset prices were relatively stable) and while public debt increased by 33% during 1939-1941, the Fed made limited purchases through this period. This quickly changed following the unanticipated attack on Pear Harbor (December 1941). The Fed and Treasury agreed to stabilize rates (although the Fed preferred higher rates than Treasury). In Mar 1942, the Fed agreed it would purchases Treasury bills when rates reached 3/8 (explicit peg) and support bonds to prevent yields from rising above 2.5% (implicit peg). Around the same time, Roosevelt introduced a seven-point anti-inflation program that included wage controls, price controls and rationing of goods, among other things. As the Fed’s plan (that is, the pledge to keep rates low for an extended period) gained credibility,
- 9. Barclays Capital | U.S. Portfolio Strategy Weekly October 21, 2011 9 investors sold low-yield Treasury bills and bought higher yielding bonds. To support prices, the Fed had to do the reverse; that is, buy bills and sell bonds. By the end of the war the Fed owned almost the entire supply of bills (Eichengreen 1990). With a shaky growth outlook and memories of WWII (the Great Depression and the recession of 1937/1938) fresh on investors minds, the country entered a post-war period of financial repression with a soaring a deficit and debt to GDP (even higher than today), a heavy handed government and an accommodative Fed (but one that lacked independence). Figure 8: The country entered a post-war period of financial repression with a soaring a deficit and debt to GDP, a heavy handed government and an accommodative Fed (but one that lacked independence) 0 20 40 60 80 100 120 140 29 33 37 41 45 49 53 57 61 65 69 73 77 81 85 89 93 97 01 05 09 13 % Fed Gov't Debt / GDP Mean 1946 - 121% 1981 - 34% 1993 - 67% 2010 - 93% 1929 - 16% 55% Source: Haver, FRB, Barclays Capital 1946–1951: Price instability Following the end of the war, the country fell into a short lived recession (1946). However, as growth stabilized, prices began to climb in July 1946. Although Congress gradually repealed many of the war time tax levies, the administration (led by Truman) continued to intervene with price controls and wage restrictions (except for unions, which could pursue higher wages). Price controls for goods (which were removed and reinstated) contributed to exceptional price instability for consumers and businesses. With the support of Treasury, in July 1947 the Fed discontinued the purchasing of bills, but succumbing to pressure from Treasury, the Fed agreed to support bonds at 2.5% (as well as some intermediate term rates). In addition, Congress eliminated wage and price controls with the Taft Hartley Act in June 1947 (this started the “Right-to-Work laws, which to this day remains contentious). Inflation abated but bond yields rose, and the Fed purchased securities to control the rise in yields. In 1948, inflation rose again and the Fed again was forced to purchase bonds, this time with cash, adding yet more fuel to inflationary fire. Although the Treasury resisted, the Fed raised rates in August 1948 to 1.25%. While prices stopped rising, maintaining price stability in the face of a mandate to keep rates low was increasingly a problem. Congress pushed Truman to pass a bill to raise reserve requirements (a policy tool from the Great Depression and the recession of 37/38). As reserve requirements were raised, banks shed Treasuries, which the Fed was then obligated to purchase. However, despite purchases mitigating the impact of increased reserves the country fell into recession in November 1948.
- 10. Barclays Capital | U.S. Portfolio Strategy Weekly October 21, 2011 10 As loan demand fell, banks bought securities, but the Fed, committed to the rate peg, sold securities during the recession, frustrating conditions. While the recession brought about a much needed pause; inflation turned to deflation, elevating inflation volatility. S&P 500 PE multiples reached a trough of near 6.0x in 2Q49 (the lowest level until the early 1980s). The Fed’s experience in the 1948/1949 recession bolstered its conviction (reflected in the July 1949 FOMC minutes) that its responsibility was to ensure price and income stability, not interest rate stability. The Fed had drawn a line and its objectives were now formally at odds with Treasury. 1950–1951: Finally, Fed independence “Either the Federal Reserve should be recognized as having some independent status, or it should be considered as simply an agency or a bureau of the Treasury.” Fed Governor Marriner Eccles, U.S. Congressional hearing 1951 As the economy recovered in 1950 so did prices. The Fed pushed Treasury to raise rates, but was again forced to buy Treasuries. With the call to war, this time Korea, inflationary concerns reached a tipping point. The Fed, ‘fed up’ with debt monetization raised interest rates to 1 3/8% and the FRB of New York raised the discount rate in August 1950, against the desires of the Treasury. The relationship between the Treasury and Fed was also reaching a tipping point (it’s rumored that Truman had an ally in the FOMC who selectively leaked Fed meeting accounts to newspapers in efforts to discredit the Fed). Shortly thereafter, in January 1951, Truman froze wages and nonfarm prices, even with the threat of higher rates. Led by fears of WWII rationing (meat rations weren’t lifted until December 1945), consumers rushed to hoard goods and inflation skyrocketed. Figure 9: The Fed was fed up with debt monetization and in August 1950, against the desires of the Treasury, raised interest rates to 1 3/8% Figure 10: Led by fears of WWII rationing, consumers rushed to hoard goods and inflation skyrocketed -10 -5 0 5 10 15 20 46 50 54 58 62 66 70 74 78 82 86 90 94 98 02 06 10 y/y % chg CPI Expectations: 6m CPI Expectations: 12m -10 0 10 20 30 40 50 40 42 44 46 48 50 52 54 56 58 % CPI 3m/3m annualized Source: FRB PA, Haver, Barclays Capital Source: Haver, Barclays Capital The ongoing dispute between the Fed and Treasury reached a head in February 1951, when the Fed notified Treasury that it would no longer support bond prices. Fortunately for the Fed, a large near-term refunding and new issuance requirements (and pressure from Congress), forced Treasury to put an end to the dispute. In March 1951, the two parties agreed to the Treasury-Fed Accord, which eliminated the Fed’s obligation to monetize the debt of the Treasury at a fixed rate in a Joint announcement by the Treasury and Fed on March 4, 1951.
- 11. Barclays Capital | U.S. Portfolio Strategy Weekly October 21, 2011 11 1951–1959: Post Accord, price stability Following the Accord, Treasury prices were allowed to fall and by year end, bond yields were 2.75%. Throughout the 1950s, the Fed was very concerned with managing inflation expectations (the FOMC minutes in Aug 55 characterize inflation as “a thief in the night.”). From 1951 until 1959, CPI fell to 1.5% from 9.5%, while short-term rates rose to 4% from 1%. Although nominal rates were more volatile, inflation, and inflation expectations were subdued and real rate volatility fell. However, this didn’t mark the end of financial repression; real rates generally remained low (or negative) and were below real GDP. Debt to GDP, which peaked at 121% in 1946, gradually declined as nominal GDP extinguished debt obligations (real debt levels fell). S&P 500 PE multiples, which troughed at single digits, climbed steadily higher through the expansion of the 1960s, before inflation uncertainty again arose in the 1970s, culminating with single digits in early 1980s. Parallels with today The parallels with today are striking. We believe it is these similar factors that drove multiples to historic lows in the 1940s and help explain today’s low multiples environment. Public policy uncertainty is high, monetary policy is extraordinary accommodative and negative real rates are aimed at stimulating the economy (which should provide a dose of inflation and chip away at the highest debt to GDP since 1946 (that is financial repression)). While the mountain of debt in the 1940s was built up defending our country (as opposed to financing consumption), both periods, nonetheless, followed the crises. Much like the threat of another war (Korea) and another financial downturn likely influenced investors’ attitude toward asset prices in the late 1940s and early 1950s, the looming threat of another financial crisis, this time in Europe, weighs on investors today. Figure 11: Maintaining negative real rates may produce inflation (the Fed’s goal in our view) and should heighten inflation volatility (which we find has an inverse relationship with PE multiples) 0.0 0.5 1.0 1.5 2.0 2.5 3.0 3.5 4.0 4.5 5.0 38 41 44 47 50 53 56 59 62 65 68 71 74 77 80 83 86 89 92 95 98 01 04 07 10 13 Vol Pt 2 4 6 8 10 12 14 16 18 12m Inflation Volatility 24m Shiller Cycl Adj Earnings Yield % Source: Professor Robert Shiller, Haver, Barclays Capital We expect public policy to remain challenging and for it to get worse before it gets better (particularly headed into the 2012 elections). However, ultimately inflation may prove the larger concern. Balancing growth and inflation is difficult and history shows that holding rates below inflation for extended periods often begets higher inflation (one of the Fed’s goal, in our view). In addition, we think it is almost certain to heighten inflation volatility
- 12. Barclays Capital | U.S. Portfolio Strategy Weekly October 21, 2011 12 (which we find has an inverse relationship with PE multiples). Indeed, inflation volatility increased steadily through the last cycle and looks to be rising (despite inflation at relatively low levels). We expect financial repression to continue and while we believe the Fed is acting appropriately, as we’ve illustrated, the strategies are risky (but we believe the cost of doing nothing is far greater). We could envision a scenario in 2013 when policy concerns are alleviated and financial repression leaves the Fed behind the curve, faced with elevated inflation expectations and perhaps in need of another Accord with Treasury to begin the tightening process. Once that process is complete (the unwinding of extraordinary measures), it seems a likely time for secular multiple expansion. References: Bernanke, Ben, “Deflation: Making Sure ‘it’ Doesn’t Happen Here,” Speech before Nation Economics Club, Washington D.C. November 21, 2002. Eichengreen, Barry, and Peter M. Garber, “Before the Accord: U.S. Monetary-Financial Policy, 1941-51,” in R. Glenn Hubbard, ed., Financial Markets and Financial Crises, Chicago: University of Chicago Press for NBER, 1991. Hetzel, Robert L, and Ralph F. Leach, “The Treasury-Fed Accord: A New Narrative Account,”Federal Reserve Bank of Richmond, Economic Quarterly (Winter 2001) pp. 33-55. Romer, Christina, and David H. Romer, 2002. “A Rehabilitation of Monetary Policy in the 1950’s,” American Economic Review v92, 121-127 The Miller Center Online. 2011. Miller Center, University of Virginia. October 21, 2011 http://millercenter.org/president/truman/essays/biography/4
- 13. Barclays Capital | U.S. Portfolio Strategy Weekly October 21, 2011 13 MARKET SNAPSHOT Figure 1: Price performance Figure 2: Relative performance, total return Index As of 10/20/11 1wk, % 3m, % 12m, % YTD, % Discretionary 302 -1.1 -5.5 11.0 2.2 Staples 318 0.0 -2.1 7.9 4.9 Energy 503 1.0 -12.6 14.0 -0.7 Financials 172 1.5 -14.6 -12.4 -19.7 HealthCare 376 -1.2 -7.4 4.2 3.1 Industrials 276 -0.4 -12.8 -0.8 -8.2 Technology 407 -3.4 -4.1 5.6 0.7 Materials 205 -2.8 -17.4 -4.2 -14.5 Telecom 124 -0.6 -5.6 1.4 -4.0 Utilities 174 1.1 2.4 6.5 9.4 S&P500 1,215 -0.8 -8.3 3.2 -3.4 Russell 2000 1,731 -2.3 -16.3 -0.8 -11.1 0.85 0.90 0.95 1.00 1.05 1.10 1.15 1.20 10/21/09 4/21/10 10/21/10 4/21/11 0.90 0.95 1.00 1.05 1.10 1.15 1.20 Rel Perf: Cyclical / Defensive Sectors (L) Rel Perf: S&P 600 (small) / S&P 500 (large) (R) RatioRatio Note: S&P 500 sector indices. Source: FactSet, Barclays Capital Source: FactSet, Barclays Capital Figure 3: Valuation multiples P/Earnings LTM P/Earnings NTM Div Yield LTM DivYield NTM P/Book P/Sales LTM P/Sales NTM EV/EBITDA LTM EV/EBITDA NTM Health Care 13.5 10.8 2.3 2.5 2.3 1.1 1.1 7.0 6.9 Technology 13.4 11.9 1.0 1.1 3.1 2.2 2.0 7.3 6.6 Staples 15.2 14.0 3.0 3.3 3.3 1.0 0.9 9.1 8.6 Industrials 13.5 11.8 2.4 2.6 2.4 1.1 1.0 8.8 7.9 Telecom 16.9 15.3 5.5 5.6 1.7 1.1 1.1 5.8 5.5 Financials 11.3 9.4 1.8 2.2 0.9 1.4 1.4 -- -- Materials 12.3 10.6 2.3 2.5 2.1 1.1 1.0 6.7 6.0 Discretionary 15.3 13.5 1.5 1.7 2.9 1.0 0.9 7.7 7.1 Energy 10.8 9.8 1.9 2.1 1.8 0.9 0.8 4.9 4.5 Utilities 13.7 13.8 4.2 4.3 1.5 1.2 1.2 8.0 7.8 S&P 500 12.8 11.4 2.1 2.3 1.9 1.2 1.1 7.5 7.0 Russell 2000 19.6 13.8 2.1 2.2 1.4 0.8 0.7 8.3 7.1 Valuation Metrics (as of 10/20/11) Index Note: S&P 500 sector indices. NTM is comprised of bottom-up consensus estimates from FactSet. *Valuation score is the renormalized sum of normalized relative valuation metrics expressed in common units of standard deviation away from the mean (z-score) since 1973. Source: FactSet, Barclays Capital. Figure 4: S&P 500 net EPS revisions Figure 5: Equity risk premium (to real IG credit yields) -100 -80 -60 -40 -20 0 20 40 60 03 04 05 06 07 08 09 10 11 Index Net Revisions: S&P 500, 13wk ma 4wk ma -2 -1 0 1 2 3 4 5 6 7 8 9 10 11 12 13 76 81 86 91 96 01 06 11 % Real Credit ERP Mean +/- SD Source: FactSet, Barclays Capital Source: Barclays Capital
- 14. Barclays Capital | U.S. Portfolio Strategy Weekly October 21, 2011 14 ANALYST(S) CERTIFICATION(S) I, Barry Knapp, hereby certify (1) that the views expressed in this research Company Report accurately reflect my personal views about any or all of the subject securities or issuers referred to in this Company Report and (2) no part of my compensation was, is or will be directly or indirectly related to the specific recommendations or views expressed in this Company Report. IMPORTANT DISCLOSURES The analysts responsible for preparing this report have received compensation based upon various factors including the firm’s total revenues, a portion of which is generated by investment banking activities. For current important disclosures, including, where relevant, price target charts, regarding companies that are the subject of this research report, please send a written request to: Barclays Capital Research Compliance, 745 Seventh Avenue, 17th Floor, New York, NY 10019 or refer to http://publicresearch.barcap.com or call 1-212-526-1072. Barclays Capital produces a variety of research products including, but not limited to, fundamental analysis, equity-linked analysis, quantitative analysis, and trade ideas. Recommendations contained in one type of research product may differ from recommendations contained in other types of research products, whether as a result of differing time horizons, methodologies, or otherwise. Barclays Capital, the investment banking division of Barclays Bank PLC (Barclays Capital, London) London Barclays Capital, the investment banking division of Barclays Bank PLC (Barclays Capital, London) New York Barclays Capital Inc. (BCI, New York) Tokyo Barclays Capital Japan Limited (BCJL, Tokyo) São Paulo Banco Barclays S.A. (BBSA, São Paulo) Hong Kong Barclays Bank PLC, Hong Kong branch (Barclays Bank, Hong Kong) Toronto Barclays Capital Canada Inc. (BCC, Toronto) Johannesburg Absa Capital, a division of Absa Bank Limited (Absa Capital, Johannesburg) Mexico City Barclays Bank Mexico, S.A. (BBMX, Mexico City) Taiwan Barclays Capital Securities Taiwan Limited (BCSTW, Taiwan) Seoul Barclays Capital Securities Limited (BCSL, Seoul) Mumbai Barclays Capital Securities (India) Private Limited (BSIPL, Mumbai) Singapore Barclays Bank PLC, Singapore branch (Barclays Bank, Singapore)
- 15. DISCLAIMER This publication has been prepared by Barclays Capital, the investment banking division of Barclays Bank PLC, and/or one or more of its affiliates as provided below. It is provided to our clients for information purposes only, and Barclays Capital makes no express or implied warranties, and expressly disclaims all warranties of merchantability or fitness for a particular purpose or use with respect to any data included in this publication. Barclays Capital will not treat unauthorized recipients of this report as its clients. Prices shown are indicative and Barclays Capital is not offering to buy or sell or soliciting offers to buy or sell any financial instrument. Without limiting any of the foregoing and to the extent permitted by law, in no event shall Barclays Capital, nor any affiliate, nor any of their respective officers, directors, partners, or employees have any liability for (a) any special, punitive, indirect, or consequential damages; or (b) any lost profits, lost revenue, loss of anticipated savings or loss of opportunity or other financial loss, even if notified of the possibility of such damages, arising from any use of this publication or its contents. Other than disclosures relating to Barclays Capital, the information contained in this publication has been obtained from sources that Barclays Capital believes to be reliable, but Barclays Capital does not represent or warrant that it is accurate or complete. The views in this publication are those of Barclays Capital and are subject to change, and Barclays Capital has no obligation to update its opinions or the information in this publication. The analyst recommendations in this publication reflect solely and exclusively those of the author(s), and such opinions were prepared independently of any other interests, including those of Barclays Capital and/or its affiliates. This publication does not constitute personal investment advice or take into account the individual financial circumstances or objectives of the clients who receive it. The securities discussed herein may not be suitable for all investors. Barclays Capital recommends that investors independently evaluate each issuer, security or instrument discussed herein and consult any independent advisors they believe necessary. The value of and income from any investment may fluctuate from day to day as a result of changes in relevant economic markets (including changes in market liquidity). The information herein is not intended to predict actual results, which may differ substantially from those reflected. Past performance is not necessarily indicative of future results. This communication is being made available in the UK and Europe primarily to persons who are investment professionals as that term is defined in Article 19 of the Financial Services and Markets Act 2000 (Financial Promotion Order) 2005. It is directed at, and therefore should only be relied upon by, persons who have professional experience in matters relating to investments. The investments to which it relates are available only to such persons and will be entered into only with such persons. Barclays Capital is authorized and regulated by the Financial Services Authority (‘FSA’) and member of the London Stock Exchange. Barclays Capital Inc., U.S. registered broker/dealer and member of FINRA (www.finra.org), is distributing this material in the United States and, in connection therewith accepts responsibility for its contents. Any U.S. person wishing to effect a transaction in any security discussed herein should do so only by contacting a representative of Barclays Capital Inc. in the U.S. at 745 Seventh Avenue, New York, New York 10019. Non-U.S. persons should contact and execute transactions through a Barclays Bank PLC branch or affiliate in their home jurisdiction unless local regulations permit otherwise. This material is distributed in Canada by Barclays Capital Canada Inc., a registered investment dealer and member of IIROC (www.iiroc.ca). To access Barclays Capital policy on the dissemination of research reports, please go to http://www.barcap.com/Client+offering/Research/Research+Policy. Subject to the conditions of this publication as set out above, Absa Capital, the Investment Banking Division of Absa Bank Limited, an authorised financial services provider (Registration No.: 1986/004794/06), is distributing this material in South Africa. Absa Bank Limited is regulated by the South African Reserve Bank. This publication is not, nor is it intended to be, advice as defined and/or contemplated in the (South African) Financial Advisory and Intermediary Services Act, 37 of 2002, or any other financial, investment, trading, tax, legal, accounting, retirement, actuarial or other professional advice or service whatsoever. Any South African person or entity wishing to effect a transaction in any security discussed herein should do so only by contacting a representative of Absa Capital in South Africa, 15 Alice Lane, Sandton, Johannesburg, Gauteng 2196. Absa Capital is an affiliate of Barclays Capital. In Japan, foreign exchange research reports are prepared and distributed by Barclays Bank PLC Tokyo Branch. Other research reports are distributed to institutional investors in Japan by Barclays Capital Japan Limited. Barclays Capital Japan Limited is a joint-stock company incorporated in Japan with registered office of 6-10-1 Roppongi, Minato-ku, Tokyo 106-6131, Japan. It is a subsidiary of Barclays Bank PLC and a registered financial instruments firm regulated by the Financial Services Agency of Japan. Registered Number: Kanto Zaimukyokucho (kinsho) No. 143. Barclays Bank PLC, Hong Kong Branch is distributing this material in Hong Kong as an authorised institution regulated by the Hong Kong Monetary Authority. Registered Office: 41/F, Cheung Kong Center, 2 Queen’s Road Central, Hong Kong. This material is issued in Taiwan by Barclays Capital Securities Taiwan Limited. This material on securities not traded in Taiwan is not to be construed as ‘recommendation’ in Taiwan. Barclays Capital Securities Taiwan Limited does not accept orders from clients to trade in such securities. This material may not be distributed to the public media or used by the public media without prior written consent of Barclays Capital. This material is distributed in South Korea by Barclays Capital Securities Limited, Seoul Branch. All equity research material is distributed in India by Barclays Securities (India) Private Limited (SEBI Registration No: INB/INF 231292732 (NSE), INB/INF 011292738 (BSE), Registered Office: 208 | Ceejay House | Dr. Annie Besant Road | Shivsagar Estate | Worli | Mumbai - 400 018 | India, Phone: + 91 22 67196363). Other research reports are distributed in India by Barclays Bank PLC, India Branch. Barclays Bank PLC Frankfurt Branch distributes this material in Germany under the supervision of Bundesanstalt für Finanzdienstleistungsaufsicht (BaFin). This material is distributed in Malaysia by Barclays Capital Markets Malaysia Sdn Bhd. This material is distributed in Brazil by Banco Barclays S.A. This material is distributed in Mexico by Barclays Bank Mexico, S.A. Barclays Bank PLC in the Dubai International Financial Centre (Registered No. 0060) is regulated by the Dubai Financial Services Authority (DFSA). Barclays Bank PLC-DIFC Branch, may only undertake the financial services activities that fall within the scope of its existing DFSA licence. Barclays Bank PLC in the UAE is regulated by the Central Bank of the UAE and is licensed to conduct business activities as a branch of a commercial bank incorporated outside the UAE in Dubai (Licence No.: 13/1844/2008, Registered Office: Building No. 6, Burj Dubai Business Hub, Sheikh Zayed Road, Dubai City) and Abu Dhabi (Licence No.: 13/952/2008, Registered Office: Al Jazira Towers, Hamdan Street, PO Box 2734, Abu Dhabi). Barclays Bank PLC in the Qatar Financial Centre (Registered No. 00018) is authorised by the Qatar Financial Centre Regulatory Authority (QFCRA). Barclays Bank PLC-QFC Branch may only undertake the regulated activities that fall within the scope of its existing QFCRA licence. Principal place of business in Qatar: Qatar Financial Centre, Office 1002, 10th Floor, QFC Tower, Diplomatic Area, West Bay, PO Box 15891, Doha, Qatar.
- 16. This material is distributed in Dubai, the UAE and Qatar by Barclays Bank PLC. Related financial products or services are only available to Professional Clients as defined by the DFSA, and Business Customers as defined by the QFCRA. This material is distributed in Saudi Arabia by Barclays Saudi Arabia (‘BSA’). It is not the intention of the Publication to be used or deemed as recommendation, option or advice for any action (s) that may take place in future. Barclays Saudi Arabia is a Closed Joint Stock Company, (CMA License No. 09141-37). Registered office Al Faisaliah Tower | Level 18 | Riyadh 11311 | Kingdom of Saudi Arabia. Authorised and regulated by the Capital Market Authority, Commercial Registration Number: 1010283024. This material is distributed in Russia by OOO Barclays Capital, affiliated company of Barclays Bank PLC, registered and regulated in Russia by the FSFM. Broker License #177-11850-100000; Dealer License #177-11855-010000. Registered address in Russia: 125047 Moscow, 1st Tverskaya-Yamskaya str. 21. This material is distributed in Singapore by the Singapore branch of Barclays Bank PLC, a bank licensed in Singapore by the Monetary Authority of Singapore. For matters in connection with this report, recipients in Singapore may contact the Singapore branch of Barclays Bank PLC, whose registered address is One Raffles Quay Level 28, South Tower, Singapore 048583. Barclays Bank PLC, Australia Branch (ARBN 062 449 585, AFSL 246617) is distributing this material in Australia. It is directed at ‘wholesale clients’ as defined by Australian Corporations Act 2001. IRS Circular 230 Prepared Materials Disclaimer: Barclays Capital and its affiliates do not provide tax advice and nothing contained herein should be construed to be tax advice. Please be advised that any discussion of U.S. tax matters contained herein (including any attachments) (i) is not intended or written to be used, and cannot be used, by you for the purpose of avoiding U.S. tax-related penalties; and (ii) was written to support the promotion or marketing of the transactions or other matters addressed herein. Accordingly, you should seek advice based on your particular circumstances from an independent tax advisor. Barclays Capital is not responsible for, and makes no warranties whatsoever as to, the content of any third-party web site accessed via a hyperlink in this publication and such information is not incorporated by reference. © Copyright Barclays Bank PLC 2011. All rights reserved. No part of this publication may be reproduced in any manner without the prior written permission of Barclays Capital or any of its affiliates. Barclays Bank PLC is registered in England No. 1026167. Registered office 1 Churchill Place, London, E14 5HP. Additional information regarding this publication will be furnished upon request.
- 17. US11-0244