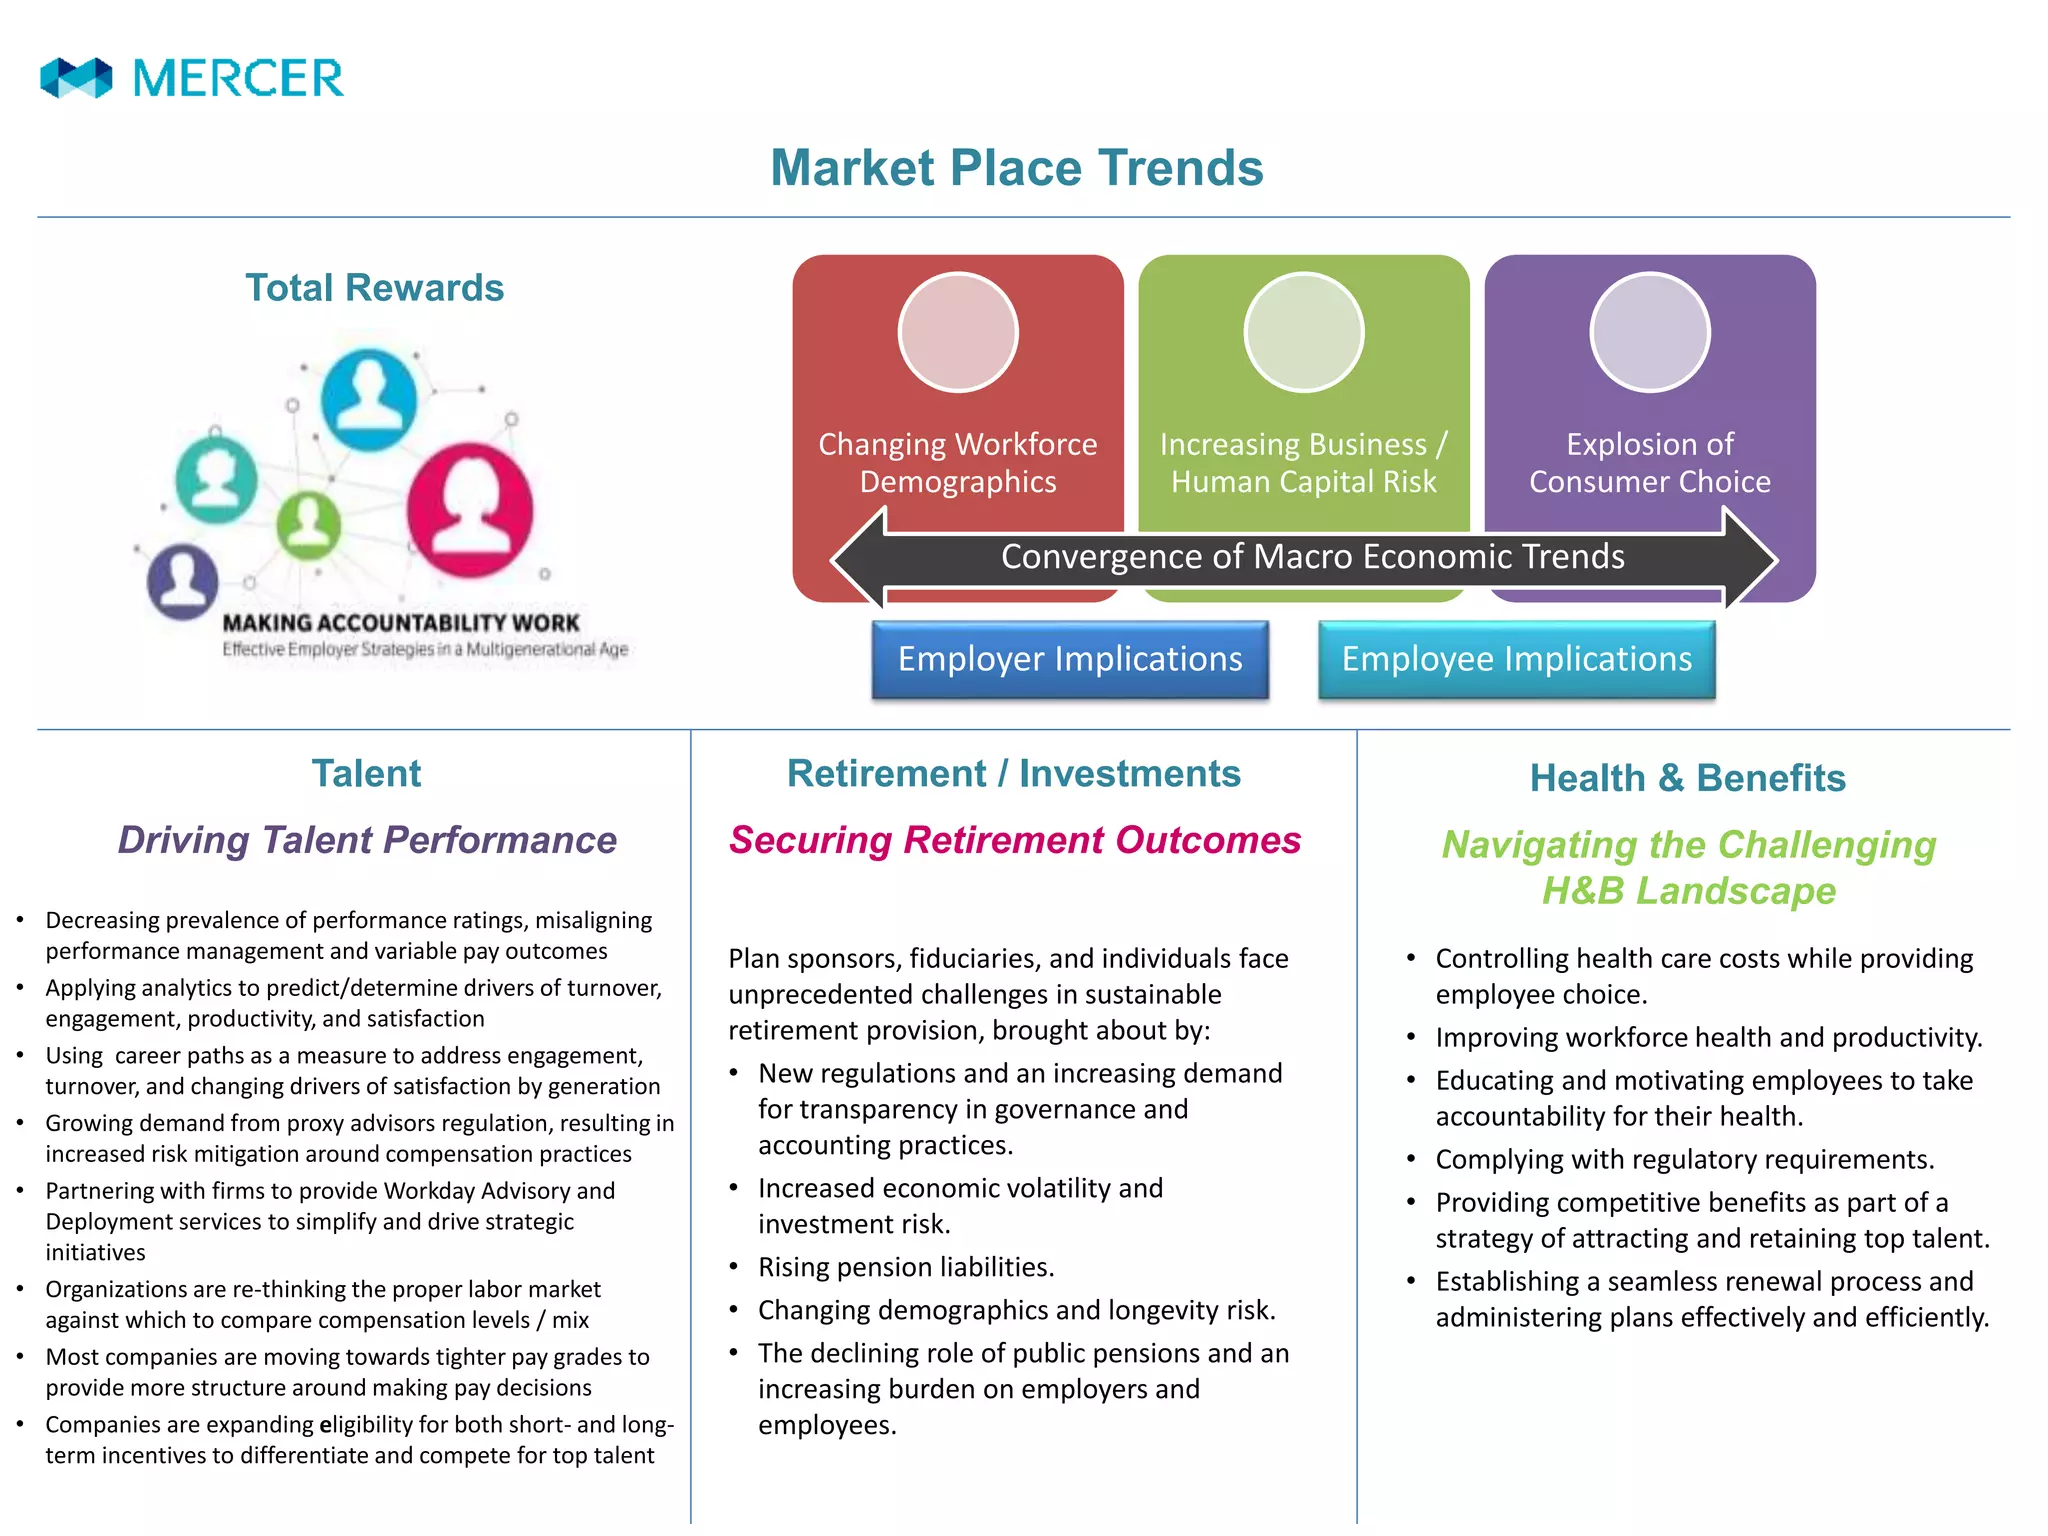
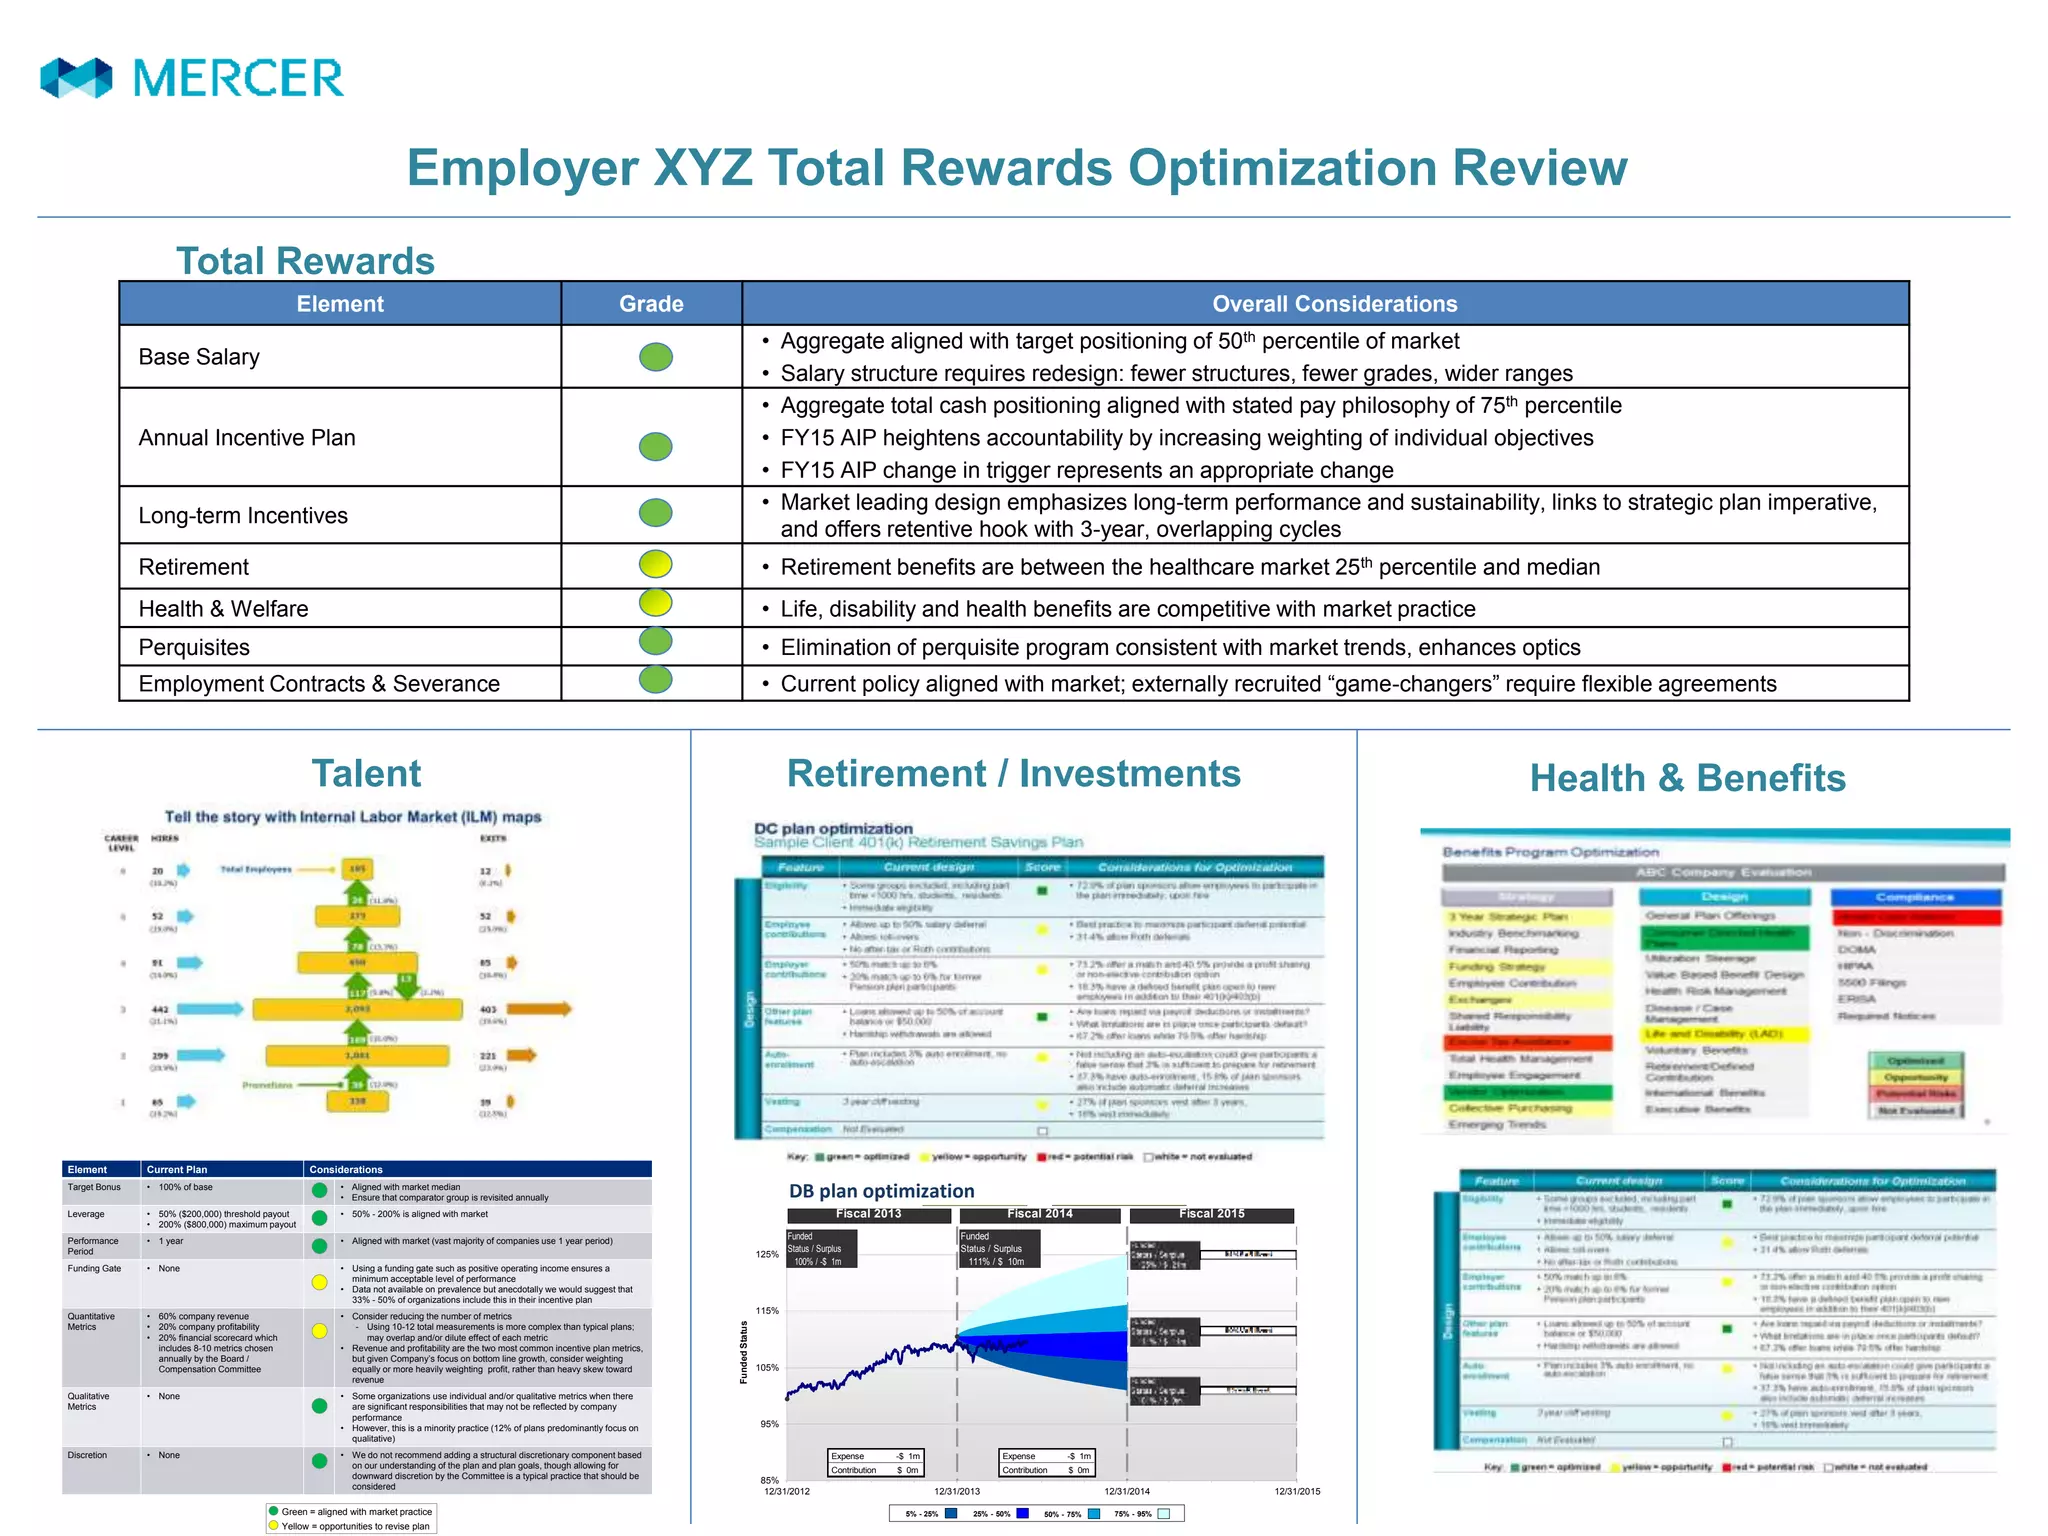
Market Place Trends
Talent
Driving Talent Performance
Changing Workforce
Demographics
Increasing Business /
Human Capital Risk
Explosion of
Consumer Choice
Convergence of Macro Economic Trends
Total Rewards
• Decreasing prevalence of performance ratings, misaligning
performance management and variable pay outcomes
• Applying analytics to predict/determine drivers of turnover,
engagement, productivity, and satisfaction
• Using career paths as a measure to address engagement,
turnover, and changing drivers of satisfaction by generation
• Growing demand from proxy advisors regulation, resulting in
increased risk mitigation around compensation practices
• Partnering with firms to provide Workday Advisory and
Deployment services to simplify and drive strategic
initiatives
• Organizations are re-thinking the proper labor market
against which to compare compensation levels / mix
• Most companies are moving towards tighter pay grades to
provide more structure around making pay decisions
• Companies are expanding eligibility for both short- and long-
term incentives to differentiate and compete for top talent
Retirement / Investments
Securing Retirement Outcomes
Health & Benefits
Navigating the Challenging
H&B Landscape
• Controlling health care costs while providing
employee choice.
• Improving workforce health and productivity.
• Educating and motivating employees to take
accountability for their health.
• Complying with regulatory requirements.
• Providing competitive benefits as part of a
strategy of attracting and retaining top talent.
• Establishing a seamless renewal process and
administering plans effectively and efficiently.
Plan sponsors, fiduciaries, and individuals face
unprecedented challenges in sustainable
retirement provision, brought about by:
• New regulations and an increasing demand
for transparency in governance and
accounting practices.
• Increased economic volatility and
investment risk.
• Rising pension liabilities.
• Changing demographics and longevity risk.
• The declining role of public pensions and an
increasing burden on employers and
employees.
Employer Implications Employee Implications
Employer XYZ Total Rewards Optimization Review
Talent
Convergence of Macro Economic Trends
Total Rewards
Retirement / Investments Health & Benefits
Element Grade Overall Considerations
Base Salary
• Aggregate aligned with target positioning of 50th percentile of market
• Salary structure requires redesign: fewer structures, fewer grades, wider ranges
Annual Incentive Plan
• Aggregate total cash positioning aligned with stated pay philosophy of 75th percentile
• FY15 AIP heightens accountability by increasing weighting of individual objectives
• FY15 AIP change in trigger represents an appropriate change
Long-term Incentives
• Market leading design emphasizes long-term performance and sustainability, links to strategic plan imperative,
and offers retentive hook with 3-year, overlapping cycles
Retirement • Retirement benefits are between the healthcare market 25th percentile and median
Health & Welfare • Life, disability and health benefits are competitive with market practice
Perquisites • Elimination of perquisite program consistent with market trends, enhances optics
Employment Contracts & Severance • Current policy aligned with market; externally recruited “game-changers” require flexible agreements
85%
95%
105%
115%
125%
12/31/2012 12/31/2013 12/31/2014 12/31/2015
FundedStatus
75% - 95%25% - 50% 50% - 75%5% - 25%
Fiscal 2013 Fiscal 2014 Fiscal 2015
Expense -$ 1m
Contribution $ 0m
Expense -$ 1m
Contribution $ 0m
Funded
Status / Surplus
111% / $ 10m
Funded
Status / Surplus
100% / -$ 1m
DB plan optimization
Element Current Plan Considerations
Target Bonus • 100% of base • Aligned with market median
• Ensure that comparator group is revisited annually
Leverage • 50% ($200,000) threshold payout
• 200% ($800,000) maximum payout
• 50% - 200% is aligned with market
Performance
Period
• 1 year • Aligned with market (vast majority of companies use 1 year period)
Funding Gate • None • Using a funding gate such as positive operating income ensures a
minimum acceptable level of performance
• Data not available on prevalence but anecdotally we would suggest that
33% - 50% of organizations include this in their incentive plan
Quantitative
Metrics
• 60% company revenue
• 20% company profitability
• 20% financial scorecard which
includes 8-10 metrics chosen
annually by the Board /
Compensation Committee
• Consider reducing the number of metrics
- Using 10-12 total measurements is more complex than typical plans;
may overlap and/or dilute effect of each metric
• Revenue and profitability are the two most common incentive plan metrics,
but given Company’s focus on bottom line growth, consider weighting
equally or more heavily weighting profit, rather than heavy skew toward
revenue
Qualitative
Metrics
• None • Some organizations use individual and/or qualitative metrics when there
are significant responsibilities that may not be reflected by company
performance
• However, this is a minority practice (12% of plans predominantly focus on
qualitative)
Discretion • None • We do not recommend adding a structural discretionary component based
on our understanding of the plan and plan goals, though allowing for
downward discretion by the Committee is a typical practice that should be
considered
Green = aligned with market practice
Yellow = opportunities to revise plan

Mercer Total Rewards Optimizatoin

  • 1.
    Market Place Trends Talent DrivingTalent Performance Changing Workforce Demographics Increasing Business / Human Capital Risk Explosion of Consumer Choice Convergence of Macro Economic Trends Total Rewards • Decreasing prevalence of performance ratings, misaligning performance management and variable pay outcomes • Applying analytics to predict/determine drivers of turnover, engagement, productivity, and satisfaction • Using career paths as a measure to address engagement, turnover, and changing drivers of satisfaction by generation • Growing demand from proxy advisors regulation, resulting in increased risk mitigation around compensation practices • Partnering with firms to provide Workday Advisory and Deployment services to simplify and drive strategic initiatives • Organizations are re-thinking the proper labor market against which to compare compensation levels / mix • Most companies are moving towards tighter pay grades to provide more structure around making pay decisions • Companies are expanding eligibility for both short- and long- term incentives to differentiate and compete for top talent Retirement / Investments Securing Retirement Outcomes Health & Benefits Navigating the Challenging H&B Landscape • Controlling health care costs while providing employee choice. • Improving workforce health and productivity. • Educating and motivating employees to take accountability for their health. • Complying with regulatory requirements. • Providing competitive benefits as part of a strategy of attracting and retaining top talent. • Establishing a seamless renewal process and administering plans effectively and efficiently. Plan sponsors, fiduciaries, and individuals face unprecedented challenges in sustainable retirement provision, brought about by: • New regulations and an increasing demand for transparency in governance and accounting practices. • Increased economic volatility and investment risk. • Rising pension liabilities. • Changing demographics and longevity risk. • The declining role of public pensions and an increasing burden on employers and employees. Employer Implications Employee Implications
  • 2.
    Employer XYZ TotalRewards Optimization Review Talent Convergence of Macro Economic Trends Total Rewards Retirement / Investments Health & Benefits Element Grade Overall Considerations Base Salary • Aggregate aligned with target positioning of 50th percentile of market • Salary structure requires redesign: fewer structures, fewer grades, wider ranges Annual Incentive Plan • Aggregate total cash positioning aligned with stated pay philosophy of 75th percentile • FY15 AIP heightens accountability by increasing weighting of individual objectives • FY15 AIP change in trigger represents an appropriate change Long-term Incentives • Market leading design emphasizes long-term performance and sustainability, links to strategic plan imperative, and offers retentive hook with 3-year, overlapping cycles Retirement • Retirement benefits are between the healthcare market 25th percentile and median Health & Welfare • Life, disability and health benefits are competitive with market practice Perquisites • Elimination of perquisite program consistent with market trends, enhances optics Employment Contracts & Severance • Current policy aligned with market; externally recruited “game-changers” require flexible agreements 85% 95% 105% 115% 125% 12/31/2012 12/31/2013 12/31/2014 12/31/2015 FundedStatus 75% - 95%25% - 50% 50% - 75%5% - 25% Fiscal 2013 Fiscal 2014 Fiscal 2015 Expense -$ 1m Contribution $ 0m Expense -$ 1m Contribution $ 0m Funded Status / Surplus 111% / $ 10m Funded Status / Surplus 100% / -$ 1m DB plan optimization Element Current Plan Considerations Target Bonus • 100% of base • Aligned with market median • Ensure that comparator group is revisited annually Leverage • 50% ($200,000) threshold payout • 200% ($800,000) maximum payout • 50% - 200% is aligned with market Performance Period • 1 year • Aligned with market (vast majority of companies use 1 year period) Funding Gate • None • Using a funding gate such as positive operating income ensures a minimum acceptable level of performance • Data not available on prevalence but anecdotally we would suggest that 33% - 50% of organizations include this in their incentive plan Quantitative Metrics • 60% company revenue • 20% company profitability • 20% financial scorecard which includes 8-10 metrics chosen annually by the Board / Compensation Committee • Consider reducing the number of metrics - Using 10-12 total measurements is more complex than typical plans; may overlap and/or dilute effect of each metric • Revenue and profitability are the two most common incentive plan metrics, but given Company’s focus on bottom line growth, consider weighting equally or more heavily weighting profit, rather than heavy skew toward revenue Qualitative Metrics • None • Some organizations use individual and/or qualitative metrics when there are significant responsibilities that may not be reflected by company performance • However, this is a minority practice (12% of plans predominantly focus on qualitative) Discretion • None • We do not recommend adding a structural discretionary component based on our understanding of the plan and plan goals, though allowing for downward discretion by the Committee is a typical practice that should be considered Green = aligned with market practice Yellow = opportunities to revise plan