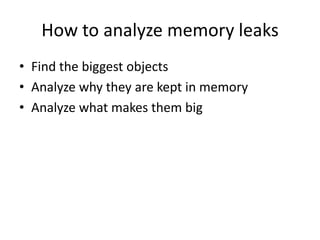
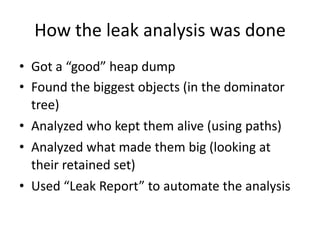
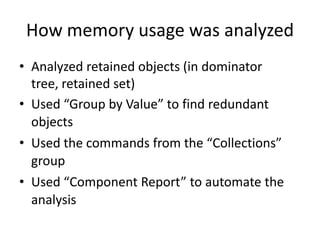
MEMORY ANALYZER TOOL
BY
MOHAMMAD SAMIULLAH FAROOQUI
AGENDA
• Memory Analysis
• Some definitions
• Example of leak code
• Demo of MAT
Why use MAT
• Identify memory leaks
• Reduce memory consumption
Important Definitions
• Heap Dump
• Shallow Heap
• Retained Heap
• Dominator Tree
• Garbage Collection Roots
Heap Dump
• a snapshot of the memory of a Java process
• contains information about the java objects
and classes in the heap
1. All Objects - Class, fields, primitive values and references
2. All Classes - Classloader, name, super class, static fields
3. Garbage Collection Roots - Objects defined to be reachable by the JVM
4. Thread Stacks and Local Variables - The call-stacks of threads at the
moment of the snapshot, and per frame information about local
objects
• MAT works with HPROF binary heap dumps
How to acquire a Heap Dump
Shallow Heap
• memory consumed by one object
Retained Heap
• Retained set of X is the set of objects which
would be removed by GC when X is garbage
collected.
• Retained heap of X is the sum of shallow sizes
of all objects in the retained set of X, i.e.
memory kept alive by X.
Object Reference Graph
Dominator Tree
• An object x dominates an object y if every
path in the object graph from the start (or the
root) node to y must go through x.
• The immediate dominator x of some object y
is the dominator closest to the object y.
Object graph to Dominator Tree
Garbage Collection Roots
• A garbage collection root is an object that is
accessible by the JVM(DVM in case of Android)
Examples:-
1. System Class(Class loaded by bootstrap/system class loader)
For example, java.util.*
2. Java Local(Local variable) For example, input parameters or
locally created objects of methods that are still in the stack
of a thread.
3. Finalizable - An object which is in a queue awaiting its
finalizer to be run.
How to analyze memory leaks
• Find the biggest objects
• Analyze why they are kept in memory
• Analyze what makes them big
How the leak analysis was done
• Got a “good” heap dump
• Found the biggest objects (in the dominator
tree)
• Analyzed who kept them alive (using paths)
• Analyzed what made them big (looking at
their retained set)
• Used “Leak Report” to automate the analysis
Inspect the thread to find its activity
• Look at the thread attributes -
name, class, etc...
• Look at the local variables
• Look at the stack of the thread
Find where memory usage can be
optimized
• Inspect the set of retained objects
• Search for inefficiently used data structures
• Look for redundant data
How memory usage was analyzed
• Analyzed retained objects (in dominator
tree, retained set)
• Used “Group by Value” to find redundant
objects
• Used the commands from the “Collections”
group
• Used “Component Report” to automate the
analysis
Thank You
Resource for slides taken from the following links
• http://www.slideshare.net/AJohnson1/practical-lessons-in-
memory-analysis#
• http://www.slideshare.net/littleeye/memory-analyzer-tool#
• http://help.eclipse.org/kepler/index.jsp?topic=/org.eclipse.m
at.ui.help/welcome.html

Memory Analyzer Tool (MAT)

  • 1.
  • 2.
    AGENDA • Memory Analysis •Some definitions • Example of leak code • Demo of MAT
  • 3.
    Why use MAT •Identify memory leaks • Reduce memory consumption
  • 4.
    Important Definitions • HeapDump • Shallow Heap • Retained Heap • Dominator Tree • Garbage Collection Roots
  • 5.
    Heap Dump • asnapshot of the memory of a Java process • contains information about the java objects and classes in the heap 1. All Objects - Class, fields, primitive values and references 2. All Classes - Classloader, name, super class, static fields 3. Garbage Collection Roots - Objects defined to be reachable by the JVM 4. Thread Stacks and Local Variables - The call-stacks of threads at the moment of the snapshot, and per frame information about local objects • MAT works with HPROF binary heap dumps
  • 6.
    How to acquirea Heap Dump
  • 7.
    Shallow Heap • memoryconsumed by one object
  • 8.
    Retained Heap • Retainedset of X is the set of objects which would be removed by GC when X is garbage collected. • Retained heap of X is the sum of shallow sizes of all objects in the retained set of X, i.e. memory kept alive by X.
  • 9.
  • 10.
    Dominator Tree • Anobject x dominates an object y if every path in the object graph from the start (or the root) node to y must go through x. • The immediate dominator x of some object y is the dominator closest to the object y.
  • 11.
    Object graph toDominator Tree
  • 12.
    Garbage Collection Roots •A garbage collection root is an object that is accessible by the JVM(DVM in case of Android) Examples:- 1. System Class(Class loaded by bootstrap/system class loader) For example, java.util.* 2. Java Local(Local variable) For example, input parameters or locally created objects of methods that are still in the stack of a thread. 3. Finalizable - An object which is in a queue awaiting its finalizer to be run.
  • 13.
    How to analyzememory leaks • Find the biggest objects • Analyze why they are kept in memory • Analyze what makes them big
  • 14.
    How the leakanalysis was done • Got a “good” heap dump • Found the biggest objects (in the dominator tree) • Analyzed who kept them alive (using paths) • Analyzed what made them big (looking at their retained set) • Used “Leak Report” to automate the analysis
  • 15.
    Inspect the threadto find its activity • Look at the thread attributes - name, class, etc... • Look at the local variables • Look at the stack of the thread
  • 16.
    Find where memoryusage can be optimized • Inspect the set of retained objects • Search for inefficiently used data structures • Look for redundant data
  • 17.
    How memory usagewas analyzed • Analyzed retained objects (in dominator tree, retained set) • Used “Group by Value” to find redundant objects • Used the commands from the “Collections” group • Used “Component Report” to automate the analysis
  • 18.
    Thank You Resource forslides taken from the following links • http://www.slideshare.net/AJohnson1/practical-lessons-in- memory-analysis# • http://www.slideshare.net/littleeye/memory-analyzer-tool# • http://help.eclipse.org/kepler/index.jsp?topic=/org.eclipse.m at.ui.help/welcome.html