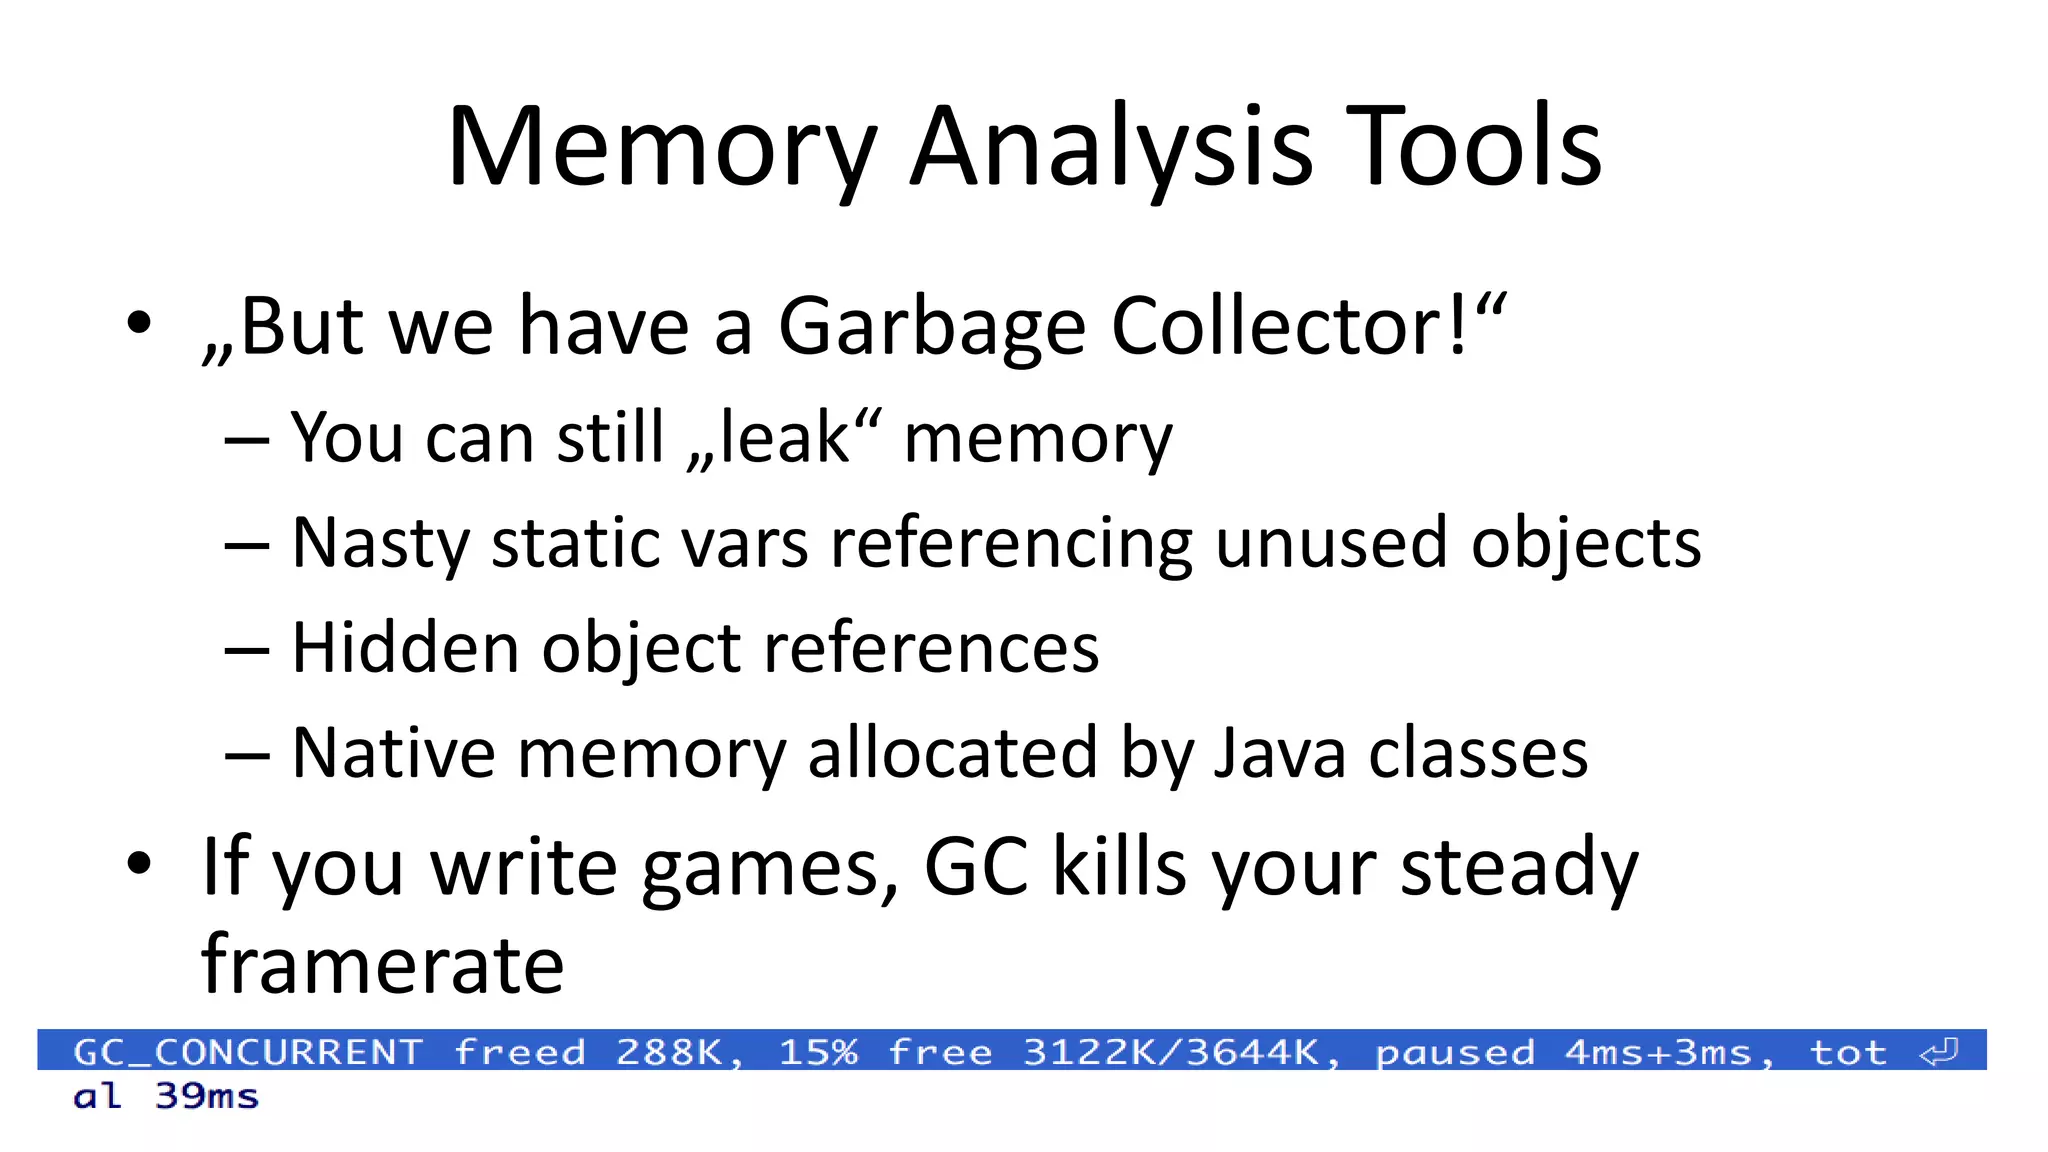
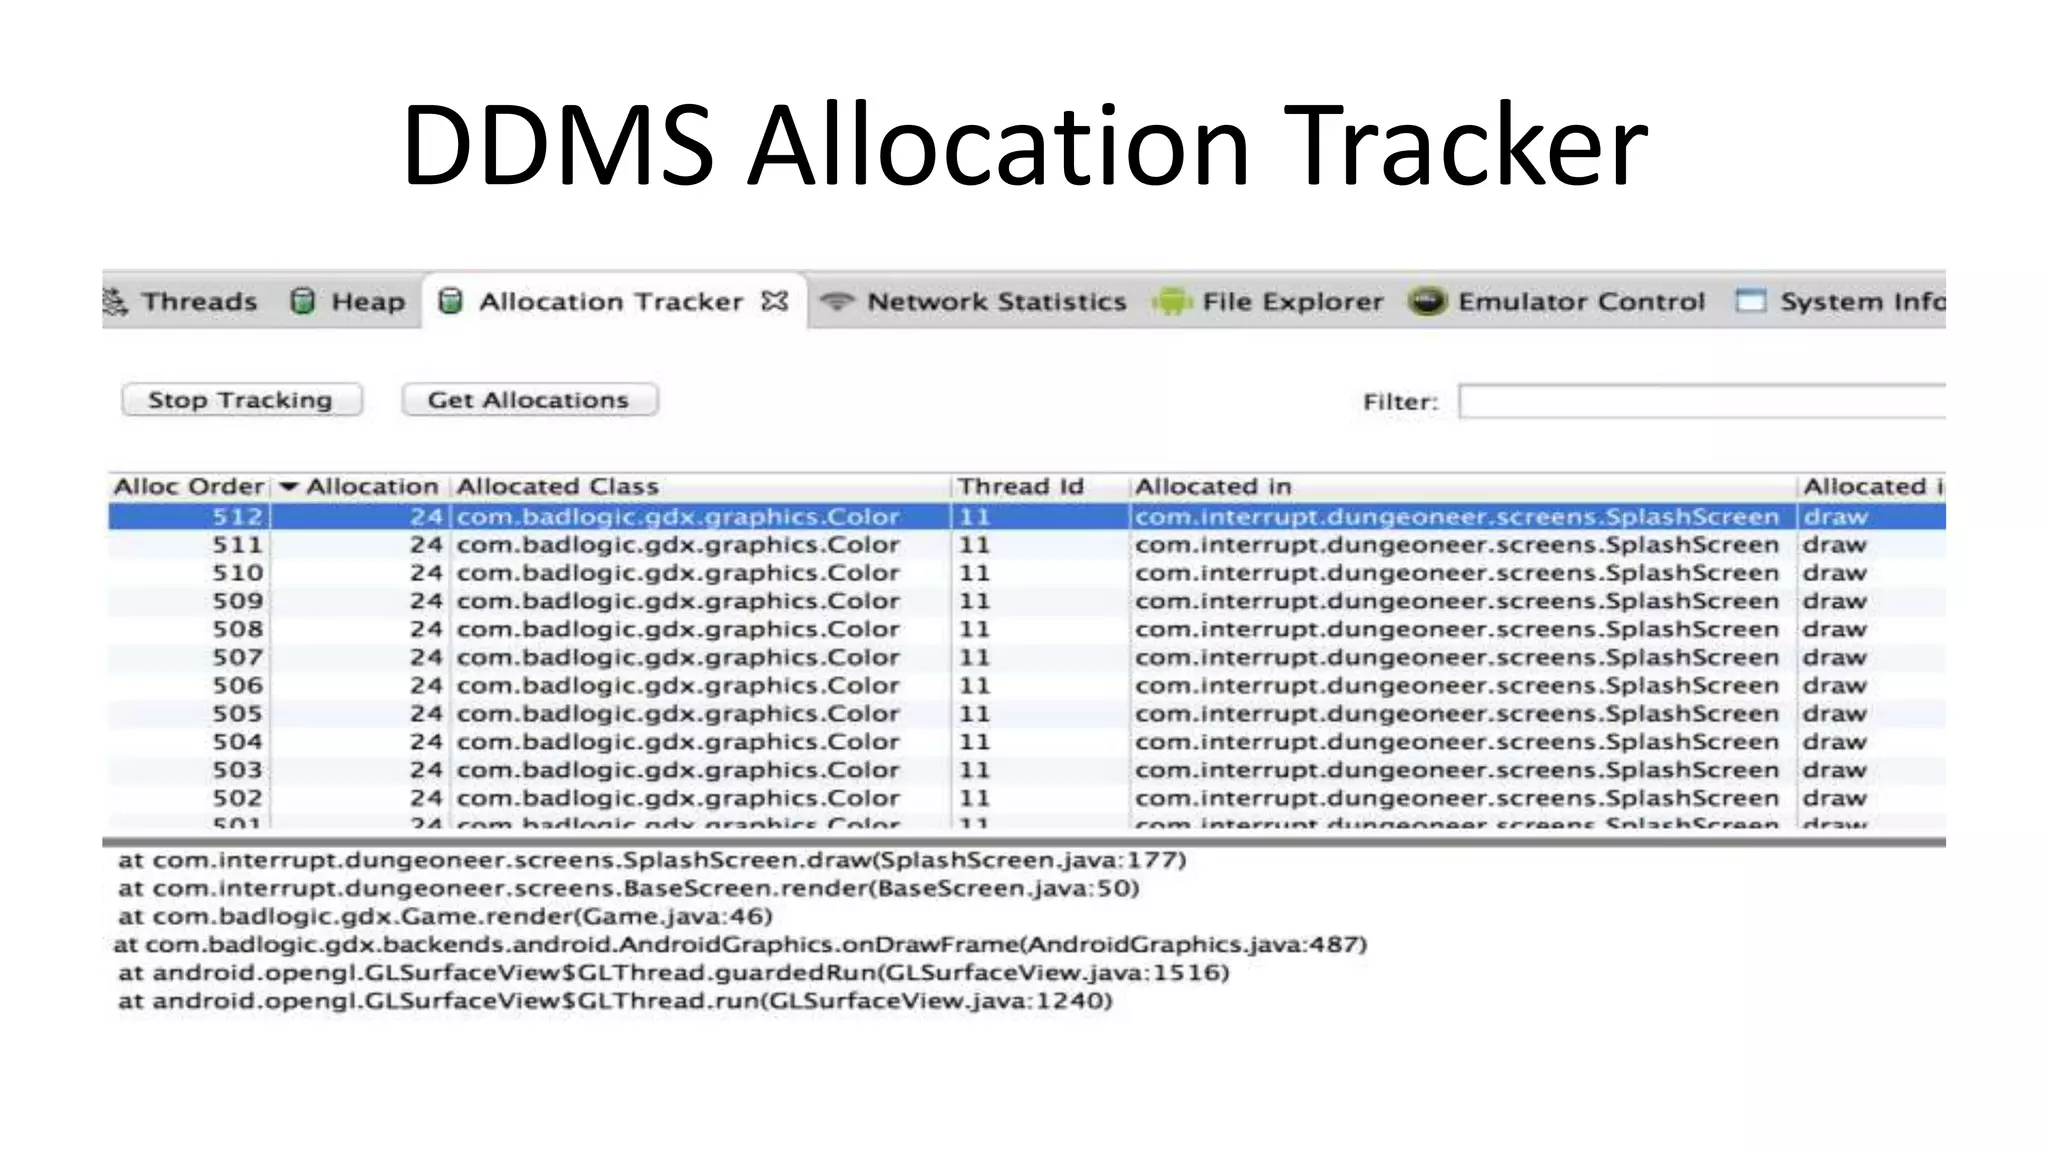
This document discusses various tools for analyzing and optimizing Android application performance and resource usage. It describes how to reduce APK size by minimizing assets, code size, and using expansion files. Memory analysis tools discussed include DDMS Heap View, Allocation Tracker, and Eclipse MAT. Performance can be analyzed using DDMS, Systrace, and native code profilers. Graphics performance is best optimized by reducing overdraw and draw calls, which can be measured using the Overdraw Visualizer and Tracer for OpenGL.
![Who am I?
[2]
[1]
@badlogicgames
http://www.badlogicgames.com](https://image.slidesharecdn.com/appsworld-2013-optimized-131025183039-phpapp02/75/Of-Bytes-Cycles-and-Battery-Life-2-2048.jpg)
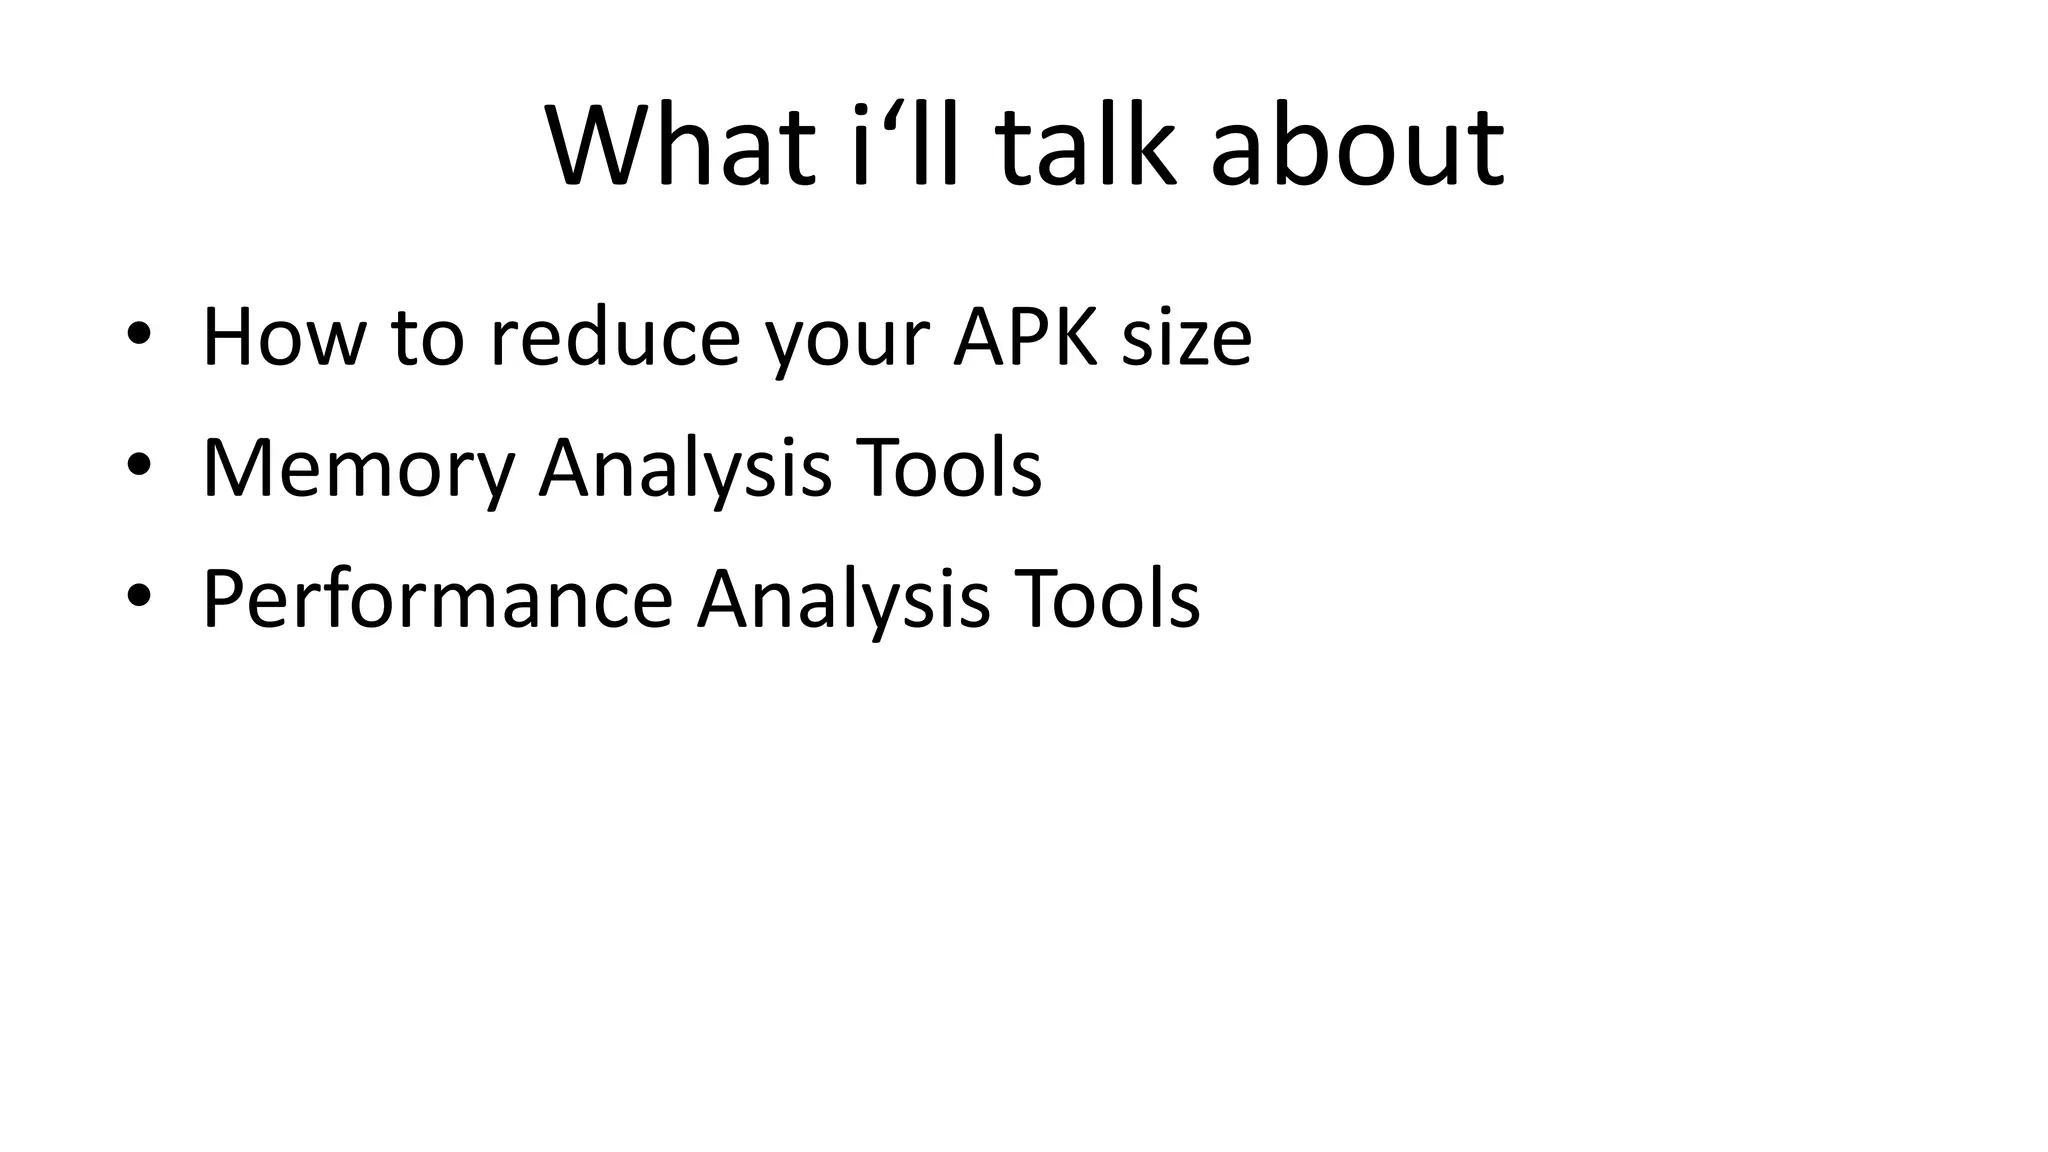
![How to reduce your APK size
• Reduce asset size
– pngcrush your PNGs [3]
– SVG (YMMV) [4]
– lower bit-rates for audio
• Reduce code size
– Remove unnecessary dependencies!
– Proguard, for Class files [5] [6]
– Dexguard, for Dex files [7]](https://image.slidesharecdn.com/appsworld-2013-optimized-131025183039-phpapp02/75/Of-Bytes-Cycles-and-Battery-Life-4-2048.jpg)
![„But i can‘t reduce my APK size“
• Multiple-APKs to the „rescue“ [8]
–
–
–
–
One APK per screen density
One APK per texture compression algorithm
Use Google Play filters
Easier with new Android Gradle build system
• APK Expansion files [9]
– hosted by Google
• Roll your own „Expansion files“
– Avoid if you can!](https://image.slidesharecdn.com/appsworld-2013-optimized-131025183039-phpapp02/75/Of-Bytes-Cycles-and-Battery-Life-5-2048.jpg)
![DDMS [10] Heap View](https://image.slidesharecdn.com/appsworld-2013-optimized-131025183039-phpapp02/75/Of-Bytes-Cycles-and-Battery-Life-7-2048.jpg)
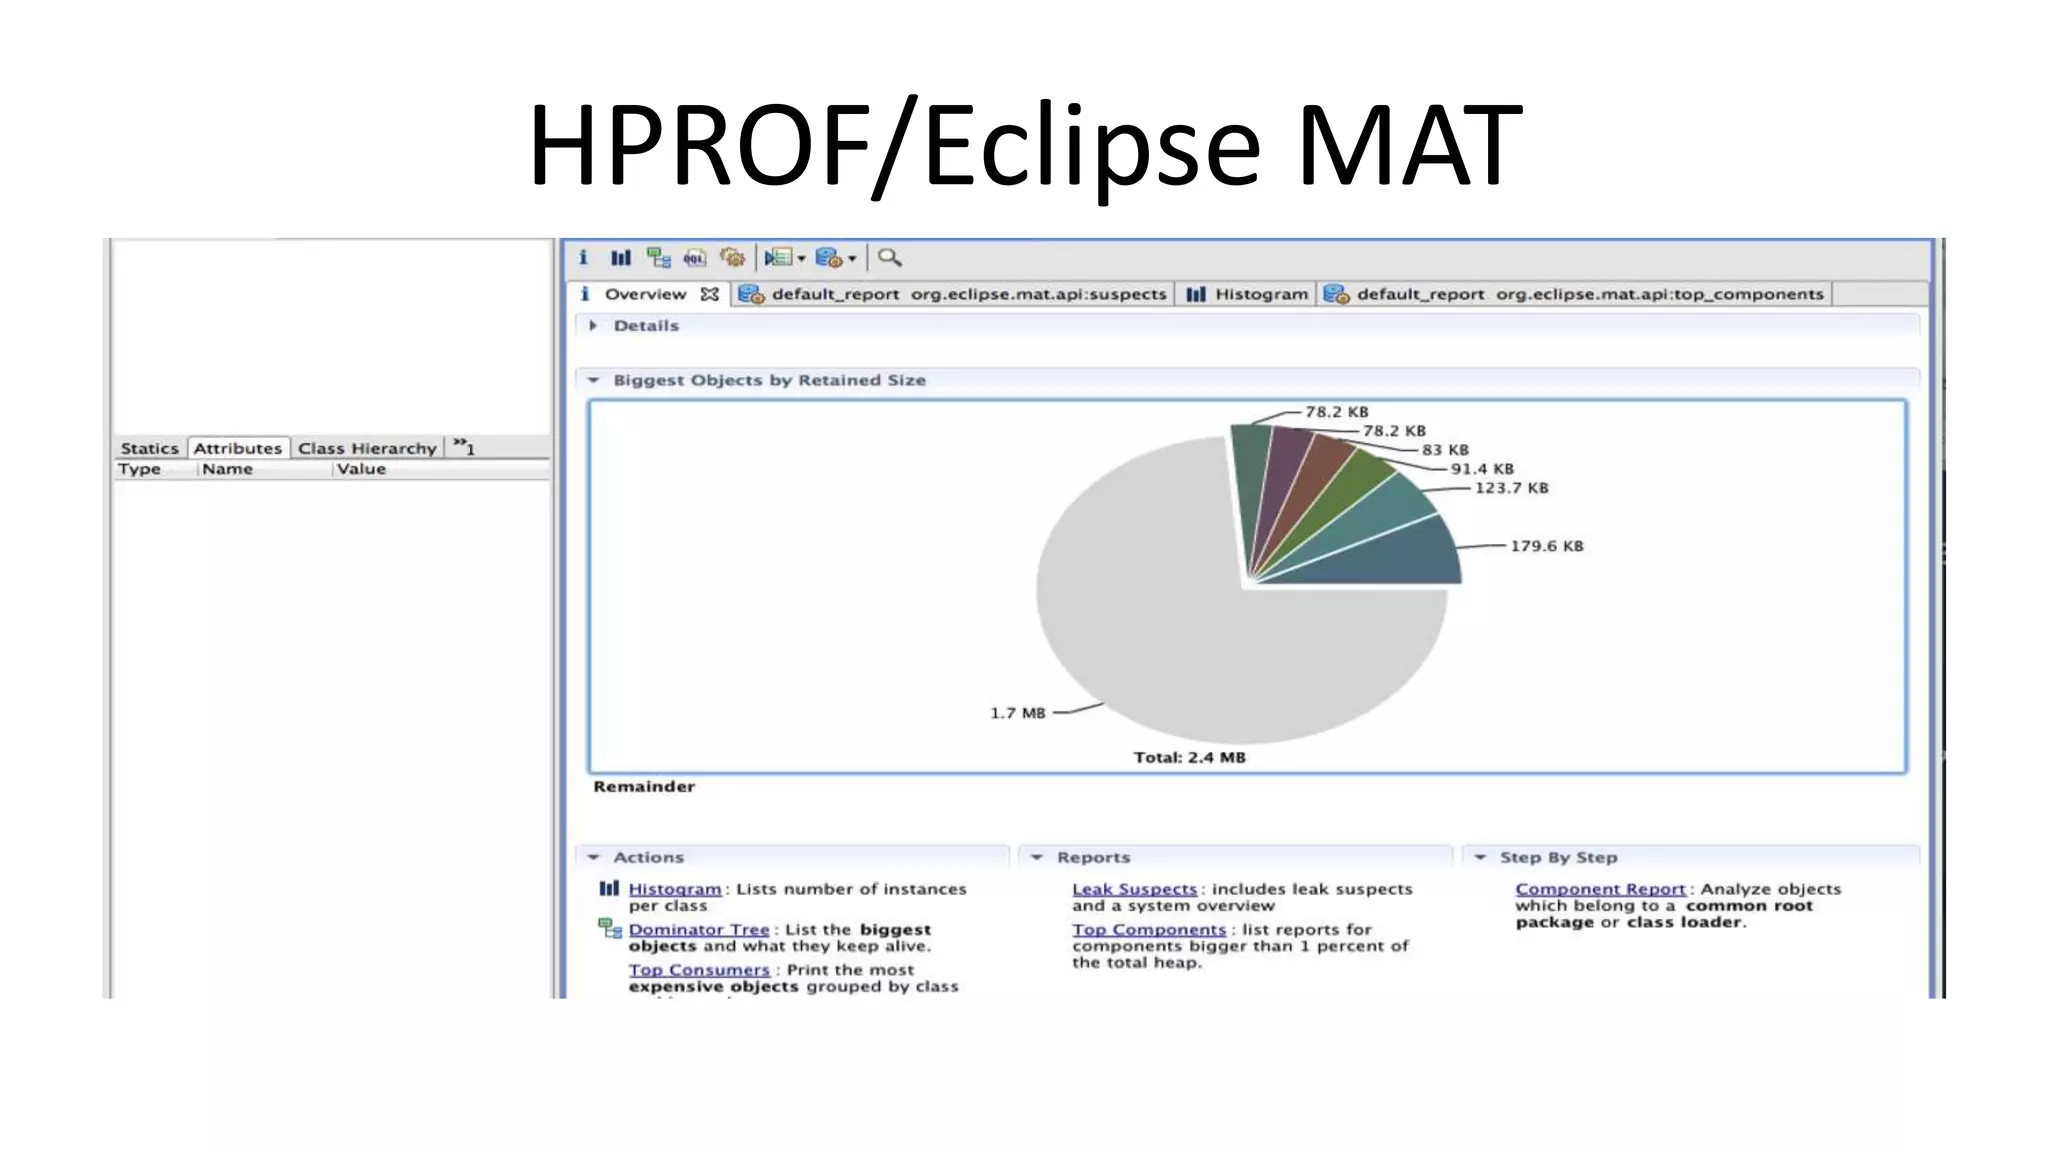
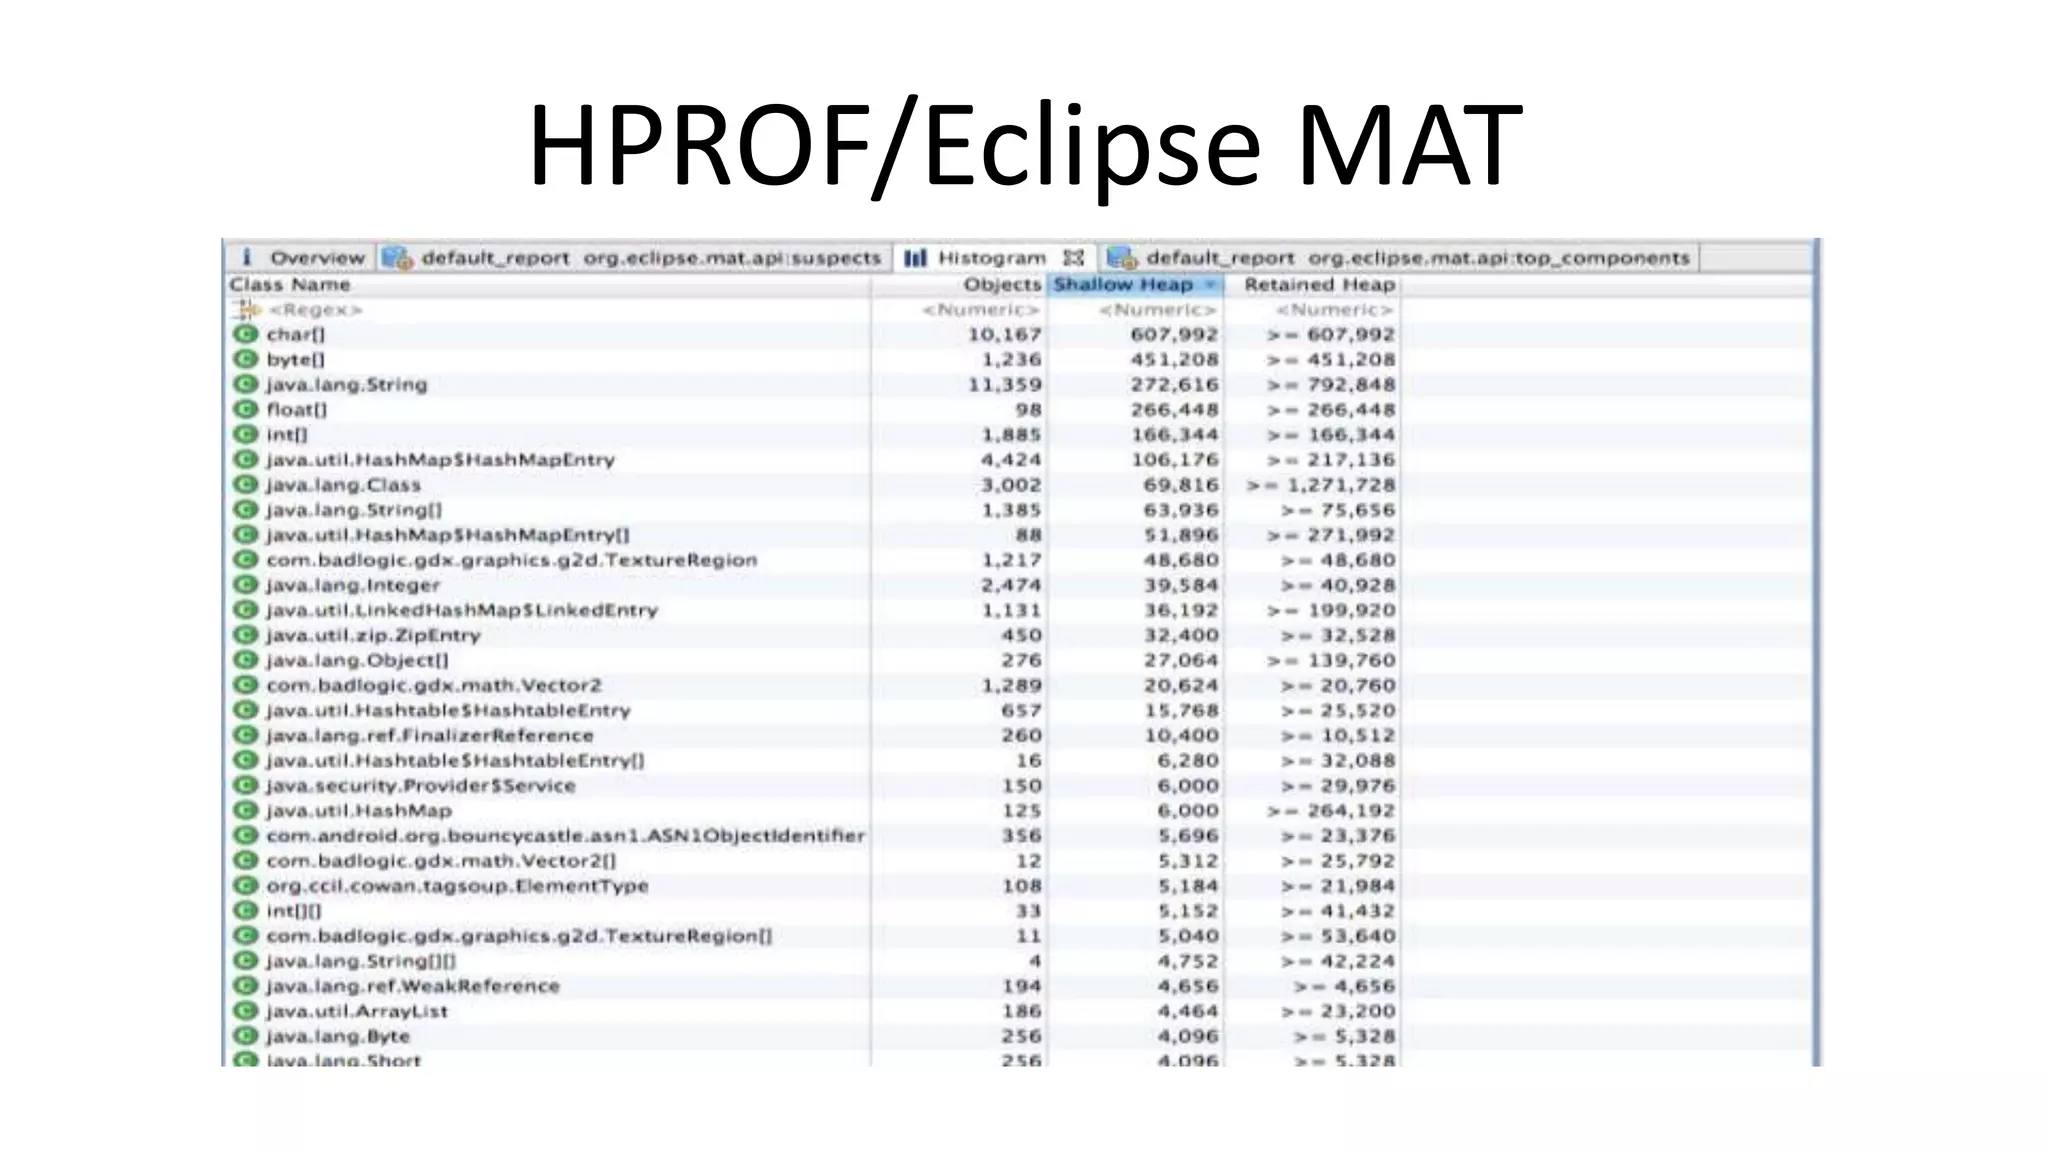
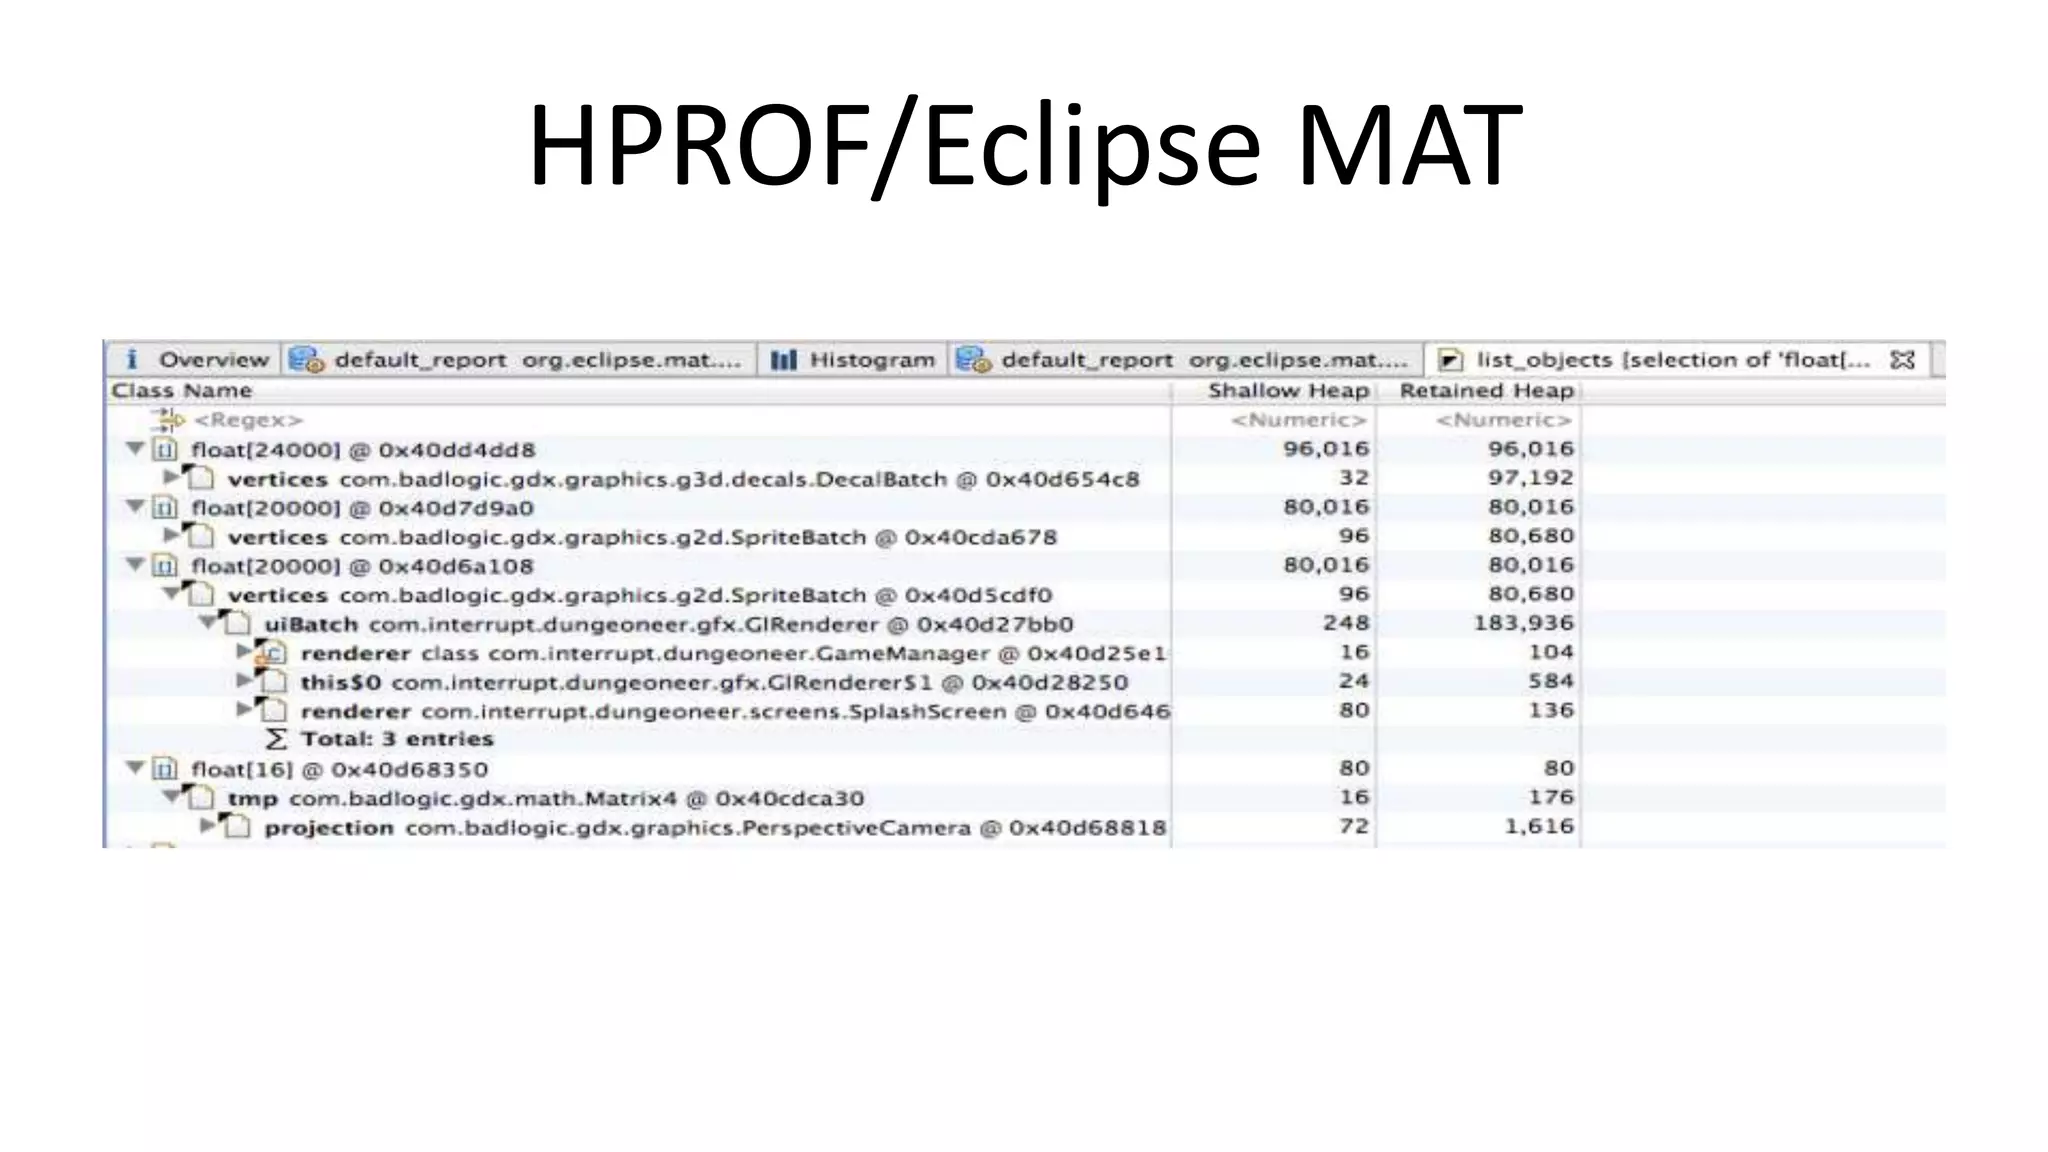
![HPROF/Eclipse MAT [11]
•
•
•
•
Select the process
Click
Save to a location of your choice
Convert to „real“ HPROF file
• Open in Eclipse MAT [12]](https://image.slidesharecdn.com/appsworld-2013-optimized-131025183039-phpapp02/75/Of-Bytes-Cycles-and-Battery-Life-9-2048.jpg)
![Java Profilers
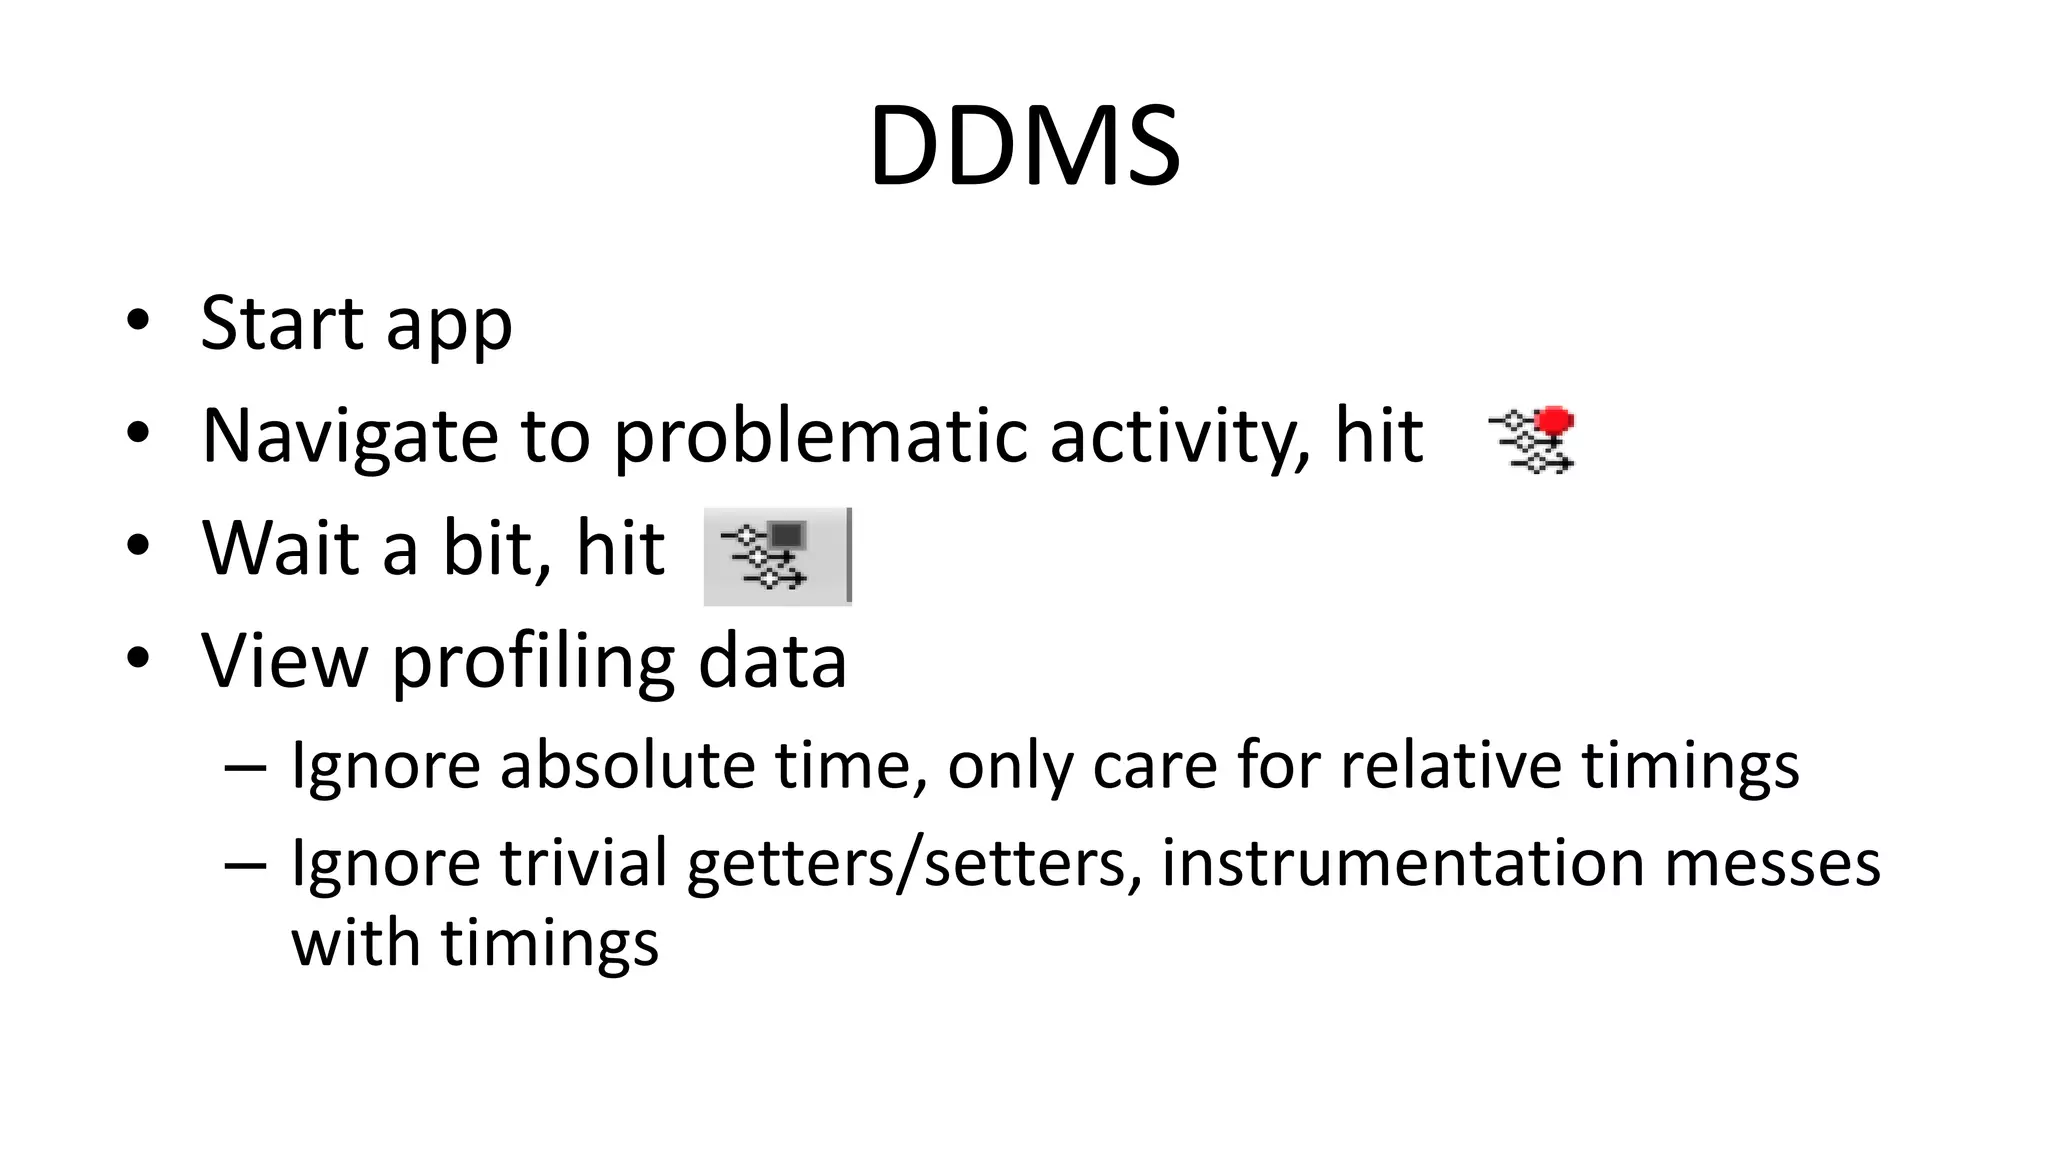
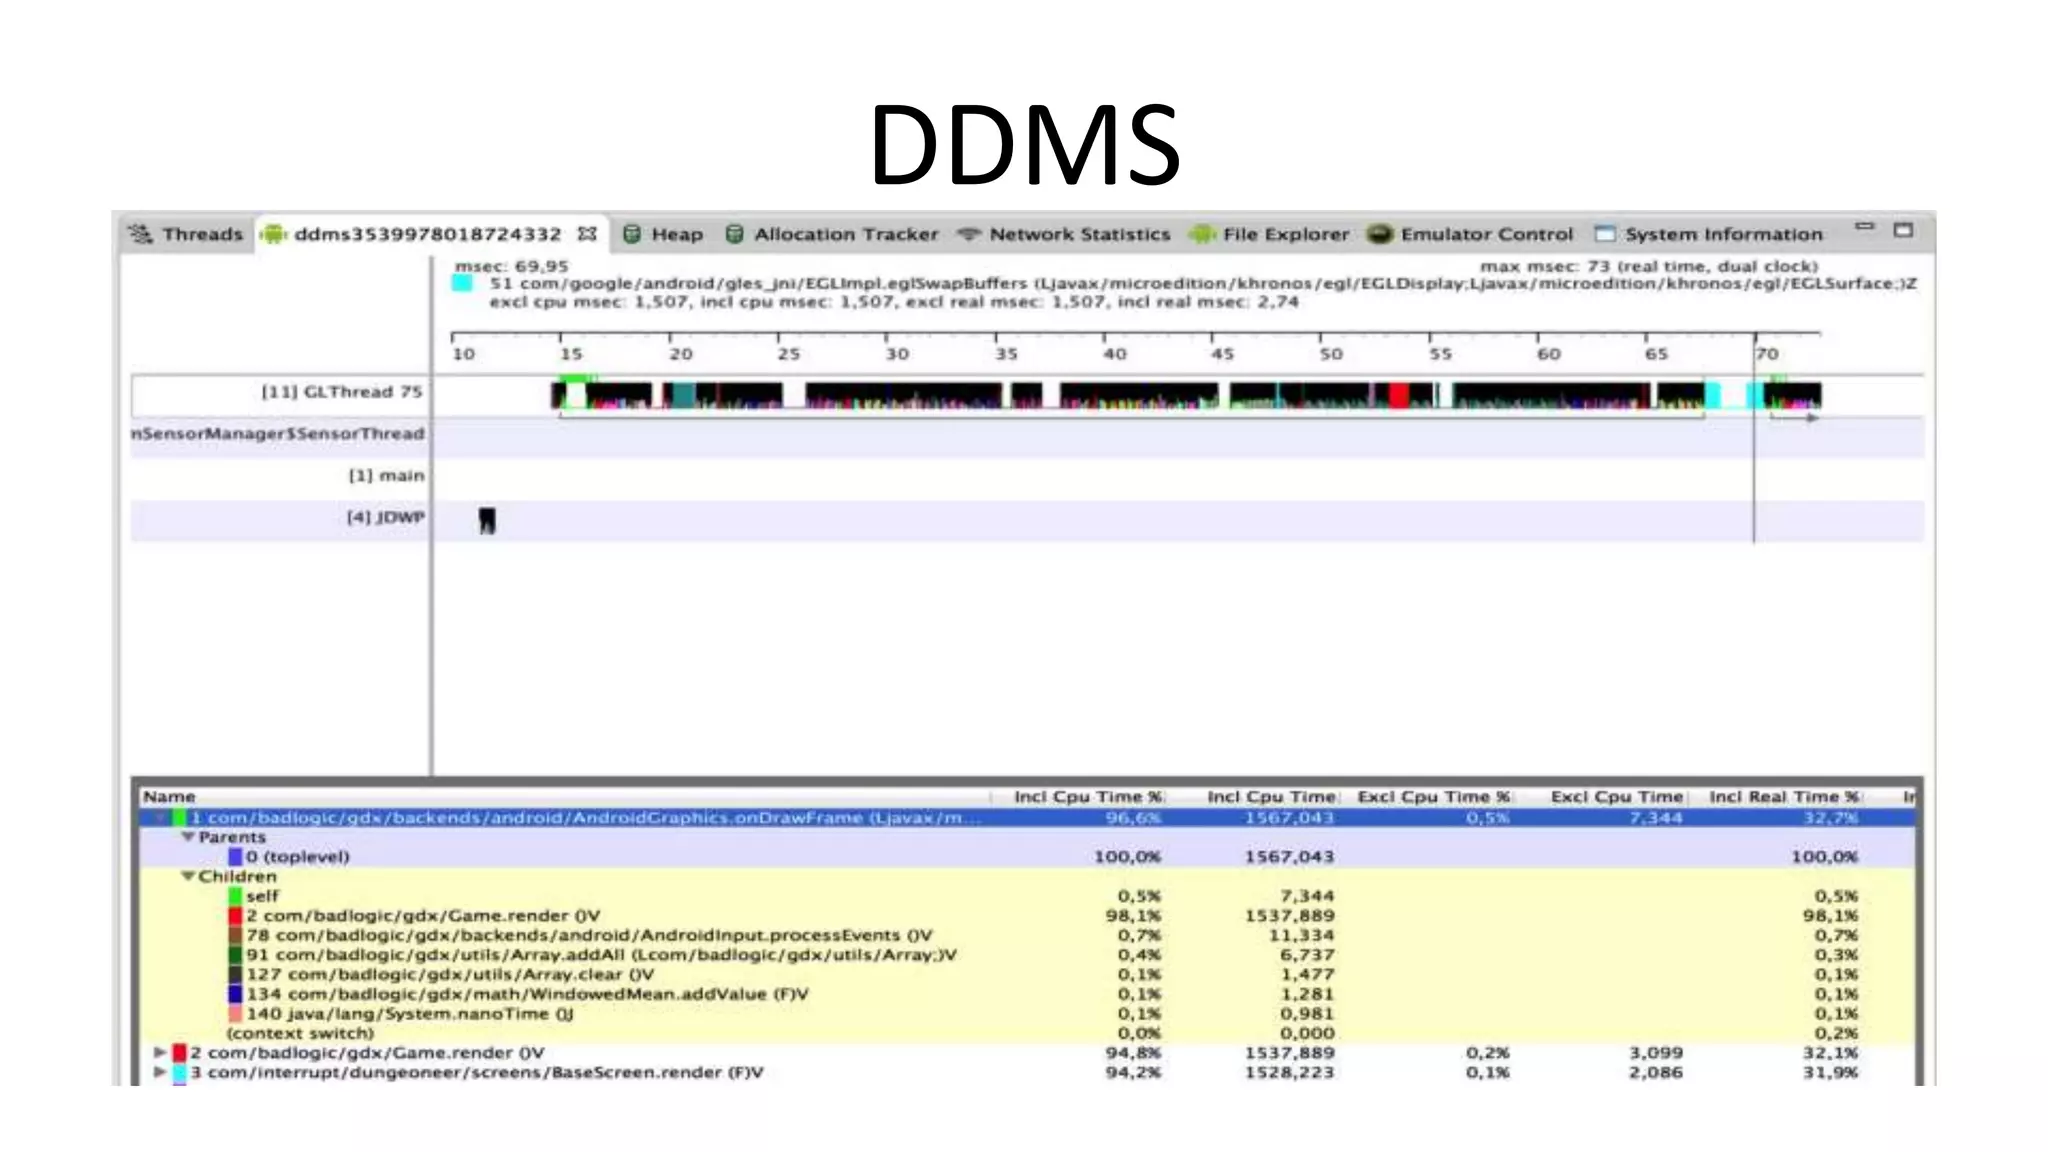
• DDMS
– Quite capable method level profiler
– Good enough for 99% of use cases
– Works with any Android version
• 4.1+ Profiling tools
– Systrace [13], More powerful, also tracks OS calls
• Needs root and Android 4.1+
– We‘ll check out the graphical parts later](https://image.slidesharecdn.com/appsworld-2013-optimized-131025183039-phpapp02/75/Of-Bytes-Cycles-and-Battery-Life-15-2048.jpg)
![Native Code Profilers
• Android NDK Profiler [14]
– Not an official NDK tool
– Setup a bit involved
• Device specific CPU profilers
– NVIDIA Nsight [15], ...
• Roll your own
– Instrument manually
– Track down hotspots](https://image.slidesharecdn.com/appsworld-2013-optimized-131025183039-phpapp02/75/Of-Bytes-Cycles-and-Battery-Life-18-2048.jpg)
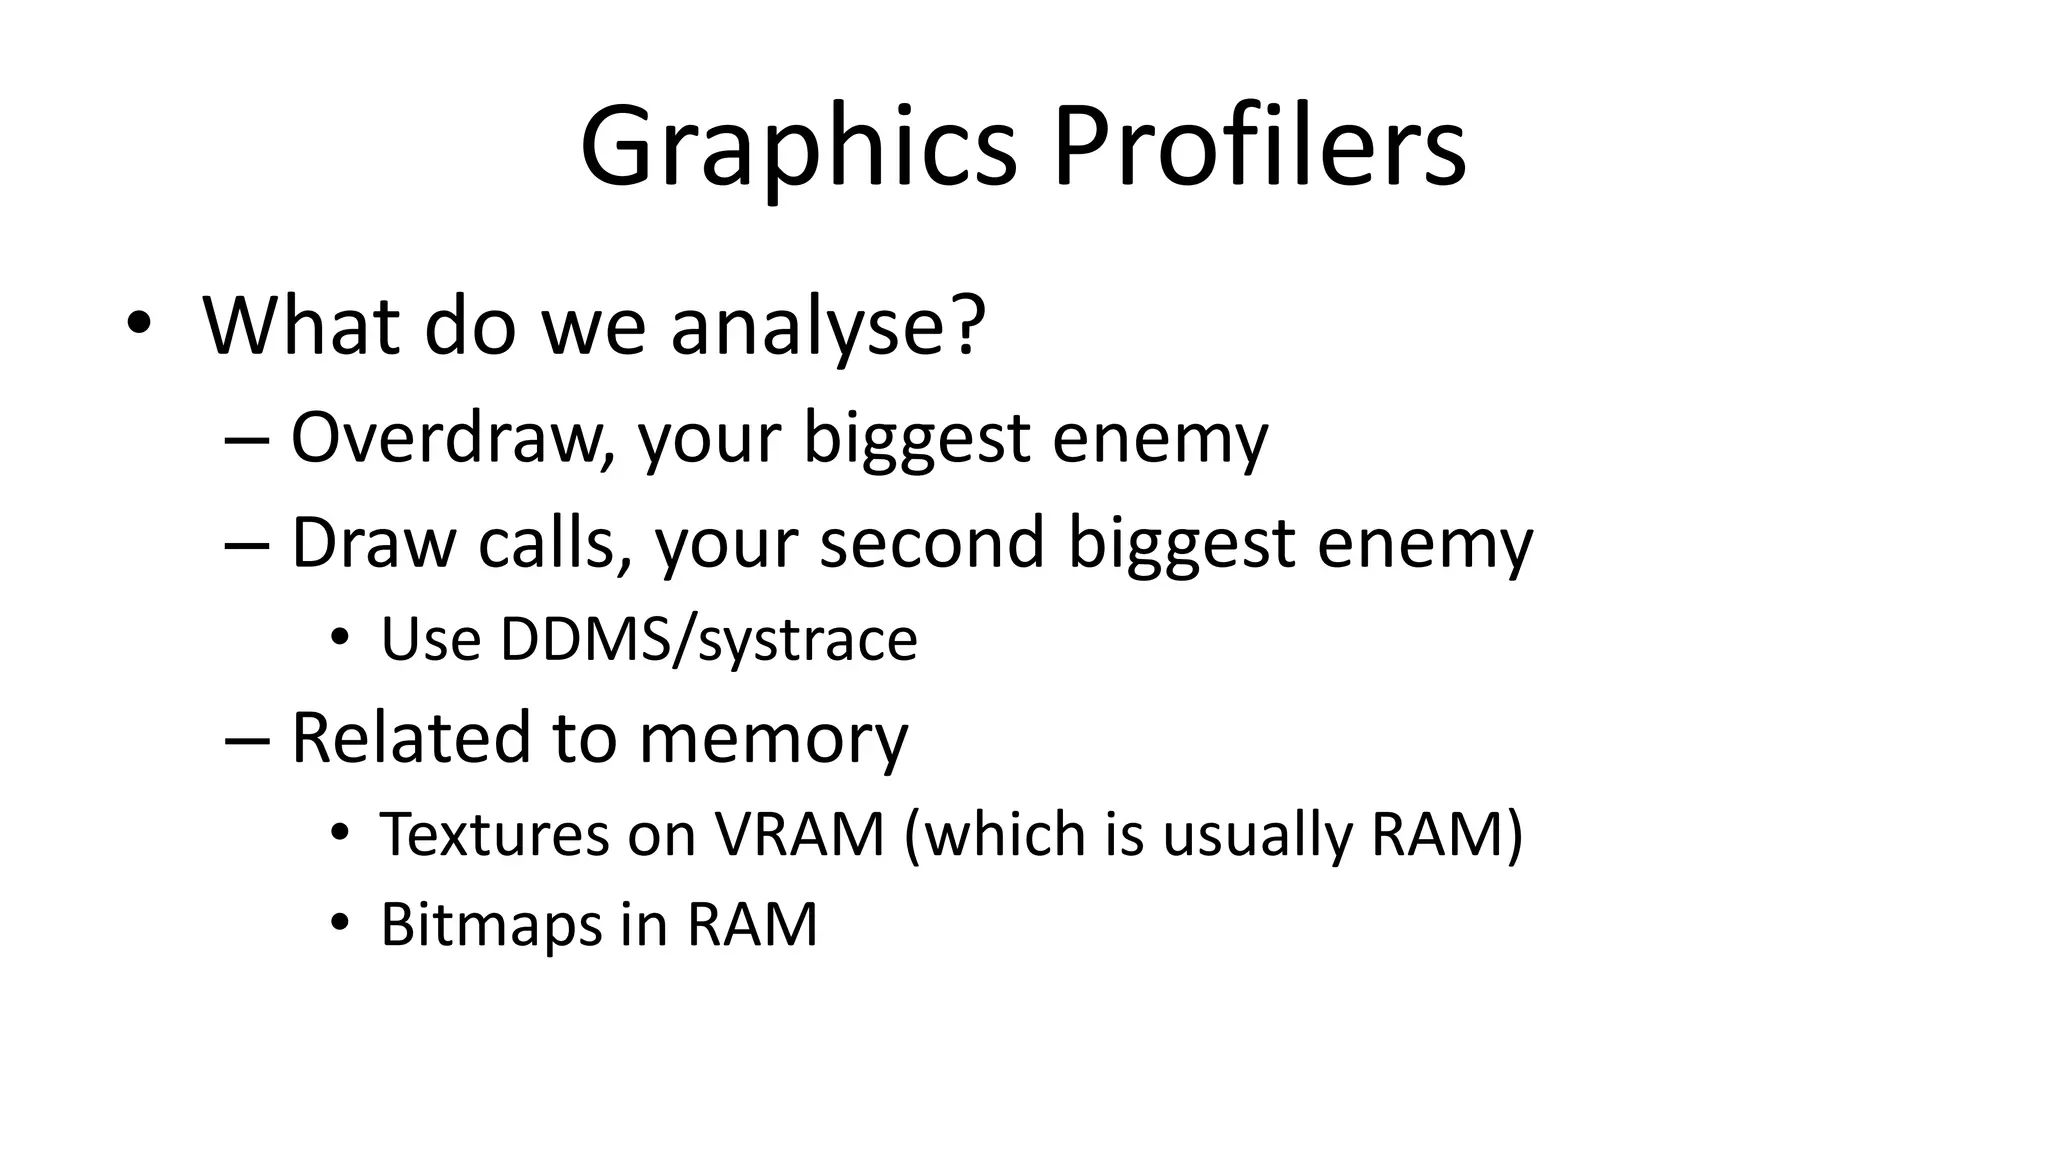
![Graphics Profilers
• 4.1+ Profiling tools
• GPU Vendor Specific
– NVIDIA [16], Qualcomm [17], Imagination
Technologies [18]
– Outside of scope of this talk](https://image.slidesharecdn.com/appsworld-2013-optimized-131025183039-phpapp02/75/Of-Bytes-Cycles-and-Battery-Life-20-2048.jpg)
![Visualize Overdraw [19]](https://image.slidesharecdn.com/appsworld-2013-optimized-131025183039-phpapp02/75/Of-Bytes-Cycles-and-Battery-Life-21-2048.jpg)
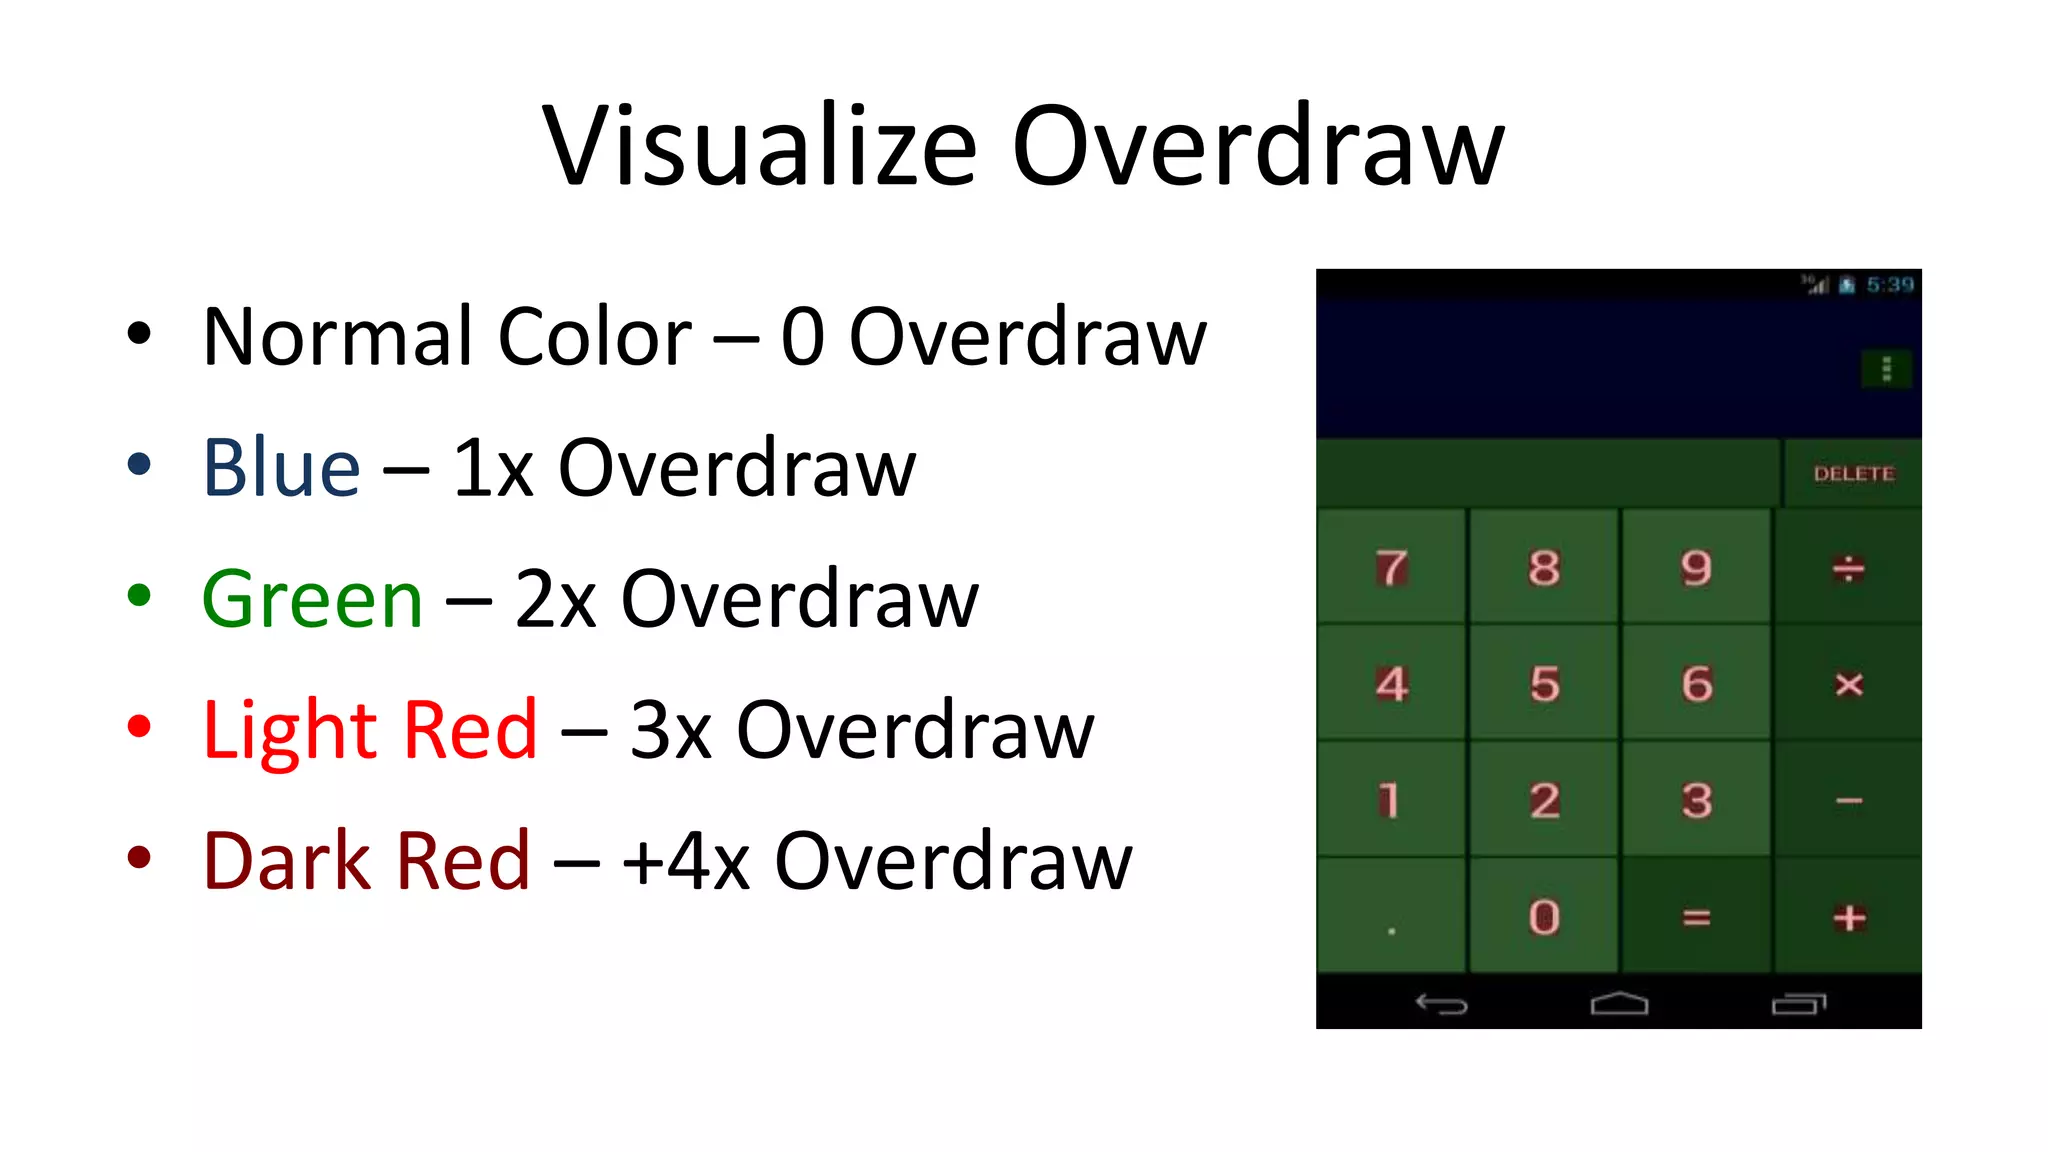
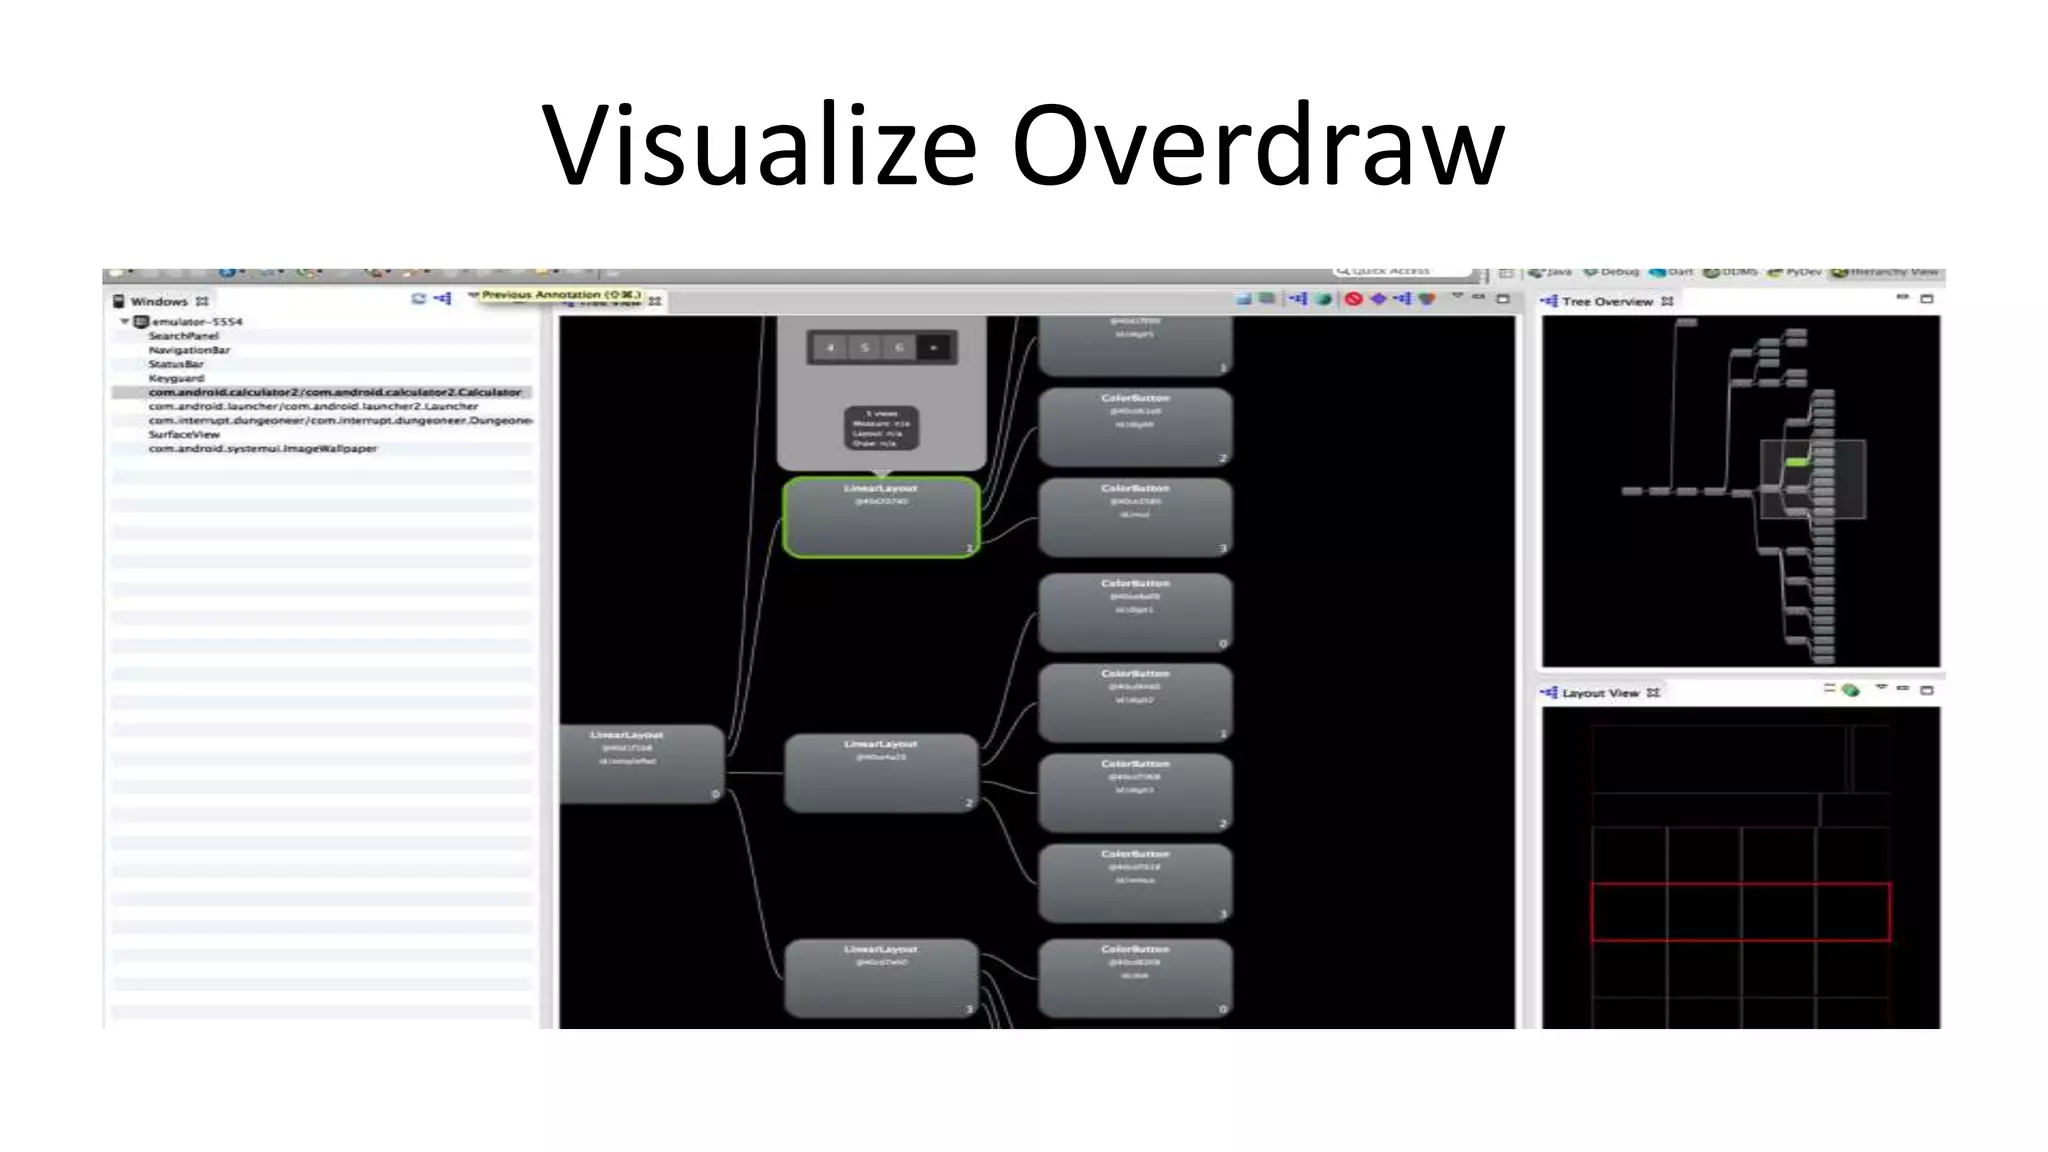
![Visualize Overdraw
• Hierarchy View [20]
• Window -> Open Perspective -> Other...](https://image.slidesharecdn.com/appsworld-2013-optimized-131025183039-phpapp02/75/Of-Bytes-Cycles-and-Battery-Life-23-2048.jpg)
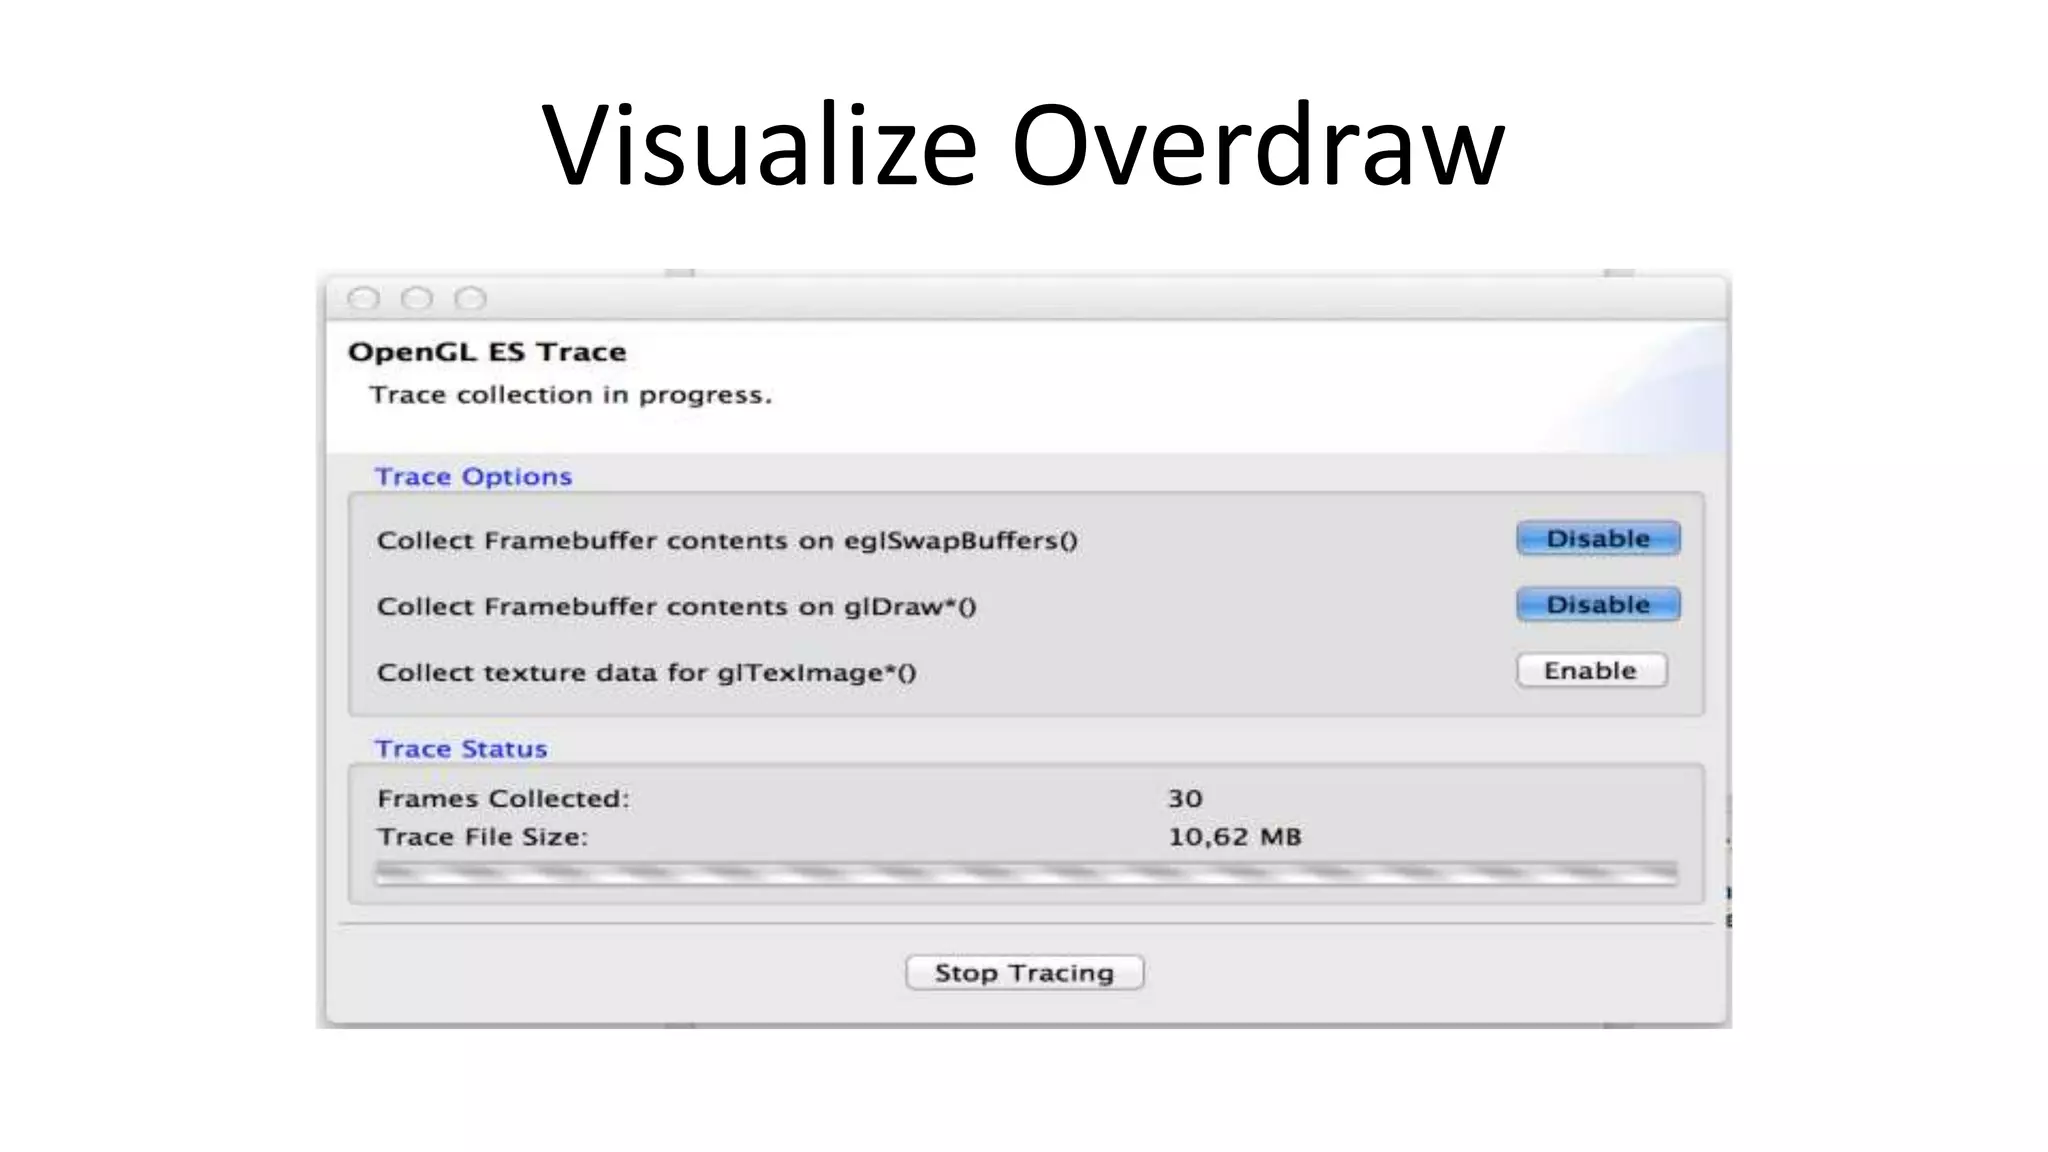
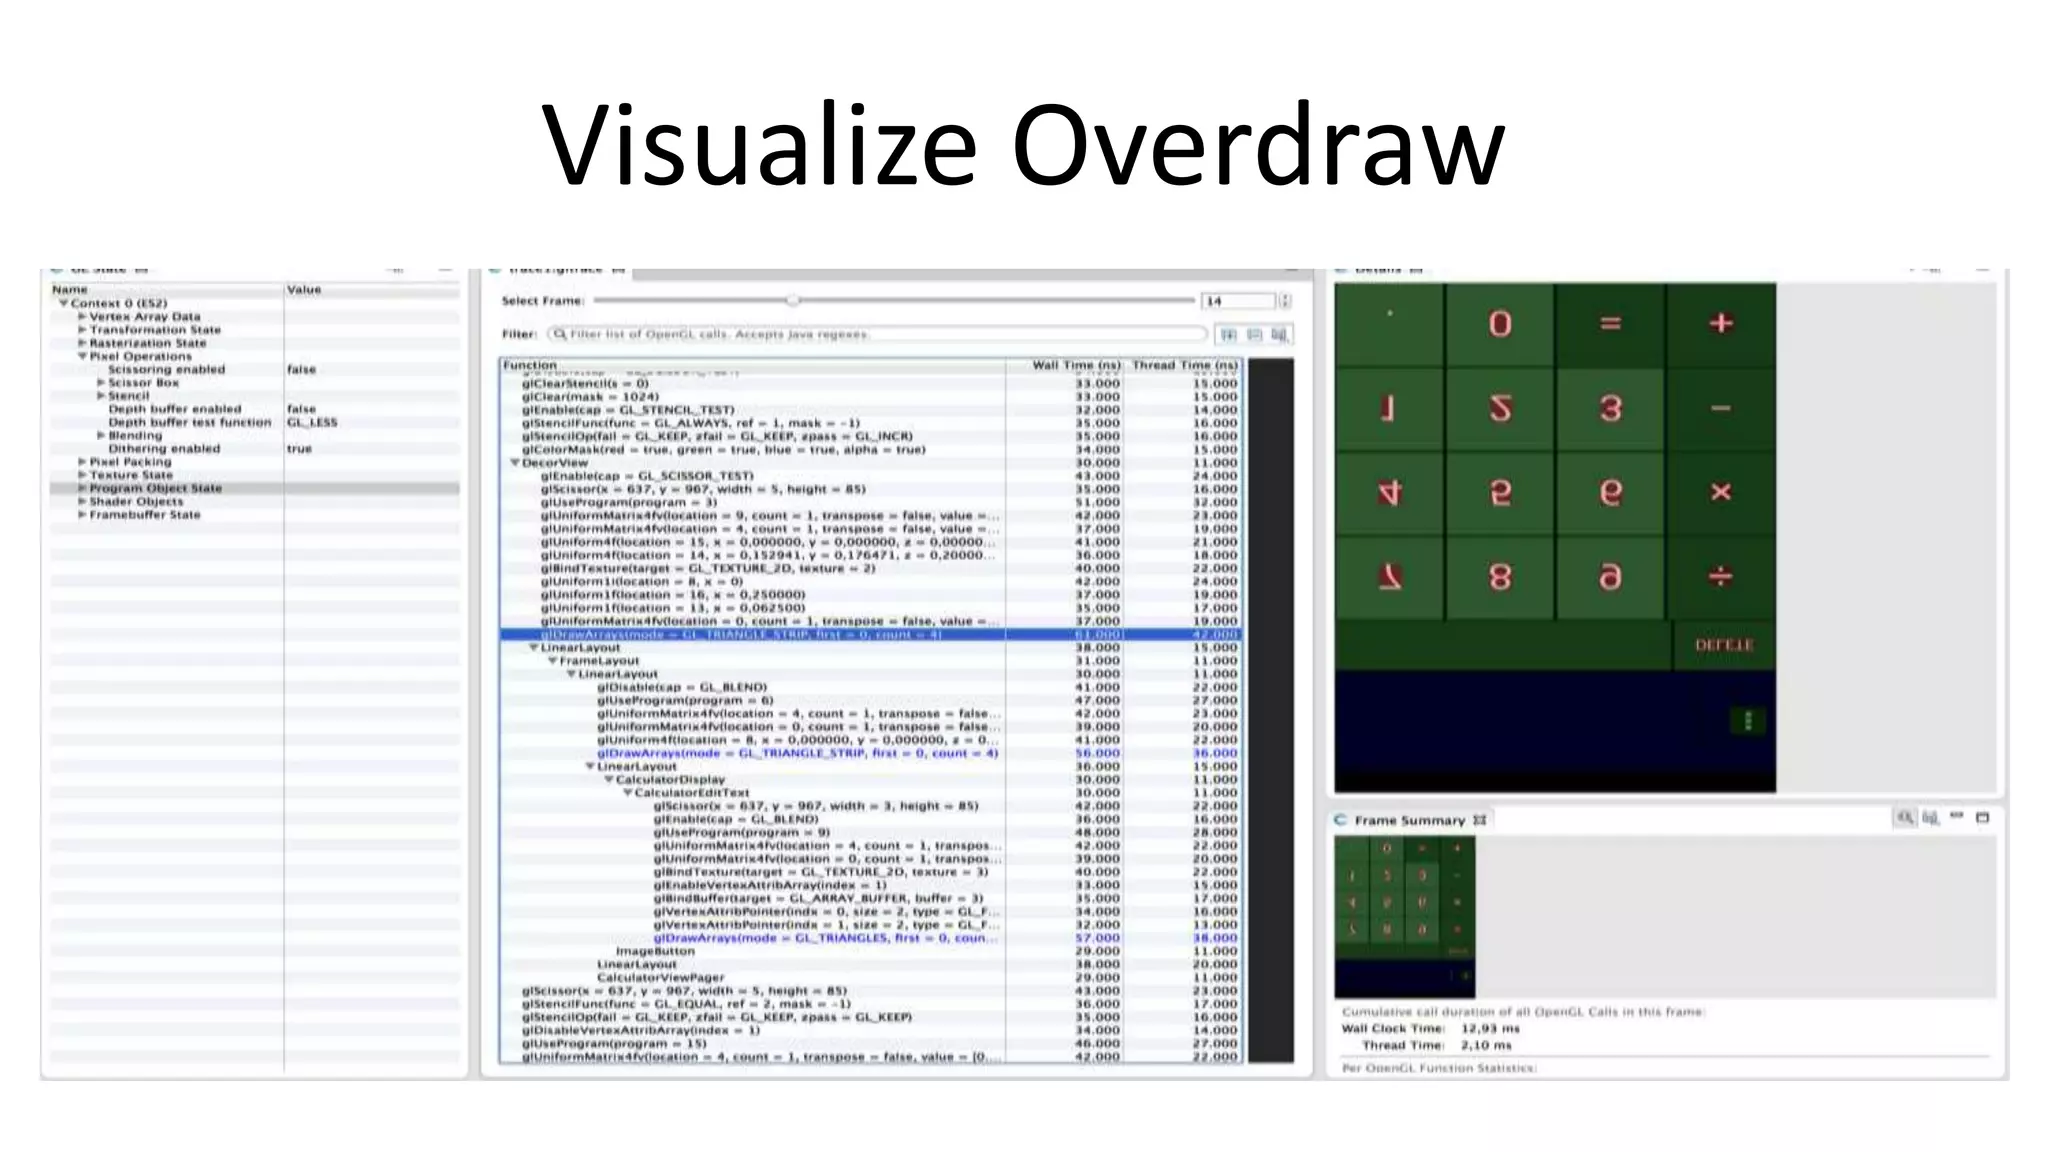
![Visualize Overdraw
•
•
•
•
•
Tracer for OpenGL [21]
Window -> Open Perspective -> Other ...
Click
Enter package name
Wait](https://image.slidesharecdn.com/appsworld-2013-optimized-131025183039-phpapp02/75/Of-Bytes-Cycles-and-Battery-Life-25-2048.jpg)
![Closing Words
• So much to tell, so little time
• See Dalvik Performance Tips [22]
• Read all references
– Your users will thank you for excellent battery life
and buttery smooth UIs](https://image.slidesharecdn.com/appsworld-2013-optimized-131025183039-phpapp02/75/Of-Bytes-Cycles-and-Battery-Life-28-2048.jpg)

![References
[1] http://www.amazon.com/Beginning-Android-Games-Mario-Zechner/dp/1430246774
[2] http://libgdx.badlogicgames.com/
[3] http://pmt.sourceforge.net/pngcrush/
[4] https://code.google.com/p/svg-android/
[5] http://developer.android.com/tools/help/proguard.html
[6] http://proguard.sourceforge.net/index.html
[7] http://www.saikoa.com/dexguard
[8] http://developer.android.com/google/play/publishing/multiple-apks.html
[9] http://developer.android.com/google/play/expansion-files.html
[10] http://developer.android.com/tools/debugging/ddms.html
[11] http://android-developers.blogspot.co.at/2011/03/memory-analysis-for-android.html](https://image.slidesharecdn.com/appsworld-2013-optimized-131025183039-phpapp02/75/Of-Bytes-Cycles-and-Battery-Life-30-2048.jpg)
![References
[12] http://www.eclipse.org/mat/
[13] http://developer.android.com/tools/help/systrace.html
[14] https://code.google.com/p/android-ndk-profiler/
[15] http://www.nvidia.com/object/nsight.html
[16] https://developer.nvidia.com/tegra-profiler
[17] https://developer.qualcomm.com/mobile-development/mobile-technologies/gaming-graphics-optimization-adreno/toolsand-resources
[18] http://www.imgtec.com/powervr/insider/sdkdownloads/
[19] http://www.curious-creature.org/2012/12/01/android-performance-case-study/
[20] http://developer.android.com/tools/debugging/debugging-ui.html
[21] http://developer.android.com/tools/help/gltracer.html
[22] http://developer.android.com/training/articles/perf-tips.html](https://image.slidesharecdn.com/appsworld-2013-optimized-131025183039-phpapp02/75/Of-Bytes-Cycles-and-Battery-Life-31-2048.jpg)


![Vibe Coding vs. Spec-Driven Development [Free Meetup]](https://cdn.slidesharecdn.com/ss_thumbnails/vibecodingvsspecdrivendevelopment-251209105622-43f455e7-thumbnail.jpg?width=640&height=640&fit=bounds)


