Download to read offline


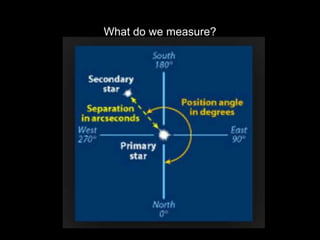
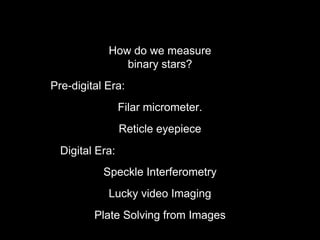
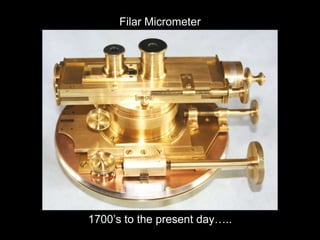
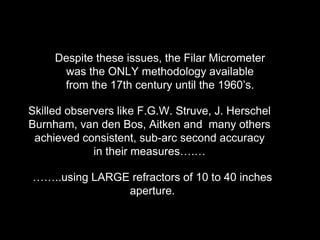
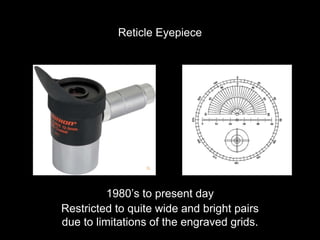
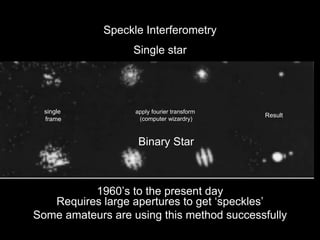
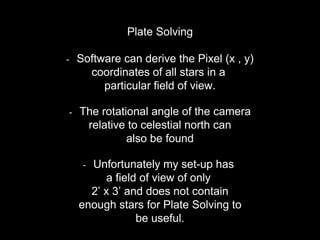
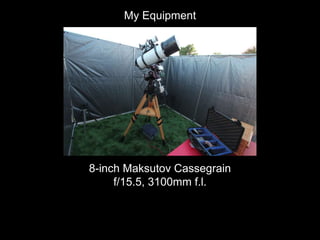


1) The document describes methods for measuring visual binary stars using an 8-inch telescope. Key methods discussed include the filar micrometer, reticle eyepiece, speckle interferometry, lucky imaging, and plate solving. 2) Lucky imaging involves taking a short video, aligning and stacking frames to produce a high-quality image, and then measuring the position angle and separation of the binary stars. 3) Accurate calibration of the plate scale and position angle is important for obtaining precise measurements. The document outlines methods for calibrating these values using a diffraction grating and drift images rather than relying on measurements of other binary stars.


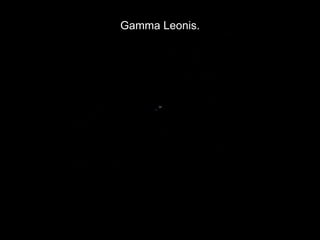
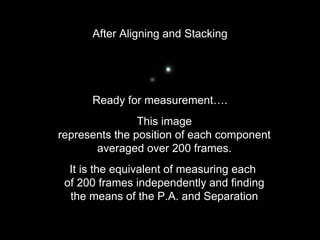
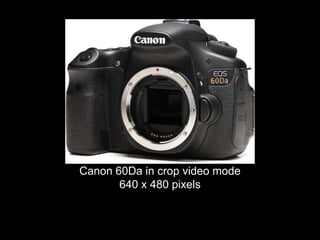
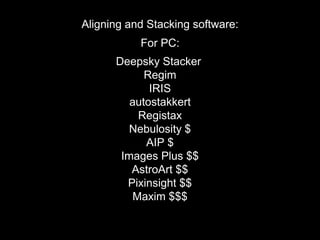
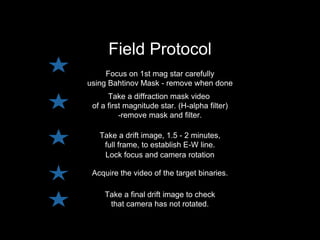
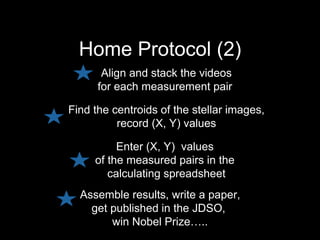
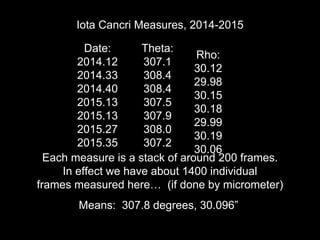
![Polymer [ बहुलक ] Chemistry Notes PDF - Irfanullah Mehar - JJ Sir Chemistry.pdf](https://cdn.slidesharecdn.com/ss_thumbnails/polymerchemistrynotespdf-irfanullahmehar-jjsirchemistry-260210172118-3f9b37f7-thumbnail.jpg?width=640&height=640&fit=bounds)


