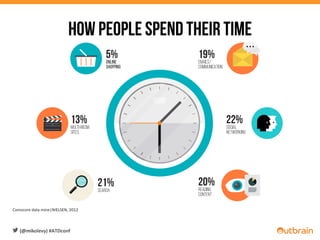
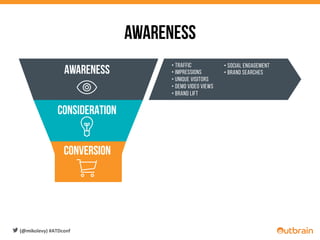
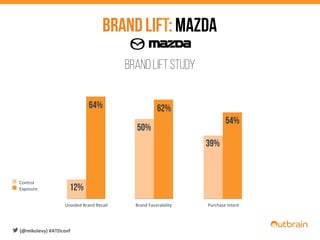
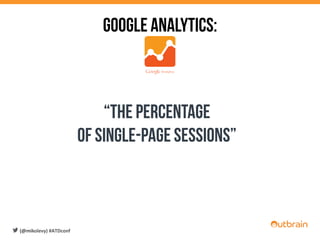
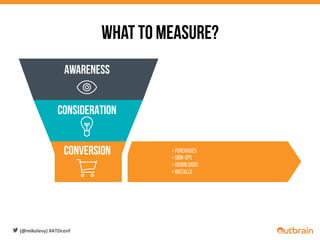
Measuring content down your funnel
April 20 | 2015
Miko	
  Levy	
  
Outbrain	
  Inc,	
  VP	
  Customer	
  Acquisi6on	
  
(@mikolevy)	
  #ATDconf	


Nice to meet you
Miko	
  Levy	
  
36	
  	
  years	
  old,	
  Married+1	
  
9	
  years	
  in	
  the	
  online	
  
performance	
  
marke6ng	
  world	
  
Previously	
  @	
  888.com,	
  
ROASTe	
  &	
  Conduit	
  
Marathon	
  runner	
  
(coming	
  back	
  from	
  injury)	
  
VP	
  customer	
  
acquisi6on@Outbrain	
  
(@mikolevy)	
  #ATDconf	


Outbrain helps readers discover content
(@mikolevy)	
  #ATDconf	


561+ Million
Unique visitors
20+billion
Page views
190 BILLION
Recommendations
OVER 82%
INTERNET REACH IN USA
(@mikolevy)	
  #ATDconf	


WE BRING TOGETHER THE WORLD'S LEADING
PUBLISHERS AND BRANDS
(@mikolevy)	
  #ATDconf	


(@mikolevy)	
  #ATDconf	


The customer journey
Discovery
Realization of need
Consideration
Conversion
Retention
(@mikolevy)	
  #ATDconf	


It takes 10.4 sources of information to make a
purchase decision
(@mikolevy)	
  #ATDconf	


Comscore	
  data	
  mine|NIELSEN,	
  2012	
  
22%SOCIAL
NETWORKING
21%SEARCH
19%EMAILS/
COMMUNICATION
20%READING
CONTENT
5%ONLINE
SHOPPING
13%MULTI-MEDIA
SITES
How People Spend Their Time
(@mikolevy)	
  #ATDconf	


Recommenda6ons	
  from	
  people	
  I	
  know	
  
Branded	
  websites	
  
Consumer	
  opinions	
  posted	
  online	
  
Editorial	
  content	
  such	
  as	
  newspaper	
  ar6cles	
  
Ads	
  on	
  TV	
  
Brand	
  sponsorships	
  
Ads	
  in	
  newspaper	
  
Ads	
  in	
  magazines	
  
Billboards	
  and	
  other	
  outdoor	
  adver6sing	
  
Ads	
  on	
  radio	
  
Emails	
  I	
  signed	
  up	
  for	
  
Ads	
  before	
  movies	
  
TV	
  program	
  product	
  placement	
  
Ads	
  served	
  in	
  search	
  engine	
  results	
  
Online	
  video	
  ads	
  
Ads	
  on	
  social	
  networks	
  
Display	
  ads	
  on	
  mobile	
  devices	
  
Online	
  banner	
  ads	
  	
  
Text	
  ads	
  on	
  mobile	
  phone	
  
84%	
  
69%	
  
68%	
  
67%	
  
62%	
  
61%	
  
61%	
  
60%	
  
57%	
  
57%	
  
56%	
  
55%	
  
56%	
  
48%	
  
48%	
  
48%	
  
45%	
  
42%	
  
37%	
  
%	
  point	
  change	
  
from	
  2007	


6%	
  
9%	
  
7%	
  
N/A	
  
6%	
  
12%	
  
-­‐2%	
  
4%	
  
N/A	
  
3%	
  
7%	
  
18%	
  
N/A	
  
14%	
  
N/A	
  
N/A	
N/A	
  
16%	
  
19%	
  
%	
  of	
  global	
  online	
  consumers,	
  indica6ng	
  that	
  they	
  completely	
  or	
  somewhat	
  trust	
  each	
  form	
  
Source:	
  Nielsen	
  |	
  September	
  13’	
  
Trust in Advertising
(@mikolevy)	
  #ATDconf	


of	
  consumers	
  like	
  
reading	
  from	
  brands	
  
if	
  it’s	
  valuable	


82%
(@mikolevy)	
  #ATDconf	
  
digital marketing trends for 2015
Content	
  Marke6ng	
   29.6%	
  
14.6%	
  
12.8%	
  
Big	
  Data	
  
Marke6ng	
  Automa6on	
  
Mobile	
  Marke6ng	
   11.0%	
  
8.9%	
  Social	
  media	
  marke6ng	
  and	
  CRM	
  
CRO/Improving	
  website	
  experiences	
  
SEO	
  
Communi6es	
  
Paid	
  search	
  marke6ng	
  
Partnerships	
  
Display	
  
Other	
  
Online	
  PR	
  
7.8%	
  
4.3%	
  
3.1%	
  
3.0%	
  
1.5%	
  
1.5%	
  
1.5%	
  
1.0%	
  
The	
  State	
  of	
  Digital	
  Marke6ng	
  in	
  2015	
  
Source:	
  Smart	
  Insights|	
  January	
  15’	
  
(@mikolevy)	
  #ATDconf	


So how do we measure it?
(@mikolevy)	
  #ATDconf	


AWARENESS	


CONSIDERATION	


Conversion
What to measure?
(@mikolevy)	
  #ATDconf	


AWARENESS	


CONSIDERATION	


Conversion
• Traffic
• Impressions
• Unique visitors
• Demo video views
• Brand Lift
awareness
• Social Engagement
• Brand Searches
(@mikolevy)	
  #ATDconf	


BrandLift:Mazda
(@mikolevy)	
  #ATDconf	
  
BrandLift:Mazda
Brand Lift Study
Control Exposure
(@mikolevy)	
  #ATDconf	
  
BrandLift:Mazda
Brand Lift Study
Unaided	
  Brand	
  Recall	
   Brand	
  Favorability	
   Purchase	
  Intent	
  
12%
Control	
  
Exposure	
  
64% 62%
50%
54%
39%
(@mikolevy)	
  #ATDconf	
  
•  Usually	
  for	
  the	
  bigger	
  brands	
  	
  
• Requires	
  research	
  
•  Not	
  something	
  you’ll	
  see	
  
on	
  Google	
  Analy6cs	
  
• Less	
  tangible	
  
Awareness
(@mikolevy)	
  #ATDconf	


AWARENESS	


CONSIDERATION	


Conversion
• Time spent on content
• Page views per session
• Content scroll downs
• Bounce rate
• Return visitors
• Social lift
• Search lift
What to measure?
(@mikolevy)	
  #ATDconf	
  
Bounce Rate
Google Analytics:
“the percentage
of single-page sessions”
(@mikolevy)	
  #ATDconf	
  
Google Analytics:
In other words, a page’s bounce rate is
the percentage of visits that
land on that page and leave without
visiting a second page.
(@mikolevy)	
  #ATDconf	
  
• Visitor	
  clicks	
  the	
  back	
  bugon	
  
• Visitor	
  closes	
  the	
  browser	
  
• Visitor	
  types	
  a	
  new	
  URL	
  in	
  the	
  browser	
  
• Visitor	
  watches	
  a	
  video	
  on	
  the	
  page	
  and	
  leaves	
  
• Visitor	
  clicks	
  an	
  external	
  link	
  (Yup…	
  Social	
  shares	
  are	
  not	
  
counted	
  as	
  a	
  “second	
  page”)	


The following visitor actions will result in
a bounce according to Google Analytics
So, it’s only NOT a bounce if they visit a second page.
(@mikolevy)	
  #ATDconf	
  
Makes sense on a landing page
(@mikolevy)	
  #ATDconf	
  
But… is it relevant for content ?
(@mikolevy)	
  #ATDconf	
  
EventsonGoogleAnalytics
Events are user interactions with content
that can be tracked independently
from a web page or a screen load
(@mikolevy)	
  #ATDconf	
  
EventsonGoogleAnalytics
Different types of events usage
-­‐ Time	
  on	
  site	
  
-­‐ Scroll	
  depth	
  
-­‐ Social	
  share	


  -­‐	
  Form	
  submit	


  -­‐	
  Video	
  play	


  -­‐	
  Etc…	
  
(@mikolevy)	
  #ATDconf	
  
Time based event
Mar	
  22,	
  2015	
  -­‐	
  Mar	
  28,	
  2015:	
  
Jan	
  18,	
  2015	
  -­‐	
  Jan	
  24,	
  2015:	
  
Bounce	
  Rate	
  
Bounce	
  Rate	
  
Mar	
  23	
   Mar	
  24	
   Mar	
  25	
   Mar	
  26	
   Mar	
  27	
  
100%	
  
50%	
  
• Event	
  after	
  30	
  seconds	
  on	
  the	
  page	
  
• Decrease	
  bounce	
  rate	
  from	
  80%	
  to	
  40%	
  
(@mikolevy)	
  #ATDconf	
  
Changed our Time on page “reality”
Mar	
  22,	
  2015	
  -­‐	
  Mar	
  28,	
  2015:	
  
Jan	
  18,	
  2015	
  -­‐	
  Jan	
  24,	
  2015:	
  
Avg.	
  Time	
  on	
  Page	
  
Avg.	
  Time	
  on	
  Page	
  
• Doubled	
  visitors	
  6me	
  on	
  page	
  on	
  GA	
  
Mar	
  23	
   Mar	
  24	
   Mar	
  25	
   Mar	
  26	
   Mar	
  27	
  
00:10	
  
00:20	
  
(@mikolevy)	
  #ATDconf	


AWARENESS	


CONSIDERATION	


Conversion • Purchases
• Sign-ups
• Downloads
• installs
What to measure?
(@mikolevy)	
  #ATDconf	
  
Attribution models


Google Analytics default
Last non Direct click	
  
last Interaction
100%	
  
(@mikolevy)	
  #ATDconf	
  
There is a solution
(@mikolevy)	
  #ATDconf	
  
Attribution models on Google Analytics
100%	
  
100%	
  
last Interaction
First Interaction
20%	
  20%	
   20%	
   20%	
  20%	
  
Linear
10%	
  30%	
   10%	
   40%	
  10%	
  
Position Based
Conversions Attribution Model comparison
(@mikolevy)	
  #ATDconf	
  
Attribution models on Google Analytics
(@mikolevy)	
  #ATDconf	
  
Content as part of the journey
• Iden6fy	
  content	
  read	
  as	
  a	
  mid-­‐way	
  goal	
  
• Look	
  for	
  funnel	
  reports	
  with	
  mul6ple	
  sessions	
  
• See	
  different	
  paths	
  that	
  start	
  with	
  content	
  
(@mikolevy)	
  #ATDconf	
  
summary
•  Content	
  should	
  be	
  part	
  
of	
  your	
  funnel	
  
•  When	
  promo6ng	
  content-­‐	
  
use	
  a	
  defined	
  UTM	
  
•  Use	
  tag	
  manager	
  for	
  
better	
  flexibility	
  
• Use	
  event	
  tracking	
  
•  Challenge	
  your	
  
agribu6on	
  model	
  
(@mikolevy)	
  #ATDconf	


We are hiring
miko@outbrain.com	
  
Thank You
(@mikolevy)	
  #ATDconf	


Thank You!
@mikolevy	
  

Measuring content down your funnel

  • 1.
    Measuring content downyour funnel April 20 | 2015 Miko  Levy   Outbrain  Inc,  VP  Customer  Acquisi6on   (@mikolevy)  #ATDconf  
  • 2.
            Nice to meet you Miko  Levy   36    years  old,  Married+1   9  years  in  the  online   performance   marke6ng  world   Previously  @  888.com,   ROASTe  &  Conduit   Marathon  runner   (coming  back  from  injury)   VP  customer   acquisi6on@Outbrain   (@mikolevy)  #ATDconf  
  • 3.
            Outbrain helps readers discover content (@mikolevy)  #ATDconf  
  • 4.
            561+ Million Unique visitors 20+billion Page views 190 BILLION Recommendations OVER 82% INTERNET REACH IN USA (@mikolevy)  #ATDconf  
  • 5.
            WE BRING TOGETHER THE WORLD'S LEADING PUBLISHERS AND BRANDS (@mikolevy)  #ATDconf  
  • 6.
            (@mikolevy)  #ATDconf  
  • 7.
            The customer journey Discovery Realization of need Consideration Conversion Retention (@mikolevy)  #ATDconf  
  • 8.
            It takes 10.4 sources of information to make a purchase decision (@mikolevy)  #ATDconf  
  • 9.
            Comscore  data  mine|NIELSEN,  2012   22%SOCIAL NETWORKING 21%SEARCH 19%EMAILS/ COMMUNICATION 20%READING CONTENT 5%ONLINE SHOPPING 13%MULTI-MEDIA SITES How People Spend Their Time (@mikolevy)  #ATDconf  
  • 10.
            Recommenda6ons  from  people  I  know   Branded  websites   Consumer  opinions  posted  online   Editorial  content  such  as  newspaper  ar6cles   Ads  on  TV   Brand  sponsorships   Ads  in  newspaper   Ads  in  magazines   Billboards  and  other  outdoor  adver6sing   Ads  on  radio   Emails  I  signed  up  for   Ads  before  movies   TV  program  product  placement   Ads  served  in  search  engine  results   Online  video  ads   Ads  on  social  networks   Display  ads  on  mobile  devices   Online  banner  ads     Text  ads  on  mobile  phone   84%   69%   68%   67%   62%   61%   61%   60%   57%   57%   56%   55%   56%   48%   48%   48%   45%   42%   37%   %  point  change   from  2007     6%   9%   7%   N/A   6%   12%   -­‐2%   4%   N/A   3%   7%   18%   N/A   14%   N/A   N/A N/A   16%   19%   %  of  global  online  consumers,  indica6ng  that  they  completely  or  somewhat  trust  each  form   Source:  Nielsen  |  September  13’   Trust in Advertising (@mikolevy)  #ATDconf  
  • 11.
            Recommenda6ons  from  people  I  know   Branded  websites   Consumer  opinions  posted  online   Editorial  content  such  as  newspaper  ar6cles   Ads  on  TV   Brand  sponsorships   Ads  in  newspaper   Ads  in  magazines   Billboards  and  other  outdoor  adver6sing   Ads  on  radio   Emails  I  signed  up  for   Ads  before  movies   TV  program  product  placement   Ads  served  in  search  engine  results   Online  video  ads   Ads  on  social  networks   Display  ads  on  mobile  devices   Online  banner  ads     Text  ads  on  mobile  phone   84%   69%   68%   67%   62%   61%   61%   60%   57%   57%   56%   55%   56%   48%   48%   48%   45%   42%   37%   %  point  change   from  2007     6%   9%   7%   N/A   6%   12%   -­‐2%   4%   N/A   3%   7%   18%   N/A   14%   N/A   N/A N/A   16%   19%   %  of  global  online  consumers,  indica6ng  that  they  completely  or  somewhat  trust  each  form   Source:  Nielsen  |  September  13’   Trust in Advertising (@mikolevy)  #ATDconf  
  • 12.
            Recommenda6ons  from  people  I  know   Branded  websites   Consumer  opinions  posted  online   Editorial  content  such  as  newspaper  ar6cles   Ads  on  TV   Brand  sponsorships   Ads  in  newspaper   Ads  in  magazines   Billboards  and  other  outdoor  adver6sing   Ads  on  radio   Emails  I  signed  up  for   Ads  before  movies   TV  program  product  placement   Ads  served  in  search  engine  results   Online  video  ads   Ads  on  social  networks   Display  ads  on  mobile  devices   Online  banner  ads     Text  ads  on  mobile  phone   84%   69%   68%   67%   62%   61%   61%   60%   57%   57%   56%   55%   56%   48%   48%   48%   45%   42%   37%   %  point  change   from  2007     6%   9%   7%   N/A   6%   12%   -­‐2%   4%   N/A   3%   7%   18%   N/A   14%   N/A   N/A N/A   16%   19%   %  of  global  online  consumers,  indica6ng  that  they  completely  or  somewhat  trust  each  form   Source:  Nielsen  |  September  13’   Trust in Advertising (@mikolevy)  #ATDconf  
  • 13.
            of  consumers  like   reading  from  brands   if  it’s  valuable     82% (@mikolevy)  #ATDconf  
  • 14.
    digital marketing trendsfor 2015 Content  Marke6ng   29.6%   14.6%   12.8%   Big  Data   Marke6ng  Automa6on   Mobile  Marke6ng   11.0%   8.9%  Social  media  marke6ng  and  CRM   CRO/Improving  website  experiences   SEO   Communi6es   Paid  search  marke6ng   Partnerships   Display   Other   Online  PR   7.8%   4.3%   3.1%   3.0%   1.5%   1.5%   1.5%   1.0%   The  State  of  Digital  Marke6ng  in  2015   Source:  Smart  Insights|  January  15’   (@mikolevy)  #ATDconf  
  • 15.
            So how do we measure it? (@mikolevy)  #ATDconf  
  • 16.
            AWARENESS             CONSIDERATION             Conversion What to measure? (@mikolevy)  #ATDconf  
  • 17.
            AWARENESS             CONSIDERATION             Conversion • Traffic • Impressions • Unique visitors • Demo video views • Brand Lift awareness • Social Engagement • Brand Searches (@mikolevy)  #ATDconf  
  • 18.
            BrandLift:Mazda (@mikolevy)  #ATDconf  
  • 19.
    BrandLift:Mazda Brand Lift Study ControlExposure (@mikolevy)  #ATDconf  
  • 20.
    BrandLift:Mazda Brand Lift Study Unaided  Brand  Recall   Brand  Favorability   Purchase  Intent   12% Control   Exposure   64% 62% 50% 54% 39% (@mikolevy)  #ATDconf  
  • 21.
    •  Usually  for  the  bigger  brands     • Requires  research   •  Not  something  you’ll  see   on  Google  Analy6cs   • Less  tangible   Awareness (@mikolevy)  #ATDconf  
  • 22.
            AWARENESS             CONSIDERATION             Conversion • Time spent on content • Page views per session • Content scroll downs • Bounce rate • Return visitors • Social lift • Search lift What to measure? (@mikolevy)  #ATDconf  
  • 23.
  • 24.
    Google Analytics: “the percentage ofsingle-page sessions” (@mikolevy)  #ATDconf  
  • 25.
    Google Analytics: In otherwords, a page’s bounce rate is the percentage of visits that land on that page and leave without visiting a second page. (@mikolevy)  #ATDconf  
  • 26.
    • Visitor  clicks  the  back  bugon   • Visitor  closes  the  browser   • Visitor  types  a  new  URL  in  the  browser   • Visitor  watches  a  video  on  the  page  and  leaves   • Visitor  clicks  an  external  link  (Yup…  Social  shares  are  not   counted  as  a  “second  page”)     The following visitor actions will result in a bounce according to Google Analytics So, it’s only NOT a bounce if they visit a second page. (@mikolevy)  #ATDconf  
  • 27.
    Makes sense ona landing page (@mikolevy)  #ATDconf  
  • 28.
    But… is itrelevant for content ? (@mikolevy)  #ATDconf  
  • 29.
  • 30.
    EventsonGoogleAnalytics Events are userinteractions with content that can be tracked independently from a web page or a screen load (@mikolevy)  #ATDconf  
  • 31.
    EventsonGoogleAnalytics Different types ofevents usage -­‐ Time  on  site   -­‐ Scroll  depth   -­‐ Social  share        -­‐  Form  submit                -­‐  Video  play                -­‐  Etc…   (@mikolevy)  #ATDconf  
  • 32.
    Time based event Mar  22,  2015  -­‐  Mar  28,  2015:   Jan  18,  2015  -­‐  Jan  24,  2015:   Bounce  Rate   Bounce  Rate   Mar  23   Mar  24   Mar  25   Mar  26   Mar  27   100%   50%   • Event  after  30  seconds  on  the  page   • Decrease  bounce  rate  from  80%  to  40%   (@mikolevy)  #ATDconf  
  • 33.
    Changed our Timeon page “reality” Mar  22,  2015  -­‐  Mar  28,  2015:   Jan  18,  2015  -­‐  Jan  24,  2015:   Avg.  Time  on  Page   Avg.  Time  on  Page   • Doubled  visitors  6me  on  page  on  GA   Mar  23   Mar  24   Mar  25   Mar  26   Mar  27   00:10   00:20   (@mikolevy)  #ATDconf  
  • 34.
            AWARENESS             CONSIDERATION             Conversion • Purchases • Sign-ups • Downloads • installs What to measure? (@mikolevy)  #ATDconf  
  • 35.
  • 36.
            Google Analytics default Last non Direct click   last Interaction 100%   (@mikolevy)  #ATDconf  
  • 37.
    There is asolution (@mikolevy)  #ATDconf  
  • 38.
    Attribution models onGoogle Analytics 100%   100%   last Interaction First Interaction 20%  20%   20%   20%  20%   Linear 10%  30%   10%   40%  10%   Position Based Conversions Attribution Model comparison (@mikolevy)  #ATDconf  
  • 39.
    Attribution models onGoogle Analytics (@mikolevy)  #ATDconf  
  • 40.
    Content as partof the journey • Iden6fy  content  read  as  a  mid-­‐way  goal   • Look  for  funnel  reports  with  mul6ple  sessions   • See  different  paths  that  start  with  content   (@mikolevy)  #ATDconf  
  • 41.
    summary •  Content  should  be  part   of  your  funnel   •  When  promo6ng  content-­‐   use  a  defined  UTM   •  Use  tag  manager  for   better  flexibility   • Use  event  tracking   •  Challenge  your   agribu6on  model   (@mikolevy)  #ATDconf  
  • 42.
            We are hiring miko@outbrain.com   Thank You (@mikolevy)  #ATDconf  
  • 43.
            Thank You! @mikolevy