Download to read offline
![III. Materials and Methods
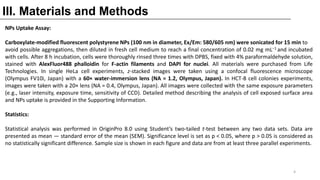
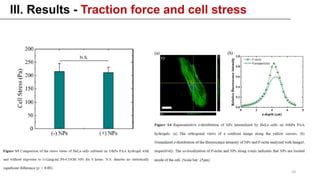
Traction Force Microscopy:
To measure cell traction force, fluorescent beads (200 nm in diameter, Life Technologies) were placed on a single plane
beneath PAA gel surface following a previously published protocol,[50] being a tracer of the gel deformation. A phase contrast
image of a selected HeLa cell or HCT-8 colony and a pair of fluorescent images of beads taken before and after cells were
detached from the gel were collected. The lateral movement of beads extracted from the paired images gave rise to the in-
plane displacement field of the gel. The corresponding traction force profile was obtained by solving the inverse elasticity
problem furnished by the displacement field along with the boundary conditions based on Boussinesq solution.
Monolayer Stress Microscopy:
To analyze the cell stress of both celllines, MSM[29] was implemented. Briefly, the cell geometries from the phase contrast
images were meshed. The traction force profiles derived from TFM were converted into the body force and used as a
boundary condition. Treating cells as a linear elastic material, solving the 2D boundary value problem in elasticity with the
finite element package (ABAQUS) gave rise to the cell stress.
5](https://image.slidesharecdn.com/meachotargeting-181008140255/85/Meacho-targeting-5-320.jpg)
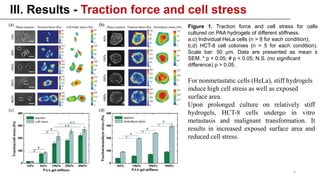
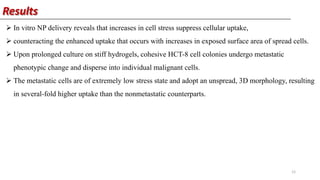

This study examined how the mechanical state of cells affects their uptake of nanoparticles (NPs). Experiments showed that cellular uptake of NPs decreased with increasing cell stress, counteracting the effect of increased surface area from cell spreading. Malignant cancer cells undergoing metastatic transition on stiff substrates dispersed into low-stress, unspread cells with higher NP uptake compared to non-malignant cells. This mechanical targeting approach could potentially deliver higher payloads of drugs to metastatic cancer cells.


