1. Differential response to matrix rigidity correlates with aggressive phenotype of breast cancer cells
Ji Li, Yang Wu, Mohammad Ali Al-Ameen, and Gargi Ghosh
Department of Mechanical Engineering
Rackham Graduate School
University of Michigan - Dearborn
Introduc*on
As a major component of tumor microenvironment, extracellular matrix (ECM) is believed to play an important role in cancer metastasis. Breast cancer is the second leading cause of cancer mortality in women, with the vast majority of the deaths resulting from
metastatic tumors. As the compliance of the stroma within breast carcinomas is approximately 5-20 times more rigid than normal breast tissue, it has recently been postulated that local changes in matrix elasticity contribute significantly to the progression of the
disease. However, it is unclear whether restoration of ECM elasticity to normal levels may benefit treatment prognosis. Such an understanding would require a systematic characterization of how cells sense and integrate abnormal ECM dynamics. Here, we report
the fabrication and characterization of poly (ethylene glycol) (PEG) based hydrogel matrices of varying stiffness. These matrices were then utilized to investigate cell-material interactions in the context of matrix stiffening.
Materials
and
Methods
Fabricate scaffold
§ The pre-polymer solution, consisting of 10% PEG6kDA, 1% photo-initiator, and
5% gelatin methacrylate.
§ Polymer matrix is made by exposure under UV light for multiple time, 2.5 min, 4
min and 6 min.
§ Seeding non-treated MDA-MB-231 and treated cells on the matrixes and
incubated in 37℃ for 3 days.
Compression test
• Incubate 3 mm thickness scaffolds in 1XPBS for 72 hrs after fabricated
• Carry out the compressive test data by using uniaxial testing machine at a loading
rate of 1.2 mm/min with a precision load up to 9 N
• Record the maximum strain and stress and calculate Young’s modulus from the
initial 10% compression
Cell Treatment
• Aspirate old media form flask
• Incubate cells with 5ml 10µM Y-27832(ROCK) of fresh media in 37℃ for 3hrs
Morphology
§ Cell area and aspect ratio (Width of cell/length of cell) is measured by AxioVision
Rel. 4.8 software
Proliferation
§ Aspirate old medium form each well and inject with 100µm fresh medium and
50µm activated-XTT solution which is made with 0.1ml activation reagent and
5ml XTT reagent.
§ Return the plate to the cell culture CO2 incubator for 5 hrs.
§ Measure the absorbance of the wells containing the cells and the blank
background control wells at a wavelength between 475 nm using a microtiter
plate reader.
Adhesion
• Seed 10K per well of cells on each matrix and incubate for 17hrs
• Wash the matrix by fresh medium three times
• Count the number of cell remaining on the scaffolds.
Protein Assay
• Add 5% Phalloidin solution on each matrix with fixed cells and put plate on shaker
with 37℃ for 2 hrs
• Wash with PBS 3 times
• Using fluorescent analogs the distribution of F-actin in cell can be investigated.
Goals
Results
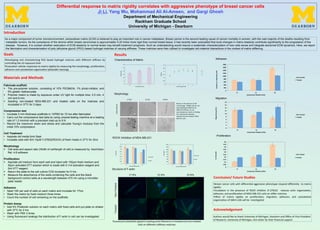
Characteristics of Matrix
Morphology
Proliferation
Adhesion
Migration
Fluorescent
phalloidin
(green)
marking
ac6n
filaments
in
treated
and
non-‐treated
cells
on
different
s6ffness
matrixes
• Breast
cancer
cells
with
differen6al
aggressive
phenotype
respond
differently
to
matrix
rigidity
• Incuba6on
in
the
presence
of
ROCK
inhibitor
(Y-‐27632)
reduces
ac6n
organiza6on,
adhesion,
and
prolifera6on
of
MDA-‐MB-‐231
cells
on
s6ffer
matrices
• Effect
of
matrix
rigidity
on
prolifera6on,
migra6on,
adhesion,
and
cytoskeletal
organiza6on
of
SkBr3
cells
will
be
inves6gated
Conclusion/
Future
Studies
§ Developing
and
characterizing
PEG
based
hydrogel
matrices
with
different
s6ffness
by
controlling
the
UV
exposure
6me
§ Evalua6on
cellular
responses
to
matrix
rigidity
by
measuring
the
morphology,
prolifera6on,
adhesion
and
cytoskeletal
organiza6on
(phaloidin
staining).
MDA-‐MB-‐231
SkBR3
17
kPa
21
kPa
25
kPa
Shown
in
the
pictures
of
cell
morphology
,
SKBR3
cells
do
not
have
significant
different
of
different
s6ffness,
So
we
concentrate
our
work
on
finding
the
rela6onship
between
treated
and
non-‐treated
MDA-‐
MB-‐231
cells.
Structure of F-actin
Non-‐TreatedTreated
0
0.05
0.1
0.15
0.2
0.25
0.3
0.35
0.4
17
21
25
Aspect
Ra*o
Compression
Modulus
(kPa)
Non-‐treated
Treated
0
200
400
600
800
1000
1200
1400
1600
17
21
25
Cell
Area(µm²)
Compression
Modulus
(kPa)
Non-‐Treated
Treated
0
0.05
0.1
0.15
0.2
0.25
0.3
0.35
0.4
0.45
0.5
17
21
25
%
of
Growth
Compression
Modulus
(kPa)
Non-‐treated
Treated
0
200
400
600
800
1000
1200
1400
1600
1800
17
21
25
Number
of
ARachend
cells
Compression
Modulus
(kPa)
Non-‐treated
Treated
0
2
4
6
8
10
12
14
16
18
17
21
25
Migra*on
(µm/hr)
Compression
Modulus
(kPa)
Non-‐treated
Treated
ROCK Inhibition of MDA-MB-231
17
kPa
21
kPa
25
kPa
Acknowledgement
Authors
would
like
to
thank
University
of
Michigan,
Dearborn
and
Office
of
Vice
President
of
Research,
University
of
Michigan,
Ann
Arbor
for
their
financial
support
0
0.05
0.1
0.15
0.2
0.25
0.3
0
1
2
3
4
5
6
7
Weight(g)
Days
of
incuba*on
in
PBS
17
21
25
0
5
10
15
20
25
30
2.5
4
6
Modulus
(kPa)
UV
exposure
*me
(min)