
Download as PDF, PPTX
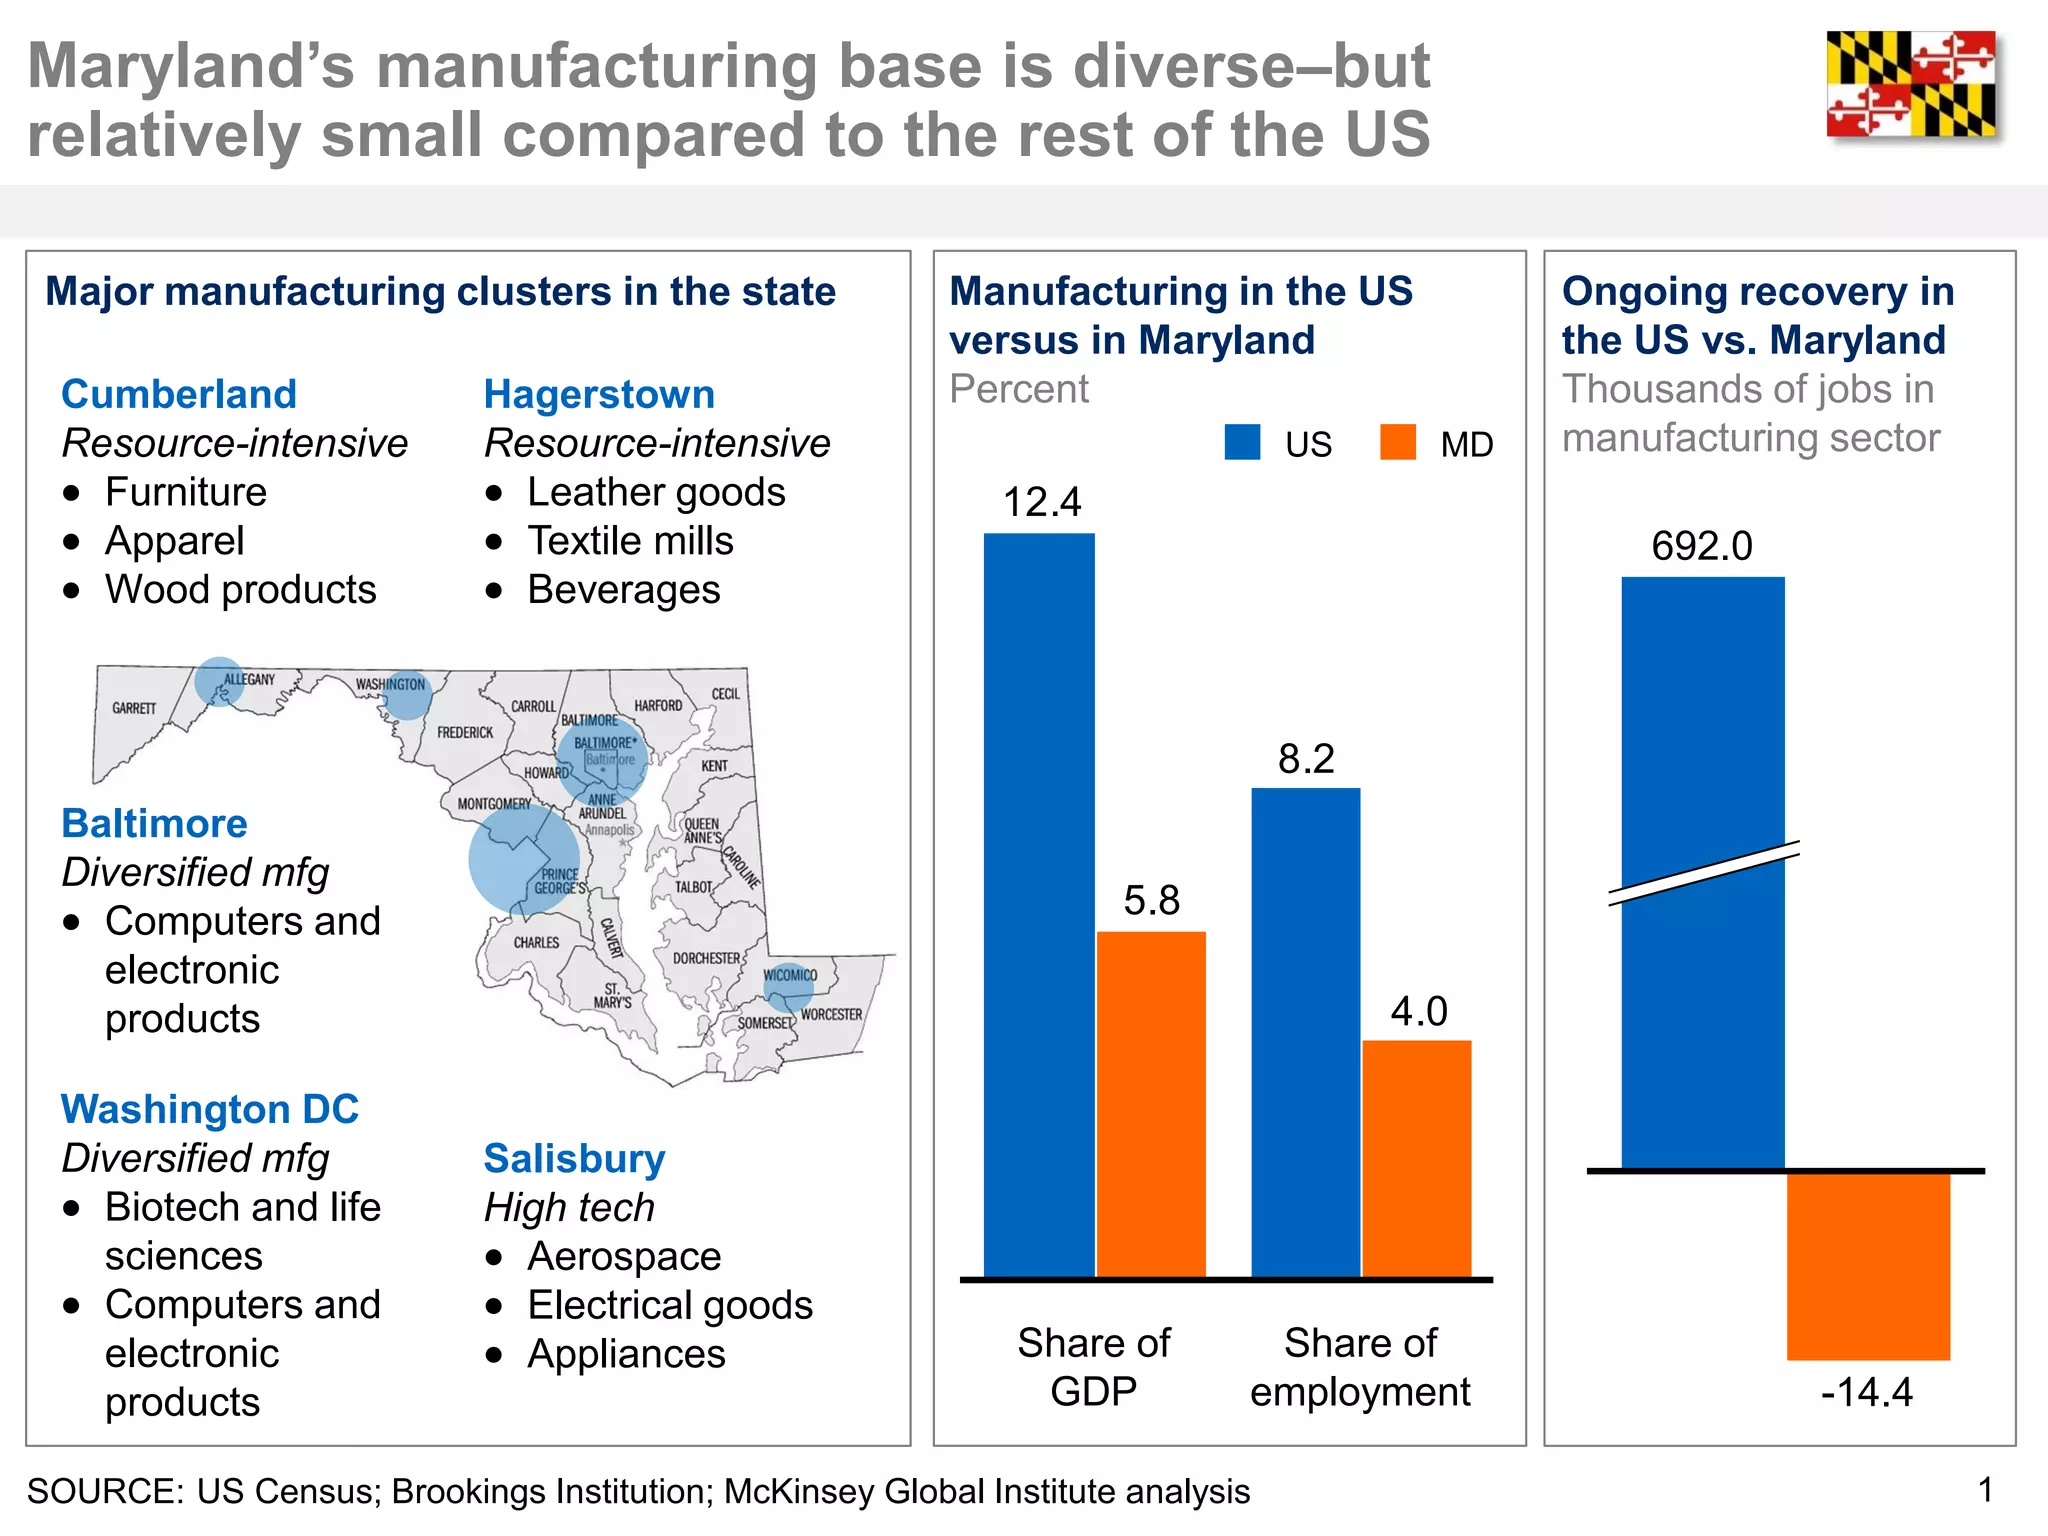


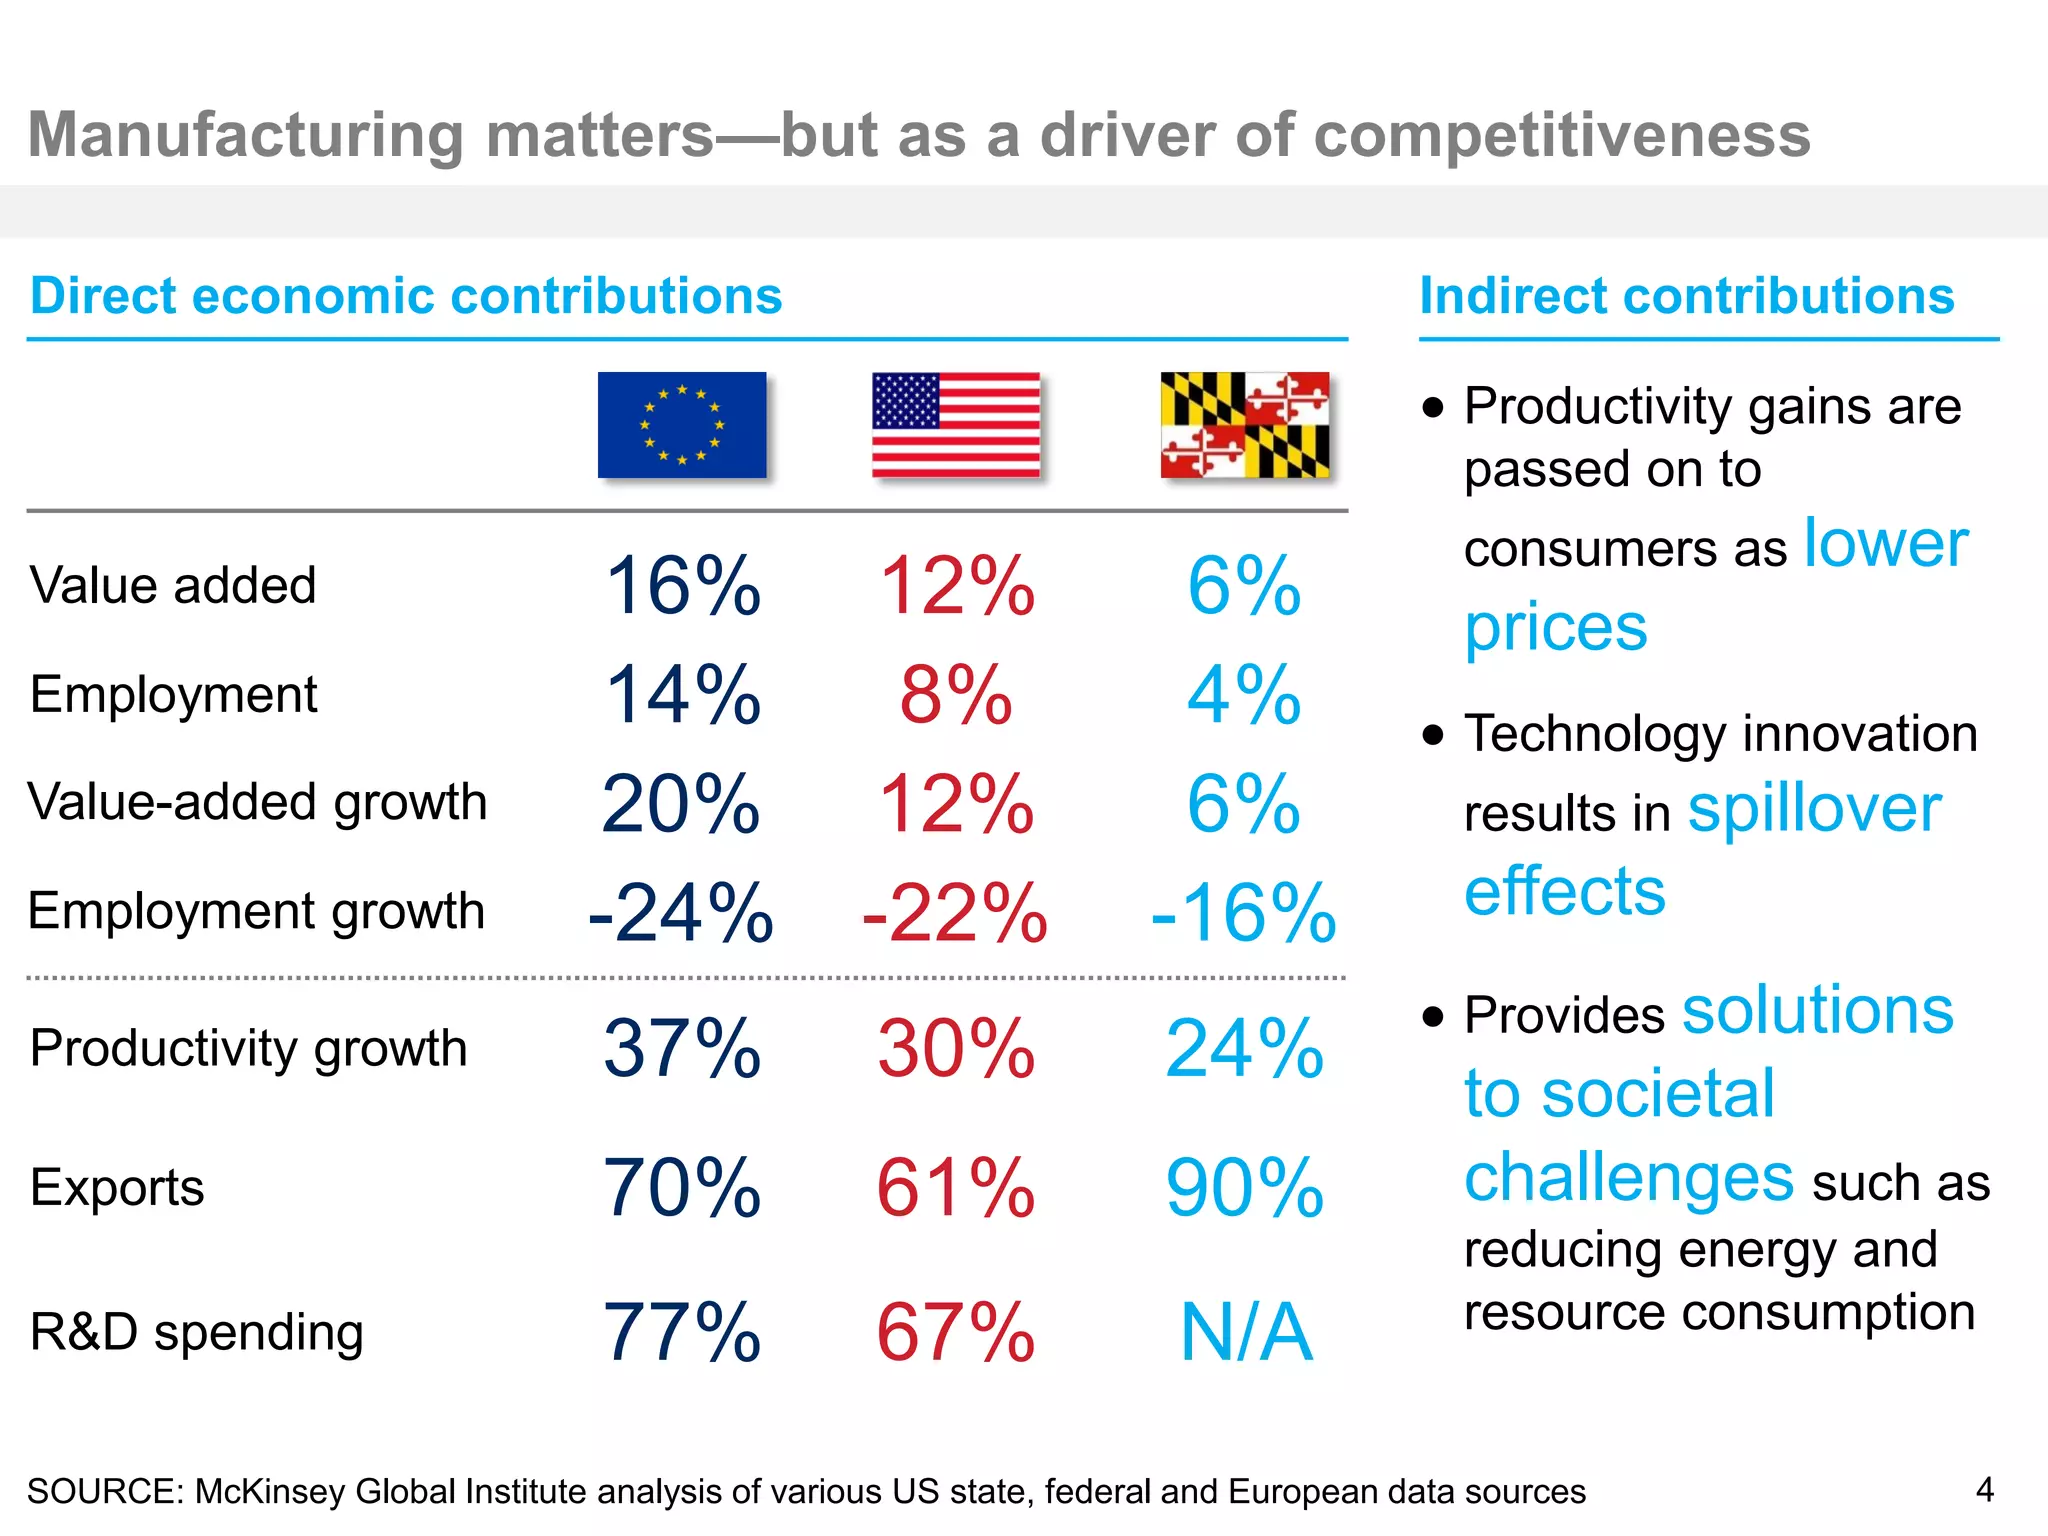


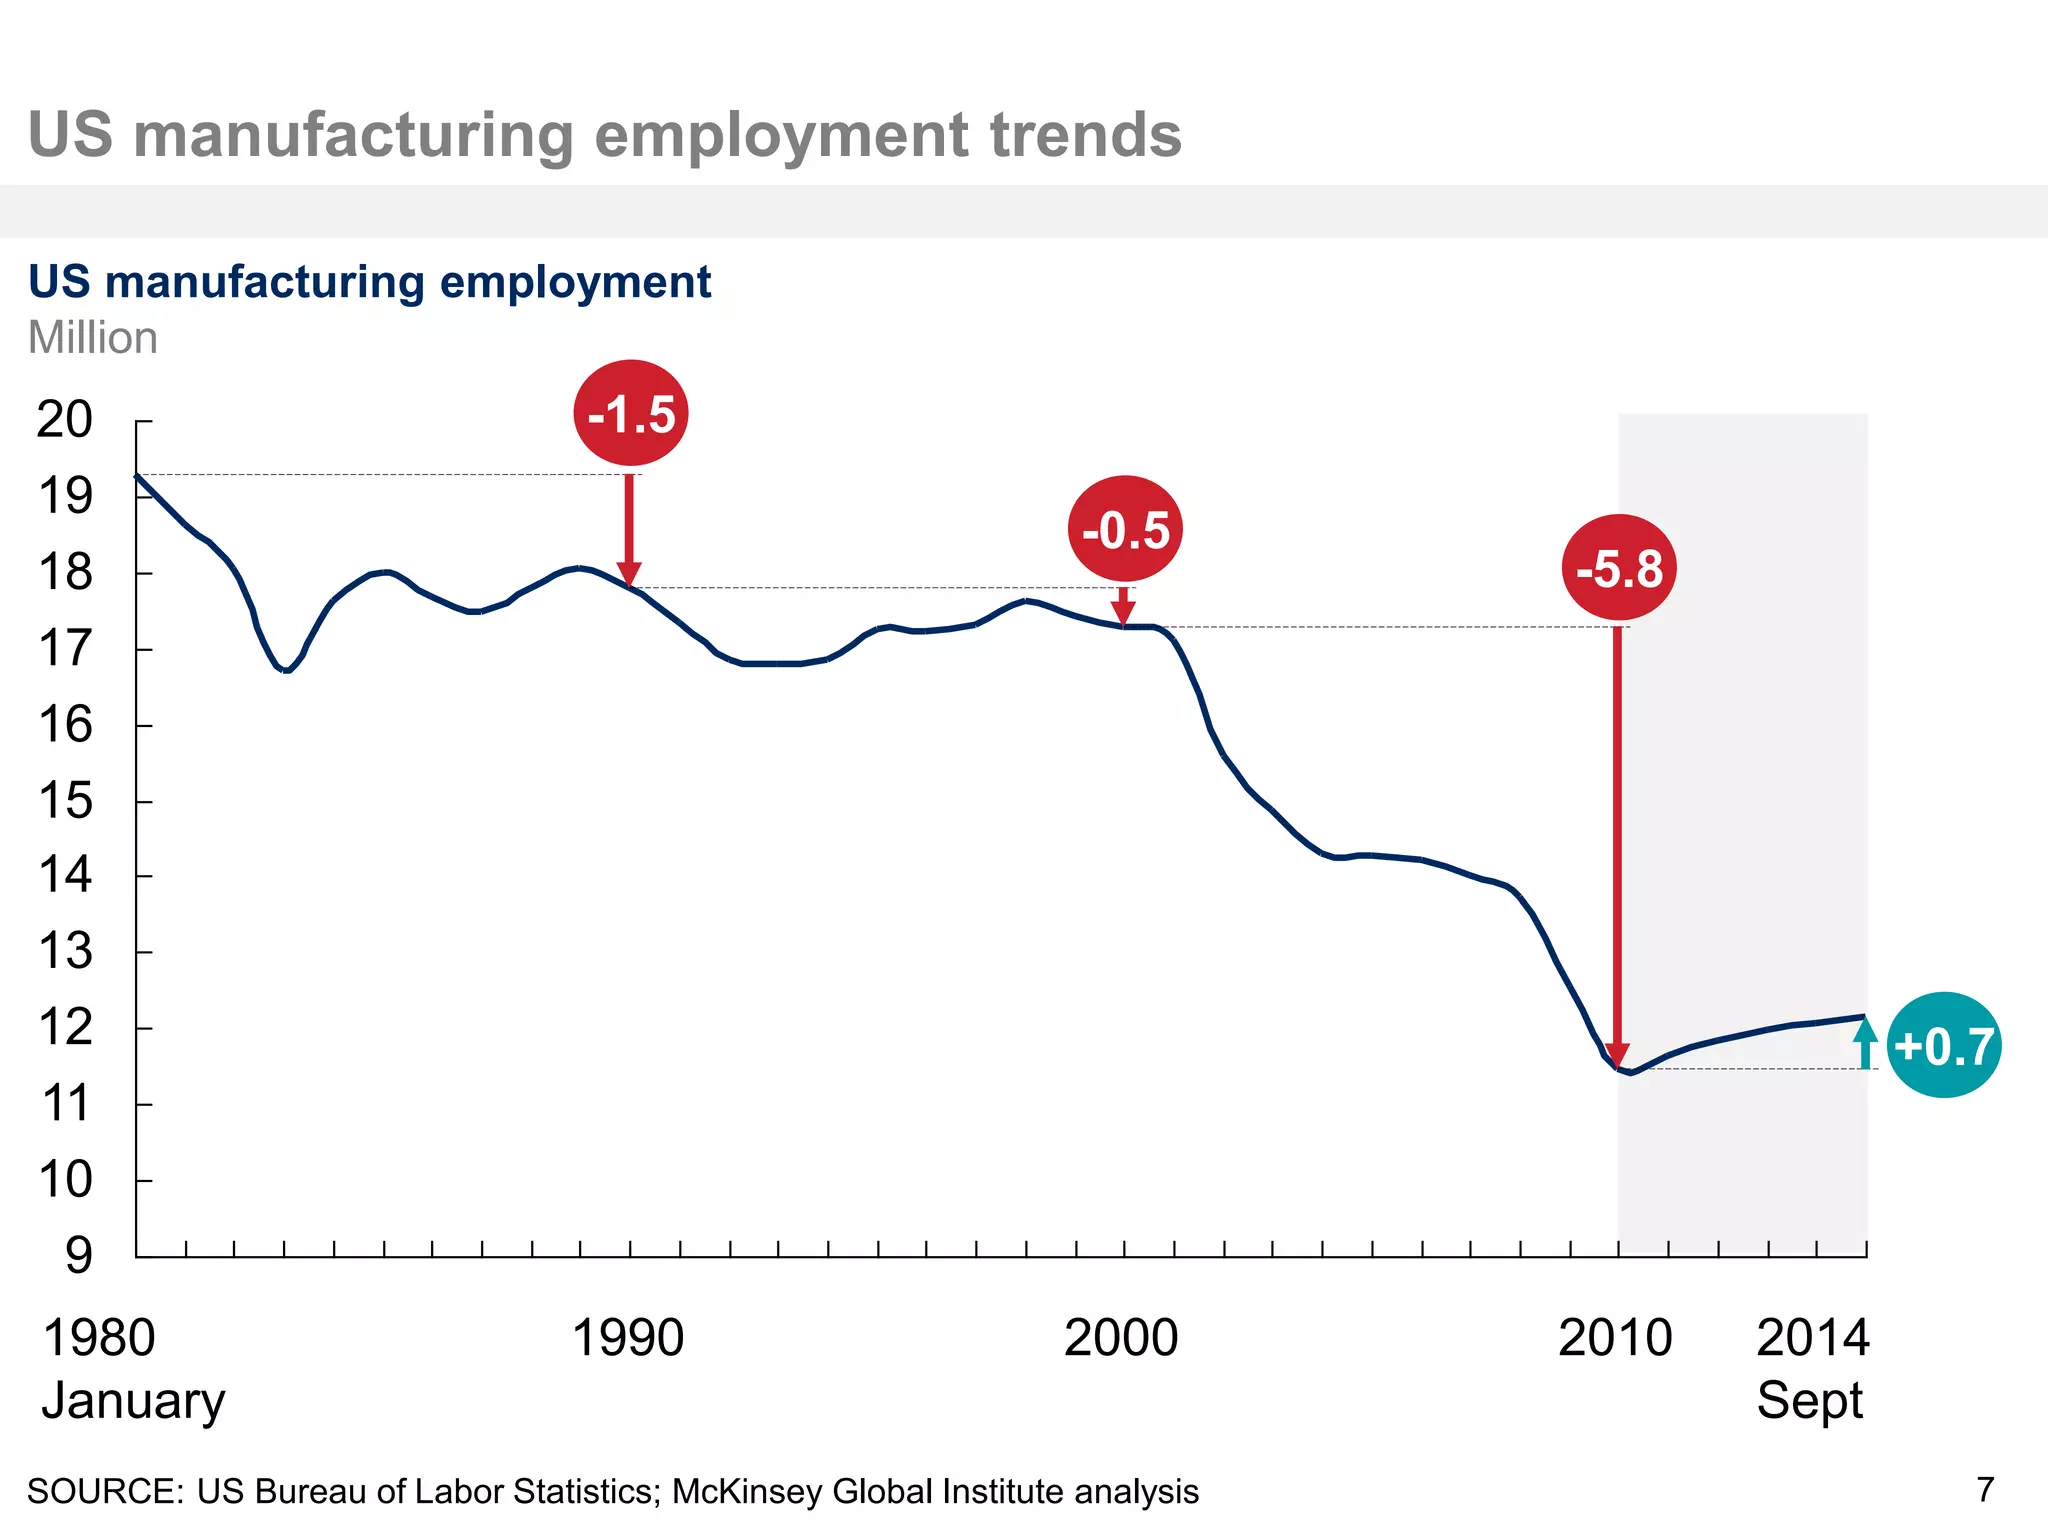


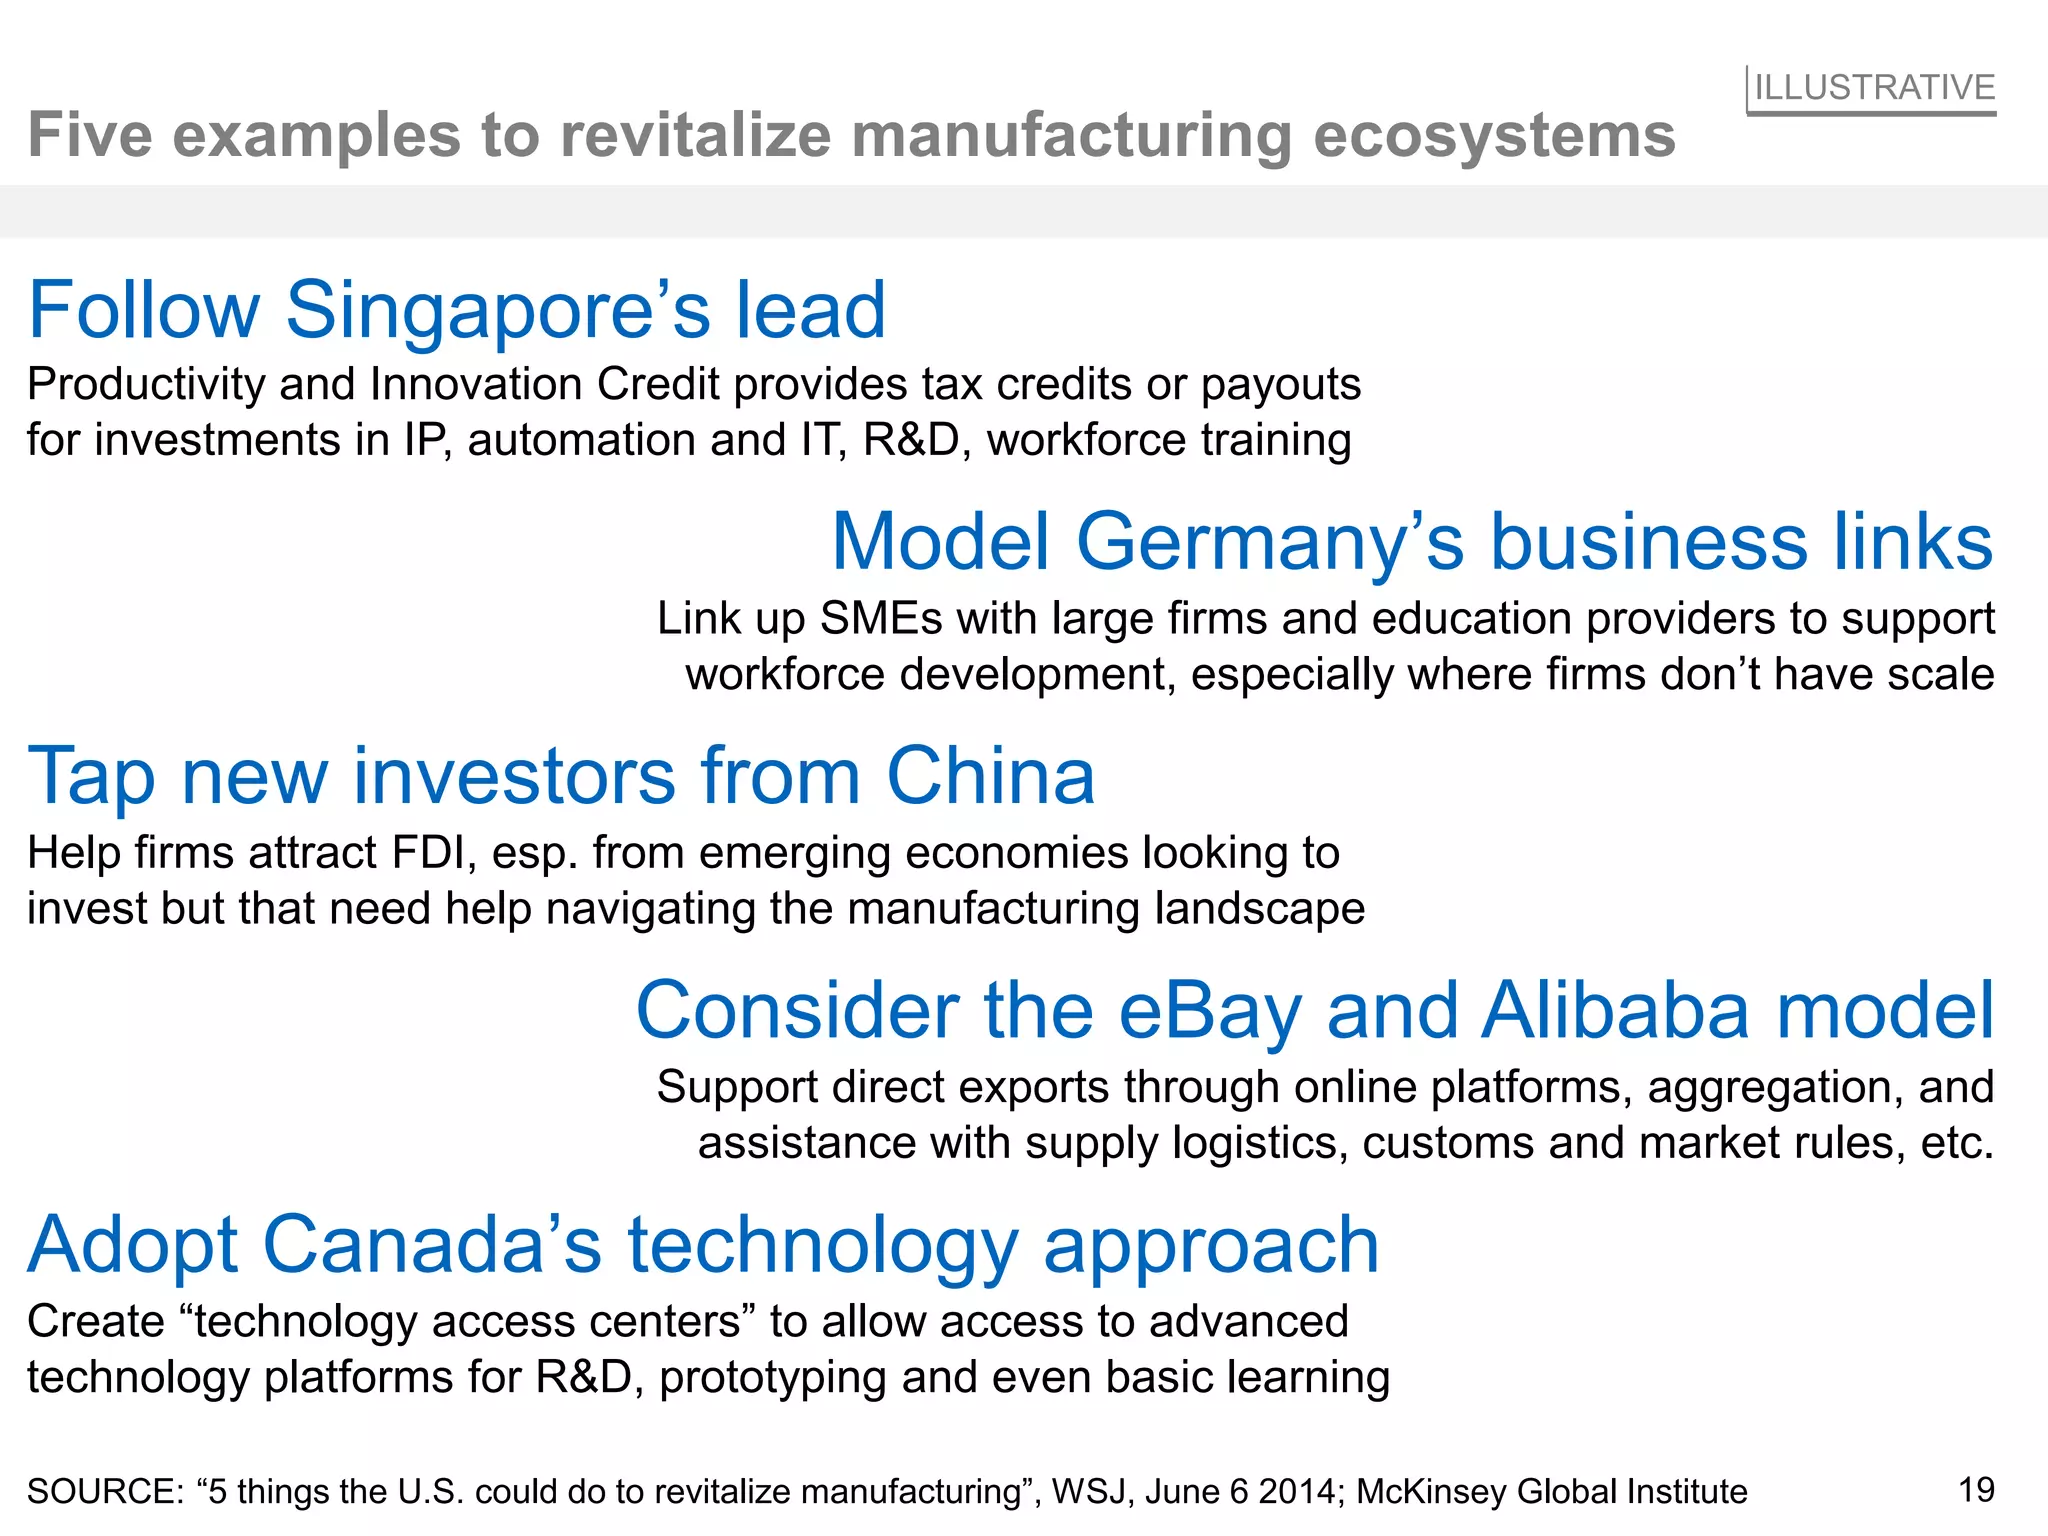

Maryland's manufacturing sector is relatively small compared to the rest of the US, accounting for only 4% of employment and 5.8% of GDP. While Maryland has gained some jobs recently, they are not in traditional manufacturing industries. Manufacturing is important not just for jobs but for driving broader competitiveness through productivity gains, technology innovation, exports, and R&D spending. New disruptive technologies could transform manufacturing by changing economies of scale and democratizing innovation beyond just large firms. Policies to link small and medium firms to large firms and education, attract foreign investment, support exports, and provide access to technology could help revitalize US manufacturing ecosystems.


