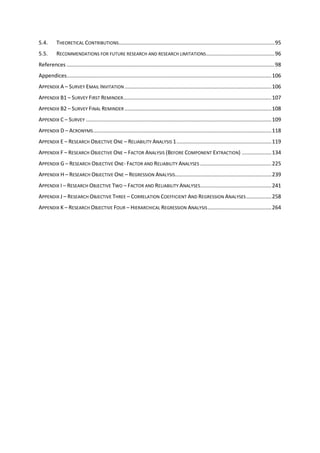
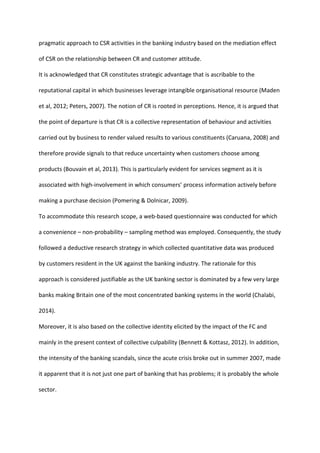
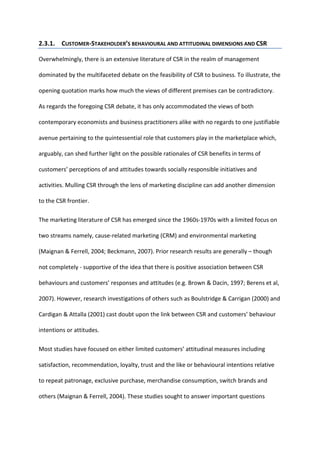
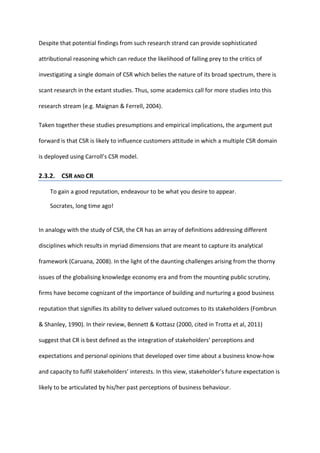
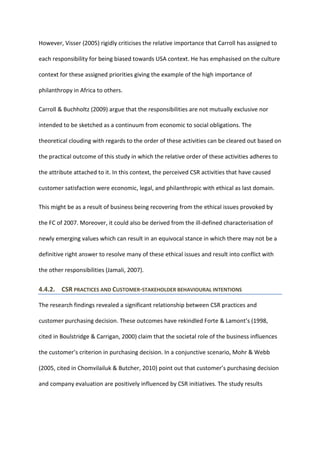
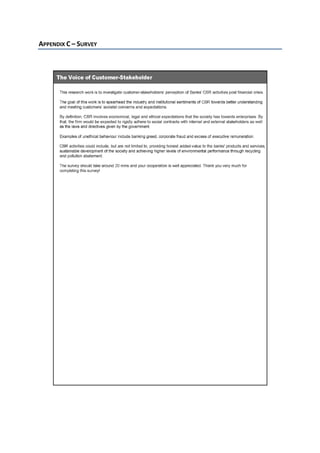
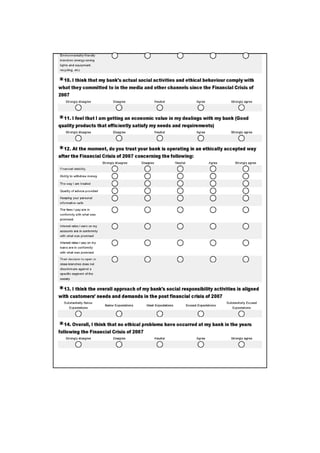
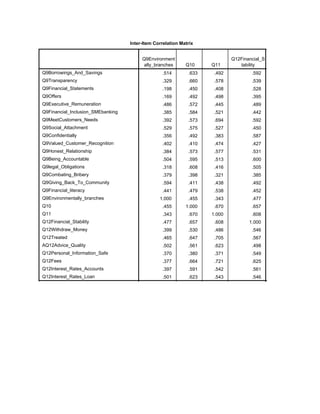
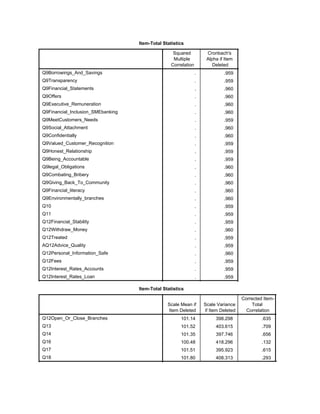
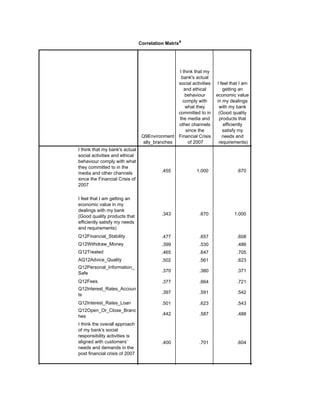
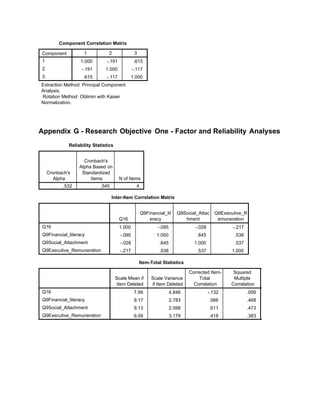
The voice of the Stakeholder
Customer attitudes to the role of Corporate Social
Responsibility (CSR) in the UK Banking Sector since the
Financial Crisis (2007)
Author: Amany Hamza
Submitted in partial fulfilment of the requirements for the degree of MBA
Supervisor: Dr. Alireza Nazarian
University of West London
August 2014
Acknowledgments
First and foremost, I am bound to express my heartfelt gratitude to my husband for his
encouragement and forbearance as well as my lovely kids who have been extremely patient
with me during this challenging task. The successful completion of this work is actually
attributed to their unlimited support throughout the whole process of writing my
dissertation.
On the professional level, I wish to express my profound gratitude to my supervisor, Dr.
Alireza Nazarian, whom I am forever indebted for the immense advice and guidance he has
given me. I would also like to sincerely thank the study participants who took the time to
respond to the study questionnaire.
Abstract
Seven years on from the tumultuous events of 2007 financial crisis (FC), yet, many aspects
of the banking industry are unrecognisable when compared to the pre-crisis era despite the
growth in the UK economy that seems finally to be gaining traction. One consequence of the
ethical violations and corporate excess malfeasance of many banks that brought UK banking
industry into the firing line (Herzig & Moon, 2011; Bouvain et al, 2013) has been the call for
reforms concerning its responsibilities towards the society (Williams & Elliott, 2010; Sun et
al, 2010).
This study attempts to get to the heart of much of the debate about CSR development in
light of that FC. It is concerned with the perception of CSR activities in the post FC, the
likelihood of the convergence between banks CSR activities and its customer-stakeholder
needs and the implications of CSR on their attitudes as well as on Corporate Reputation
(CR).
The study reviews various works of literature concerning the topic at hand. The
hypothesised relationships between CSR and respectively customer satisfaction, customer
purchasing decision and CR were evaluated using a quantitative method based on a
positivist research paradigm. Primary data was sourced from 92 usable questionnaires
(response rate 46%) from UK banks customers.
Drawing from the analysis, it was found that there is a significant positive relationship
between perceived CSR activities and customer-stakeholder satisfaction in the post FC
which is in line with literature of stakeholder model and supports the views of Luo &
Bhattacharya (2006). With reference to CSR practices and customer purchasing decision, the
results revealed a positive significant relationship between them, also consistent with the
results of the study of Klein & Dawar (2004).
Moreover, the analysis of this relation contributed to CSR literature by investigating the
multidisciplinary domain of CSR on customer purchasing intention. CSR was also found to
have a significant positive relationship with Corporate Reputation which shares the view of
Reputation Institute (2009, cited in Trotta et al, 2011). Remarkably, the findings indicated a
partial mediation effect of CSR on the relationship between CR and customer behavioural
intention. Concluding remarks highlight further theoretical development of CSR and
managerial implications as well as limitations for future research.
Table of Contents
Acknowledgments...................................................................................................................................2
Abstract...................................................................................................................................................3
Table of Contents....................................................................................................................................4
Chapter 1: Introduction ..........................................................................................................................6
1.1. INTRODUCTION ...............................................................................................................................6
1.2. BACKGROUND.................................................................................................................................7
1.3. THE PROBLEM STATEMENT ...............................................................................................................9
1.4. RESEARCH AIM AND OBJECTIVES......................................................................................................11
1.5. SCOPE OF THE DISSERTATION...........................................................................................................12
1.6. STRUCTURE OF THE DISSERTATION....................................................................................................14
1.7. CONCLUSION ................................................................................................................................14
Chapter 2: Literature Review................................................................................................................15
2.1. INTRODUCTION .............................................................................................................................15
2.2. FRAMING CSR ..............................................................................................................................15
2.3. STRATEGIC CSR.............................................................................................................................28
2.4. CONCLUSION ................................................................................................................................38
Chapter 3: Methodology.......................................................................................................................39
3.1. INTRODUCTION .............................................................................................................................39
3.2. RESEARCH PHILOSOPHY ..................................................................................................................39
3.3. RESEARCH DESIGN.........................................................................................................................46
3.4. DATA TREATMENT AND DATA ANALYSIS TECHNIQUES..........................................................................65
3.5. CONCLUSION ................................................................................................................................71
Chapter 4: Analysis and Discussion of Findings ....................................................................................72
4.1. INTRODUCTION .............................................................................................................................72
4.2. DESCRIPTIVE STATISTICS .................................................................................................................72
4.3. EMPIRICAL FINDINGS OF PARAMETRIC DATA ......................................................................................75
4.4. DISCUSSION OF FINDINGS ...............................................................................................................87
4.5. CONCLUSION ................................................................................................................................92
Chapter 5: Conclusion and Recommendations.....................................................................................93
5.1. INTRODUCTION .............................................................................................................................93
5.2. CONCLUSION ................................................................................................................................93
5.3. PRACTITIONER CONTRIBUTIONS .......................................................................................................94
5.4. THEORETICAL CONTRIBUTIONS.........................................................................................................95
5.5. RECOMMENDATIONS FOR FUTURE RESEARCH AND RESEARCH LIMITATIONS..............................................96
References ............................................................................................................................................98
Appendices..........................................................................................................................................106
APPENDIX A – SURVEY EMAIL INVITATION ...................................................................................................106
APPENDIX B1 – SURVEY FIRST REMINDER....................................................................................................107
APPENDIX B2 – SURVEY FINAL REMINDER ...................................................................................................108
APPENDIX C – SURVEY .............................................................................................................................109
APPENDIX D – ACRONYMS........................................................................................................................118
APPENDIX E – RESEARCH OBJECTIVE ONE – RELIABILITY ANALYSIS 1................................................................119
APPENDIX F – RESEARCH OBJECTIVE ONE – FACTOR ANALYSIS (BEFORE COMPONENT EXTRACTION) ....................134
APPENDIX G – RESEARCH OBJECTIVE ONE- FACTOR AND RELIABILITY ANALYSES ................................................225
APPENDIX H – RESEARCH OBJECTIVE ONE – REGRESSION ANALYSIS.................................................................239
APPENDIX I – RESEARCH OBJECTIVE TWO – FACTOR AND RELIABILITY ANALYSES................................................241
APPENDIX J – RESEARCH OBJECTIVE THREE – CORRELATION COEFFICIENT AND REGRESSION ANALYSES.................258
APPENDIX K – RESEARCH OBJECTIVE FOUR – HIERARCHICAL REGRESSION ANALYSIS...........................................264
Chapter 1: Introduction
1.1. INTRODUCTION
To some, 2013 has showed modest improvements in the banking industry, making 2014 the
year that banks might see their best profits since the beginnings of the financial crisis (FC)
according to S&P (Standard & Poor) credit rating agency (Croucher, 2014). To others, the UK
banking industry entered the global lexicon of infamy whereby the ten leading banks have
cost the industry hefty fines of nearly £148bn – according to the LSE’s (London School of
Economics) report – with a string of scandals since the FC. Notwithstanding, the study by the
LSE did not include the Standard Chartered settlement of £407 million last year with the US
authorities for the violation of breaching the sanctions with Iran. Still, the fines and financial
penalties of £148bn are, ironically, larger than the economic output of a country such as
Ireland (Davies, 2013). The partial nationalisation and bail out of two of the country’s
biggest banks – Lloyds Banking Group and the Royal Bank of Scotland (RBS) – using the UK
taxpayer funds have exacerbated the industry’s reputation to the extent that the FC is
regarded as analogous to reputational crisis per se (Trotta et al, 2011).
As 2014 unfolds, the preceding controversial state of the UK banking industry in the post FC
raised pertinent questions on the development of Corporate Social Responsibility (hereafter
CSR) activities to meet its customer-stakeholders’ expectations and, concurrently, address
the dynamic demands of the social system. That is, the tenet of CSR has resurged to figure
prominently in the academic and business community debate. Yet, to date, there is a dearth
of academic literature about CSR in the financial services which spans a wide range of areas
from its characteristics and nature to its implications on corporate performance and
customers’ attitudes (Chomvilailuk & Butcher, 2010; Bennett & Kottasz, 2011; Bouvain et al,
2013). Drawing from these remarks, this study intends to pinpoint key insights in this field
and shed the light on issues impeding its development, hence offer a managerial agenda to
identify and stimulate practices consistent with commonly recognised norms and ethical
behaviour.
1.2. BACKGROUND
Although the CSR credo has been with the business world for centuries (Ahenkora et al,
2013), little is known of CSR literature prior to the 1950s. Some substantial writings can be
traced back as early as the 1776 manifested in the notion of the invisible hand published in
Adam Smith’s vintage book titled The Wealth of Nations. This view holds that exigencies of
profit justify self-interest pursuit and, in tandem, respond to societal demands insofar free
market mechanism is allowed. Smith had set a precedent to the neoliberal advocates of
shareholder principles in which the sole fiduciary duty of business is wealth creation for its
owners (Garriga & Mele, 2004; Carroll & Shabana, 2010). On the other hand, Andrew
Carneige, in his seminal publication, The Gospel of Wealth (1889), argued fervently that
business has a broader role towards society at large given the credence nature of managers
as public trustees (Pearce II & Doh, 2005). As such, CSR intensified as of 1960s with the
emergence of academic and managerial interests (Garriga & Mele, 2004; Carroll & Shabana,
2010) to contribute either to the expansion of business’ broad role towards society or the
contraction and resistant advocated by the shareholder view.
The dichotomy between the narrow wealth creation for shareholders and the holistic view
of business societal role towards society is mirrored in the current state of banking industry.
The line of thinking developed in this thesis belongs to the latter stream clustered around
the societal paradigm given the interrelationship rationalisation in the business-society
interactions. In this context, business seeks to integrate both explicit and implicit societal
concerns in its DNA (its strategy and culture) (EU Commission, 2001 cited in Decker, 2004).
One such integrative framework incorporates business responsiveness by accommodating
explicit claims together with evolving proactive strand from addressing implicit concerns
(Wood, 1991).
By doing so, some empirical researches, in particular since last decade, consent that the
aggregation of external consonance and internal consistency to operationalise societal
obligations can reap many tangible advantages; in essence, this can lead to stimulate
durable relationships with broader constituency (e.g. Maignan & Ferrell, 2001;
Bhattarcharya & Sen, 2001). Although these endeavour to bring CSR from ideology to
reality, extant studies lack analytical rigour given the tendency to justify CSR in terms of a
direct link to corporate financial performance as the critical criterion (e.g. McWilliams &
Siegel, 2001; Pomering & Dolnicar, 2009; Carroll & Shabana, 2010). By doing so, academic
research address one dimension of CSR though is considered a multidimensional construct
based on the embodiment of economic, social, ethical and environmental responsibilities
that business should strive to uphold at any given time (Carroll, 1979). This has contributed
to equivocal results of the CSR effects on the corporate financial performance in which
empirical support falls short by directly measuring a non-economic construct – CSR – using
economic metrics. Given the nature of CSR as based on a qualitative relationship between
business and society, measurement should employ mediating variables to gauge this
relationship.
Accordingly, the empirical research was primarily produced from the corporate perspective
whereas the effects of CSR on customers were under-researched (Chomvilailuk & Butcher,
2010). While, Bhattacharya & Sen (2001) called for exploring CSR outcomes from customers
perspective, most of academic research addressed consumer goods with little investigation
of the services business (McDonald & Thiele, 2007).
Noting these gaps in the CSR academic literature, this study tends to fill this void and put
forward propositions for verifiable criteria for business success voiced by customer
stakeholder.
1.3. THE PROBLEM STATEMENT
It was the best of times; it was the worst of times…
so begins Charles Dickens “A Tale of Two Cities”
The increased public scrutiny of business behaviour since the near-death experience of the
global FC has borne witness to radical change in the bank industry by espousing societal
implementations to align its institutional activities with its stakeholder demands. In this
sense, it can regain the lost trust in business while also avert new regulations of closer
scrutiny of its conduct (Bouvain et al, 2013). In other words, it can be argued that banks
have rethought their role in society in which parity has once again reverted to this industry
(Condosta, 2012).
Recalling Charles Dickens quotation, the state of the banking industry is the worst of times
and the banking community has not learnt the lesson from the FC. Seemingly, this is
attributed to many issues that remain unresolved whereby a series of jaw-dropping scandals
are in flux. Cynically, in 2013, Lloyds was fined £28million for exploiting customers by
introducing a flawed incentive scheme between 2010 and 2012 (Shannon, 2013), while RBS
has been accused of pushing 'viable' businesses into default in order to seize their
properties and make a profit for the bank (Parker & Moore, 2013). A large portion of these
big losses were incurred in the subsequent years of the FC in 2007, hence the CSR practices
of the banking sector were called into question. There is doubt that these causalities lie in
the irresponsible behaviours of these practices, associated with the inability of either these
practices or the external structures of regulation to prevent these behaviours.
1.3.1. RESEARCH QUESTION
Against this backdrop, this study’s fundamental question emerged as whether the current
CSR activities in the UK banking industry have acquired accepted resonance through the
inclusion of societal expectations in the years that followed the FC, in particular:
Has the financial crisis been a wake-up call for CSR activities to resonate with customer-
stakeholder expectations to create sustainable business?
1.3.2. THE DEVELOPMENT OF THE RESEARCH HYPOTHESES
The following hypotheses were developed to help answer the aforementioned question.
The dominant debate on favouring CSR or refuting it has populated the literature that there
is no consensus on its conceptual or its practical implementation. The manifest failure of
CSR to conceive the dynamics of business and social systems is apparent in Bennett &
Kottasz’ (2012) claim that the British public’s evaluation of both the integrity and calibre of
banking industry has declined. On the other hand, there is the proposition that banks have
embraced socially responsible behaviour to address the needs of its customer-stakeholders
in the post FC of 2007. This formulated the assumption – first hypothesis – as:
H01: There is a relationship between perceived bank’s CSR activities and customer-
stakeholder satisfaction in the post-financial crisis of 2007.
The other hypotheses suggested pinning down a management agenda that elicit favourable
customer attitudes. The recent surge of ethical and social screened investment acknowledge
the possibility that there are customers who support socially responsible practices (Peters,
2007) and are likely to influence their behavioural intention (Bhattacharya & Sen, 2001).
Hence the researchable hypothesis was:
H02: There is a relationship between CSR practices and customer-stakeholders’ behavioural
intention.
CSR is regarded as a form of investment that constitutes sustainable competitive
advantages. In this vein, Porter & Kramer (2006) argue that satisfying the economic and
non-economic demands of stakeholders incorporates creating a solid reputation in the
marketplace by gaining society confidence. More so, it is considered the single most
important commodity which all transactions and trade are based upon in the banking
industry and, in the absence of it, the banking system reputation is on the line (Rothschild,
2013). This led to the hypothesis:
H03: There is a relationship between CSR fit practices and bank reputation.
The last hypothesis ascribed whether CSR practices mediate the link between customer-
stakeholders' behavioural intentions and banks reputation:
H04: There is a mediation effect of CSR practices in the relationship between customer-
stakeholders' behavioural intentions and banks reputation.
1.4. RESEARCH AIM AND OBJECTIVES
This study aimed to contribute towards a dynamic evolution of the CSR literature that is
echoed by the emerging norms and expectations of customer-stakeholders in the post FC of
2007 within the context of UK banking sector. This research sought out to investigate the
likelihood of CSR development in the banking context to meet customer-stakeholders
emerging expectations.
To this end, the objectives were based on:
• investigate whether perceived CSR activities in the post FC of 2007 have an impact
on banks’ customer-stakeholders satisfaction.
• evaluate whether there is a relationship between CSR practices and bank customer-
stakeholder behavioural intention (purchase behaviour).
• determine whether there is a relationship between CSR fit practices and bank
reputation.
• investigate whether CSR practices mediates the relationship between bank
reputation and stakeholders' behavioural intentions.
• provide an interdisciplinary and systematic framework for CSR literature by
delineating the customer attitudes towards a multidimensional CSR activities
• analyse pertinent literature underlying the CSR and Corporate Reputation (CR) link
1.5. SCOPE OF THE DISSERTATION
Corresponding to the research aim, the scope at hand was articulated around the normative
factor of social perceived value of the banking CSR activities in the post FC and the strategic
potential of CSR to create value for both the corporate entity and its constituencies. In this
setting, the analysis was derived from customer stakeholder-based views of CSR in which
fourfold of expectations – namely economic, ethical, legal and philanthropic of the so-called
Carroll’s CSR pyramid model (1979) – were used as a proxy for these views.
The study’s theoretical framework and analysis incorporated a pragmatic approach to CSR
by reconciling the emergent post FC normative views of customer stakeholder and business’
socially accepted activities obtained from the empirical analysis into a consolidative
construct of CSR development that reaps competitive advantage to contribute to business
financial well-being or, in other words, developing a strategic CSR that yields value-creation
to both ends. Building on this distinction, this thesis contributed to the literature of CSR by
investigating the attitude of customer-stakeholder towards multidimensional social
responsibilities. Furthermore, it scrutinized the case for strategic CSR to justify the
pragmatic approach to CSR activities in the banking industry based on the mediation effect
of CSR on the relationship between CR and customer attitude.
It is acknowledged that CR constitutes strategic advantage that is ascribable to the
reputational capital in which businesses leverage intangible organisational resource (Maden
et al, 2012; Peters, 2007). The notion of CR is rooted in perceptions. Hence, it is argued that
the point of departure is that CR is a collective representation of behaviour and activities
carried out by business to render valued results to various constituents (Caruana, 2008) and
therefore provide signals to that reduce uncertainty when customers choose among
products (Bouvain et al, 2013). This is particularly evident for services segment as it is
associated with high-involvement in which consumers’ process information actively before
making a purchase decision (Pomering & Dolnicar, 2009).
To accommodate this research scope, a web-based questionnaire was conducted for which
a convenience – non-probability – sampling method was employed. Consequently, the study
followed a deductive research strategy in which collected quantitative data was produced
by customers resident in the UK against the banking industry. The rationale for this
approach is considered justifiable as the UK banking sector is dominated by a few very large
banks making Britain one of the most concentrated banking systems in the world (Chalabi,
2014).
Moreover, it is also based on the collective identity elicited by the impact of the FC and
mainly in the present context of collective culpability (Bennett & Kottasz, 2012). In addition,
the intensity of the banking scandals, since the acute crisis broke out in summer 2007, made
it apparent that it is not just one part of banking that has problems; it is probably the whole
sector.
1.6. STRUCTURE OF THE DISSERTATION
This introductory chapter underpins the foundation of the study. Chapter 2 critically
discusses comprehensive literature involving the topic at hand. In Chapter 3, the
methodology is outlined through the adoption of a quantitative method where a survey was
developed through which customers voiced their opinions on banks CSR activities in the
post FC of 2007.
Chapter 4 furnished the set of analyses that were utilised to form the study findings in order
to answer the Research Question. The final chapter, Chapter 5, brings it all together
through the conclusion and recommendations.
1.7. CONCLUSION
This first chapter introduced the topic of the research, setting the foundation by
demonstrating CSR background and history. It then shed light on the formulation of the
Problem Statement leading to the Research Question. This was elaborated by discussing the
development of the Research Hypotheses. The Research Aim, Objectives and Scope were
then presented and, finally, the structure of this dissertation was then laid out.
Chapter 2: Literature Review
2.1. INTRODUCTION
This chapter presents an overview of distinct but integrated realms of literature. These
include CSR and CR. The opening section starts with critically recounting the genesis of CSR.
Afterwards, it synthesises key arguments to pursue insights into the role of business in
society to evaluate CSR construct in the twenty-first century. Guided by Carroll’s (1991) CSR
model, the definition of CSR is then discussed. The second section explores the literature
regarding Strategic CSR. A review of customer-stakeholders’ attitudes towards CSR is then
addressed to determine what has been proposed and found regarding the theoretical
relationships between the two domains. Thereafter, it demonstrates relevant theoretical
framework on the relationship between CSR and CR. A discussion of the mediation effect of
CSR marks the end of the chapter.
2.2. FRAMING CSR
The high profile scandals and ethical violations of some corporate entities of the early 1980s
and mid 2000s coupled with many new age problems – manifested in terms of poverty,
artificial market bubbling and the like (Louche et al, 2010, Sun et al, 2010) – have brought
contemporary business under siege by critical public scrutiny of its behaviour and its raison
d'être in society (Pendse, 2012). Underpinning these issues is the lack of a socially
responsible behaviour of businesses that contributed to the resurgence of interest in CSR. A
casual glance back over mid-20th
century in business management reveals the upward surge
of the quest for businesses to embrace a responsible ethical behaviour in response, most
likely, to the negative externalities of its operations and activities (Pomering & Donicar,
2009) and the recurring repercussion of the capitalism model. Beyond this proposition,
cynics of CSR posit that it implies a risk to modern corporations of damaging them through
the discussion of their weaknesses instead of praising their strengths (Blowfield & Murray,
2008).
A contrasting view holds that sane corporations have responsibility towards society to
ameliorate the adverse impacts which they create to adhere to their ascribed role in society
and apply ethical and social standards to their business (Carroll & Shabana, 2010; Lindgreen
& Swaen, 2010). In support, Hay & Gray (1974) opined that the development of CSR is
touted as Quality of Life Management. Furthermore, the flurry of literature about CSR in
1960s and 1970s has promoted the theoretical context for corporate responsibility
(Blowerfield & Murray, 2008). However, it also spawned an array of overlapping concepts
that demonstrates the quest to incorporate CSR agendas that acknowledge the interests of
constituent groups in society (Maon et al, 2009) and the discernibly changes in business’s
relationship with other elements of society (Branco & Rodrigues, 2007; Smissen, 2012).
This rather a concise sketch of the variation dominated the CSR premise since the second
half of the 20th century in which a philosophically and economically intriguing debate on
the proper role of CSR has been taken place (Garriga & Mele, 2004).
Set against this outlook, the notion of CSR is regarded as an immensely contested construct
that convey vividly the long-standing debate between two discernible streams of thought
characterised as the neoliberal classic perspective of shareholder sovereignty and the neo-
Keynesian model that champions the stakeholder paradigm (Chomvilailuk & Butcher, 2010;
Mullerat, 2010). To illustrate this dilemma, key arguments around a bundle of questions
surrounding the determinants and dimension of CSR emerged with regards to the
fundamental purpose and responsibilities of businesses. Questions were raised about the
role of the business in society, its legitimate goal, the motives of CSR, the scope of the
managerial responsibility, the rationales concerned with business pursuing doing good to do
well and whether business’s primary endeavour to maximise the wealth creation of its
stockowners is synonymous to greed. The answers given have been forged by a proliferation
of theories and approaches that contributed to the development of CSR analysis (Garriga &
Mele, 2004). Noticeably, a plethora of cognate concepts such as stakeholder management,
corporate citizenship, sustainable business and business ethics have been developed in an
effort to justify arguments for why management needs to align corporation and societal
values to reap long-term prosperity (Carroll & Shabana, 2010; Herzig & Moon, 2011). While
other concepts generated such as value based management or enlightened value
maximisation advocated by contemporary adherents to the classical view (Martin et al,
2009). Despite the rise of these new concepts that are vying to supplant CSR to be the
descriptor of the field, the term Corporate Social Responsibility still serves as the reference
point in both the academic domain and the management realm.
Yet the development of CSR unfolded in uneven ways, albeit the theoretical context for CSR
is evolving, the practitioner communities might lag behind for the lack of cut-clear vision of
reliable guidance and standards to evaluate and control the actions of corporations
(Frederick, 2006). McWilliams & Siegel (2001) and McWilliams et al (2006), on the other
hand, contend that CSR became a mainstream in many business practices whereas others
might eschew the inclusion of societal values into their practices concerned about such
efforts being portrayed as dereliction of their duty to the business owners or subvert
corporate resources.
Notwithstanding, the abundant literature on CSR yet to date there is no definite consensus
exits on the definition of CSR given the complexity and the competing challenges expressed
by key stakeholders (Duarte et al, 2010; Nilsen, 2010). In this vain, it is argued that CSR
remit range from a narrow functionalist vision of business that involves economic and legal
responsibilities to a broader stance of enhancing the welfare society (Crane & Matten,
2010). Votaw (1972, cited in Garriga & Mele, 2004) summed up the multitude of meanings
given to the concept as to some it espouses responsible ethical behaviour, to others it is
tantamount to corporate liability and abiding by the law; to still others it is synonym for
philanthropic contributions. Votaw proceeded to critique the term for being a bewildering
premise leading to a high level of heterogeneity in how it is depicted. Sun et al (2010) help
to end on a positive end that CSR per se is a dynamic and contextual term bound up to its
application, societal conditions and political forces.
2.2.1. CSR DEBATE- THE ROLE OF BUSINESS IN SOCIETY
The CSR thrust rooted in the two controversy views amid the classical view based on the
shareholder view imposed by neoliberal economist adherents and the stakeholder view for
the role of business within society (Bhattacharya & Sen, 2001; Jamali, 2007; Sweeney, 2009).
The former is attributed to the invisible hand metaphor coined by Adam Smith (1776), the
18th century pioneer of political economics and is credited as the founder of capitalism
model and free market system. It implies that self-interest pursuit of business to create its
wealth spurs, de facto, society’s prosperity that is promoted by such acts (Carroll &
Buchholtz, 2009). The central claim of the free enterprise system is conceived as immoral or
unethical-free predominantly driven by the forces of free competition. The latter view was
brought forward and developed by R. Edward Freeman (1984) building on the inducement
contribution of Howard Bowen (1953, cited in Carroll & Shabana 2010) which was the initial
point in the field of CSR. Bowen (1953) in his landmark book, Social Responsibilities of the
Businessman, argues that the business community has moral obligations to society arises
from the impact of their decisions and activities whilst he goes on claiming that business
should conduct in line with the values of its society (Bartscht, 2013).
Along with the rise of CSR, detractors of CSR exemplified by Theodore Levitt (1958) warned
business to take heed of the adverse impacts of CSR on their business (Carroll & Shabana
2010; Cheers, 2011). Nobel laureate Milton Friedman (1970) – the originator of the
shareholder view- furthers Adam’s line of thinking whereby the main credo entails that
business’s only responsibility is to maximise shareholder’s wealth as long as it stays within
the rules of the game which is to say the justifications of Adam’s invisible hand view in
terms of unfettered competitive market (Crane & Matten, 2010; Bartscht, 2013). Frideman
concurs with Levitt’s view that social responsibility is subversive to business in terms it
diverts management from pursuing its legitimate goal of increasing the economic value of
stockholders who are considered the primary constituent in business. Friedman (1970)
claims that a broad stakeholder accountability of business is symptomatic of an agency
problem. In this context, he contemplated engaging into such social activities as a betrayal
of manager’s fiduciary duty to the owners. He notoriously proclaimed that acting for any
other purpose is tantamount to fraud and political subversion (Margolis et al, 2009; Crane &
Matten, 2010).
The well-established credence of shareholder primacy in the latter part of the twentieth
century sparked what has become a watershed debate on the role of business. Shareholder-
centric came under attack from a number of quarters for serving the interest of one cohort
with no regards to other stakeholders (Samy et al, 2010). A contrasting thinking emerged
epitomising the relationship between business and many stakeholder groups who have
stake and legitimate interest in the business. Providing an interesting slant on stakeholder
model, Bartscht (2013) posits that engaging in stakeholder relationships implies an
opportunity to build relative competitive advantage. Concerning this aspect, it was
acknowledged that the narrow view of maximising shareholder profit embodies a myopic
stance (Cheers, 2011). This incorporates taking the risk of producing short-term profit which
might lead to jeopardizing business viability and even shareholder wealth.
Clarkson (1995, cited in Lech 2013) proposes two typologies of stakeholders termed as
primary and secondary stakeholders. The former ascribes to prominent participants whose
support is pivotal for the existence and survival of business. It encompasses shareholders,
employees, customers, suppliers and local communities. On the other hand, the secondary
stakeholders are the non-participants who can have an impact on business and in a same
vein business’s actions can have an impact on them. The consideration of the interest of
business multiple stakeholders maintains a durable relationship which intensifies the
significance of advocating CSR ideology.
In essence, business and society are inextricably intertwined as Wood (1991) argues; hence
business has three roles to address the expectations of society. She proposes three
typologies of roles constitute business as an institution in society, as a particular corporation
in society and as individual managers. The level of analysis for these roles comprises three
principles of CSR in terms of legitimacy, public responsibility and managerial discretion. The
principle of legitimacy is rooted in society endorsing business legitimacy whereby business is
viewed as a social institution adheres to social norms of society. Furthermore, the principle
of public responsibility ultimately promotes actions that attuned to the societal needs of its
environment, whereas detrimental impacts of business practices involve admonishing its
failure. The last principle comes as a realisation of Wood (1991) that business managers are
not by some abstract actors but are individuals who have moral and ethos and need to
straddle the demands of both the shareholder and other stakeholders (Sexty, 2010).
2.2.2. DEFINING CSR AND THE EMERGENCE OF NEW VIEW
Carroll (1979, cited in Carroll & Shabna 2010) – an authoritative and progressive advocate of
CSR – has proposed a four-fold concept of CSR which manifests a set of interrelated
responsibilities that business is beholden to society at any given time. In essence, Carroll’s
analysis assimilates both the classical model and the social values underpinning CSR creed
(Carroll, 1991). Given this, Carroll’s concept entails an entire spectrum of economic and non-
economic expectations of maintaining a profitable sustainable business complemented with
the provision of products and services with economic and technical values to society, while
business is also expected to abiding by the law, by the ethical norms and standards and to
strive to promote the betterment of society (Carroll, 1999; Carroll & Buchholtz, 2009).
The four-part concept was depicted as a pyramid after been revised in 1991, as illustrated in
Figure 1. Carroll portrayed a multi-layered CSR model comprised of economic, legal, ethical
and philanthropic responsibilities that society expects business to meet. At its basis the
economic responsibility is ingrained for being the bedrock for business, hence, it undergirds
the other responsibilities (Crane & Matten, 2010), which are built upward through legal,
ethical while philanthropic responsibilities are at the tip of the pyramid. The crux of fusing
ethical and philanthropic responsibilities springs from McGuire’s (1963, cited in Carroll &
Shabana, 2010) arguing that CSR has other obligations than the growth of economic value
and obedience to the law to typify the entire CSR spectrum.
Economic Responsibilities capture the rational of the neoclassical ideology of having a
profitable business while Carroll asserts that sufficient profit is the acceptable perception as
legitimate to align the rest of the other three responsibilities, hence, the precept of
maximisation profit of neoliberal theme is unfeasible (Carroll & Shabana, 2010; Park et al,
2014). Accordingly, other responsibilities become moot considerations in the absence of a
sufficient profit that does not predispose other responsibilities to be unmet.
The underlying economic imperative is derived from its high relative weighting, as Crane &
Matten (2010) claims, in achieving the other three responsibilities and its importance for
business to strive for stimulating innovation, promoting fair work practices, creating jobs
and the like (Jamali, 2007; Yelkikalan & Kose, 2012).
The second category is the legal responsibilities; in essence, it addresses generating profit
within the local and international compulsory regulatory framework under which business
must operate. By doing so, Carroll asserts that the legal responsibilities are mandatory
whereas if business breaches them they do that at their peril on the one hand by revoking
its social contract to continue and by becoming ostracised. On the other hand, these legal
violation and illicit practices can transcend society reproach to a conviction, herein the first
two of what dubbed as ‘a triple-tier Who’s Who for officials under investigations – those
who are jail bound, those who might be sentenced and those who have the good luck
merely to be embarrassed’, as coined by Hahn (2002, cited in Sims 2003) have given
business a somewhat of tattered reputation and eroded confidence in corporate
governance integrity and ethicality.
By and large the promulgated laws and regulations by governments are touted as ‘codified
ethics’ of acceptable and unacceptable obligations placed on the business, as Carroll (1991)
suggests. To some extent, they constitute the minimum tolerable business behaviour, given
its deficiency they do not explicitly covering many morally contestable issues of newly
emerging values and still amorphous responsibilities, therefore Jamali (2007) concludes that
these legal responsibilities are reactive in nature.
Ethical dimension refers to the expected or prohibited business behaviour that is not
codified into the letter of the law. Respectively, Davis’s (1973, cited in Sun et al, 2010) goes
further acknowledging that responsible ethical behaviour can be said to embody the
periphery of values that situated beyond the legal obligation confines. These
responsibilities incorporate business values and those notions of justice, integrity, honesty,
trust, incorporeal rights of stakeholders and fairness into its practices, policies and decision
making (Crane & Matten, 2010). Sun et al (2010) argue that this dimension implies two
aspirations. First inspiration is cultivated in the Kantian deontological ethics which comprise
the fundamental principles of moral philosophy, whereby the second one emanates from
emerging values and changes in social norms, which may later lead to the creation of new
laws under the pressure of NGOs or civil groups or other stakeholders, however, most
regulations are enacted over time once some kind of consensus is reached (Carroll, 1991;
Cheers, 2011).
Lastly at the apex of the pyramid, the fourth dimension of responsibility refers to actively
engaging in local community through financial and non-financial contributions for a good
cause, promoting the quality of life of employees and the sponsorship of art or education
programs (Carroll, 1991; Jamali, 2007).
Carroll’s four-part definition of CSR has been the most durable and widely quoted model for
its relevant analysis of CSR (Carroll & Shabana, 2010), for its significant contribution of
demonstrating the false status quo concerning the paradox between economic and social
objectives, hence, this model bridges the gap between the two contradictory views.
Moreover its considerable value is associated with the identification of issues in the sphere
of each of the four preceding responsibilities such as employment discrimination,
consumerism and others (Branco & Rodrigues, 2007).
Depicting the responsibilities in four separate building blocks, on the one hand Carroll’s
emphasises the multiplicity of responsibilities that business should strive to uphold. On the
other hand this separation sheds light on a constant and dynamic tension amid these
obligations whereby this can help management accommodating an agenda that redresses
these issues (Jamali, 2007; Carroll & Buchholtz, 2009). Despite this separation, a true CSR
Figure 1 – Carroll’s Pyramid of Corporate Social Responsibility
(Carroll, 1991)
paradigm should compose the fulfilment of these four responsibilities at the same time
(Carroll & Shabana, 2010; Crane & Matten, 2010).
Taken together the foregoing discussion and Carroll’s (1979, 1991) four-fold definition and
analysis of CSR, there is a set of philosophical and normative management concerns to the
duty of business in society addresses opposite ends of a continuum. In other words, ‘the
business of business is business’ that Friedman (1970) argues fervently for only maximising
returns of shareholder and any contribution of corporate resources is deemed to be
depressing the financial value of the business. On the other hand, consideration of social,
legal, ethical and philanthropic responsibilities in business mission, values and strategy to
satisfy the burgeoning demands of these societal attributes can yield strategic advantages to
business. Some of the prominent supporters of this strand are Fombrun et al (2000),
Drucker (2002), Porter & Kramer (2006) and others. To this regard, CSR became a
mainstream in business management by advancing appropriate CSR strategies and effective
CSR activities to reconcile both the economic and the social objectives and achieve suitably
significant return to outweigh the expenditure (Vogel, 2005). Porter & Kramer (2006)
elaborate that business should stray from implying a reactive CSR strategies to a more
proactive CSR that spur the whole ambit of business operations such as value chain activities
and the like (Bartscht, 2013; Bouvain et al, 2013). This view came complementing on Davis
(1973) stance that CSR activities are deemed as institutionalised commitments of business
(Haynes et al, 2012; Idowu & Filh, 2008). Building on this distinction, CSR has moved from
ideology to be an integral part of business canvas (McDonald & Thiele, 2008; Sexty, 2010).
Using this view as a context, Mintzberg (1983, cited in Pomering & Dolnicar, 2008) calls this
theme as enlightened self-interest, in which he asserts that pure economic strategic
decision weeds out business’s commitment to address society claims (Mintzberg, 1978,
cited in Samy et al, 2010). In this regard, business’s growth and continuity are subject to
consumers’ rewarding and punishing influence, thereof managers should honour their
duties both the implicit social and explicit contracts (Isaksson, 2012).
On reflection, Carroll & Shabana (2010) present the business case for CSR corresponding to
the weak justification of CSR on normative grounds pertaining to ethics-orientation of CSR
predisposing it to be criticised by the shareholder camp. The reasoning for the business case
based on its contribution to nurture business economic bottom line as a result of business’s
culture, strategies and operational mechanisms are bound by to act in responsible
behaviour, social and legal manner. The imperative to engage in CSR activities is to produce
direct and clear link to corporate financial performance (Lindgreen & Swaen, 2010;
Blowfield & Murray, 2008). Given its narrow perspective to link CSR to corporate financial
performance as a rationale for the business case for CSR, Vogel (2005) adapts a holistic view
coined as ‘doing good to do well’ that he argues to be the essence of new CSR premise.
The high profile of CSR in the contemporary business is afforded to the support of
multilateral institutions such as the Prince of Wales International Business Leaders Forum
casting CSR activities as:
CSR means open and transparent business practices that are based on
ethical values and respect for employees, communities and the
environment. It is designed to deliver sustainable value to society at large,
as well as to shareholder.
Sharma & Kiran, 2013
More contemporarily, EU Commission (2010, cited in Condosta, 2012) has addressed the
financial sector in its Sixth Environmental Action Program to improve transparency of their
reporting that:
[…] the financial sector’s lending and investment activities have significant
indirect environmental impacts by determining which companies and
activities have access to finance and the conditions attached. Facilitating
disclosure of relevant information by the financial sector and companies
could create an incentive for greener behaviour…
One of the striking initiatives was HSBC reporting its CSR in 2003 to communicate its
philanthropic and community engagement disclosures (Dusuki, 2008). Another
manifestation to promote social voluntary obligations in financial sector social is the Equator
Principles launched in 2003 to provide guidance on the assessment and implementation of
social risks in project financing. It was signed by 30 major international banks – such as
JPMorgan, Citibank, HSBC, Barclays and others (McDonald & Thiele, 2008) – some of which
were involved in the financial meltdown of 2007 onwards. In turn, this has been faced with
cynicism and scepticism about business’s motivations and amount to discrepancies between
CSR rhetoric and practices. Given this, it is argued that banking industry is dominated by the
shareholder paradigm (Mayer, 2013). The views of Dicken (2011) and Relaño (2011) are
quite similar to those of Mayer, they claim that UK economy market deliver on the
neoliberal model of free market capitalism.
By contrast, at the heart of Blowfield & Murray’s (2008) claim is that stakeholder view is the
feature of the modern corporate responsibility. Louche et al (2010) claim that a wide-
ranging CSR – namely economic, ethical, altruistic and strategic – has come to prominence
in the twenty first century. More interestingly, Friedman has alluded in part the importance
of the pertinent ethical custom embedded in discharging business’s function (Carroll &
Buchholtz, 2009). Thus, there are valid reasons to argue that the gaze turned towards
finding guidepost to implement and meet stakeholders’ expectations (Griseri & Seppala,
2010).
At the heart of the preceding controversies, an important question lingering in the public or
a segment of the public that have the practices of the banking industry after the jaw
dropping scandals and fiascos of the FC of 2007 adhering to a cohesive CSR to meet their
expectations and satisfy their conceived demands.
One consequence of this contentious situation is the claim that CSR analysis remains in an
embryonic stage which on one hand creates a perplexing influence on practitioners and
elude further development. On the other hand, it might be argued that the unclear
management strategies for CSR would impact stakeholders perceived CSR.
2.3. STRATEGIC CSR
An economist…and a sociologist are standing in front of a painting by
Lucas Cranach in the museum in Berlin. The picture is of Adam and Eve.
The economist says, ‘I see Adam with an apple and Eve with a leaf. The
economic paradigm is simple. Adam is offering to trade in his apple for a
leaf.’ …‘No, no,’ says the sociologist, ‘they have nothing to eat, nothing to
wear, and they think that they are in paradise.
Mayer, 2013
Contemporarily, the stimulus for business to jump on the CSR bandwagon varies along a
continuum ranging from reactivity to proactivity mainstreams (Boomhill, 2007; Lindgreen &
Swaen, 2010). Likewise, Kurucz et al (2008, cited in Carroll & Shabana, 2010) have
articulated four generic impetuses of the business strategic case for CSR relative to ‘a) cost
and risk reduction; b) gaining competitive advantage; c) developing reputation and
legitimacy; d) seeking win-win outcomes through synergistic value creation.’ While it is wise
for a business to adopt a CSR approach, there is no concrete correlation between CSR and
corporate financial performance as such finding has not yet been conclusively established
(Bhattacharya & Sen, 2001; Pearce II & Doh, 2005; Smissen, 2012).
The three decade quest for the business case legitimate hinges on CSR direct link in boosting
the economic bottom line of the business (Carroll & Shabana, 2010). By contrast, Vogel’s
(2005) syncretic stewardship model for a consolidative framework is based on both direct
and indirect CSR-firm performance relationship. In this view, business can create value to its
stakeholders and capture that value in the form of an enduring and beneficial relationship
with their stakeholders and long term profitability (Freeman & Liedtka, 1997).
Substantively, stakeholder model can be thought of as the acid test of CSR for its application
validity. Outwardly, stakeholder stance is driven by a nexus of relationships envisaged the
interplay between business and diverse constituents, however its manifestation hinges on
the spelt out societal responsibility by identifying the interests of business’s key
stakeholders to integrate them into CSR strategies. Yet, the apparent strength of
stakeholder model might, at least in part, be its major weakness concerning the competing
needs and challenges for each cohort (Mostovicz et al, 2011). To help avert the threatened
conflict of these challenges, management should identify and balance the competing
interests of various stakeholders (Broomhill, 2007). In this regard, one of the key
stakeholder groups is the customer-stakeholder whose attitudes and responses towards
business conduct and behaviour can engender a vigorous criterion for the business’s
viability and profitability (Branco & Rodrigues, 2007; Isaksson, 2012).
2.3.1. CUSTOMER-STAKEHOLDER’S BEHAVIOURAL AND ATTITUDINAL DIMENSIONS AND CSR
Overwhelmingly, there is an extensive literature of CSR in the realm of management
dominated by the multifaceted debate on the feasibility of CSR to business. To illustrate, the
opening quotation marks how much the views of different premises can be contradictory.
As regards the foregoing CSR debate, it has only accommodated the views of both
contemporary economists and business practitioners alike with no regards to one justifiable
avenue pertaining to the quintessential role that customers play in the marketplace which,
arguably, can shed further light on the possible rationales of CSR benefits in terms of
customers’ perceptions of and attitudes towards socially responsible initiatives and
activities. Mulling CSR through the lens of marketing discipline can add another dimension
to the CSR frontier.
The marketing literature of CSR has emerged since the 1960s-1970s with a limited focus on
two streams namely, cause-related marketing (CRM) and environmental marketing
(Maignan & Ferrell, 2004; Beckmann, 2007). Prior research results are generally – though
not completely - supportive of the idea that there is positive association between CSR
behaviours and customers’ responses and attitudes (e.g. Brown & Dacin, 1997; Berens et al,
2007). However, research investigations of others such as Boulstridge & Carrigan (2000) and
Cardigan & Attalla (2001) cast doubt upon the link between CSR and customers’ behaviour
intentions or attitudes.
Most studies have focused on either limited customers’ attitudinal measures including
satisfaction, recommendation, loyalty, trust and the like or behavioural intentions relative
to repeat patronage, exclusive purchase, merchandise consumption, switch brands and
others (Maignan & Ferrell, 2004). These studies sought to answer important questions
raised regarding the customer’s likelihood of engaging in an evaluation of CSR and if so the
extent of it, moreover, the direct and indirect effects of CSR on the evaluation of both
company’s CSR actions and its specific product offering, customer’s purchase intensions,
his/her motivations to pick one brand with CSR attribute over the other and the effects of
CSR campaigns on their loyalty and purchase decision.
In essence, understanding customers’ reactions in the domain of CSR marketing research
strand is developed by three self-connected theories pertaining to ‘consumer inference
making, signalling theory and social identity theory. Customer inference making theory
implies that when customers form a purchase decision about a new product/service, they
may lack information about it. Whereas, they may know that this business incorporate a
social dimension into its behaviour and actions, hence, they may infer positively about the
product (Maignan & Ferrell, 2001). Congruent with this, McWilliams & Siegel (2001)
conclude that the likelihood of a business with ethical standards and norms to offer quality
products/services is high given its reliability attribute in its performance.
Signalling theory addresses the problem of information asymmetry that encounters
customers’ purchase decision making. For example, CSR attribute may act as a signal to
external parties about business’ attributes such as quality, genuine commitment, hence,
customer can distinguish between businesses with high attributes salience to those inferior
(Lech, 2013).
The last conceptual framework of social identity theory relates to customer's degree of
affinity with not just the corporation attributes but also the producing corporation. Hence,
they may identify with a business that enhances their self-esteem when buying from a
business that contributes to worthwhile cause. Building on this, the congruence between
customer characteristics and that of the business is likely to create both positive business’s
evaluation and positive recommendation about the business (Maignan & Ferrell, 2001). In
this context, Vershoor (1997, cited in Bouldstridge & Carrigan, 2000) claims that the
empirical finding of CSR’s influence on customer response demonstrated a positive
association resonated by 75% of customers switching brands to give their patronage to
businesses that behave as responsible citizen.
In effect, such business ethical contributions can have positive influence on customer’s
attitudes towards the business in the form of purchase intention as an ethical behaviour can
act as a transceiver of a differentiated strategy as well as a basis for trust, that is, it can
result in favourable evaluation of the business and in turn can create favourable attitude
towards its products (e.g. Brown & Dacin, 1997; Bhattacharya & Sen, 2001).
Furthermore, Choi & La (2013) suggest that cause-related marketing is allied with
philanthropic activities. In this context, it is argued that customers’ responses to
philanthropic initiatives are complex in which conditional donations elicit a negative
response whereas the unconditional scenario has positive influence on their responses
(Dean, 2003-2004, cited in Chomvilailuk & Butcher, 2010). The conditional donations incur
as a feature of a sales promotion. An illustrative example is the case of the American
Express card donated a penny on each use of the card while contributed a dollar for issuing
a new card. Just over four month, it collated two USD million as a donation and boosted its
market value by 28% (Sweeney, 2009).
In another sense, business can be effective into two different patterns of philanthropic
activities by maintaining a ‘low engagement’ pattern such as cash donations and/or a ‘high
commitment’ which addresses a collaboration approach to assist the efforts of external non-
profit organisations (Pearce II & Doh, 2005).
Moreover, a proactive CSR strategy can increase customer loyalty, as Maignan et al (1999,
cited in Maignan & Ferrell, 2001) claim, that is, business social values can directly influence
customers’ loyalty whereby their moral cognition works as a normative guideline that
affects their behaviour towards business (Roig et al,2013).
It is acknowledged that the sincerity of a company’s CSR motives can help building durable
relationships with customers which, in turn, empirically proved to influence directly
customers’ responses (e.g. Bernes et al, 2005); purchase intention (e.g. Klein & Dawar,
2004); customer satisfaction (Luo & Bhattacharya, 2006); product evaluation (e.g. Brown &
Dacin, 1997); overall evaluation of service quality (e.g. Salmones et al, 2005). Conversely, if
the motives behind pursuing CSR are perceived to be dubious and with ulterior endeavours,
in turn, this may leave the company with negative evaluations and run the risk of consumer
backlash (Mittal, 2008).
Another avenue in the research strand of CSR marketing relates to investigating customers’
responses to a multiple CSR domains. Prior research suggests that combined CSR program of
community involvement, cause-related marketing and environmental concerns influenced
customers’ overall company evaluation (e.g. Brown & Dacin, 1997). Consistent with this, are
the findings of Murray & Vogel (1997, cited in McDonald & Thiele, 2008) research in which a
battery of CSR activities such as socially responsible workplace, worthy causes and
consumer protection resulted in positive responses ranging from pro-employee attitudes to
customers’ improved attitudes.
Despite that potential findings from such research strand can provide sophisticated
attributional reasoning which can reduce the likelihood of falling prey to the critics of
investigating a single domain of CSR which belies the nature of its broad spectrum, there is
scant research in the extant studies. Thus, some academics call for more studies into this
research stream (e.g. Maignan & Ferrell, 2004).
Taken together these studies presumptions and empirical implications, the argument put
forward is that CSR is likely to influence customers attitude in which a multiple CSR domain
is deployed using Carroll’s CSR model.
2.3.2. CSR AND CR
To gain a good reputation, endeavour to be what you desire to appear.
Socrates, long time ago!
In analogy with the study of CSR, the CR has an array of definitions addressing different
disciplines which results in myriad dimensions that are meant to capture its analytical
framework (Caruana, 2008). In the light of the daunting challenges arising from the thorny
issues of the globalising knowledge economy era and from the mounting public scrutiny,
firms have become cognizant of the importance of building and nurturing a good business
reputation that signifies its ability to deliver valued outcomes to its stakeholders (Fombrun
& Shanley, 1990). In their review, Bennett & Kottasz (2000, cited in Trotta et al, 2011)
suggest that CR is best defined as the integration of stakeholders’ perceptions and
expectations and personal opinions that developed over time about a business know-how
and capacity to fulfil stakeholders’ interests. In this view, stakeholder’s future expectation is
likely to be articulated by his/her past perceptions of business behaviour.
Accordingly, CR implies on one hand conveying cues of business’s differentiated strategy
and the intrinsic values of its products CR to the stakeholder groups (Gatti et al, 2012), on
the other hand its multidimensional perspectives articulated upon the different perceptions
of each stakeholders group investigated (Trotta et al, 2011).
Underlying these vantage points are the similarities and differences between CSR and CR. it
can be well argued that both concepts are cultivated within corporate behaviour
investigations and stakeholder model. Arguably, if unattached to stakeholders and not
heeded to their interests, both concepts would be seen as merely abstract concepts (Trotta
et al, 2011). With reference to the differences, it is acknowledged in some studies that CR is
of multidimensional nature while CSR has a descriptive-objective nature (Trotta et al, 2011),
thereof, their complementary interaction constitute value attributable to characterising
business intangible responsibilities and hence accommodating efficient strategies to
respond to these responsibilities, ultimately, in turn capture these opportunities into
intangible assets alongside its physical ones.
Emerging from this remark is that strengthening business’s social bonds with stakeholders
can be considered a form of reputation building and maintenance which in turn undergirds a
competitive advantage in the market place (e.g. McWilliams et al, 2006; Peloza & Shang,
2011) and ultimately reaps long-term prosperity and viability of the business especially in
the turbulent business environment of today.
Subsequently, one instrumental that has widespread application for many companies
seeking to bolster their reputations is the surge up of reputation index ranking of accredited
institutions such as Reputation Institute, Fortune index of CR and Britain’s ‘Most Admired’
Companies wherein amid the rated criteria is quality of management as well as community
and environmental performance (Boulstridge & Carrigan, 2000; Peters, 2007). In one sense,
business uses these tools to heighten business accountability and constructively influence
its social behaviour. In another sense, it uses them to communicate its social commitment
and the different facets it is engage in to convey to stakeholders its coalescence with its
society to promote society well-being (Peters, 2007).
The eminence of businesses’ reputation for deploying socially responsible practices and
social attributes to their offering can enhance business financial posture through cost
reduction that accrues from customer satisfaction and productivity of employees (Isaksson,
2012). In turn, such positive outcomes accumulate a stock of a firm’s reputational capital. In
other words, if CR is not maintained negative outcomes incur translated into impoverished
revenues, the volatility of CR is touted as reputational capital which constitute business
intangible assets. Under this reasoning, Accenture - a global consulting firm – draws
attention to the upsurge in businesses’ intangibles from 38 per cent of total business value
in 1982 to 84 per cent in 1999 (Bouvain et al, 2013).
Furthermore, a reactive CSR strategy, as Broomhill (2007) claims, embodies the adoption of
socially responsible manner in business’s decisions to alleviate negative reputation and
potentially regain legitimacy. By doing good, arguably, business can mitigate the risk of
reputational losses which if not wisely treated can rigorously damage the consumers’
confidence and trust in business (Boulstridge & Carrigan, 2000) and even worse by having a
negative effect on generalised trust (Cruijsen et al, 2013).
This could be, at least in part, because it takes decades to build up a reputation, however, it
can be ruined in a split second by incidents such as the corruption scandals or the
environmental accidents, hence, causing a bottom line backlash for these businesses.
Moreover, Park et al (2014) claim that there is a direct positive link between economic and
legal CSR and CR, though an indirect impact of ethical, philanthropic CSR on CR was found in
which customer trust fully mediated this relationship. Regarding economic CSR and CR, the
product safety and its quality have a positive impact on CR, whereby the wrongdoings of
some companies for their illegal acts lead to a tarnished CR and to public resentments. With
respect to the latter two CSR activities, the logic behind this is that the perception of the
sincerity and trust surrounding CSR motives are the factors of creating positive corporate
evaluation.
2.3.3. THE MEDIATION EFFECT OF CSR
From the aforementioned review, the argument put forward is that CSR can influence the
relationship between CR and customer behavioural intentions. As such, CR can have an
impact on customer behavioural intentions through the effect of CSR. In this regard, many
authors pinpoint a positive association between CSR reputation and customers’ responses.
It is worth noting that reputation is likely to lead to customer engaging in positive word of
mouth, emotional attachment to the store and repeat patronage (e.g. Lichtenstein et al,
2004, cited in Chomvilailuk, & Butcher, 2010).
As alluded to in the foregoing sections, the prevailing assumptions insofar yield customers’
support to and favouring of social responsible businesses. The well-documented CSR effects
on customers’ responses and behaviour spring from the ensemble of CSR social attributes
that inculcate customers’ confidence and trust into business which go hand in hand with
bolstering its reputation as a social responsible business. Drawing from this, it could be said
that CSR activities mediate the relationship between CR and customer behaviour intentions
which this study tends to investigate.
2.4. CONCLUSION
This chapter is articulated around the multifaceted debate on CSR justifications either on
shareholder or stakeholder grounds. Martin et al (2009) bluntly pronounced the state of
affairs surrounding the debate on CSR as ‘both would argue, vehemently, at times that it is
an either-or proposition: if I am wrong, then you must be wrong.’ Metaphorically, the
shareholder and stakeholder could be seen as the unattuned strings of a violin. Hence, the
composed CSR mantra is one of dissonant as the violin’s bow sometimes hits only the
shareholder string to reflect the domination of the neoclassical economists view; another
time it would only hit the stakeholder’s one. Thus, the tune composed is missing a sharp
stroke to create a well-tuned mantra – the rationale behind justifying the adaptation of CSR.
To gain a dynamic articulation of this mantra, there is a need to calibrate the two strings
into a vibrant theme that strikes the listeners – the business’s constituent groups including
the shareholders cohort.
Hence, to unveil whether the presumption of an untuned theme is the status quo or the
current CSR activities have been tuned after the FC of 2007 to meet its stakeholder’s needs
and expectations, the research will seek the voice of customer-stakeholders. Set against this
outlook is the research question:
Has the FC been a wake-up call for CSR activities to resonate with customer-stakeholder
expectations to create a sustainable business?
Chapter 3: Methodology
3.1. INTRODUCTION
This chapter is built upon the pillars of formulating a coherent research design. It sheds light
on the adopted philosophical stance concerning the nature of the research enquiry which is
dovetailed with the formation of the research methodological choice and related strategy
(or strategies). That is, it implies the rationale behind the chosen methodology, the verified
research approach and data collection techniques that are developed to answer the
research question with reliable results and to fulfil its objectives. Finally, the data analysis
techniques are outlined.
3.2. RESEARCH PHILOSOPHY
The definition of a “research process” – a systematic way of collating and construing
information to generate or increase our knowledge in a rigorous analytical way to provide
valid and reliable findings – had a profound influence on the constitution of the three
phases, illustrated in Figure 2, that were used to help achieve the objectives of the research
(Saunders et al, 2012). To leverage a coherent research process, the two latter phases –
execution and analytical – were informed and guided by the development of the research
question and objectives in the formulation phase – Introduction and Literature Review.
To address this, the formulation phase provided the theoretical framework for the proposed
hypotheses that aimed at answering the research question. Embedded within this
framework is the philosophical perspective which maintains the study worldview about the
nature of what we seek to know and the process by which acceptable knowledge is
developed. Thereof, the research philosophy constitutes the assumptions that relate these
theoretical ideas to the real world (Figure 3) through two lenses relative to the issues of
what is the nature of the social entity to be researched (ontology) and how can (or should)
we develop our knowledge in this discipline (epistemology) (Creswell, 2003; Bryman & Bell,
2011).
(Adapted from Hair et al, 2007)
Figure 2 – Research Process
3.2.1. ONTOLOGY: THE NATURE OF REALITY
Ontology comprises the substantial precepts for every research blueprint which is anchored
in our beliefs about the nature of reality and the constituents of the object of investigation.
The ontological assumptions are related to what is out there to know about the social
entities. To this regard, the central point of orientation stems from whether these social
entities can or should be regarded as objective entities that have a reality independent of
the social actors or whether they can or should be constructed by them (Bryman & Bell,
2011; Camilleri, 2012). These contrasting views are respectively referred to as objectivism
and constructionism (or subjectivism) (Porta & Keating, 2008) which portray opposite ends
of continuum’s polar to which researcher embarks upon one end that would enhance the
understanding and the justification of the research strategy and data collection techniques.
While researchers who adopt the objectivist approach hold the view that social phenomena
is independent of their perceptions of it, the subjective stance views reality as being socially
constructed for which individuals develop subjective meanings of their own experiences and
backgrounds. As such, these meanings are formed through active involvement of people in
Figure 3 –
(Lee & Lings, 2008)
reality construction and through historical and cultural norms of the context (Creswell,
2003) which result in multiple perspectives of an event by virtue of the different
interpretations being engendered.
3.2.2. EPISTEMOLOGY: HOW WE JUSTIFY OUR KNOWLEDGE OF THAT REALITY
The ontological stance entails the point of departure from which the core assumptions
concerning epistemology initiated (Lee & Lings, 2008). In this context, epistemology is
concerned with the relationship between the researcher and reality. Ultimately, it underlies
the nature of knowledge, the most appropriate ways of pursuing, acquiring and/or creating
that knowledge as well as the limits of knowledge (Porta & Keating, 2008; Camilleri, 2012).
Notably, given the propositional claim of this knowledge, it needs to rest on a body of
evidence (induction) or a reliable theory (deduction) to promote valid and well-
substantiated findings, thus this knowledge can be well justified (Lee & Lings, 2008).
The underlying epistemological assumption draws on how one comes to know reality
(Camilleri, 2012). In turn, it informs the choice of research methods ranging from the
quantitative and statistical techniques, the qualitative research methods to mixed-methods
research design.
3.2.3. RESEARCH PARADIGM
At a broad level, the epistemological considerations render into the research work plan of
how to go about generating this knowledge, that is, these processes that govern the
methods by which research is carried out form the research methodology. Building on this,
what Lee & Lings (2008) term as the ‘ologies’, which are derived from research ontology,
epistemology and methodology, embody an ‘interpretive framework’, as Denzin & Lincoln
(2000, cited in Le Roux, 2012) purport. This framework forms the so-called research
paradigm; in effect these ologies directly or indirectly outline the research paradigms. More
interestingly, the word paradigm – origin Greek paradeigma – symbolises a pattern. In this
view, research paradigm is a pattern of scientific and academic ideas, key issues,
assumptions and data collection methods.
The most prevalent paradigms embody a long standing tension about whether the social
world should be studied according to the application of the methods of the natural sciences.
Advocates of the natural science’s ethos to the study of social reality cultivate the precepts
of positivist research paradigm. On the other end of the spectrum is the interpretivist
research paradigm denoting an alternative to the positivist orthodoxy which is based on an
understanding of human behaviour and subjective meaning of social action through the
eyes of different participants (Camilleri, 2012).
3.2.3.1. POSITIVISM
The tenets of the positivist stance emanate from the philosophical ideas of the French
Philosopher August Comte (1798-1857, cited in Neuman, 2006) which implies that valid
knowledge (truth) exists, is already there waiting to be revealed, and is independent of the
human mind. Hence, the researcher’s task is to uncover truth using quantitative and
statistical methods. At the ontological level, philosophical positivism is articulated around
facts that exist objectively which are directly observable and measurable (e.g. Walsham
1995; Blumberg et al 2008). Positivistic thinkers emphasise the verifiability of theories
through empirical testing of deduced hypotheses which are only considered meaningful if
they are empirically verified, thereof this leads to the discovery of universal laws of human
behaviour (Lee & Lings, 2008; Bryman & Bell, 2011).
The positivist social science takes the stance that knowledge is acquirable and
methodologically naturalistic to systematise the knowledge generation process with the
help of rigorous measures and careful collection of data to explain cause-and-effect
relationships and predict general patterns of human activity (Neuman, 2006). However, the
detached epistemological stance of the positivism and reducing the world to observable
objects and facts, in the view of critics, are not very justified. Critics attribute this to the
establishment of superficial correlation of the observable elements with no regard to the
unobservable mechanisms that underlie institutional forms and practices. Opponents of
positivism also reject the application and interpretation of science to the study of social
reality (Alvesson, 2009; Camilleri, 2012).
Notwithstanding, proponents of positivism assert that observing external reality is
prominent than developing subjective meanings of the social actions in terms of providing
adequate explanations of human thought and action which is the manifestation of direct
observation of realities and regularities (Camilleri, 2012). Positivists hold the view that
reality is patterned and has order, however, if it is bypassed, or if there is no regularity in
social reality, a rational logic of decision making and prediction would be impossible.
3.2.3.2. INTERPRETIVISM
Another intellectual tradition contrasting the epistemology of positivism is interpretivism
which holds that social life is underpinned by social interactions and socially constructed
meanings stem from people’s subjective experiences. Given the complexity of the
contemporary social world, the focus of this tradition is to develop inferential generalisation
to capture insights of this complex world rather than reducing this world into a series of law-
like generations of the positivist stance. In this sense, a qualitative analysis (versus
quantifiable) is employed in the domain of interpretive research whereby meaning-oriented
methodologies such as ethnography and in-depth interviews are highly contextual
(Saunders et al, 2012). As such, the nature of the interpretive methodology and the context-
specific orientation make generalizability – which is concerned with the results of the
undertaken research being transferrable to other situations – far more difficult. Hence,
these results cannot be widely generalisable instead they generate local understanding (Lee
& Lings, 2008; Camilleri, 2012).
Owing to the ontology’s tendency towards exploring reality through meaningful actions, this
results in forming multiple realities whereby there is no single correct route to knowledge
(Alvesson, 2009).
3.2.3.3. RATIONALE BEHIND CHOSEN PARADIGM
Emerging from the preceding remarks of the two paradigms, the framework of this study
adopted the positivism tradition. The crux of this reasoning lies in some propositions shaped
in the multifaceted debate on CSR that gripped the banking sector with regards to its
ascribed role in the post FC of 2007. Also, this study is set out to capture the social reality
pertaining to the CSR streams that gauge customer-stakeholders’ attitudes towards CSR that
symbolises its development to meet their demands. In line with this reasoning, the
positivism philosophy maintains that there is one reality that is observable and meaningful
based on a proper treatment of empirical data which is not the case with interpreivism
(Holden & Lynch, 2004). Given this, adopting a positivistic stance is consistent with the
study’s aim to find out a consensus on CSR activities that is likely to address customers’
demands and provide means for business sustainability.
Moreover, the application of scientific methods to create generalisable knowledge
stemming from the causal analysis of the operationalised concepts that constitute the
research variables resembles the study aim. This approach would equip the study with
rigorous analytical methods to investigate whether the shareholder-stakeholder debate is
pseudo or there is a real issue in this discipline which if confirmed would provide legitimate
grounds for the next implications of adhering to the positivist stance. In this context, the
causal analysis can help in promoting a management agenda by gaining insights into the
causes and effects of the research variables to inflict reflective decisions.
3.3. RESEARCH DESIGN
If we knew what it was we were doing, it would not be called research,
would it?
Albert Einstein
In light of Einstein quotation, a crucial tool in the social researcher’s armoury is the research
design which is regarded as the ‘recipe for carrying out the project’ as Hair et al (2007)
pinpoints. From the outset, the researcher needs to devise a coherent research strategy
which is guided by the researcher’s adopted philosophy, research approach (relationship to
theory), the nature of research and access to data.
3.3.1. RESEARCH APPROACHES: DEDUCTIVE, INDUCTIVE AND ABDUCTIVE - FROM REASON TO
RESEARCH
The ‘research approach’ indicates how data can be collected by delineating the relationship
between theory and research. There are three different approaches based upon the
reasoning adopted through the research paradigm: deductive, inductive and abductive
(Table 1).
With regards to deductive approach, the emphasis is on the development of a theory for
which an empirical scrutiny is deployed to test a hypothesis(ses) (Bryman & Bell, 2012;
Saunders et al, 2012). These hypotheses will need to be translated into operational terms
(Bryman & Bell, 2012) in the form of independent variables that can be active – variables
that the researcher can manipulate – or attribute – in contrast with the active ones as they
relate to gender, race and the like (Newman & Benz, 1998).
The point is that the independent variables are the measurable characteristics which cause
effects on the dependent variables. Hence, these measured concepts can be formed into
Table 1 – Research Approaches: Deduction, Induction, Abduction
(Saunders et al, 2012)
quantifiable data collected through quantitative instruments such as a survey questionnaire.
As such, after the rigorous evaluation – based on testing the reliability and validity – of the
measures of concepts, the hypotheses can then be tested using an appropriate statistical
technique and will only be accepted if they survive the ordeal (Sohail et al, 2008).
This scientific approach is called a hypothetico-deductive (deductive-empirical) method in
which the aim is theory testing. Hence, it is contrasted with the other two approaches:
inductive and abductive (Hair et al, 2007). The notion hypothetico-deductive first emerged
from the perceptions of philosopher Karl Popper (1959, cited in Juma'h, 2006) which rely on
the logic of testing falsifiable hypotheses for which the scientific approach is driven by
systemising the search for conflicting information. The falsification principle contrasts the
empirical verification in which hypotheses are either verified or refuted by the observed
effects. The last characteristic of deductive reasoning is the embedded causal explanation
that incorporates a sufficient level of generalisation to apply findings of the research study
to other settings (Camilleri, 2012; Saunders et al, 2012).
With inductive reasoning, the outcome is the formulation of a theory which entails
generating inferences out of observations. By its very nature, inductive research employs
qualitative methods and often uses a grounded theory approach to the analysis of data and
to the generation of theory (Porta & Keating, 2008; Saunders et al, 2012). On the other
hand, the abductive stance involves weaving back and forth between data and theory. In
effect, it leverages a complementary approach which entails a process that iterates between
deduction and induction (Hair et al, 2007).
3.3.2. FIXED AND FLEXIBLE ORIENTATIONS TOWARD RESEARCH DESIGN
Research designs are mapped based on distinguishing between two salient typologies –
fixed and flexible. One of the differences between them comes from the degree of pre-
specification of procedures that characterises the requirements for the most suitable design
to be employed such as the use of pilot testing in the quantitative approach. Another
difference is the nature of the data. The former – fixed – is characterised by data collection
techniques and analysis procedures that generate or use numerical (hard) data, thus
researchers deploy the positivism paradigm. Conversely, the latter design collects
qualitative (soft) data in the form of words, impressions and so forth which means that
social researchers rely on interpretive paradigm (Robson, 2011).
Quantitative research is most likely constructed using a deductive approach whereby the
focus is on collecting data to test theory. Hence, the strength of its implication capitalises on
three factors – concepts’ measurement, causality and generalisation. Measurement involves
the consistency of the research results and assesses whether the indicators devised to
gauge the concepts – the building blocks of theory that can be observed and measured to
explain variations when testing hypotheses – really do reflect those concepts. These sketch
respectively the research reliability and validity (Bryman & Bell, 2012).
With regards to causality, its importance is driven by the researcher’s ability to impute it in
their findings. In terms of quantitative research, the daunting challenge is to explain the
causal relationships that are responsible for some phenomena by identifying the possible
correlation between its dependent and independent variables. Moreover, this causal
explanation strives for generalising findings from a sample to a wider population. Given this,
the sample has to be as representative as possible in order to be applicable to other settings
(Hair et al, 2007; Tam, 2007).
In contrast is its qualitative counterpart whereby data gathered is not statistically
representative. Hence, researchers confine themselves to providing contextual
generalisations or making theoretical generalisations that are concerned with the empathic
understanding of human actions rather than with the explanation of these actions as in the
case of quantitative research. In this framework, qualitative research design is associated
with inductive approach for which limited or no prior specification of variables of interest is
required (Creswell, 2003; Bryman & Bell, 2012). Moreover, flexible can coincide with mixed
method which is not within this study scope.
3.3.3. RESEARCH STRATEGY
Drawing on the fixed and flexible research design typologies as sketched by Robson (2011),
the fixed designs can constitute experimental and non-experimental strategies. The typical
form of the experimental strategy owes its nature to the quantitative research design that
implies manipulating the independent variable to assess its influence on the dependent
variable whereby the researcher conducts quantitative comparisons between control and
experimental groups with regards to the dependent variable.
On the other hand, the non-experimental strategy for the fixed research design includes
survey study and secondary data collection methods. With reference to flexible design, it is
carried out by one of the following approaches: case study – which could be conducted
using qualitative, quantitative or mixed as Robson (2011) argues – whereas the remaining
strategies embody only qualitative data collection such as ethnography, interview study and
discourse analysis.
Guided by the adopted positivistic stance, a fixed survey study was used. In light of the
deductive approach of this research, the generalisability property of the quantitative survey
study, its causal analysis and condensed data fit its descriptive and explanatory nature.
Descriptive Research is designed to provide an accurate profile of what has been observed.
The outcome is a detailed sketch that can be an extension of exploratory research or, more
likely, a piece of explanatory research. Accordingly, this social research focuses on questions
as how, who, when and where to present a snapshot of events over time – longitudinal
studies – or situations at a given time – cross-sectional results. It can be a forerunner to
explanatory studies. Such studies are so-called descripto-explanatory (Saunders et al, 2012).
With reference to explanatory research, the primary purpose is to seek explanation of how
and why events occurred; thereof it strives to establish cause-and-effect relationships
(Saunders et al, 2012).
Building on this, the nature of this research subscribes to a descripto-explanatory stance.
Given the multidimensional nature of the CSR paradigm, the rationale behind conducting a
descriptive study is to obtain data that identifies and describes the characteristics of
multiple CSR domains relevant to the level of importance concerning CSR activities to
customer-stakeholders.
Moreover, at the heart of this research lies a systematic quest to reveal enlightening
insights by explaining the likelihood of a bundling of CSR activities that can influence
customers’ attitudes and behaviours as well as the possibility of CSR to affect the reputation
of the business.
3.3.4. THE DATA COLLECTION PHASE –SURVEY QUESTIONNAIRE
Questionnaire instrument is the most widely used data gathering technique within the
survey strategy. It is perceived to be used as an interactive method of sourcing primary data
(Lee & Lings, 2008; Saunders et al, 2012) that represents a snapshot of a situation at a single
point in time – cross-sectional study – or that is captured over a longer period time at a
number of points in time (Creswell, 2003; Hair et al, 2007).
Respondents are asked to respond to a consistent set of clear and unambiguous statements
or questions that might comprise open-ended questions in which respondents provide their
own answers and/or standardised, also referred to as close-ended, questions in which
predetermined mutually exclusive and exhaustive responses are formed (Babbie, 2004; Hair
et al,2007; Saunders et al, 2012).
Framing relevant questions convey a set of interrelated activities that must be considered to
develop an efficient and well-structured survey. In this sense, a good design of these
questions, a logical flow in the structure of a questionnaire, an appropriate method by
which the questionnaire is administrated and a rigour of its pilot testing would foster an
adequate reliability of the data collected and acceptable or even sometimes significant
response rates (Hair et al,2007; Saunders et al, 2012).
With reference to the methods of administration to sample, there are wide-ranging means
with which a questionnaire can be delivered, returned or collected. This is exemplified in
using self-administrated (or completion) methods which include postal and electronic
surveys whereby they are completed without a researcher present. Hence, this type of
survey requires a highly structured questionnaire with an easy-to-follow design and a clear
presentation with spreading out questions in the questionnaire to be sufficiently appealing
that participants actually complete and return it, potentially increasing the response rate
(Bryman & Bell, 2012). Saunders et al (2012) point out that a feasible length of
questionnaire should be between six to eight A4 pages for postal survey or the equivalent of
them for the online. A covering letter should accompany the questionnaire introducing it
and its content along with ethical commitment. This implies avoiding confusion and
vagueness of the research purpose as well as building up trust and confidence to induce
respondents to complete it.
Self-administrated questionnaires are especially advantageous over structured interviews
for being cheap and quicker to administer, more convenient to respondents in terms of the
time and speed of completing them and, most importantly, eliminating the social
desirability bias due to the absence of an interviewer. However, this type of questionnaire
has some drawbacks such as that it can be read as a whole without control over the
sequence in answering the questions; it could suffer from a low response rate and greater
risk of missing data (Sweeney, 2009; Bryman & Bell, 2012).
To elicit the benefits from using a self-administrated questionnaire whilst overcoming and
minimising its pitfalls, the survey devised for the research in question took the format of a
self-completion questionnaire that was administrated via the Internet using the Survey
Monkey software. Notably, the internet is having a substantial impact upon research within
which the use of web-delivered surveys is growing for a multitude of reasons that include
quick and direct form of access to sample, the economical collection of large amounts of
data, the moderate response or return rate compared to lower rates associated with postal
questionnaires, and its technical features that help spreading out questions over a number
of pages, having questions answered in a sequence and help avert the risk of missing data
by not progressing through before answering all questions on each page (Babbie, 2004;
Neuman, 2006; Barton, 2010).
3.3.4.1. THE QUESTIONNAIRE’S LAYOUT AND CONTENT
To operationalise the ‘Total Design Method’ purported by Dillman (1978, cited in Babbie,
2004), the preceding considerations were taken into account to exhort valid findings
confined by the specifications of the quantitative scientific research e.g. being logical,
objective, value-free and empirical verification. Drawing on these insights, the web-based
questionnaire was disclosed with a clear unbiased title, followed by an introductory
covering letter tapping on the aim of the study, the structure of the questionnaire,
instructions of how to complete it and an explanation of CSR terminology accompanied by
real-life examples to illustrate the responsibilities in order to make it easier for the
respondents to relate to the questions and statements and, at the end, a thank you note for
their valuable participation.
The questionnaire had a clear layout and care was taken to avoid leading questions, double-
barrelled statements and unbalanced responses. By using the features of the Survey
Monkey software, the survey was programmed so that respondents could not proceed to a
new page before answering all questions on a given page which is used to control missing
data. Another feature was used to lock the questionnaire so that at completion it would not
be done twice by the same IP address.
The survey comprised four sections over five pages and consists of 23 close-ended
questions. The justifications for that over open-ended questions are that less time is needed
for answering them which justifies the twenty minutes estimated for its completion in the
introduction, maintaining uniformity in the data gathering process and making it easier to
compare the answers of different respondents whereas open-ended questions are most
suited to exploratory research whereby little or nothing is known (Appendix C).
In section A, eight list questions (e.g. tick the appropriate box) requested background
information concerning age, education and so forth. These questions are of a factual nature
for which a single variable is used in each question to collect socio-demographic
characteristics about the sample. Even though it is preferable to have this section at the end
of the questionnaire so that the participant does not break off early, it was placed at the
beginning because one of its subset questions is designed as a filtering question to
circumscribe progressing into the questionnaire if the participant does not have a UK
account.
Section B consisted of ten questions that canvassed customer-stakeholders’ satisfaction of
perceived CSR following the FC of 2007. The participants were asked to respond using a
five-point Likert scale to a range of questions, some of which were constructed into a matrix
format for subscale questions.
The Likert rating scale was used to assess the strength of agreement or disagreement about
their banks adhering to four dimensions of CSR activities adapted from Carroll’s CSR
framework which deal with economic, ethical, legal and philanthropic dimensions in the
post FC of 2007. A five-point Likert scale ranging from 1 (Strongly disagree) to 5 (Strongly
agree) was used. Using the same five-point scale, respondents were also asked to indicate
their level of agreement or disagreement with each statement relevant to their trust into
their banks after 2007. They were requested to divulge their level of expectations of the
bank sector aligning with their demands and needs after 2007 by interpreting the Likert five-
point interval scale – 1 (Substantially below expectations) to 5 (Substantially exceed
expectations).
Since the sequence of the questions have a major influence on the accuracy of the collected
data, the logical flow of questions geared to capture respondents’ perceptions of their bank
CSR activities first and then their overall perceptions of the bank sector. This sought to get
their brain primed for the more salient questions gauging their satisfaction of the banking
sector.
Section C delved into the level of importance of Carroll’s CSR four dimensions to influence
their purchase decision of bank’s financial products in which the five-point Likert scale is
coded from 1 (Not at all important) to 5 (Very important). Finally, Section D catered to
capturing the level of agreement-disagreement with statements gauging the effect of
engaging into CSR activities on bank’s CR.
The statements and variables in the research instrument are derived from and built upon
the analysis of secondary sources constitute of literature that are based on a number of
critical theoretical threads presented in Chapter 2 and other items from earlier
questionnaires that were culled or adapted to reflect the objectives of the current study.
Question 9 was partly derived from Choi & La (2013). Question 14 was adapted from Mulki
& Jaramillo (2011). Question 21 was adapted from Ellen et al (2006) and Osterhus (1997).
Incorporating items from previous research allowed reliability and validity in the sense that
these questions have already been pilot-tested; hence, they are empirically founded
(Barton, 2010; Bryman & Bell, 2012).
3.3.4.2. PRETESTING AND PILOTING THE SURVEY
Questionnaires do not emerge fully-fledged; they have to be created or
adapted, fashioned and developed to maturity after many test flights. In
fact, every aspect of a survey has to be tried out beforehand to make sure
that it works as intended
Oppenheum, 1999 cited in Sweeney, 2009:130
Guided by the ‘Total Design Method’ of Dillman’s (1978) proposition and the insights of
Oppenheum to ensure that the research instrument as a whole functions well and evaluate
its feasibility, the developed questionnaire should be pilot-tested prior to administrating the
final survey study to the sample. This evaluation is in the form of a small scale replica of the
actual survey to be carried out to reveal issues related to wording, sequencing, questions
duplication, the adequacy of the range of responses to each question and any weaknesses in
the design. As this would suggest, calibrating the questionnaire draft in accordance to these
revealed insights will help enhancing the validity of the questions and the reliability of the
data that will be collected. It will also acquaint the researcher with an indication of the
response rate to be expected of the final study (Sweeney, 2009; Barton, 2010).
The first draft of the questionnaire was presented to the research supervisor and then pre-
tested among academics and professionals. The feedback received reported duplication in
some questions and some wording errors. Hence, the draft of 26 questions was refined to
23 questions and some examples of CSR activities in the banking sectors were given for
more clarity. The survey was redrafted and then tested with a sample of ten respondents of
bank customer-stakeholders. The number of ten participants in the pilot is acceptable which
is in line with the recommendation of Saunders et al (2012) as a minimum number to
conduct a pilot for most questionnaires.
Each participant received an email informing them that the questionnaire for which a link
was attached was for a pilot study and they were encouraged to provide their feedback on
irrelevant questions, inappropriate flow of the questions, technical jargon or ambiguous
scale items.
Concerns over the usage of American terms for describing the types of bank accounts were
voiced during the second stage and also the pilot indicated a low response to few
statements that needed to be associated with examples of these CSR activities in the
banking sector. Accordingly, typographical changes were made and these statements with
low response contained an example related to these CSR undertaken in the banking sector.
These recommendations were incorporated into the survey before the final administration
of the survey.
3.3.4.3. THE SURVEY ADMINISTRATION AND RESPONSE RATE
After adjusting the second draft of the questionnaire following the pilot study, the survey
was fielded from the 14th
of July until 12th
of August 2014 and included two reminders. An
invitation email including the URL link was sent to respondents who can click-thru
sequences on Survey Monkey web site to complete the questionnaire online (Appendix A).
The email was sent to all 200 email addresses on the researcher’s list. Within the first five
days 38 responses were collected. Using a feature of the Survey Monkey software, the non-
respondents were located. Thereof, the first follow-up email was sent after six days to all
recipients. It included a thank you note to early respondents and the located non-
respondents received a reminder to answer with a copy of the link.
The first reminder produced only 26 additional responses (Appendix B1). Therefore, ten
days later, a final reminder was sent with the closing date for the survey to highlight the
urgency of completing it (Appendix B2). This resulted in a further 62 responses and the
questionnaire was closed at midnight on 12th
August.
Guided by the techniques used during the data collection – analysed and synthesised in the
methodology literature, sufficient response rate for the research in question was achieved
whereby 127 questionnaires were returned thus yielded an initial response rate of 63%. Of
these, 4 questionnaires were disqualified by using the filter criteria for allowing only
respondents who currently have UK account to progress. In addition, 31 questionnaires
were excluded from analysis as they were only partially completed. Although the survey was
programmed for not advancing to the next page if a question is skipped, the 31
uncompleted questionnaires were incurred by exiting the website of the survey. The final
response rate is 46% for the 92 usable questionnaires that were accepted as valid for the
data analysis.
3.3.5. SAMPLING METHOD
The setting for this empirical study was the UK banking industry given its vital role to the
development of the country’s economy based stemming from its part in bridging surpluses
and deficits in the economy. Within this context, the study population and sample elements
were drawn.
Sampling constitutes a key step in the social research process. It is the method by which
specific cases or events are selected for participation in a study whereby the gist of it is to
estimate some unknown characteristics of the population (Zhowa, 2010). As its name
implies, a sample is a segment of the population that a researcher selects to arrive at a
conclusion regarding the whole population (Bryman & Bell, 2012). Accordingly, a population
or universe is that aggregation of the units in a study which have some homogeneous
characteristics that may influence the variables of interest (Lee & Lings, 2008; Zhowa, 2010).
The method of selection was articulated by one of two approaches namely: probability and
non-probability methods. With probability sampling (or representative sampling), some
random-selection mechanisms are employed in which the chance of each unit being
selected from the population is known, thus each case has an equal possibility of being
selected. Consequently, a probability sample is considered representative of the population
from which it is drawn (Babbie, 2004; Neuman, 2006; Han, 2006; Bryman & Bell, 2011). The
aim of recruiting this technique is to keep sampling error to a minimum. This error refers to
the degree of deviation between a sample and its population (Neuman, 2006).
Garnering a representative sample is based on five sufficient steps as presented in Figure 4.
A target population embodies the specific pool of sampling units that the researcher aspires
to generalise the results of. Obtaining a sampling frame is essential for providing a working
definition of the target population as it encompasses all units in the population from which
the sample will be drawn (Saunders et al, 2012). Another critical factor in creating a
representative sample is contingent on its size. In essence, the larger the size of the sample,
the higher the likelihood of the precision and accuracy of data collection from it because
that is more likely to reduce error in generalising to the population. Moreover, the type of
Figure 4 – The Process of Probability
Defining the target
population
Choosing the
sampling frame
Determining the
sample size
Selecting the most
appropriate
sampling technique
Checking that the
sample is
representative of
the population
(Saunders et al, 2012)
analysis that is intended to be used will determine the threshold of the sample size. Another
two constrains that can affect the choice of the sample size are the amount of time and cost
that are needed to collect, check and analyse the data (Bryman & Bell, 2012, Saunders et al,
2012).
Probability sampling techniques include simple random, systematic random, stratified
random and cluster sampling. The choice between these techniques depends on which is
most appropriate to answer the research question and address its objectives. The first
technique entails randomly selecting the sample elements from the list of all units of the
population. A slight modification is systematic sampling, where every Kth (e.g. 15th) unit in
the sampling frame is selected at regular intervals (Babbie, 2004; Hair et al, 2007).
With stratified random sampling, the sampling frame is divided into relevant strata –
relatively homogenous subgroups – and then randomly or systematically sampling within
these strata. Thus, each of the strata is represented proportionally to accurately mirror the
population (Hair et al, 2007). As for cluster sampling, it involves breaking the population into
discrete groups (clusters) and then samples are drawn from the aggregated units or clusters.
In this criterion, the sampling frame comprises a complete list of clusters rather than
individual cases (Neuman, 2006; Hair et al, 2007).
The fundamental idea behind employing probability sampling techniques is that it is more
likely to yield a representative sample that allows for drawing a statistical generalisation
from it to its population. To achieve a perfect representative sample, a sampling frame of all
units must be available which can hardly ever be achieved for some research inquiries. In
addition, it is considerably more expensive and time-consuming which does not fit with
limited research sources. However, there are other ways that could be considered to
evaluate the worth of a good sample strategy such as sample size, the level of response rate
and the construction of the instrument questions (Lee & Lings, 2008).
Constructing scientifically sound samples can be constituted by using non-probability
sampling methods which address those challenges of employing a probability sampling in
terms of safeguarding the use of non-random techniques in which units of the sample are
selected on the basis of different settings such as convenience, personal judgment,
snowballing and quota sampling. Given this, non- probability samples can be used for such
quantitative studies where it is not possible to establish a clear frame (Turner, 2003; Brown,
2012). On the other hand, the subjective judgement involved with selecting such samples is
conducive to be used for sampling in qualitative research which leads to generalising
findings to theory – theoretical generalisation – than statistically generalising to a
population- effect generalisation (Lee & Lings, 2008; Lynchi, 2011). Subsequently drawing a
representative sample is not necessarily required since the significance of the research
findings relates to its relevance to the research question and objectives; that is, statistical
generalisation of findings is not the goal (Neuman, 2006; Lee & Lings, 2008). The canons of
non-random techniques are briefly outlined hereunder.
In convenience sampling (or availability sampling), sampling units are selected out of
convenience (Babbie, 2004; Bryman & Bell, 2012). Whilst the main drawback for using
convenience sampling is embedded in the generalisability of findings concerning the
selection bias of participants being different from the target population, it is widely used in
social research inquiries because of benefits such as accessibility and a low non-response
(Lee & Lings, 2008; Saunders et al, 2012).
A snowball sampling, as the name implies, is a referral sample for which the researcher uses
the initial respondents to help identify other cases relevant to the research topic and then
repeats the process again until it reaches a saturation point where there are no new names
given. However, the danger of using such a technique is embedded in the problems of bias
as respondents are most likely to identify others based on interrelationships (Saunders et al,
2012).
A purposive technique involves selecting units for a specific purpose on the basis of the
researcher’s judgement. These units are the ones that will be the most useful to answer the
research question or representative of the target population (Babbie, 2004). However, the
views of Hair et al (2007) are quite similar to those voiced by Neuman (2006) and Lee &
Lings (2008) that this technique is not necessarily representative of a population.
Another non-probability technique is the quota sampling that resembles stratified random
sampling, however the selection of units is entirely non-random (Bryman & Bell, 2012;
Saunders et al, 2012). Although this technique may reflect a population in terms of the
relative proportions of people in different categories, opponents of probability sampling
attribute its representation of a population to superficial characteristics that are influenced
by bias in selection of sample units (Bryman & Bell, 2012).
The economic havoc wreaked by most UK banks that were the catalysts of the FC in 2007
has induced a collective identity for this sector. In turn, this FC has yielded certain common
perceptions amid public, as Bennett & Kottasz (2012) argue. Moreover, the UK banking
sector is dominated by few very large banks which, after the FC of 2007, became even more
concentrated with the merge of some banks together such as that between Halifax Bank of
Scotland (HBOS) and Lloyds TBS to create the Lloyds Group (Chalabi, 2014). These factors
spurred conducting the research for the UK entire banking sector given the temporal effect
of the FC that has created a collective identity for the whole sector (Bennett & Kottasz,
2012).
Given the above reasoning, along with the infeasibility to identify and create a sampling
frame due to the confidentiality policies in the banking sector, a non-probability sampling
method in the form of convenience and purposive sampling were recruited. The underlying
justification is driven by constructing a coherent sampling strategy to test the research
hypotheses statistically with the consideration to capture the advantages of implementing a
non-probability method in terms of drawing a convenience sample to collect a large number
of completed questionnaire economically through sample units that are most readily
available to participate and who can provide the data required.
In this setting, response rate techniques with a screening feature were planned to achieve a
high response rate with controlled missing data to minimise non-sample errors. On the
other hand, purposive sampling was also used in conjunction with the requirements of the
research question to collect data from participants with low income less than £14,999 to
explore the financial exclusion issue of banks.
The proposed hypotheses were tested on a sample of 127 participants who are current
customers at one or more of UK banks. The respondents participating in the survey were
selected on the basis of varied demographic characteristics, such as age being within a wide
range from below 25 to 55 and above years, both male and female customers were invited
from different education backgrounds, income categories and diversity in the type of
employment status was ensured.
3.4. DATA TREATMENT AND DATA ANALYSIS TECHNIQUES
The data set was exported from Survey Monkey into Excel format and then imported into
the Statistical Package for the Social Science (SPSS Version 22.0) to analyse the data. Data
preparation constituted coding the data and adjusting the level of measurements to the
variables. To this point, the measurements were allocated in accordance with the data type
and the technique to apply for the analysis.
3.4.1. SCALES OF MEASUREMENT
There are four levels of measurements are depicted in ascending power order as following
first nominal scales which represent variables with numeric labels whereby having no order
of magnitude classifies them as the least powerful scales. Variables measured using this
scale, hence, cannot be placed in rank order. These are non-metric scales that suited non-
parametric statistics such as Chi-square statistic (Hair et al, 2007). In this sense, nominal
scale is used as a level of measurement to classify the gender and relationship status
variables for this study.
The inability of ranking variables on nominal scales contrasts with ordinal scales. As its name
implies, variables can be ranked. However, the distance between scale points is not equal
across the range (Bryman & Bell, 2012). The ranking characteristic of this scale allows for
higher level of analysis than with nominal data relevant to non-parametric statistics such as
Spearman’s correlation. Given this, ordinal scale was allocated to the education and the
duration of maintaining a UK bank account variables.
The interval and ratio scales address the arithmetic quality that differences between points
on the scale are identical. Whilst ratio scales incorporate the qualities of the other three
scales, they diverge from interval for stating the relative difference between any two values
for a particular variable, that is, this scale is the highest level of measurement (Lee & Lings,
2008).
While Likert scale is characterised as an ordinal scale, it can be argued that Likert scale can
be treated as an interval scale given the justification that the gaps between its points are
equal in magnitude across the whole range of the scale (Han, 2006; Lee & Lings, 2008; Hair
et al, 2007). In addition, this scale is characterised as a metric scale employed with
parametric statistics such as Correlation Analysis, Multiple Regression (Hair et al, 2007)
which this study implemented to analyse the collected data. Based on this, the independent
variables (IVs which are the predictors) and dependent variables (DVs - also known as
outcome variables) of this study are measured using Likert five-point scale which is assumed
to be interval whereby the gaps between its points are equidistant as illustrated in Figure 5.
Figure 5 - Five-point Likert Scale
1 2 3 4 5
Strongly Neutral Strongly
Disagree Agree
3.4.2. RELIABILITY ANALYSIS
One way of testing internal reliability is the Cronbach’s alpha method which was used in this
research to assess whether the items that make up the scale were internally consistent.
Cronbach’s (coefficient) alpha is the most common measure of scale reliability that ranges
from 0 to 1 within which a value of 0.7 to 0.9 indicates good reliability and 0.7 is the
accepted benchmark for Cronbach’s alpha. However 0.60 can be an acceptable level of
internal reliability in exploratory research. Consequently, high reliability is explained by
(Han, 2006)
highly correlated items that are measuring the same thing whereby low reliability denotes
that the items measuring the scale have very little in common (Hair et al, 2007; Bryman &
Bell, 2012).
3.4.3. FACTOR ANALYSIS
Aggregating a group of interrelated variables into a smaller set of factors is one of the main
objectives to perform factor analysis which is regarded as a versatile means to provide
preliminary solution for multivariate data analysis. Two methods can be used in factor
analysis, Principle Component Analysis (PCA) and Common Factor analysis. PCA allows for
the analysis of both the common and unique variance of a score hence used for data
reduction whereas Common Factor analysis is only concerned with the common (shared)
variance thus it is used in uncovering construct dimensionality. Based on this, calibration
sample was subject to PCA (Field, 2009).
The initial step in the preliminary analysis is concerned with checking R-matrix for any
extreme scenarios such as multicollinearity of highly correlated variable and low singularity
correlation. The suitability of the sample size has to be considered by assessing the Kaiser-
Meyer-Olkin (KMO) statistic and Bartlett’s Test of Sphericity. The threshold of 0.6 for KMO
indicates an adequate sample size, also Barlett’s test signals the significance of the overall
correlations in R-matrix (Field, 2009).
Using PCA, the number of components is extracted based on the Kaiser criterion of Eigen
values over one, also scree plot aides in the decision by visually spotting where the point of
inflexion occurs to retain only components to the left of this point. Regarding rotation, two
methods can be used to improve factor solution by maximising the loadings of some of the
items. An oblique rotational method allows factors to correlate whereby the other method
– orthogonal – does not. Thus, the former rotation was sought for the analysis for which
factor loading was set as 0.4 as recommended by Field (2009).
3.4.4. CORRELATION ANALYSIS
This analysis gauges the degree of covariation between two variables. It can be conducted
by using one of the two bivariate correlation coefficients – Pearson’s product-moment
correlation coefficient (PMCC) and Spearman’s rho. While the latter deals with ordinal data,
the former calculates interval/ratio data which is the level of measurement assigned for the
study’s IVs and DVs. Hence, this is the used statistic to quantify the strength of the linear
relationship between a pair of variables (Hair et al, 2007).
Pearson r assesses the strength and direction of association between two variables such as
CSR fit and CR in which the correlation coefficient ranges between -1 and +1. A Pearson r
value between +0.9 and +1 denotes a very strong positive correlation, whereby a value
between -0.9 and -1 still indicates a very strong correlation but negative which means when
one variable increases, the other variable decreases. Moreover, the correlation has no
meaning if it is not statistically significant whereby the p-value is less than 0.05. This implies
that the relationship is statistically significant hence the null hypothesis is rejected (Bryman
& Bell, 2012).
3.4.5. REGRESSION ANALYSIS
It is closely connected to Pearson’s r with regards that correlations between variables are
linear, however, this analysis allows to ‘predict an outcome variable from one predictor
variable (simple regression) or several predictor variables (multiple regression)’ (Field,
2009). The coefficient of determination or R squared entails the amount of variability in one
variable explained by the other variable. It can have any value between 0.00 to 1.0 whereby
the greater the R2
the stronger the association. The F- statistics and its associated
probability in the ANOVA table assess the statistical significance of the overall regression
model (Hair et al, 2007).
In the coefficients table, the regression coefficients (b values) point out the amount of
change in the outcome variable resulting from a one unit increase in the predictor. To
evaluate the statistical significance of betas (b vales), the t-statistic tests the null hypothesis
for the value of b, whereby less than 0.05 it is rejected and b-value is statistically significant.
A predictor variable with insignificant beta is not a good predictor of the dependent variable
and should be removed from the regression model (Hair et al, 2007).
3.4.6. MEDIATION ANALYSIS
Baron & Kenny's mediation approach involves following four steps (Figure 6) to analyse
whether certain variable – a mediator – exerts an effect by intervening a relationship
between an independent (IV) and dependent variable (DV) (Janice, 2012).
Step 1: Involves portraying a structural model to estimate path c in which the IV is assessed
whether it correlates significantly with the DV. Based on the existence of a significant
correlation between both variable, the rest of the procedure is validated.
Step 2: Establishes path a in which the direct relationship between the IV and mediator is
tested whereby mediator is regressed on the IV. They must correlate to validate next step.
Step 3: Includes testing path b by performing a hierarchical regression whereby, in first step,
the DV is regressed on the mediator while, in second step, DV is regressed on the IV.
Step 4: Tests path c’ by assessing the relationship between the independent and outcome
variables. If it becomes insignificant, then there is full mediation while if this relation
remains significant then it confirms a partial mediation.
Independent
variable
Dependent
variable
C’ (Path c)
Mediator
3.4.7. ETHICAL CONSIDERATIONS
Within the realm of conducting a research, there are some obligations that revolve around
ethical concerns starting from the appropriateness of the research to issues emerge in each
phase of the research process. This includes not avoiding any risk of causing harm or
intruding on privacy to access data, disclosure about the nature of the research and
sufficient information to avoid lack of informed consent and maintaining confidentiality of
data and anonymity of participants’ identities (Hair et al, 2007; Bryman & Bell, 2012). In
compliance with this continuum of ethical principles, this dissertation is also regulated by
the Code of Research Practice of The University of West London which sets out researchers’
broad responsibilities.
In doing so, a disclosure of the nature and purpose was encapsulated in the introduction of
the online questionnaire as well as the invitation email sent to take part in the study. This
invitation stated explicitly that participants’ privacy will be protected and that their
participation is voluntary whereby they have the right to decline or not to participate in the
study (see Appendix II). Confidentiality and anonymity of all participants were dealt with as
(Janice, 2012)
Figure 6 – Mediation Model
questionnaires were anonymous and participants were informed that all data collected will
remain confidential and are protected according to the Data Protection Act 1998 (DPA).
Data will be processed and analysed objectively and a summary of the research findings can
be obtained if requested.
3.5. CONCLUSION
The study adopted a quantitative method and followed a deductive approach. A
questionnaire survey was designed as the primary data source. The collected dataset was
analysed using rigorous relevant methods to get the most out of the data in order to have a
deep investigation and render sufficient results.
Chapter 4: Analysis and Discussion of Findings
4.1. INTRODUCTION
Given the baseline for the research design to collate the data and methods of analysing it in
the methodology chapter, this chapter explores the empirical findings of descriptive and
parametric statistics.
4.2. DESCRIPTIVE STATISTICS
To tap into the socio-demographic profiles of respondents, a Univariate analysis was
conducted via frequency distributions and diagrams to explore the data of one variable at a
time. With regards to age distribution, most of the respondents – 41 out of the 92 – were
aged 35-44 years (44.6%). The younger age group (less than 25 years) contributed with only
5 respondents (5.4%) while 22 (23.9%) belonged to the middle age group (26-34 years).
There were 14 respondents (44.6%) from the older age group (45-54 years) with the
remaining 10 (10.9%) belonging to oldest one (55 years and above). As illustrated in Table 2,
the figures in the Percent and Valid Percent are the same as there is no missing data.
Which of the following categories best describes your age?
Frequency Percent Valid Percent
Cumulative
Percent
Valid Below 25 5 5.4 5.4 5.4
26-34 22 23.9 23.9 29.3
35-44 41 44.6 44.6 73.9
45-54 14 15.2 15.2 89.1
55 and above 10 10.9 10.9 100.0
Total 92 100.0 100.0
Table 2 – Age of Respondents (Questionnaire Section A- Q1)
As for the gender distribution, it was evenly spread across the dataset with 50 female
(54.3%) and 42 male (45.7%) (Figure 7).
Figure 8 presents the relationship status of respondents, about 50 (54.4%) are married while
the remaining 45.65% are spread out over the other different relationships.
Regarding the type of employment, 66 respondents were in full time employment (66.30%)
followed by 18.48% of being self-employed. Only 1.09% are on retirement (Figure 9).
Figure 7 – Gender of Respondents (Questionnaire Section A- Q2)
Figure 8 – Relationship status of Respondents (Questionnaire Section A- Q3)
Table 3 – Respondents’ Annual Income (Questionnaire Section A- Q6)
A large group of respondents (35.9%) has an annual income of £75,000 and above. The
breakdown of the responses shows that 8.9% earn less than £14,999. The deployment of
the purposive sampling technique helped in the inclusion of this segment to ensure covering
all relevant questions that address the research objectives. Equally, around 13% of
respondents earn within the income brackets of £30,000 - £44,999 and £45,000 - £59,999.
What is your current household income (£ gross)?
Frequency Percent Valid Percent
Cumulative
Percent
Valid Less than 14,999 8 8.7 8.7 8.7
15,000 - 29,999 17 18.5 18.5 27.2
30,000 - 44,999 12 13.0 13.0 40.2
45,000 - 59,999 12 13.0 13.0 53.3
60,000 - 74,999 10 10.9 10.9 64.1
75,000 and above 33 35.9 35.9 100.0
Total 92 100.0 100.0
Figure 9 – Respondents’ Type of Employment (Questionnaire Section A- Q5)
Figure 10 shows that the majority have more than ten years’ experience with their banks
which makes up almost 59% of the sample, while only 16.30% have been with their banks
for less than five.
4.3. EMPIRICAL FINDINGS OF PARAMETRIC DATA
Before analysing the dataset, the data was prepared pertaining to editing, coding and data
transformation as appropriate; the data was also examined for anomalies. The research
question and objectives were addressed through the statistical analysis of the data in four
analytical frameworks. This included performing a number of relevant analysis comprised of
reliability analysis to test for the level of consistency among the items within each
framework. It was followed by conducting a Factor Analysis for each of the first and the
second frameworks. The rationale behind using the Factor Analytic approach is to reduce
the large dataset into a smaller set of salient items, hence producing a more manageable
number of variables to submit for the subsequent analysis of Multiple Regression
(Multivariate analysis) in the analysis of each of the aforementioned frameworks. For the
third framework, Pearson product-moment correlation coefficient was performed. The last
Figure 10 – Respondents’ relationship duration with their banks (Questionnaire Section A- Q8)
analytical framework tapped on the mediation effect of CSR on customer-stakeholder
purchasing decision (behavioural intention) and bank’s corporate reputation. This was
tested by using Baron & Kenny's Mediation procedure (1986, cited in Aggarwal, 2004).
4.3.1. RESEARCH OBJECTIVE ONE
Investigate whether perceived CSR activities in the post FC of 2007 has an impact on banks’
customer-stakeholders satisfaction
4.3.1.1. RELIABILITY ANALYSIS
Initially, the Cronbach’s alpha was checked to assess the interrelatedness of items that
gauge customers’ perception of CSR activities. The estimation of the intercorrelation among
these items came satisfactory as 0.96 which reflects a reliable scale (Table 4). Although the
scale met the criterion of a very good coefficient alpha, yet, according to Hair et al (2007),
an alpha of ≥0.95 should be inspected to eschew a limited breadth of items focus if they do
not measure difference aspects of the concept. To address this, the inter-item correlation
matrix was visually scanned for high correlation where r ≥ 0.85 (Ioannou, 2009) or r ≥ 0.80
(Field, 2009) as this would exhibit considerable redundancy among items.
The preliminary test of multicollinearity revealed that correlation coefficient was within the
acceptable margins. Given this, there was not any multicollinearity of perfect linearly
relationship between the items. Another investigation was sought pertaining to checking
the determinant of the correlation matrix whereby if it is greater than 0.00001 then
multicollinearity is not a problem. Thus the determinant value was 1.615E-13- which is
0.00016 which did not signal multicollinearity (Appendix E).
Table 4 – Reliability Statistics for perceived CSR activities
Cronbach's Alpha
Cronbach's Alpha Based
on Standardized Items N of Items
0.961 0.962 33
Two items with low correlation where r is less than threshold 0.3 were detected in the inter-
item correlation matrix. However, by deleting these items, alpha value will not change. This
was seen as an early stage to eliminate these items because more rigorous analysis can be
sought by checking their level of significance in next stage to consider discarding them from
the analysis if they have an adverse effect. Consequently, it was decided not to exclude
them as they may contribute differently to the content coverage of the subscale.
The overall coefficient alpha was 0.96 thus the scale was adequately reliable. It reflected
that all items are positively contributing to the overall reliability. The justification of such
value can be a function of the scale length for which factor analysis was used as a remedy to
cluster the 33 items into a small set of components with efficient traits to explain as much of
the variance in the original data set which would be sufficient enough to perform the
regression analysis (Field, 2009; Iatridis, 2011).
4.3.1.2. FACTOR ANALYSIS
The calculated KMO statistic on the 33 items gave a result of 0.896 which verified the
sampling adequacy. A KMO in the region of 0.8-0.9 is considered perfect and indicated that
the sample size was adequate for the factor analysis solution. Furthermore, the Bartlett’s
test of sphericity χ² (528) = 2331.783, p < .005 (Table 5) indicated that correlations between
items were sufficiently large for factor analysis. While, items Q16 and Q18 have high p-value
(> 0.05) with some other items in the R-matrix, overall there was a positive strong
correlation among the residual items of the matrix (Appendix F). Moreover, the Bartlett’s
test was highly significant, hence, before deciding to exclude these two items, their
communalities were considered. The values came as 0.717 and 0.583 respectively which
reflected that both items contribute fairly well to the factor structure and should not be
discarded in order not to lose important information. The yardstick was to compare
communalities before and after extraction in following steps. Overall, this allowed for
factorising the 33 items using PCA to investigate these relationships further and gain deeper
insight.
Table 5 – KMO and Bartlett's Test
Kaiser-Meyer-Olkin Measure of Sampling
Adequacy.
.896
Bartlett's Test of
Sphericity
Approx. Chi-Square 2331.783
Df 528
Sig. .000
An initial analysis was performed to obtain Eigen values for each component in the data. Six
components had Eigenvalues over Kaiser’s criterion of 1. The first component explained
46.86% of total variance and, in combination, the six components explained about 69.05%
of the variance. The point of inflexion in the scree plot occurred at the second point
(component). Both Kaiser’s and scree plot criteria have justified retaining two components.
The second component constituted of two items which is not an adequate number of items
for providing feasible factor solution. Hair et al (1998, cited in Coleman, 2011) advocate for
more than three items to generate a reliable solution. Hence, three components with Eigen
values greater than one were extracted and oblique rotation was conducted to optimise the
factor structure by maximising the loadings of some of the items whereby a factor loading of
0.4 – which is in line with Field’s (2009) suggestion – was used.
This structure has yielded insufficient value of alpha coefficient for the second component
as Cronbach’s alpha was 0.532 (Appendix G). However, deleting Q16 from the construct
would improve alpha value to 0.802, excluding this item hence was corroborated. After
deleting Q16, PCA was rerun then the previous analytical approach of extracting and
rotating was reiterated. This led to two components retained. They together accounted for
54.02% of the total variance and therefore the factor extraction results were generally
satisfactory.
The first component was labelled Economic & Legal focus (EC&LG) given the salience of
those items with the higher loadings. The second component emerged from Philanthropic &
Ethical statements and was named as PH&ET. Moreover, through this process Q18 proved
to be inadequate as it has low communality (0.91), thus it was not calculated within any of
the components (Table 6).
The final two components intercorrelated with r value of 0.634 whereby an r of 0.40 to 0.69
is mediocre as recommended by Cohen & Holliday (1982, cited in Bryman & Cramer, 2005)
thereof, overall, there was a positive association between the two components (Appendix
H).
Table 6 – The Extracted Factor Components and their Alpha values
Items
Component
Cronbach’s Alpha
EC&LG PH&ET
Q9Financial_Statements .904 .953
Q12Fees .883
Q12Interest_Rates_Accounts .858
Q12Interest_Rates_Loan .740
Q12Open_Or_Close_Branches .734
Q9Transparency .687
Q12Treated .686
Q12Withdraw_Money .684
Q12Personal_Information_Safe .647
Q12Financial_Stability .627
Q9legal_Obligations .616
Q10 .613
Q9Honest_Relationship .612
Q9Borrowings_And_Savings .589
Q9Offers .572
Q9Confidentially .568
Q11 .566
AQ12Advice_Quality .520
Q9MeetCustomers_Needs .465
Q9Financial_literacy .915 .917
Q9Giving_Back_To_Community .822
Q9Social_Attachment .806
Q9Executive_Remuneration .717
Q9Environmentally_branches .638
Q13 .557
Q9Being_Accountable .527
Q17 .498
Q9Valued_Customer_Recognition .498
Q9Financial_Inclusion_SMEbanking .461
Q14 .452
Q9Combating_Bribery .444
Q18
4.3.1.3. MULTIVARIATE REGRESSION ANALYSIS
Based on the findings of factor analysis, the original hypothesis that investigated the
relationship between the perceived CSR activities and customer satisfaction was
reformulated as follows:
H1.a: There is a relationship between perceived CSR’ EC&LG activities and customer-
stakeholder satisfaction in the post FC of 2007.
H1.b: There is a relationship between perceived CSR’ PH&ET activities and customer-
stakeholder satisfaction in the post FC of 2007.
Multiple linear regression analysis was performed to assess the relationship between the DV
– customer satisfaction – and the two IVs – EC&LG and PH&ET. Enter method was used to
bring both IVs into the model. The results incorporated that correlation matrix reported a
significant positive relationship among all the variables with one-tailed significance of 0.000.
Within the R-matrix, the highest correlation was between EC&LG and customer satisfaction
(r=0.712). The matrix also did not cast any doubt on multicollinearity issues which was in
line with Variance Inflation Factor (VIF) benchmark as being less than ten according to Field
(2009) and did not exceed the warrant point of five which is the borderline of diagnosing
some multicollinearity (Appendix I). Furthermore, the R-squared showed that EC&LG and
PH&ET approximately accounts for 57.7% of the variation in customer satisfaction. The
regression model was statistically significant with F-ratio=60.738 and probability
level=0.000.
It transpired that EC&LG (beta=0.496, p<0.05) and PH&ET (beta=0.341, p<0.05) are
positively and significantly related to customer satisfaction. From the magnitude of the b-
values, the 0.496 is the estimated increase in likelihood to have a satisfied bank customer-
stakeholder associated with a one-unit increase in EC&LG CSR activities. Likewise, customer
satisfaction would rise 0.341 for every one-unit increase in PH&ET.
Table 7 – Multiple linear regression analysis: Impact of CSR activities on Customer Satisfaction
Model
Unstandardized
Coefficients
Standardized
Coefficients t Sig.
B Std. Error Beta
1 (Constant) 3.109 .061 51.370 .000
EC&LG .438 .079 .496 5.564 .000
PH&ET .301 .079 .341 3.829 .000
Taken together, these figures provide evidence of model fit, revealing that the null
hypothesis of no relationship between customer-stakeholder satisfaction and both EC&LG
and PH&ET CSR activities is rejected, that is, this confirmed supporting the alternative
hypothesis of a relationship. Moreover, the findings from the regression model embodied a
statistically significant positive relationship between these variables. Based on this, H1.1 and
H1.2 are supported.
4.3.2. RESEARCH OBJECTIVE TWO
Find out whether there is a relationship between CSR practices and bank customer-
stakeholder behavioural intention (purchase behaviour).
4.3.2.1. RELIABILITY ANALYSIS
The Cronbach’s alpha value for CSR practices was 0.923 which reflected a good degree of
reliability. Four items were very highly correlated with r≥0.80 (Field, 2009; Ioannou, 2009).
Rhese items were Q19Compliance with more than minimum regulation, Q19Welfare and
goodwill, Q19Low-involvement of philanthropic and Q19High-involvement. r values ranged
from 0.807 to 0.893 were detected and deleted from the analysis to avoid multicollinearity.
Coefficient alpha value was still good after the removal of these items (Cronbach’s
alpha=0.882). Moreover, careful screening of Item-Total Statistics table verified that
deleting any other items would not substantially increase the coefficient.
Table 8 – Reliability Estimates of CSR practices subscale
Scale
Mean if
Item
Deleted
Scale
Variance
if Item
Deleted
Corrected
Item-Total
Correlation
Squared
Multiple
Correlation
Cronbach's
Alpha if Item
Deleted
Q19Reasonable_Interest_Rates 35.36 44.540 .411 .496 .884
Q19Payments_Fees_Transparency 35.29 43.243 .615 .592 .871
Q19Account_Information_Confidentiality 35.28 41.590 .691 .679 .865
Q19CEO_Cuts 36.39 42.263 .431 .490 .887
Q19Financial_Inclusion 36.37 41.818 .492 .407 .881
Q19ValuedCustomer_Treating 35.22 41.842 .761 .742 .862
Q19Honest_Financial_Advice 35.26 41.602 .755 .754 .862
Q19Compliance_With_Law 35.34 41.127 .737 .669 .862
Q19Projects_With_Adverse_Impacts 35.85 39.471 .646 .546 .868
Q19CEO_dont_Misreport 35.63 39.752 .745 .673 .860
4.3.2.2. FACTOR ANALYSIS
Both the KMO (0.878) and Bartlett’s test of sphericity χ² (45)=556.572, p<0.05 indicated the
suitability of the data for performing factor analysis. Next step involved determining a set of
components which had Eigenvalues over Kaiser’s criterion of 1. The suitable factorial
method incorporated using Oblique (Direct Oblimin) rotation with factor loading of 0.4.
Two components were constructed which explained about 16.28% of the variance in the
customer purchasing decision of bank’s products and services. From the pool of ten items,
component one included six items within the domain of Economic & Legal practices in
accordance to their loading magnitude, thus labelled ECP&LGP. On the other hand, the
other four items portrayed the traits of Ethical & Philanthropic practices hence named
ETP&PHP. The two components have an adequate correlation (r=0.346). The coefficient
alpha for ECP&LGP was 0.898 while alpha for ETP&PHP came as 0.809. That is, both had
reliable scales with meaningful indices that gauged customers’ behavioural intention.
4.3.2.3. REGRESSION ANALYSIS
A multiple linear regression analysis was performed for which ECP&LGP and ETP&PHP
articulated the IVs to assess whether they have an impact on customer purchasing decision.
The R-squared revealed that approximately 30.9% of variation in customer purchasing
decision is explained by IVs. The F-statistic (19.929) in the ANOVA table transpired that the
regression model is significant at 0.000 level.
Furthermore, ECP&LGP had beta=0.301, p<0.05 and ETP&PHP had beta=0.375, p<0.05
indicated that both were significant predictors of customer purchasing decision (Appendix
I). The IVs of CSR practices on purchasing decision (DV) were statistically significant in the
model, thereof a statistically significant positive relationship exists between purchasing
decision and CSR practices. As such, this lent support to the research hypothesis where
customer-stakeholder purchasing decision is associated with CSR practices.
4.3.3. RESEARCH OBJECTIVE THREE
Determine whether there is a relationship between CSR fit practices and bank reputation.
4.3.3.1. RELIABILITY ANALYSIS
The Cronbach’s alpha for the subscale items of CSR fit practices was 0.879 after deleting
Q23 which had a negative r value in the R-matrix. According to Hair et al (2007), all items
must be positively correlated. Consequently, the deletion of this item was shown to improve
the overall coefficients value from 0.781 to 0.879 which is regarded as a very good value
that has exceeded the recommended threshold limits of 0.6. Cronbach alpha coefficient
before the deletion of item Q23 is illustrated in Appendix J.
4.3.3.2. CORRELATION COEFFICIENT ANALYSIS
The correlation coefficient analysis showed that there was a significant linear association
between bank reputation (DV) and the subscale of CSR practices (IV). According to Table 9,
bank reputation was positively correlated at the 1% level of significance with CSR subscale
(Q21) at r=.372**, r=.464**, r=.495** and r=.582** respectively.
Table 9 – Correlation Coefficients for bank reputation and CSR fit practices subscale
Mean St.(Dev)
Q21CSR_s
trategy
Q21Confidence
Q21Reputable
_Business
Q21High_
CSR_rating
Q22
Q21CSR_strategy 3.91 .847 1
Q21Confidence 4.00 .784 .695** 1
Q21Reputable_
Business
3.98 .784 .543** .643** 1
Q21High_CSR
_rating
3.98 .784 .593** .679** .732** 1
Q22More
preference will be
given to banks
3.54 .965 .372** .464** .495** .582** 1
N of respondents 92 92 92 92 92
Note: ** indicates that Correlation is significant at the 0.01 level (2-tailed).
Most CSR subscale items had moderate positive correlation with bank reputation, while high
CSR rating criteria had strong – as advocated by Field (2009) when r is higher than .50 –
associative relationship with bank reputation. Moreover, Table 9 revealed that the means
for all the items were above the mid-point (3.0) of the five –point scale.
From the positive correlation of the variables and the statistically significant level, the null
hypothesis of no relationship between CSR fit practise and bank reputation was rejected
and the alternative hypothesis was verified.
4.3.4. RESEARCH OBJECTIVE FOUR
Investigate whether CSR practices mediates the relationship between bank reputation – the
independent variable (X) – and stakeholders' behavioural intentions – the dependent
variable (Y).
4.3.4.1. MEDIATION ANALYSIS
The procedure of Baron & Kenny (1986, cited in Aggarwal, 2004) used designate CSR
practices as the mediator – denoted as M – between bank reputation (X) and stakeholders'
behavioural intentions (Y).
A Linear regression analysis was performed between bank reputation and customer
behavioural intention (purchase behaviour) to assess the validation of conducting the
mediation processes based on the criterion of a significant correlation between these
variables. Meeting this criterion, three models were constructed to test the mediation effect
of CSR practices.
Table 10 – Regression Models of Mediation Effect (CSR practices)
Model
Independent
Variable (X)
Dependent
Variable (Y)
R-Square
Coefficient
(Predictor)
P-Value
(Predictor)
Model 1
Path c
Bank reputation
Purchase
behaviour
.370 .609 .000
Model 2
Path a
Bank reputation CSR Practices .301 .549 .000
Model 3
Path c’
Bank reputation
CSR Practices
Purchase
behaviour
.577
.310
.544
.000
.000
The results for Model 1 (path c) emerged from the verified relationship between bank
reputation and purchase behaviour (b=0.609 and p<0.05). This model entailed the direct
relationship between these two variables. Likewise, Model 2 (path a) was constructed from
the statistically significant positive relationship between bank reputation and CSR practices
(b=0.549, p<0.05). By performing hierarchical regression analysis, the last Model 3 (path c’)
stemmed from the significant positive relationship between CSR practices, bank reputation
and purchase behaviour. This model unveiled the effect of CSR practices variable whereby a
significant positive regression coefficient of 0.310 (p<0.05) between bank reputation and
purchase behaviour was indicated. Also CSR practices remained significant with p<0.05
when it was added into the relationship. On the other hand, when comparing the beta of
Model 1 with that of Model 3, b values had a significant drop from 0.609 to 0.310 (29.9%)
which indicated that CSR practices influenced the relationship. Results of the mediation
analysis confirmed a partial mediating role of positive CSR practices in the relation between
bank reputation and customer behavioural intention.
4.4. DISCUSSION OF FINDINGS
The analyses of the collected data have revealed key findings that could be explicated within
the ambit of the research aim of contributing towards a dynamic evolution of the CSR
construct. The discussion draws out on the empirical findings in relation to the study
literature.
4.4.1. CUSTOMER-STAKEHOLDER’S PERCEPTION OF CSR ACTIVITIES IN THE POST FC OF 2007
The empirical results with regards to Research Objective One supported the hypothesised
relationship between perceived CSR activities and customer-stakeholder satisfaction. This
positive relation indicates that banks have been accountable for the failures of their
practices around the FC of 2007 which emanated from adhering to satisfying shareholders
at the expense of other stakeholders. This is in line with the argument of Carroll & Shabana
(2010) that businesses’ accountability for their impact should extend beyond the narrow
view of shareholder model to incorporate the interests of other stakeholders by integrating
social activities in order to leverage the means of satisfying its stakeholders.
The fact that a good number of customers have been found to contribute to this study
indicates that banks perceive them as an important segment of stakeholders. As this study
has shown, customer-stakeholder satisfaction is engendered owing to the inclusion of their
interests and meeting their expectations. Hence, the argument made by Freidman
advocating a primacy of shareholder is no longer feasible. Moreover, as the findings show,
the claim of Windsor (2001, cited in Garriga & Mele, 2004) that the paradigm of short-
termism gain and shareholder primacy is still the leitmotiv in business lacks credibility.
As such, contemporary disciples of Friedman’s neoliberal premise of shareholder such as
Barry 2000, Henderson, 2005 and Jensen, 2001 are not opposing social responsibility actions
by companies. Sternberg (1997) defends embracing socio-economic posture in line with
business stakeholders to spur efficiency as the exclusion of any stakeholder might affects its
ability to attain economic ends (Branco & Rodrigues, 2007).
This stakeholder view challenged the single-minded focus of shareholder primacy pointing
that the interests of shareholders and stakeholders are aligned rather than in conflict. In this
context, the societal values alleged by stakeholders are expected to be satisfied as business
functions by the consent of society, thereof these expectations are justifiably attested by
business (Lindgreen & Swaen, 2010). The study’s statistical results reveal that the jointly
approach of aligning stakeholders’ needs to business activities positively influenced
customer-stakeholder perceptions of these activities. They were labelled in the empirical
analysis as EC&LG and PH&ET.
The findings concur with Carroll’s (1991) CSR model which incorporates these four activities.
As it has been reported in the literature review, business has sprung up as an economic unit
whereas its driver is a profit motive. It also has an obligation to produce valuable goods and
services that meet consumers’ needs at a fair price (Branco & Rodrigues, 2007; Duarte et al,
2010). The salient embodiment of this category is relating business economic objectives to
producing goods and services of value to society in tandem to thriving to generate profit.
Hence, these responsibilities are required in order to secure their license to operate. The
study’s relevant analysis has shared this view whereby customers’ satisfaction of perceiving
the economic value from their dealings with businesses precedes the other activities.
The second category in Carroll model is the legal responsibilities which captures ‘playing by
the rules of the game’ of Friedman’s metaphor, thence, it is presupposed that they coexist
with the economic responsibilities as a rationale to the free market paradigm. This activity
shared the same weight of importance with Carroll’s model to achieve customer’
satisfaction in the research findings. Carroll (1991) pinpoints that ethical responsibilities
imply doing what is right and taking into account the moral duty that business has to
society. Philanthropic activities are allied to the idea of giving back to society as the
recognition of business to be a good citizen (Crane & Matten, 2010).
The study results have reported a discrepancy in the order of the last two CSR activities
where perceived philanthropic activities had higher weighting with regards to customer
satisfaction than ethical activities. On that point, for both the economic and legal
responsibilities Carroll (1991) asserts that they are required while the ethical responsibilities
are expected and the philanthropic is desired. By doing so, his model provides insightful
assessment of the relative weighting of these responsibilities to set priorities upon them.
However, Visser (2005) rigidly criticises the relative importance that Carroll has assigned to
each responsibility for being biased towards USA context. He has emphasised on the culture
context for these assigned priorities giving the example of the high importance of
philanthropy in Africa to others.
Carroll & Buchholtz (2009) argue that the responsibilities are not mutually exclusive nor
intended to be sketched as a continuum from economic to social obligations. The
theoretical clouding with regards to the order of these activities can be cleared out based on
the practical outcome of this study in which the relative order of these activities adheres to
the attribute attached to it. In this context, the perceived CSR activities that have caused
customer satisfaction were economic, legal, and philanthropic with ethical as last domain.
This might be as a result of business being recovering from the ethical issues provoked by
the FC of 2007. Moreover, it could also be derived from the ill-defined characterisation of
newly emerging values which can result in an equivocal stance in which there may not be a
definitive right answer to resolve many of these ethical issues and result into conflict with
the other responsibilities (Jamali, 2007).
4.4.2. CSR PRACTICES AND CUSTOMER-STAKEHOLDER BEHAVIOURAL INTENTIONS
The research findings revealed a significant relationship between CSR practices and
customer purchasing decision. These outcomes have rekindled Forte & Lamont’s (1998,
cited in Boulstridge & Carrigan, 2000) claim that the societal role of the business influences
the customer’s criterion in purchasing decision. In a conjunctive scenario, Mohr & Webb
(2005, cited in Chomvilailuk & Butcher, 2010) point out that customer’s purchasing decision
and company evaluation are positively influenced by CSR initiatives. The study results
confirm these arguments and shed light on the importance of different multiple CSR
practices which were labelled as ECP&LGP while ETP&PHP on customer purchase decision.
These practices built on Carroll’s CSR model in the foregoing discussion. The order of CSR
practices is congruent with Carroll’s model. This may be attributable to the different
dimensions that have been gauged using the model. In the analysis of perceived CSR
activities and customer satisfaction, the dimension measured the level of satisfaction of the
perceived CSR. Within the CSR practices and purchasing decision, the dimension measured
the level of importance of CSR practices in relation to customer behaviour.
This study shares the view of Pirsch et al (2006, cited in Chomvilailuk & Butcher, 2010) that
societal attributes which are woven into business operations and core competences can
elicit significant positive customers’ behavioural and attitudinal measures such as patronage
intention. The high level of economic importance that was highlighted in the research
findings tap on the core competencies of business as CSR economic practice induce cost
effective products to customers.
4.4.3. CSR AND BANK REPUTATION
The emergence of a significant positive relationship between CSR and bank reputation is
congruent with the findings of Reputation Institute (2009, cited in Trotta et al, 2011)
whereby a positive direct relationship between CSR and CR is reported in the sense that
when the commitment to CSR is augmented, the value of CR would be boosted. Moreover,
Martin & Ruiz (2007, cited in Chomvilailuk & Butcher, 2010) conjecture a direct link between
a customer’s liking for the bank and the bank CSR reputation.
The second statement in Q21 with regards to customers’ confidence in business had a
significant good correlation with r= 0.464. This came in line with previous studies (Fombrun,
1996; Trotta et al, 2011) in which CR is regarded as an indicator of business’s legitimacy
premised on its credibility in maintaining society’s trust in business and potentially
influencing the purchasing behaviour of that public.
4.4.4. MEDITATION EFFECT OF CSR ON CR AND CUSTOMER-STAKEHOLDER BEHAVIOURAL
INTENTION
The mediation effect emerged from the data is consistent with the findings of Lichtenstein
et al (2004, cited in Chomvilailuk & Butcher, 2010). The study findings showed that there is a
partial mediation effect of CSR on the relation between CR and customer purchasing
behaviour. This would provide a new understanding of the role of CSR for its mediation
effect on such relation. This approach would facilitate CSR role in developing business
sustainability through its indirect effect on the business economic bottom line.
While Carroll & Shabana (2010) argue that the justification of the business case for CSR is
based on a direct link to economic ends, the findings add credence to the business case by
justifying it on more plausible indices based on the indirect effect of CSR on business
economic value.
4.5. CONCLUSION
The findings of the four analyses supported the alternative hypotheses of a positive
correlation between CSR and customer satisfaction, customer purchase behaviour and CR
respectively. The findings for the CSR mediation effect also revealed a partial mediation of
CSR on the relationship between CR and customer purchase behaviour. The discussion of
these findings was compared with findings of pertinent studies from the literature review.
Chapter 5: Conclusion and Recommendations
5.1. INTRODUCTION
The previous chapter evolved around the critical discussion of the study findings in the
context of the literature. This involved comparing the empirical findings to the results of
previous studies. The discussion was guided by four research objectives that were geared
towards the empirical testing of the hypothesised relationships. Consequently, the objective
of this chapter is to draw conclusions from these findings to answer the research question
and address the research objectives. This is followed by demonstrating the theoretical and
practitioner contributions that this research makes. It also discloses recommendations for
future research and limitations concerning this research.
5.2. CONCLUSION
At the outset, this study’s objectives aimed at investigating the likelihood of CSR
development in the post FC of 2007 with regards to two avenues. The first was customer-
stakeholders’ satisfaction of perceived CSR activities in the FC whereas the second was
related to the implications of strategic CSR on CR as well as the possibility of influencing
customers purchasing decision.
As illustrated in the analytical framework, using Carroll’s (1991) CSR four dimensions to
assess whether these dimensions affect customer satisfaction and their purchasing decision,
the empirical outcomes highlighted some similarities as well as an angle of difference with
Carroll model. The similarity pertains to the order of the economic and legal CSR
dimensions. The findings showed that these two dimensions came in the same order as
Carroll model.
Aligned with Carroll’s model in terms of designating CSR economic activities as the base for
the other three activities, the findings demonstrated the banks’ commitment to deliver
highly satisfactory economic value to their customers. This manifests their recognition of
the importance of customer-stakeholder group to their continuity.
As for the legal dimension, it has been argued that while business is obliged to perform in a
law-abiding manner, most businesses would cultivate CSR practices as self-regulatory to
keep at bay more legalisations (Freeman & Liedtka, 1997). In support, the perceived CSR
legal activities seemed to encounter high level of customer satisfaction, indicating how most
banks have been able to seize the advantages of adhering to CSR by maintaining a plausible
satisfactory level of legal compliance.
Some key findings have emerged from the preceding remarks pertaining to banks’
discerning CSR practices that elicit high satisfactory levels for the activities that are
conceived to be most important to customers when making purchasing decision. These
findings support the view of a win-win scenario exhorted via the value creation perspective
of strategic CSR (Mullerat, 2010).
Accordingly, this reveals that the dynamics of banks’ CSR practices are in line with
customers’ expectation. As such, CSR has evolved whereby practitioners have developed
CSR activities by sustaining value-creation for their customer-stakeholders. This, along with
the four verified hypotheses, unveiled the answer to the research question. And the study
was able to establish that the FC of 2007 has been a wake-up call for banks’ CSR activities to
resonate customers’ expectations and needs.
5.3. PRACTITIONER CONTRIBUTIONS
While the inclusion of stakeholders’ interests into business strategies can act as a point of
differentiation and be a source of sustainable competitive advantage (Fombrun, 1996 cited
in Nilsen, 2010), it is pivotal to map out the level of importance of CSR practices to fulfil
them accordingly. This was the case with regards to the difference in the order of the ethical
and philanthropic dimensions between Carroll CSR model and the empirical outcomes. For
the satisfaction avenue, philanthropic had preceded the ethical dimension, but was the
other way around for the case of the purchasing decision. In this context, while the level of
ethical CSR activities had a moderate importance on customer purchasing decision, the level
of customer satisfaction of perceived CSR ethical activities was the least fulfilled dimension.
This discrepancy can provide insights on the level of CSR efforts that need to be maintained
to, on one hand, capitalise on the core competences in how to be active in this dimension
and, on the other hand, achieve competitive advantage by attaching attributes favoured by
customer-stakeholders.
Furthermore, the mediation effect that CSR exerts on banks reputation to influence
customers’ purchasing decision can enhance their respective financial well-being and hence
achieve a pragmatic approach to CSR. While CSR can provide competitive advantages to a
business, if banks’ CSR motives are questionable, they could have far detrimental effects on
the business possibly amounting to customers exerting their purchasing influence as a
means of punishing them. Taken together, CSR can be considered the business’s compass
guiding them to develop societal activities that create value to both ends when fulfilling the
role that business was set out to achieve.
5.4. THEORETICAL CONTRIBUTIONS
These contributions are threefold. As emphasised in the introduction, CSR literature on the
financial sector is under-researched and, with regards to CSR marketing, there is a distinct
lack in investigating the effect of multiple CSR activities on customers’ attitudes. Given this,
the study’s intended contribution was to provide empirical findings to fill this void and
contribute to better understand one of the most contestable fields in contemporary
management. The application of strategic CSR can yield sustainable competitive advantages
if applied in tandem to the dynamics of social structure.
The second contribution stems from the study findings showing positive significant CSR-
customer relationships. This stresses that CSR became a management mainstream which
shed further light on the prominence of stakeholder orientation to shareholder. Moreover,
adhering to stakeholder approach resulted in the significant findings of this study from
which emerged the indirect impact of CSR on CR and hence customer purchase behaviour.
This in turn have an effect on business economic ends.
The debate on whether CSR should be abandoned is no longer valid. However, the focus
should be on what kind of benefits businesses can capitalise on to leverage efficient CSR
practices and adoption. As for the third contribution, the stakeholder modus operandi
attribute provides a systematic framework approach to the CSR literature which helps
mapping out stakeholders’ needs.
5.5. RECOMMENDATIONS FOR FUTURE RESEARCH AND RESEARCH LIMITATIONS
This study provided new insights in CSR topics by arguing the indirect effect of CSR in
yielding competitive advantage that gives credence to the business case for CSR. As the field
of banking and CSR-CR is relatively a new one, research in many avenues on CSR can be
unlocked. One interesting area in investigating the business case for CSR is that of CSR
mediation effect. Another avenue is to investigate multiple CSR domains on different
customer attitudes as, so far, most extant studies offer very limited insights into customers’
attitudes relative to one or two dimensions of CSR.
Regarding stakeholder approach, the focus-to-date has been limited to customers and
employees whereas other stakeholders could influence business performance in different
ways. This would provide better understanding of the field therefore a replication of this
study in other contexts is noteworthy as well as extending it into other countries.
Nevertheless, the results are quite robust. The study’s drawback stems from the
employment of a non-random sampling technique. This could represent a study limitation in
terms of generalizability. However, the response rate was 46% which led to in-depth
investigation considered representative of the population (Ismail et al, 2012).
As a final remark, all of the research objectives, as stated in Chapter 1, were met.
References
Aggarwal, P (2004) The Effects of Brand Relationship Norms on Consumer Attitudes and Behavior,
Journal of Consumer Research, 31 (1), 87–101
Ahenkora, K, Banahene, S & Quartey, J (2013) Societal Value Antecedent of Corporate Social
Responsibility and Business Strategy. Journal of Management and Strategy, 4(4), 58–64
Alvesson, M (2009) (Post-) Positivism, Social Constructionism, Critical Realism: Three Reference
Points in the philosophy of science [Accessed 10Jul 2014] http://www.sagepub.com/upm-
data/28039_02_Alvesson_2e_Ch_02.pdf
Babbie, E (2004) The Practice of Social Research, 10th ed. Wadsworth/Thomson Learning
Barry, N P (2000) Controversy: Do Corporations Have Any Responsibility Beyond Making a Profit?
Journal of Markets and Morality, 3(1), 100-107
Barth, R & Wolff, F (2009) Corporate Social Responsibility in Europe: Rhetoric and Realities. Edward
Elgar Pub
Barton, C E (2010) Understanding Corporate Social Responsibility Engagement In Small And Medium
Tourism Businesses. Bachelor Thesis, Faculty of Business, University Of Technology, Sydney
Bartscht, M (2013) Corporate Social Responsibility In The Information Technology Sector A Focus
Group Study On How European Consumers View CSR And Corporate Behavior. Master Thesis,
Erasmus School of History, Culture and Communication, Erasmus University Rotterdam
Beckmann, S C (2007) Consumers and corporate social responsibility: matching the unmatchable?
Australasian Marketing Journal, 15(1), 27-36
Bennett, R & Kottasz, R (2012) Public attitudes towards the UK banking industry following the global
financial crisis. International Journal of Bank Marketing, 30(2), 128–147
Berens, G, Van Riel, C B M & Van Rekom, J (2007) The CSR-quality trade-off: when can corporate
social responsibility and corporate ability compensate each other? Journal of Business Ethics. 74(3),
233–252
Bhasker, R A (1978) Realist Theory of Science. Harvester Press
Bhattacharya C B & Sen, S (2001) Does Doing Good Always Lead to Doing Better? Consumer
Reactions to Corporate Social Responsibility. Journal of Marketing Research, 38(2), 225–243
Blowfield, M & Murray, A (2008) Corporate Responsibility: A Critical Introduction. Oxford University
Press
Blumberg, B, Cooper, D R, Schindler, P S (2008) Business Research Methods, 2nd European ed.
McGraw-Hill Higher Education
Bouldstridge, E & Carrigan, M (2000) Do consumer really care about corporate responsibility?
Highlighting the attitude-behaviour gap. Journal of Communication Management, 4(4), 355–68
Bouvain, P, Baumann, C, Lundmark, E (2013) Corporate social responsibility in financial services: A
comparison of Chinese and East Asian banks vis‐à‐vis American banks. International Journal of Bank
Marketing, 31(6), 420–439
Bowen H (1953) Social Responsibility of the Businessman. Harper & Row: New York
Brammer, S, Millington, A & Rayton, B (2007) The contribution of corporate social responsibility to
organizational commitment. The International Journal of Human Resource Management, 18(10),
1701–19
Branco, M C & Rodrigues, L L (2007) Positioning stakeholder theory within the debate on corporate
social responsibility. Electronic Journal of Business Ethics and Organization Studies, 12(1), 5–15
Broomhill, R (2007) Corporate Social Responsibility: Key Issues and Debates, The Dunstan Papers
Brown, L E (2012) Corporate Social Responsibility in NCAA Athletics: Institutional Practices and
Decision Makers. PhD Dissertation, Ohio State University
Brown, T & P A Dacin (1997) The Company and the Product: Corporate Associations and Consumer
Product Responses. Journal of Marketing, 61(1), 68–84
Bryman, A & Bell, E (2011) Business Research Methods, 3rd ed. Oxford University Press
Camilleri, M A (2012) Creating Shared Value through Strategic CSR in Tourism. PhD Thesis, University
of Edinburgh Business School, The University of Edinburgh
Cardigan, M & Attalla, A (2001) The myth of the ethical consumer – do ethics matter in purchase
behaviour? Journal of Customer Marketing, 18(7), 560–78
Carroll, A B (1979) A three-dimensional conceptual model of corporate performance. Academy of
Management Review, 4(4), 497–505
Carroll, A B (1991) The Pyramid of Corporate Social Responsibility: Towards the Moral Management
of Organisational Stakeholders. Business Horizons, 34(4), 39–48
Carroll, A B (1999) Corporate social responsibility: Evolution of a definitional construct. Business and
Society, 38 (3), 268–96
Carroll, A B & Shabana, K (2010) The Business Case for Corporate Social Responsibility: A Review of
Concepts, Research and Practice, 12(1), 85–105
Carroll, A B & Buchholtz, A (2009) Business & Society: Ethics, Sustainability, and Stakeholder
Management, 7th ed. Cengage Learning
Caruana, A (2008) Facets of corporate identity, communication and reputation. Edited by T. C.
Melewar
Chalabi, M (2014) UK banks: how powerful are they? [Accessed 10 Jun 2014]
www.theguardian.com/news/reality-check/2014/jan/17/uk-banks-how-powerful-are-they-ed-
miliband-labour
Cheers, Z (2011) The Corporate Social Responsibility Debate. Senior Honours Thesis, School of
Business, Liberty University
Choi, B & La, S (2013) The impact of corporate social responsibility (CSR) and customer trust on the
restoration of loyalty after service failure and recovery. Journal of Services Marketing, 27(3), 223–
233
Chomvilailuk, R & Butcher, K (2010) Enhancing brand preference through corporate social
responsibility initiatives in the Thai banking sector. Asia Pacific Journal of Marketing and Logistics,
22(3), 397–418
Condosta, L (2012) How banks are supporting local economies facing the current financial crisis: An
Italian perspective. International Journal of Bank Marketing, 30(6), 485–502
Crane, A & Matten, D (2010) Business Ethics: Managing Corporate Citizenship and Sustainability in
the Age of Globalization, 3rd ed. Oxford University Press
Creswell, J (2003) Research Design: Qualitative, Quantitative, and Mixed Methods Approaches, 4th
ed. SAGE Publications, Inc
Croucher, S (2014) S&P: UK Banks Face Best Profits Since Financial Crisis in 2014 [Accessed 10 Jun
2014] www.ibtimes.co.uk/sp-uk-banks-face-best-profits-since-financial-crisis-2014-1432390
Cruijsen, C, Haan, J & Jansen, D (2013) Trust and Financial Crisis Experiences. DNB Working Paper
389. De Nederlandsche Bank
Davies, R (2013) Banks cost investors almost £150billion after string of scandals since the financial
crisis, says report [Accessed 10 of Jul 2014] www.thisismoney.co.uk/money/news/article-
2529203/LSE-Banks-cost-investors-150billion-string-scandals-financial-crisis.html
Davis K (1973) Social Responsibility is Inevitable. California Management Review, 14(1), 14–20
Decker, O S (2004) Corporate Social Responsibility and structural change in the financial services.
Managerial Auditing Journal, 19(6), 712–728
Dicken, P (2011) Global Shift, Sixth Edition: Mapping the Changing Contours of the World Economy,
6th ed. The Guilford Press
Drucker, P (2002) Managing in the Next Society
Duarte, A P, Mouro, C & Neves, J (2010) Corporate social responsibility: Mapping its social meaning.
Management Research: The Journal of the Iberoamerican Academy of Management, 8 (2), 101–122
Dusuki, A W (2008) What does Islam say about corporate social responsibility (CSR)? Review of
Islamic Economics, 12(1), 5–28
Edelman (2014) Trust In Financial Services [Accessed 15 Aug 2014]
www.edelman.com/insights/intellectual-property/2014-edelman-trust-barometer/trust-in-
business/trust-in-financial-services/
Ellen, P S, Webb, D J & Mohr, L A (2006) Building corporate associations: Consumer attributions for
corporate socially responsible programs. Journal of the Academy of Marketing Science, 34(2),
147−158
Field, A (2009) Discovering Statistics Using SPSS, 3rd ed. SAGE Publications Ltd
Fombrun, C J (1996) Reputation: Realizing Value from the Corporate Image. Harvard Business School
Press
Fombrun, C J & Shanley, M (1990) What’s in a Name? Reputation Building and Corporate Strategy.
The Academy of Management Journal, 33(2), 233–258
Fombrun , C J, Gardberg, N A & Sever, J (2000) The Reputation Quotient: A multi-stakeholder
measure of corporate reputation. Journal of Brand Management, 7 (4), 241–55
Freeman, E & Liedtka, J (1997) Stakeholder capitalism and the value chain. European Management
Journal, 15(3), 286–296
Freeman, R E (1984) Strategic Management: A Stakeholder Perspective. Englewood Cliffs, NJ:
Prentice Hall
Frederick, W C (1994) From CSR1 to CSR2. Business and Society, 33(2), 150–166
Frederick, W C (2006) Corporation, Be Good! The Story of Corporate Social Responsibility. Dogear
Publishing
Friedman, M (1970) The Social Responsibility of Business is to Increase its Profits [Accessed 10 Mar
2014] www.colorado.edu/studentgroups/libertarians/issues/friedman-soc-resp-business.html
Garriga, E & Mele, D (2004) Corporate Social Responsibility Theories: Mapping the Territory, Journal
of Business Ethics, 53(1-2), 51–71
Gatti, L, Caruana, A & Snehota, I (2012) The role of corporate social responsibility, perceived quality
and corporate reputation on purchase intention: Implications for brand management. Journal of
Brand Management. 20(1), 65–76
Griseri, P & Seppala, N (2010) Business Ethics and Corporate Social Responsibility, 1st ed. Cengage
Learning
Hair, J F Jr, Money, A H, Samouel, P, Page, M (2007) Research Methods for Business. John Wiley &
Sons
Han, Y (2006) Impact of Brand Identity on Perceived Brand Image of the Nelson Mandela
Metropolitan University. Master Thesis, Faculty of Business and Economic Sciences, Nelson Mandela
Metropolitan University
Hay, R & Gray, E (1974) Social responsibilities of business managers. Academy of Management
Journal, 17, 135–143
Haynes, K, Dillard, J & Murray, A (2012) Corporate Social Responsibility - A Research Handbook,
Routledge
Henderson, D (2005) The role of business in the world today. Journal of Corporate Citizenship, 17,
30-32
Herzig, C & Moon, J (2011) Corporate Social Responsibility, the Financial Sector and Economic
Recession. Financial Services Research Forum
Holden, M & Lynch, P (2004) Choosing the Appropriate Methodology: Understanding Research
Philosophy (RIKON Group). The Marketing Review, 4(4), 397–409
Iatridis, K (2011) The Influence of Corporate Social Responsibility on Business Practice: The Case of
International Certifiable Management Standards. PhD Thesis, Lancashire Business School, University
of Central Lancashire
Idowu, S & Filh, W (2008) Global Practices of Corporate Social Responsibility, Springer
Ioannou, A (2009) Development and Initial Validation of a Satisfaction Scale on Diversity, University
of Connecticut
Isaksson, L (2012) Corporate social responsibility :a study of strategic management and performance
in Swedish firms. PhD Thesis, School of Business, Bond University
Ismail, R, Boye, C & Muth, A (2012) Customer Brand Relationship – An empirical study of customers’
perception of brand experience, brand satisfaction, brand trust and how they affect brand loyalty.
Bachelor Thesis, Linnaeus University, School of Business and Economics.
Jamali, D (2007) The Case for Strategic Corporate Social Responsibility in Developing Countries.
Business and Society Review, 112(1), 1–27
Janice, W (2012) The study of Consumer Perception on Corporate Social Responsibility (CSR) Towards
Consumers Attitude and Purchase Behavior, BA Thesis, Institute of Textiles & Clothing, The Hong
Kong Polytechnic University
Jensen, M C (2001) Value maximization, Stakeholder Theory, and the Corporate Objective Function.
Journal of Applied Corporate Finance, 14(3), 8-21
Juma'h, A H (2006) Empirical And Realistic Approaches Of Research. Inter Metro Business Journal,
2(1), 88–108
Karlsson, F (2013) CSR In China For China: A qualitative study of how National Business System
influences Corporate Social Responsibility in China and its implications for Swedish firms. Master
Thesis. Copenhagen Business School
Kotler, P & Lee, N (2005) Corporate Social Responsibility – Doing the Most Good for Your Company
and Your Cause. New Jersey: John Wiley and Sons, Inc
Lantos, G P (2001) The Boundaries of Strategic Corporate Social Responsibility. Journal of Consumer
Marketing, 18(7), 595–630
Lantos, G P (2002) The Ethicality of Altrustic Corporate Social Responsibility. Journal of Consumer
Marketing, 19(3), 205–232
Lech, A (2013) Corporate Social Responsibility and Financial Performance. Theoretical and Empirical
Aspects. Comparative Economic Research, 16(3), 49–62
Le Roux, C (2012) An Assessment Of The Role Of Corporate Brand Identity In Corporate Brand Image
Formation. PhD Thesis, University of South Africa
Lee, N & Lings, I (2008) Doing Business Research: A Guide to Theory and Practice. SAGE Publications
Ltd
Levitt T (1958) The Dangers of Social Responsibility. Harvard Business Review, 36(5), 41–50
Lewis, S (2003) Reputation and corporate responsibility. Journal of Communication Management,
7(4), 356–366
Lindgreen, A & Swaen, V (2010) Corporate Social Responsibility. International Journal of
Management Reviews, 12(1), 1–7
Louche, C, Idowu, S O & Filho, W L (2010) Innovative CSR: From Risk Management to Value Creation.
Greenleaf Publishing
Luo, X & Bhattacharya, C B (2006) Corporate social responsibility, customer satisfaction, and market
value. Journal of Marketing, 70(4), 1–18
Lynchi, G (2011) Research Methods for the study of religion: Sampling. University of Kent
Maden, C, Arıkan, E, Telci, E E & Kantur, D (2012) Linking Corporate Social Responsibility to
Corporate Reputation: A Study on Understanding Behavioral Consequences. Procedia - Social and
Behavioral Sciences, 58 (1), 655–664
Maignan, I (2001) ‘‘Consumers’’ Perceptions of Corporate Social Responsibilities: A Cross-Cultural
Comparison. Journal of Business Ethics, 30(1), 57–72
Maignan, I & Ferrell, O C (2001) Corporate citizenship as a marketing instrument – Concepts,
evidence, and research directions. European Journal of Marketing, 35 (3/4), 457–484
Maignan, I & Ferrell, O C (2004) Corporate social responsibility and marketing: An integrative
framework. Journal of the Academy of Marketing Science, 32(1), 3–19
Mandhachitara, R & Poolthong, Y (2011) A model of customer loyalty and corporate social
responsibility. Journal of Services Marketing, 25(2), 122–133
Maon, F, Lindgreen, A & Swaen, V (2009) Designing and implementing corporate social
responsibility: an integrative framework grounded in theory and practice. Journal of Business Ethics,
87(1), 71-89
Margolis, J, Elfenbein, H & Walsh, J (2009) Does it pay to be good…And Does it matter? A meta-
analysis of the relationship between corporate social and financial performance [Accessed 1 Jul
2014] http://ssrn.com/abstract=1866371
Martin, J, Petty, J W & Wallace, J S (2009) Value Based Management with Corporate Social
Responsibility (Financial Management Association Survey and Synthesis), 2nd ed. Oxford University
Press
Mayer, C (2013) Firm Commitment: Why the corporation is failing us and how to restore trust in it,
Oxford University Press
McDonald, L M & Thiele, S R (2008) Corporate social responsibility and bank customers satisfaction:
A research agenda. International Journal of Bank Marketing, 26(3), 170–182
McWilliams, A & Siegel, A D (2001) Corporate Social Responsibility: A Theory of the Firm Perspective.
The Academy of Management Review, 26(1), 117–127
McWilliams, A, Siegel, A D & Wright, P (2006) Corporate social responsibility: Strategic implications.
Journal of Management Studies, 43(1), 1-18.
Mittal, R (2008) Corporate Social Responsibility – Consumers’ Perspective. Master Thesis, University
of Nottingham
Mostovicz, E, Kakabadse, A & Kakabadse, N (2011) The four pillars of corporate responsibility: ethics,
leadership, personal responsibility and trust. Corporate Governance: The International Journal of
Effective Board Performance, Vol. 11 (4), pp. 489–500.
Mulki, J P & Jaramillo, F (2011) Ethical reputation and value received: customer perceptions.
International Journal of Bank Marketing, 29(5), 358–372
Mullerat, R (2010) International Corporate Social Responsibility: The Role of Corporations, Kluwer
Law International
Newman, I & Benz, C (1998) Qualitative-quantitative Research Methodology: Exploring the
Interactive Continuum, Southern Illinois University Press
Neuman, W (2006) Social Research Methods: Qualitative and Quantitative Approaches, 6th ed.
Pearson Education Inc
Nilsen, H (2010) CSR in banking: The pursuit toward repairing legitimacy and reputation. M.Sc.
Thesis, Copenhagen Business School
Osterhus, T L (1997) Pro-social Consumer Influence Strategies: When and How Do They Work?,
Journal of Marketing, 61(4), 16–29
Park, J, Hanjoon, L & Chankon, K (2014) Corporate social responsibilities, consumer trust and
corporate reputation: South Korean consumers' perspectives. Journal of Business Research, 67(3),
295–302
Parker, G & Moore, E (2013) RBS faces accusations on client treatment [Accessed 1Apr 2014]
www.ft.com/cms/s/0/f8da353e-5515-11e3-a321-00144feabdc0.html#axzz2xbuZpHVB
Pearce, J A II, & Doh, J P (2005) The high impact of collaborative social initiatives. MIT Sloan
Management Review, 46(3) 30–38
Peloza, J & Shang, J (2011) Investing in CSR to enhance customer value. Director Notes of the
Conference Board, 3(3), 1-10. http://papers.ssrn.com/sol3/papers.cfm?abstract_id=1843308
Pendse, S (2012) Ethical Hazards: A Motive, Means, and Opportunity Approach Curbing Corporate
Unethical Behavior, Journal of Business Ethics, 107(3), 265–279
Pomering, A & Dolnicar, S (2009) Assessing the prerequisite of successful CSR implementation: Are
consumers aware of CSR initiatives? Journal of Business Ethics, 85 (2s), 285–301
Porta, D D & Keating, M (2008) Approaches and Methodologies in the Social Sciences: A Pluralist
Perspective. Cambridge University Press
Porter, M E & Kramer, M R (2002) The competitive advantage of corporate philanthropy. Harvard
Business Review, 80(12), 57-68
Porter, M E & Kramer, M R (2006) Strategy and society: The link between competitive advantage and
corporate social responsibility. Harvard Business Review, 84(12), 1–15
Reinhardt, F, Stavins, R & Vietor, R (2008) Corporate Social Responsibility Through an Economic Lens.
NBER Working Paper 13989, National Bureau of Economic Research
Relaño, F (2011) Maximizing social return in the banking sector. Corporate Governance: The
international journal of business in society, 11(3), 274–284
Robson, C (2011) Real World Research, 3rd ed. Wiley
Roig , J, Guillen, M, Coll, S & Saumell, R (2013) Social value in retail banking. International Journal of
Bank Marketing, 31(5), 348–367
Rothschild, E (2013) Banking must pursue the holy grail of confidence [Accessed 1Apr 2014]
www.ft.com/cms/s/0/d9d7b490-dcbb-11e2-b52b-
00144feab7de.html?siteedition=uk#axzz2oqsNxq00
Samy, M, Odemilin, G & Bampton, R (2010) Corporate social responsibility: a strategy for sustainable
business success. An analysis of 20 selected British companies. Corporate Governance: The
international journal of business in society, 10(2), 203–217
Saunders, M N K, Lewis, P, Thornhill, A (2012) Research Methods for Business Students, 6th ed.
Financial Times/ Prentice Hall
Sexty, R (2010) Canadian Business and Society: Ethics and Responsibilities, 2nd ed. McGraw-Hill
Ryerson Higher Education
Shannon, L (2013) Give your bank its marching orders - Why you should ditch the giants such as
Lloyds and RBS for a tiny building society [Accessed 1Apr 2013]
www.thisismoney.co.uk/money/saving/article-2527524/Give-bank-marching-orders-Why-ditch-
giants-Lloyds-RBS-tiny-building-society.html
Sharma, A & Kiran, R (2013) Corporate Social Responsibility: Driving forces and challenges.
International Journal of Business Research and Development, 2(1), 18–27
Sims, R (2003) Ethics and Corporate Social Responsibility: Why Giants Fall, Praeger
Smissen, L V D (2012) The value of Corporate Social Responsibility for consumers. Master Thesis,
Faculty of Economics & Management, Hogeschool - Universiteit Brussel
Smith A (1776) An Inquiry into the Nature and Causes of the Wealth of Nations. W. Strahon and T.
Cadell: London
Sohail, A, Shahzad, K & Din, I A (2008) The role of corporate social responsibility to create positive
positioning in the branding of a country and particular to Pakistan. Master Thesis. School of
Management, Blekinge Institute of Technology
Sun, W, Stewart, J & Pollard, D (2010) Reframing Corporate Social Responsibility: Lessons from the
Global Financial Crisis. Emerald Group Publishing Limited
Sternberg, E (1997) The Defects of Stakeholder Theory. Corporate Governance, 5(1), 3–10
Sweeney, L (2009) A Study of Current Practice of Corporate Social Responsibility (CSR) and an
Examination of the Relationship Between CSR and Financial Performance Using Structural Equation
Modelling (SEM). PhD Thesis, College of Business, Dublin Institute of Technology
Tam, K K (2007) Effect of Brand Image on Consumer Purchasing Behaviour on Clothing: Comparison
between China and the UK’s Consumers. PhD Thesis, University of Nottingham
The Telegraph (2014) Economy growing at fastest pace since financial crisis [Accessed 1Apr 2014]
www.telegraph.co.uk/finance/economics/10600424/Economy-growing-at-fastest-pace-since-
financial-crisis.html
Thomas, P (2010) Research Methodology and Design [Accessed 2Jul 2014]
http://uir.unisa.ac.za/bitstream/handle/10500/4245/05Chap%204_Research%20methodology%20a
nd%20design.pdf
Trotta, A, Lannuzzi, A, Cavallaro, G & Dell’atti, S (2011) Banking reputation and CSR: a stakeholder
value approach. In Gummesson E., C. Apples, Polese F. Service Dominant logic, Network & System
Theory and Service Science: Integrating Three Perspectives for a New Service Agenda, Giannini
Editore, The 2011 Naples Forum On Service, Napoli, Italy
Turner, A (2003) Sampling strategies. United Nations Secretariat, Statistics Division, Expert Group
Meeting to Review the Draft Handbook on Designing of Household Sample Surveys
Visser, W (2005) Revisiting Carroll’s CSR Pyramid: An African Perspective. In Corporate Citizenship in
a Development Perspective, edited by Esben Rahbek Pedersen & Mahad Huniche, Copenhagen:
Copenhagen Business School Press
Visser, W (2010) The Age of Responsibility: CSR 2.0 and the New DNA of Business. Journal of Business
Systems, Governance and Ethics, 5 (3), 7–22
Vogel, D J (2005) Is there a market for virtue? The business case for corporate social responsibility.
California Management Review, 47(4), 19–45
Walsham, R (1995) Interpretive case studies in IS research: nature and method. European Journal of
Information System, 4(2), 74–81
Williams, R & Elliott, L (2010) Crisis and Recovery: Ethics Economics and Justice. Palgrave Macmillan
Wood D (1991) Social Issues in Management: Theory and Research in Corporate Social Performance.
Journal of Management, 17(2), 383–406
Yelkikalan, N & Kose, C (2012) The Effects of The Financial Crisis on Corporate Social Responsibility.
International Journal of Business and Social Science, 3(3), 292–300
Zhowa, T (2010) Corporate social responsibility – As A Competitive Advantage Strategy by
Community Banks in Tshwane. Master Thesis, Faculty of Management Sciences, Tshwane University
of Technology
Appendices
APPENDIX A – SURVEY EMAIL INVITATION
Dear (name of respondent),
I hope my email finds you well.
I am writing to you requesting the completion of a survey on CSR (Corporate Social Responsibility). It
is part of my MBA Dissertation at University of West London Business School.
The research aims to investigate “Customer attitudes to the role of Corporate Social Responsibility
(CSR) in the UK Banking Sector since the financial crisis in 2007”. The respondents need to have a UK
Bank Account and the survey ensures that before continuing.
The survey is administered using Survey Monkey and, to complete the survey, you need to go to the
following link:
https://www.surveymonkey.com/s/YL28TTG
The connection is secured and the survey ensures the confidentially of the information received. All
data will be anonymous and no inferences regarding any individual will be made.
If you require more information or assistance or would like to receive a copy of the results please do
not hesitate to contact me on my email address below.
Thank you for your assistance in this important research.
Best Regards,
_______________________
Amany Hamza
Executive MBA student at University of West London Business School
Email: amany@student.uwl.ac.uk
APPENDIX B1 – SURVEY FIRST REMINDER
Dear (name of respondent),
Thank you very much for those who completed the survey sent out on the 14th
of July.
This is a reminder for those who haven’t been able to complete it yet. We’d appreciate it very much
if you can complete it as soon as possible.
For any questions, please feel free to contact me on my email below.
Thank you very much for your cooperation.
Best Regards,
_______________________
Amany Hamza
Executive MBA student at University of West London Business School
Email: amany@student.uwl.ac.uk
APPENDIX B2 – SURVEY FINAL REMINDER
Dear (name of respondent),
Thank you very much for those who completed the survey sent out on the 14th
of July.
This is a reminder for those who haven’t been able to complete it yet. There is still a chance to
complete and contribute to a research that could benefit of all us.
We’d appreciate it very much if you can complete the survey as soon as possible as we will be
closing it by the 12th
of August.
For any questions, please feel free to contact me on my email below.
Thank you very much for your cooperation.
Best Regards,
_______________________
Amany Hamza
Executive MBA student at University of West London Business School
Email: amany@student.uwl.ac.uk
APPENDIX C – SURVEY
APPENDIX D – ACRONYMS
CSR Corporate Social Responsibility
CR Corporate Reputation
DV Dependent Variable
EC&LG Economic & Legal
ECP&LGP Economic Practices & Legal Practices
ETP&PHP Ethical Practices & Philanthropic Practices
FC Financial Crisis
IV Independent Variable
KMO Kaiser-Meyer-Olkin
PCA Principle Component Analysis
PH&ET Philanthropic & Ethical
Appendix E- Research Objective one - Reliability Analysis 1
Reliability Statistics
Cronbach's
Alpha
Cronbach's
Alpha Based on
Standardized
Items N of Items
.961 .962 33
Inter-Item Correlation Matrix
Q9Borrowings_
And_Savings
Q9Transparenc
y
Q9Financial_St
atements Q9Offers
Q9Borrowings_And_Savings
Q9Transparency
Q9Financial_Statements
Q9Offers
Q9Executive_Remuneration
Q9Financial_Inclusion_SMEbanking
Q9MeetCustomers_Needs
Q9Social_Attachment
Q9Confidentially
Q9Valued_Customer_Recognition
Q9Honest_Relationship
Q9Being_Accountable
Q9legal_Obligations
Q9Combating_Bribery
Q9Giving_Back_To_Community
Q9Financial_literacy
Q9Environmentally_branches
Q10
Q11
Q12Financial_Stability
Q12Withdraw_Money
Q12Treated
AQ12Advice_Quality
Q12Personal_Information_Safe
Q12Fees
Q12Interest_Rates_Accounts
Q12Interest_Rates_Loan
1.000 .559 .533 .495 .407
.559 1.000 .553 .518 .467
.533 .553 1.000 .428 .215
.495 .518 .428 1.000 .291
.407 .467 .215 .291 1.000
.512 .478 .365 .328 .566
.503 .503 .434 .490 .468
.579 .502 .240 .330 .537
.520 .390 .452 .371 .388
.413 .484 .363 .383 .457
.559 .605 .473 .414 .584
.570 .580 .421 .440 .600
.563 .489 .550 .440 .516
.446 .374 .376 .290 .471
.457 .455 .215 .333 .474
.410 .341 .113 .202 .538
.514 .329 .198 .169 .486
.633 .660 .450 .492 .572
.492 .578 .408 .498 .445
.592 .539 .528 .395 .489
.448 .433 .442 .302 .329
.474 .616 .455 .453 .398
.510 .578 .461 .427 .451
.423 .338 .455 .260 .431
.523 .761 .519 .403 .442
.667 .583 .503 .392 .380
.513 .529 .450 .274 .378
.549 .480 .376 .355 .383
Inter-Item Correlation Matrix
Q9Executive_R
emuneration
Q9Financial_In
clusion_SMEba
nking
Q9MeetCustom
ers_Needs
Q9Borrowings_And_Savings
Q9Transparency
Q9Financial_Statements
Q9Offers
Q9Executive_Remuneration
Q9Financial_Inclusion_SMEbanking
Q9MeetCustomers_Needs
Q9Social_Attachment
Q9Confidentially
Q9Valued_Customer_Recognition
Q9Honest_Relationship
Q9Being_Accountable
Q9legal_Obligations
Q9Combating_Bribery
Q9Giving_Back_To_Community
Q9Financial_literacy
Q9Environmentally_branches
Q10
Q11
Q12Financial_Stability
Q12Withdraw_Money
Q12Treated
AQ12Advice_Quality
Q12Personal_Information_Safe
Q12Fees
Q12Interest_Rates_Accounts
Q12Interest_Rates_Loan
.407 .512 .503 .579
.467 .478 .503 .502
.215 .365 .434 .240
.291 .328 .490 .330
1.000 .566 .468 .537
.566 1.000 .609 .557
.468 .609 1.000 .455
.537 .557 .455 1.000
.388 .415 .520 .230
.457 .385 .614 .396
.584 .504 .595 .345
.600 .398 .605 .463
.516 .341 .438 .344
.471 .319 .427 .384
.474 .382 .561 .588
.538 .448 .431 .645
.486 .385 .392 .529
.572 .584 .573 .575
.445 .521 .694 .527
.489 .442 .592 .450
.329 .385 .441 .335
.398 .434 .679 .406
.451 .529 .666 .452
.431 .293 .370 .259
.442 .490 .568 .442
.380 .413 .492 .430
.378 .455 .524 .483
.383 .459 .403 .357
Inter-Item Correlation Matrix
Q9Social_Attac
hment
Q9Confidentiall
y
Q9Valued_Cust
omer_Recogniti
on
Q9Borrowings_And_Savings
Q9Transparency
Q9Financial_Statements
Q9Offers
Q9Executive_Remuneration
Q9Financial_Inclusion_SMEbanking
Q9MeetCustomers_Needs
Q9Social_Attachment
Q9Confidentially
Q9Valued_Customer_Recognition
Q9Honest_Relationship
Q9Being_Accountable
Q9legal_Obligations
Q9Combating_Bribery
Q9Giving_Back_To_Community
Q9Financial_literacy
Q9Environmentally_branches
Q10
Q11
Q12Financial_Stability
Q12Withdraw_Money
Q12Treated
AQ12Advice_Quality
Q12Personal_Information_Safe
Q12Fees
Q12Interest_Rates_Accounts
Q12Interest_Rates_Loan
.579 .520 .413 .559
.502 .390 .484 .605
.240 .452 .363 .473
.330 .371 .383 .414
.537 .388 .457 .584
.557 .415 .385 .504
.455 .520 .614 .595
1.000 .230 .396 .345
.230 1.000 .506 .623
.396 .506 1.000 .700
.345 .623 .700 1.000
.463 .626 .624 .670
.344 .538 .494 .607
.384 .522 .510 .492
.588 .439 .629 .457
.645 .298 .489 .359
.529 .356 .402 .384
.575 .492 .410 .573
.527 .383 .474 .577
.450 .587 .427 .531
.335 .529 .393 .509
.406 .559 .675 .646
.452 .421 .677 .672
.259 .416 .375 .508
.442 .385 .464 .575
.430 .472 .462 .531
.483 .390 .448 .470
.357 .344 .351 .484
Inter-Item Correlation Matrix
Q9Honest_Rela
tionship
Q9Being_Acco
untable
Q9legal_Obliga
tions
Q9Borrowings_And_Savings
Q9Transparency
Q9Financial_Statements
Q9Offers
Q9Executive_Remuneration
Q9Financial_Inclusion_SMEbanking
Q9MeetCustomers_Needs
Q9Social_Attachment
Q9Confidentially
Q9Valued_Customer_Recognition
Q9Honest_Relationship
Q9Being_Accountable
Q9legal_Obligations
Q9Combating_Bribery
Q9Giving_Back_To_Community
Q9Financial_literacy
Q9Environmentally_branches
Q10
Q11
Q12Financial_Stability
Q12Withdraw_Money
Q12Treated
AQ12Advice_Quality
Q12Personal_Information_Safe
Q12Fees
Q12Interest_Rates_Accounts
Q12Interest_Rates_Loan
.559 .570 .563 .446
.605 .580 .489 .374
.473 .421 .550 .376
.414 .440 .440 .290
.584 .600 .516 .471
.504 .398 .341 .319
.595 .605 .438 .427
.345 .463 .344 .384
.623 .626 .538 .522
.700 .624 .494 .510
1.000 .670 .607 .492
.670 1.000 .648 .596
.607 .648 1.000 .554
.492 .596 .554 1.000
.457 .627 .345 .542
.359 .459 .335 .332
.384 .504 .318 .379
.573 .595 .608 .398
.577 .513 .416 .321
.531 .600 .505 .385
.509 .399 .503 .464
.646 .599 .497 .472
.672 .595 .528 .421
.508 .348 .361 .395
.575 .525 .426 .329
.531 .488 .479 .409
.470 .393 .423 .352
.484 .474 .519 .275
Inter-Item Correlation Matrix
Q9Combating_
Bribery
Q9Giving_Back
_To_Communit
y
Q9Financial_lit
eracy
Q9Borrowings_And_Savings
Q9Transparency
Q9Financial_Statements
Q9Offers
Q9Executive_Remuneration
Q9Financial_Inclusion_SMEbanking
Q9MeetCustomers_Needs
Q9Social_Attachment
Q9Confidentially
Q9Valued_Customer_Recognition
Q9Honest_Relationship
Q9Being_Accountable
Q9legal_Obligations
Q9Combating_Bribery
Q9Giving_Back_To_Community
Q9Financial_literacy
Q9Environmentally_branches
Q10
Q11
Q12Financial_Stability
Q12Withdraw_Money
Q12Treated
AQ12Advice_Quality
Q12Personal_Information_Safe
Q12Fees
Q12Interest_Rates_Accounts
Q12Interest_Rates_Loan
.446 .457 .410 .514
.374 .455 .341 .329
.376 .215 .113 .198
.290 .333 .202 .169
.471 .474 .538 .486
.319 .382 .448 .385
.427 .561 .431 .392
.384 .588 .645 .529
.522 .439 .298 .356
.510 .629 .489 .402
.492 .457 .359 .384
.596 .627 .459 .504
.554 .345 .335 .318
1.000 .542 .332 .379
.542 1.000 .590 .594
.332 .590 1.000 .441
.379 .594 .441 1.000
.398 .411 .479 .455
.321 .438 .538 .343
.385 .492 .452 .477
.464 .411 .355 .399
.472 .493 .462 .465
.421 .487 .469 .502
.395 .318 .235 .370
.329 .445 .346 .377
.409 .396 .326 .397
.352 .435 .328 .501
.275 .352 .286 .442
Inter-Item Correlation Matrix
Q9Environment
ally_branches Q10 Q11
Q12Financial_S
tability
Q9Borrowings_And_Savings
Q9Transparency
Q9Financial_Statements
Q9Offers
Q9Executive_Remuneration
Q9Financial_Inclusion_SMEbanking
Q9MeetCustomers_Needs
Q9Social_Attachment
Q9Confidentially
Q9Valued_Customer_Recognition
Q9Honest_Relationship
Q9Being_Accountable
Q9legal_Obligations
Q9Combating_Bribery
Q9Giving_Back_To_Community
Q9Financial_literacy
Q9Environmentally_branches
Q10
Q11
Q12Financial_Stability
Q12Withdraw_Money
Q12Treated
AQ12Advice_Quality
Q12Personal_Information_Safe
Q12Fees
Q12Interest_Rates_Accounts
Q12Interest_Rates_Loan
.514 .633 .492 .592 .448
.329 .660 .578 .539 .433
.198 .450 .408 .528 .442
.169 .492 .498 .395 .302
.486 .572 .445 .489 .329
.385 .584 .521 .442 .385
.392 .573 .694 .592 .441
.529 .575 .527 .450 .335
.356 .492 .383 .587 .529
.402 .410 .474 .427 .393
.384 .573 .577 .531 .509
.504 .595 .513 .600 .399
.318 .608 .416 .505 .503
.379 .398 .321 .385 .464
.594 .411 .438 .492 .411
.441 .479 .538 .452 .355
1.000 .455 .343 .477 .399
.455 1.000 .670 .657 .530
.343 .670 1.000 .608 .486
.477 .657 .608 1.000 .546
.399 .530 .486 .546 1.000
.465 .647 .705 .567 .681
.502 .561 .623 .498 .560
.370 .380 .371 .549 .552
.377 .664 .721 .625 .540
.397 .591 .542 .561 .466
.501 .623 .543 .546 .441
.442 .587 .488 .494 .478
Inter-Item Correlation Matrix
Q12Withdraw_
Money Q12Treated
AQ12Advice_Q
uality
Q9Borrowings_And_Savings
Q9Transparency
Q9Financial_Statements
Q9Offers
Q9Executive_Remuneration
Q9Financial_Inclusion_SMEbanking
Q9MeetCustomers_Needs
Q9Social_Attachment
Q9Confidentially
Q9Valued_Customer_Recognition
Q9Honest_Relationship
Q9Being_Accountable
Q9legal_Obligations
Q9Combating_Bribery
Q9Giving_Back_To_Community
Q9Financial_literacy
Q9Environmentally_branches
Q10
Q11
Q12Financial_Stability
Q12Withdraw_Money
Q12Treated
AQ12Advice_Quality
Q12Personal_Information_Safe
Q12Fees
Q12Interest_Rates_Accounts
Q12Interest_Rates_Loan
.448 .474 .510 .423
.433 .616 .578 .338
.442 .455 .461 .455
.302 .453 .427 .260
.329 .398 .451 .431
.385 .434 .529 .293
.441 .679 .666 .370
.335 .406 .452 .259
.529 .559 .421 .416
.393 .675 .677 .375
.509 .646 .672 .508
.399 .599 .595 .348
.503 .497 .528 .361
.464 .472 .421 .395
.411 .493 .487 .318
.355 .462 .469 .235
.399 .465 .502 .370
.530 .647 .561 .380
.486 .705 .623 .371
.546 .567 .498 .549
1.000 .681 .560 .552
.681 1.000 .777 .432
.560 .777 1.000 .410
.552 .432 .410 1.000
.540 .706 .598 .491
.466 .599 .518 .428
.441 .598 .506 .450
.478 .528 .487 .365
Inter-Item Correlation Matrix
Q12Personal_I
nformation_Saf
e Q12Fees
Q12Interest_Ra
tes_Accounts
Q12Interest_Ra
tes_Loan
Q9Borrowings_And_Savings
Q9Transparency
Q9Financial_Statements
Q9Offers
Q9Executive_Remuneration
Q9Financial_Inclusion_SMEbanking
Q9MeetCustomers_Needs
Q9Social_Attachment
Q9Confidentially
Q9Valued_Customer_Recognition
Q9Honest_Relationship
Q9Being_Accountable
Q9legal_Obligations
Q9Combating_Bribery
Q9Giving_Back_To_Community
Q9Financial_literacy
Q9Environmentally_branches
Q10
Q11
Q12Financial_Stability
Q12Withdraw_Money
Q12Treated
AQ12Advice_Quality
Q12Personal_Information_Safe
Q12Fees
Q12Interest_Rates_Accounts
Q12Interest_Rates_Loan
.423 .523 .667 .513 .549
.338 .761 .583 .529 .480
.455 .519 .503 .450 .376
.260 .403 .392 .274 .355
.431 .442 .380 .378 .383
.293 .490 .413 .455 .459
.370 .568 .492 .524 .403
.259 .442 .430 .483 .357
.416 .385 .472 .390 .344
.375 .464 .462 .448 .351
.508 .575 .531 .470 .484
.348 .525 .488 .393 .474
.361 .426 .479 .423 .519
.395 .329 .409 .352 .275
.318 .445 .396 .435 .352
.235 .346 .326 .328 .286
.370 .377 .397 .501 .442
.380 .664 .591 .623 .587
.371 .721 .542 .543 .488
.549 .625 .561 .546 .494
.552 .540 .466 .441 .478
.432 .706 .599 .598 .528
.410 .598 .518 .506 .487
1.000 .491 .428 .450 .365
.491 1.000 .762 .735 .670
.428 .762 1.000 .792 .627
.450 .735 .792 1.000 .631
.365 .670 .627 .631 1.000
Inter-Item Correlation Matrix
Q12Open_Or_
Close_Branche
s Q13 Q14 Q16 Q17
Q9Borrowings_And_Savings
Q9Transparency
Q9Financial_Statements
Q9Offers
Q9Executive_Remuneration
Q9Financial_Inclusion_SMEbanking
Q9MeetCustomers_Needs
Q9Social_Attachment
Q9Confidentially
Q9Valued_Customer_Recognition
Q9Honest_Relationship
Q9Being_Accountable
Q9legal_Obligations
Q9Combating_Bribery
Q9Giving_Back_To_Community
Q9Financial_literacy
Q9Environmentally_branches
Q10
Q11
Q12Financial_Stability
Q12Withdraw_Money
Q12Treated
AQ12Advice_Quality
Q12Personal_Information_Safe
Q12Fees
Q12Interest_Rates_Accounts
Q12Interest_Rates_Loan
.549 .482 .490 .115 .492 .245
.480 .595 .458 .094 .448 .266
.376 .415 .448 .241 .472 .219
.355 .357 .360 -.075 .368 .174
.383 .566 .553 -.217 .411 .171
.459 .598 .444 -.049 .370 .186
.403 .518 .540 .093 .412 .222
.357 .607 .393 -.028 .525 .141
.344 .368 .388 .185 .364 .253
.351 .534 .474 -.056 .350 .185
.484 .562 .544 .042 .452 .225
.474 .533 .561 .075 .545 .193
.519 .519 .463 .119 .360 .177
.275 .423 .442 .073 .409 .208
.352 .528 .526 .074 .421 .241
.286 .557 .404 -.095 .405 .145
.442 .400 .327 .122 .472 .192
.587 .701 .531 .105 .458 .255
.488 .604 .424 .082 .430 .140
.494 .548 .492 .178 .471 .299
.478 .407 .373 .303 .297 .205
.528 .559 .478 .150 .509 .290
.487 .523 .514 .118 .534 .264
.365 .301 .334 .108 .248 .171
.670 .562 .465 .204 .375 .139
.627 .442 .460 .126 .388 .126
.631 .540 .416 .142 .330 .144
1.000 .466 .473 .154 .357 .035
Inter-Item Correlation Matrix
Q18
Q9Borrowings_And_Savings
Q9Transparency
Q9Financial_Statements
Q9Offers
Q9Executive_Remuneration
Q9Financial_Inclusion_SMEbanking
Q9MeetCustomers_Needs
Q9Social_Attachment
Q9Confidentially
Q9Valued_Customer_Recognition
Q9Honest_Relationship
Q9Being_Accountable
Q9legal_Obligations
Q9Combating_Bribery
Q9Giving_Back_To_Community
Q9Financial_literacy
Q9Environmentally_branches
Q10
Q11
Q12Financial_Stability
Q12Withdraw_Money
Q12Treated
AQ12Advice_Quality
Q12Personal_Information_Safe
Q12Fees
Q12Interest_Rates_Accounts
Q12Interest_Rates_Loan
.245
.266
.219
.174
.171
.186
.222
.141
.253
.185
.225
.193
.177
.208
.241
.145
.192
.255
.140
.299
.205
.290
.264
.171
.139
.126
.144
.035
Inter-Item Correlation Matrix
Q9Borrowings_
And_Savings
Q9Transparenc
y
Q9Financial_St
atements Q9Offers
Q12Open_Or_Close_Branches
Q13
Q14
Q16
Q17
Q18
.549 .480 .376 .355 .383
.482 .595 .415 .357 .566
.490 .458 .448 .360 .553
.115 .094 .241 -.075 -.217
.492 .448 .472 .368 .411
.245 .266 .219 .174 .171
Inter-Item Correlation Matrix
Q9Executive_R
emuneration
Q9Financial_In
clusion_SMEba
nking
Q9MeetCustom
ers_Needs
Q12Open_Or_Close_Branches
Q13
Q14
Q16
Q17
Q18
.383 .459 .403 .357
.566 .598 .518 .607
.553 .444 .540 .393
-.217 -.049 .093 -.028
.411 .370 .412 .525
.171 .186 .222 .141
Inter-Item Correlation Matrix
Q9Social_Attac
hment
Q9Confidentiall
y
Q9Valued_Cust
omer_Recogniti
on
Q12Open_Or_Close_Branches
Q13
Q14
Q16
Q17
Q18
.357 .344 .351 .484
.607 .368 .534 .562
.393 .388 .474 .544
-.028 .185 -.056 .042
.525 .364 .350 .452
.141 .253 .185 .225
Inter-Item Correlation Matrix
Q9Honest_Rela
tionship
Q9Being_Acco
untable
Q9legal_Obliga
tions
Q12Open_Or_Close_Branches
Q13
Q14
Q16
Q17
Q18
.484 .474 .519 .275
.562 .533 .519 .423
.544 .561 .463 .442
.042 .075 .119 .073
.452 .545 .360 .409
.225 .193 .177 .208
Inter-Item Correlation Matrix
Q9Combating_
Bribery
Q9Giving_Back
_To_Communit
y
Q9Financial_lit
eracy
Q12Open_Or_Close_Branches
Q13
Q14
Q16
Q17
Q18
.275 .352 .286 .442
.423 .528 .557 .400
.442 .526 .404 .327
.073 .074 -.095 .122
.409 .421 .405 .472
.208 .241 .145 .192
Inter-Item Correlation Matrix
Q9Environment
ally_branches Q10 Q11
Q12Financial_S
tability
Q12Open_Or_Close_Branches
Q13
Q14
Q16
Q17
Q18
.442 .587 .488 .494 .478
.400 .701 .604 .548 .407
.327 .531 .424 .492 .373
.122 .105 .082 .178 .303
.472 .458 .430 .471 .297
.192 .255 .140 .299 .205
Inter-Item Correlation Matrix
Q12Withdraw_
Money Q12Treated
AQ12Advice_Q
uality
Q12Open_Or_Close_Branches
Q13
Q14
Q16
Q17
Q18
.478 .528 .487 .365
.407 .559 .523 .301
.373 .478 .514 .334
.303 .150 .118 .108
.297 .509 .534 .248
.205 .290 .264 .171
Inter-Item Correlation Matrix
Q12Personal_I
nformation_Saf
e Q12Fees
Q12Interest_Ra
tes_Accounts
Q12Interest_Ra
tes_Loan
Q12Open_Or_Close_Branches
Q13
Q14
Q16
Q17
Q18
.365 .670 .627 .631 1.000
.301 .562 .442 .540 .466
.334 .465 .460 .416 .473
.108 .204 .126 .142 .154
.248 .375 .388 .330 .357
.171 .139 .126 .144 .035
Inter-Item Correlation Matrix
Q12Open_Or_
Close_Branche
s Q13 Q14 Q16 Q17
Q12Open_Or_Close_Branches
Q13
Q14
Q16
Q17
Q18
1.000 .466 .473 .154 .357 .035
.466 1.000 .639 -.091 .413 .110
.473 .639 1.000 .010 .573 .158
.154 -.091 .010 1.000 .195 .254
.357 .413 .573 .195 1.000 .339
.035 .110 .158 .254 .339 1.000
Inter-Item Correlation Matrix
Q18
Q12Open_Or_Close_Branches
Q13
Q14
Q16
Q17
Q18
.035
.110
.158
.254
.339
1.000
Item-Total Statistics
Scale Mean if
Item Deleted
Scale Variance
if Item Deleted
Corrected Item-
Total
Correlation
Q9Borrowings_And_Savings
Q9Transparency
Q9Financial_Statements
Q9Offers
Q9Executive_Remuneration
Q9Financial_Inclusion_SMEbanking
Q9MeetCustomers_Needs
Q9Social_Attachment
Q9Confidentially
Q9Valued_Customer_Recognition
Q9Honest_Relationship
Q9Being_Accountable
Q9legal_Obligations
Q9Combating_Bribery
Q9Giving_Back_To_Community
Q9Financial_literacy
Q9Environmentally_branches
Q10
Q11
Q12Financial_Stability
Q12Withdraw_Money
Q12Treated
AQ12Advice_Quality
Q12Personal_Information_Safe
Q12Fees
Q12Interest_Rates_Accounts
Q12Interest_Rates_Loan
101.18 396.570 .732 .
100.87 395.631 .728 .
100.63 402.214 .596 .
100.96 402.504 .528 .
101.58 401.983 .630 .
101.46 404.229 .626 .
101.30 394.214 .740 .
101.62 401.051 .621 .
100.75 400.717 .639 .
101.26 396.700 .674 .
100.99 395.000 .761 .
101.21 392.363 .760 .
100.90 399.540 .669 .
101.11 403.219 .592 .
101.60 400.573 .658 .
101.66 403.962 .559 .
101.48 401.483 .584 .
101.21 396.869 .790 .
101.21 391.792 .727 .
100.78 394.919 .754 .
100.39 401.779 .648 .
100.70 391.203 .800 .
101.02 393.252 .767 .
100.64 402.628 .542 .
100.84 394.687 .762 .
100.87 394.950 .710 .
101.03 398.977 .688 .
101.14 398.298 .635 .
Item-Total Statistics
Squared
Multiple
Correlation
Cronbach's
Alpha if Item
Deleted
Q9Borrowings_And_Savings
Q9Transparency
Q9Financial_Statements
Q9Offers
Q9Executive_Remuneration
Q9Financial_Inclusion_SMEbanking
Q9MeetCustomers_Needs
Q9Social_Attachment
Q9Confidentially
Q9Valued_Customer_Recognition
Q9Honest_Relationship
Q9Being_Accountable
Q9legal_Obligations
Q9Combating_Bribery
Q9Giving_Back_To_Community
Q9Financial_literacy
Q9Environmentally_branches
Q10
Q11
Q12Financial_Stability
Q12Withdraw_Money
Q12Treated
AQ12Advice_Quality
Q12Personal_Information_Safe
Q12Fees
Q12Interest_Rates_Accounts
Q12Interest_Rates_Loan
. .959
. .959
. .960
. .960
. .960
. .960
. .959
. .960
. .960
. .959
. .959
. .959
. .960
. .960
. .960
. .960
. .960
. .959
. .959
. .959
. .960
. .959
. .959
. .960
. .959
. .959
. .959
. .960
Item-Total Statistics
Scale Mean if
Item Deleted
Scale Variance
if Item Deleted
Corrected Item-
Total
Correlation
Q12Open_Or_Close_Branches
Q13
Q14
Q16
Q17
Q18
101.14 398.298 .635 .
101.52 403.615 .709 .
101.35 397.746 .656 .
100.48 418.296 .132 .
101.51 395.923 .615 .
101.80 408.313 .293 .
Item-Total Statistics
Squared
Multiple
Correlation
Cronbach's
Alpha if Item
Deleted
Q12Open_Or_Close_Branches
Q13
Q14
Q16
Q17
Q18
. .960
. .960
. .960
. .963
. .960
. .963
Appendix F - Research Objective one - Factor Analysis-before compon
ents extraction
Correlation Matrixa
Q9Borrowings_
And_Savings
Q9Transparenc
y
Correlation Q9Borrowings_And_Savings
Q9Transparency
1.000 .559 .533
.559 1.000 .553
.533 .553 1.000
Correlation Matrixa
Q9Financial_St
atements Q9Offers
Correlation Q9Borrowings_And_Savings
Q9Transparency
.533 .495 .407
.553 .518 .467
1.000 .428 .215
Correlation Matrixa
Q9Executive_R
emuneration
Q9Financial_In
clusion_SMEba
nking
Correlation Q9Borrowings_And_Savings
Q9Transparency
.407 .512 .503
.467 .478 .503
.215 .365 .434
Correlation Matrixa
Q9MeetCustom
ers_Needs
Q9Social_Attac
hment
Correlation Q9Borrowings_And_Savings
Q9Transparency
.503 .579 .520
.503 .502 .390
.434 .240 .452
Correlation Matrixa
Q9Confidentiall
y
Q9Valued_Cust
omer_Recogniti
on
Correlation Q9Borrowings_And_Savings
Q9Transparency
.520 .413 .559
.390 .484 .605
.452 .363 .473
Correlation Matrixa
Q9Honest_Rela
tionship
Q9Being_Acco
untable
Correlation Q9Borrowings_And_Savings
Q9Transparency
.559 .570 .563
.605 .580 .489
.473 .421 .550
Correlation Matrixa
Q9legal_Obliga
tions
Q9Combating_
Bribery
Correlation Q9Borrowings_And_Savings
Q9Transparency
.563 .446 .457
.489 .374 .455
.550 .376 .215
Correlation Matrixa
Q9Giving_Back
_To_Communit
y
Q9Financial_lit
eracy
Correlation Q9Borrowings_And_Savings
Q9Transparency
.457 .410 .514
.455 .341 .329
.215 .113 .198
Correlation Matrixa
Q9Environment
ally_branches Q10 Q11
Correlation Q9Borrowings_And_Savings
Q9Transparency
.514 .633 .492 .592
.329 .660 .578 .539
.198 .450 .408 .528
Correlation Matrixa
Q12Financial_S
tability
Q12Withdraw_
Money
Correlation Q9Borrowings_And_Savings
Q9Transparency
.592 .448 .474
.539 .433 .616
.528 .442 .455
Correlation Matrixa
Q12Treated
AQ12Advice_Q
uality
Correlation Q9Borrowings_And_Savings
Q9Transparency
.474 .510 .423
.616 .578 .338
.455 .461 .455
Correlation Matrixa
Q12Personal_I
nformation_Saf
e Q12Fees
Correlation Q9Borrowings_And_Savings
Q9Transparency
.423 .523 .667
.338 .761 .583
.455 .519 .503
Correlation Matrixa
Q12Interest_Ra
tes_Accounts
Q12Interest_Ra
tes_Loan
Correlation Q9Borrowings_And_Savings
Q9Transparency
.667 .513 .549
.583 .529 .480
.503 .450 .376
Correlation Matrixa
Q12Open_Or_
Close_Branche
s Q13 Q14
Correlation Q9Borrowings_And_Savings
Q9Transparency
.549 .482 .490 .115
.480 .595 .458 .094
.376 .415 .448 .241
Correlation Matrixa
Q16 Q17 Q18
Correlation Q9Borrowings_And_Savings
Q9Transparency
.115 .492 .245
.094 .448 .266
.241 .472 .219
Correlation Matrixa
Q9Borrowings_
And_Savings
Q9Transparenc
y
Correlation
Q9Financial_Statements
Q9Offers
Q9Executive_Remuneration
Q9Financial_Inclusion_SMEbanking
Q9MeetCustomers_Needs
Q9Social_Attachment
Q9Confidentially
Q9Valued_Customer_Recognition
Q9Honest_Relationship
Q9Being_Accountable
Q9legal_Obligations
Q9Combating_Bribery
Q9Giving_Back_To_Community
Q9Financial_literacy
Q9Environmentally_branches
Q10
Q11
Q12Financial_Stability
Q12Withdraw_Money
Q12Treated
AQ12Advice_Quality
Q12Personal_Information_Safe
Q12Fees
Q12Interest_Rates_Accounts
Q12Interest_Rates_Loan
Q12Open_Or_Close_Branches
Q13
Q14
Q16
Q17
Q18
Sig. (1-tailed) Q9Borrowings_And_Savings
Q9Transparency
Q9Financial_Statements
Q9Offers
Q9Executive_Remuneration
Q9Financial_Inclusion_SMEbanking
Q9MeetCustomers_Needs
.533 .553 1.000
.495 .518 .428
.407 .467 .215
.512 .478 .365
.503 .503 .434
.579 .502 .240
.520 .390 .452
.413 .484 .363
.559 .605 .473
.570 .580 .421
.563 .489 .550
.446 .374 .376
.457 .455 .215
.410 .341 .113
.514 .329 .198
.633 .660 .450
.492 .578 .408
.592 .539 .528
.448 .433 .442
.474 .616 .455
.510 .578 .461
.423 .338 .455
.523 .761 .519
.667 .583 .503
.513 .529 .450
.549 .480 .376
.482 .595 .415
.490 .458 .448
.115 .094 .241
.492 .448 .472
.245 .266 .219
.000 .000
.000 .000
.000 .000
.000 .000 .000
.000 .000 .020
.000 .000 .000
.000 .000 .000
.000 .011
Correlation Matrixa
Q9Financial_St
atements Q9Offers
Correlation
Q9Financial_Statements
Q9Offers
Q9Executive_Remuneration
Q9Financial_Inclusion_SMEbanking
Q9MeetCustomers_Needs
Q9Social_Attachment
Q9Confidentially
Q9Valued_Customer_Recognition
Q9Honest_Relationship
Q9Being_Accountable
Q9legal_Obligations
Q9Combating_Bribery
Q9Giving_Back_To_Community
Q9Financial_literacy
Q9Environmentally_branches
Q10
Q11
Q12Financial_Stability
Q12Withdraw_Money
Q12Treated
AQ12Advice_Quality
Q12Personal_Information_Safe
Q12Fees
Q12Interest_Rates_Accounts
Q12Interest_Rates_Loan
Q12Open_Or_Close_Branches
Q13
Q14
Q16
Q17
Q18
Sig. (1-tailed) Q9Borrowings_And_Savings
Q9Transparency
Q9Financial_Statements
Q9Offers
Q9Executive_Remuneration
Q9Financial_Inclusion_SMEbanking
Q9MeetCustomers_Needs
1.000 .428 .215
.428 1.000 .291
.215 .291 1.000
.365 .328 .566
.434 .490 .468
.240 .330 .537
.452 .371 .388
.363 .383 .457
.473 .414 .584
.421 .440 .600
.550 .440 .516
.376 .290 .471
.215 .333 .474
.113 .202 .538
.198 .169 .486
.450 .492 .572
.408 .498 .445
.528 .395 .489
.442 .302 .329
.455 .453 .398
.461 .427 .451
.455 .260 .431
.519 .403 .442
.503 .392 .380
.450 .274 .378
.376 .355 .383
.415 .357 .566
.448 .360 .553
.241 -.075 -.217
.472 .368 .411
.219 .174 .171
.000 .000 .000
.000 .000 .000
.000 .020
.000 .002
.020 .002
.000 .001 .000
.000 .000 .000
.011 .001 .000
Correlation Matrixa
Q9Executive_R
emuneration
Q9Financial_In
clusion_SMEba
nking
Correlation
Q9Financial_Statements
Q9Offers
Q9Executive_Remuneration
Q9Financial_Inclusion_SMEbanking
Q9MeetCustomers_Needs
Q9Social_Attachment
Q9Confidentially
Q9Valued_Customer_Recognition
Q9Honest_Relationship
Q9Being_Accountable
Q9legal_Obligations
Q9Combating_Bribery
Q9Giving_Back_To_Community
Q9Financial_literacy
Q9Environmentally_branches
Q10
Q11
Q12Financial_Stability
Q12Withdraw_Money
Q12Treated
AQ12Advice_Quality
Q12Personal_Information_Safe
Q12Fees
Q12Interest_Rates_Accounts
Q12Interest_Rates_Loan
Q12Open_Or_Close_Branches
Q13
Q14
Q16
Q17
Q18
Sig. (1-tailed) Q9Borrowings_And_Savings
Q9Transparency
Q9Financial_Statements
Q9Offers
Q9Executive_Remuneration
Q9Financial_Inclusion_SMEbanking
Q9MeetCustomers_Needs
.215 .365 .434
.291 .328 .490
1.000 .566 .468
.566 1.000 .609
.468 .609 1.000
.537 .557 .455
.388 .415 .520
.457 .385 .614
.584 .504 .595
.600 .398 .605
.516 .341 .438
.471 .319 .427
.474 .382 .561
.538 .448 .431
.486 .385 .392
.572 .584 .573
.445 .521 .694
.489 .442 .592
.329 .385 .441
.398 .434 .679
.451 .529 .666
.431 .293 .370
.442 .490 .568
.380 .413 .492
.378 .455 .524
.383 .459 .403
.566 .598 .518
.553 .444 .540
-.217 -.049 .093
.411 .370 .412
.171 .186 .222
.000 .000 .000
.000 .000 .000
.020 .000 .000
.002 .001 .000
.000 .000
.000 .000
.000 .000
.000 .000
Correlation Matrixa
Q9MeetCustom
ers_Needs
Q9Social_Attac
hment
Correlation
Q9Financial_Statements
Q9Offers
Q9Executive_Remuneration
Q9Financial_Inclusion_SMEbanking
Q9MeetCustomers_Needs
Q9Social_Attachment
Q9Confidentially
Q9Valued_Customer_Recognition
Q9Honest_Relationship
Q9Being_Accountable
Q9legal_Obligations
Q9Combating_Bribery
Q9Giving_Back_To_Community
Q9Financial_literacy
Q9Environmentally_branches
Q10
Q11
Q12Financial_Stability
Q12Withdraw_Money
Q12Treated
AQ12Advice_Quality
Q12Personal_Information_Safe
Q12Fees
Q12Interest_Rates_Accounts
Q12Interest_Rates_Loan
Q12Open_Or_Close_Branches
Q13
Q14
Q16
Q17
Q18
Sig. (1-tailed) Q9Borrowings_And_Savings
Q9Transparency
Q9Financial_Statements
Q9Offers
Q9Executive_Remuneration
Q9Financial_Inclusion_SMEbanking
Q9MeetCustomers_Needs
.434 .240 .452
.490 .330 .371
.468 .537 .388
.609 .557 .415
1.000 .455 .520
.455 1.000 .230
.520 .230 1.000
.614 .396 .506
.595 .345 .623
.605 .463 .626
.438 .344 .538
.427 .384 .522
.561 .588 .439
.431 .645 .298
.392 .529 .356
.573 .575 .492
.694 .527 .383
.592 .450 .587
.441 .335 .529
.679 .406 .559
.666 .452 .421
.370 .259 .416
.568 .442 .385
.492 .430 .472
.524 .483 .390
.403 .357 .344
.518 .607 .368
.540 .393 .388
.093 -.028 .185
.412 .525 .364
.222 .141 .253
.000 .000 .000
.000 .000 .000
.000 .011 .000
.000 .001 .000
.000 .000 .000
.000 .000 .000
.000 .000
.000 .014
Correlation Matrixa
Q9Confidentiall
y
Q9Valued_Cust
omer_Recogniti
on
Correlation
Q9Financial_Statements
Q9Offers
Q9Executive_Remuneration
Q9Financial_Inclusion_SMEbanking
Q9MeetCustomers_Needs
Q9Social_Attachment
Q9Confidentially
Q9Valued_Customer_Recognition
Q9Honest_Relationship
Q9Being_Accountable
Q9legal_Obligations
Q9Combating_Bribery
Q9Giving_Back_To_Community
Q9Financial_literacy
Q9Environmentally_branches
Q10
Q11
Q12Financial_Stability
Q12Withdraw_Money
Q12Treated
AQ12Advice_Quality
Q12Personal_Information_Safe
Q12Fees
Q12Interest_Rates_Accounts
Q12Interest_Rates_Loan
Q12Open_Or_Close_Branches
Q13
Q14
Q16
Q17
Q18
Sig. (1-tailed) Q9Borrowings_And_Savings
Q9Transparency
Q9Financial_Statements
Q9Offers
Q9Executive_Remuneration
Q9Financial_Inclusion_SMEbanking
Q9MeetCustomers_Needs
.452 .363 .473
.371 .383 .414
.388 .457 .584
.415 .385 .504
.520 .614 .595
.230 .396 .345
1.000 .506 .623
.506 1.000 .700
.623 .700 1.000
.626 .624 .670
.538 .494 .607
.522 .510 .492
.439 .629 .457
.298 .489 .359
.356 .402 .384
.492 .410 .573
.383 .474 .577
.587 .427 .531
.529 .393 .509
.559 .675 .646
.421 .677 .672
.416 .375 .508
.385 .464 .575
.472 .462 .531
.390 .448 .470
.344 .351 .484
.368 .534 .562
.388 .474 .544
.185 -.056 .042
.364 .350 .452
.253 .185 .225
.000 .000 .000
.000 .000 .000
.000 .000 .000
.000 .000 .000
.000 .000 .000
.000 .000 .000
.000 .000 .000
.014 .000
Correlation Matrixa
Q9Honest_Rela
tionship
Q9Being_Acco
untable
Correlation
Q9Financial_Statements
Q9Offers
Q9Executive_Remuneration
Q9Financial_Inclusion_SMEbanking
Q9MeetCustomers_Needs
Q9Social_Attachment
Q9Confidentially
Q9Valued_Customer_Recognition
Q9Honest_Relationship
Q9Being_Accountable
Q9legal_Obligations
Q9Combating_Bribery
Q9Giving_Back_To_Community
Q9Financial_literacy
Q9Environmentally_branches
Q10
Q11
Q12Financial_Stability
Q12Withdraw_Money
Q12Treated
AQ12Advice_Quality
Q12Personal_Information_Safe
Q12Fees
Q12Interest_Rates_Accounts
Q12Interest_Rates_Loan
Q12Open_Or_Close_Branches
Q13
Q14
Q16
Q17
Q18
Sig. (1-tailed) Q9Borrowings_And_Savings
Q9Transparency
Q9Financial_Statements
Q9Offers
Q9Executive_Remuneration
Q9Financial_Inclusion_SMEbanking
Q9MeetCustomers_Needs
.473 .421 .550
.414 .440 .440
.584 .600 .516
.504 .398 .341
.595 .605 .438
.345 .463 .344
.623 .626 .538
.700 .624 .494
1.000 .670 .607
.670 1.000 .648
.607 .648 1.000
.492 .596 .554
.457 .627 .345
.359 .459 .335
.384 .504 .318
.573 .595 .608
.577 .513 .416
.531 .600 .505
.509 .399 .503
.646 .599 .497
.672 .595 .528
.508 .348 .361
.575 .525 .426
.531 .488 .479
.470 .393 .423
.484 .474 .519
.562 .533 .519
.544 .561 .463
.042 .075 .119
.452 .545 .360
.225 .193 .177
.000 .000 .000
.000 .000 .000
.000 .000 .000
.000 .000 .000
.000 .000 .000
.000 .000 .000
.000 .000 .000
.000 .000
Correlation Matrixa
Q9legal_Obliga
tions
Q9Combating_
Bribery
Correlation
Q9Financial_Statements
Q9Offers
Q9Executive_Remuneration
Q9Financial_Inclusion_SMEbanking
Q9MeetCustomers_Needs
Q9Social_Attachment
Q9Confidentially
Q9Valued_Customer_Recognition
Q9Honest_Relationship
Q9Being_Accountable
Q9legal_Obligations
Q9Combating_Bribery
Q9Giving_Back_To_Community
Q9Financial_literacy
Q9Environmentally_branches
Q10
Q11
Q12Financial_Stability
Q12Withdraw_Money
Q12Treated
AQ12Advice_Quality
Q12Personal_Information_Safe
Q12Fees
Q12Interest_Rates_Accounts
Q12Interest_Rates_Loan
Q12Open_Or_Close_Branches
Q13
Q14
Q16
Q17
Q18
Sig. (1-tailed) Q9Borrowings_And_Savings
Q9Transparency
Q9Financial_Statements
Q9Offers
Q9Executive_Remuneration
Q9Financial_Inclusion_SMEbanking
Q9MeetCustomers_Needs
.550 .376 .215
.440 .290 .333
.516 .471 .474
.341 .319 .382
.438 .427 .561
.344 .384 .588
.538 .522 .439
.494 .510 .629
.607 .492 .457
.648 .596 .627
1.000 .554 .345
.554 1.000 .542
.345 .542 1.000
.335 .332 .590
.318 .379 .594
.608 .398 .411
.416 .321 .438
.505 .385 .492
.503 .464 .411
.497 .472 .493
.528 .421 .487
.361 .395 .318
.426 .329 .445
.479 .409 .396
.423 .352 .435
.519 .275 .352
.519 .423 .528
.463 .442 .526
.119 .073 .074
.360 .409 .421
.177 .208 .241
.000 .000 .000
.000 .000 .000
.000 .000 .020
.000 .002 .001
.000 .000 .000
.000 .001 .000
.000 .000 .000
.000 .000
Correlation Matrixa
Q9Giving_Back
_To_Communit
y
Q9Financial_lit
eracy
Correlation
Q9Financial_Statements
Q9Offers
Q9Executive_Remuneration
Q9Financial_Inclusion_SMEbanking
Q9MeetCustomers_Needs
Q9Social_Attachment
Q9Confidentially
Q9Valued_Customer_Recognition
Q9Honest_Relationship
Q9Being_Accountable
Q9legal_Obligations
Q9Combating_Bribery
Q9Giving_Back_To_Community
Q9Financial_literacy
Q9Environmentally_branches
Q10
Q11
Q12Financial_Stability
Q12Withdraw_Money
Q12Treated
AQ12Advice_Quality
Q12Personal_Information_Safe
Q12Fees
Q12Interest_Rates_Accounts
Q12Interest_Rates_Loan
Q12Open_Or_Close_Branches
Q13
Q14
Q16
Q17
Q18
Sig. (1-tailed) Q9Borrowings_And_Savings
Q9Transparency
Q9Financial_Statements
Q9Offers
Q9Executive_Remuneration
Q9Financial_Inclusion_SMEbanking
Q9MeetCustomers_Needs
.215 .113 .198
.333 .202 .169
.474 .538 .486
.382 .448 .385
.561 .431 .392
.588 .645 .529
.439 .298 .356
.629 .489 .402
.457 .359 .384
.627 .459 .504
.345 .335 .318
.542 .332 .379
1.000 .590 .594
.590 1.000 .441
.594 .441 1.000
.411 .479 .455
.438 .538 .343
.492 .452 .477
.411 .355 .399
.493 .462 .465
.487 .469 .502
.318 .235 .370
.445 .346 .377
.396 .326 .397
.435 .328 .501
.352 .286 .442
.528 .557 .400
.526 .404 .327
.074 -.095 .122
.421 .405 .472
.241 .145 .192
.000 .000 .000
.000 .000 .001
.020 .142 .029
.001 .027 .054
.000 .000 .000
.000 .000 .000
.000 .000 .000
.000 .000
Correlation Matrixa
Q9Environment
ally_branches Q10 Q11
Correlation
Q9Financial_Statements
Q9Offers
Q9Executive_Remuneration
Q9Financial_Inclusion_SMEbanking
Q9MeetCustomers_Needs
Q9Social_Attachment
Q9Confidentially
Q9Valued_Customer_Recognition
Q9Honest_Relationship
Q9Being_Accountable
Q9legal_Obligations
Q9Combating_Bribery
Q9Giving_Back_To_Community
Q9Financial_literacy
Q9Environmentally_branches
Q10
Q11
Q12Financial_Stability
Q12Withdraw_Money
Q12Treated
AQ12Advice_Quality
Q12Personal_Information_Safe
Q12Fees
Q12Interest_Rates_Accounts
Q12Interest_Rates_Loan
Q12Open_Or_Close_Branches
Q13
Q14
Q16
Q17
Q18
Sig. (1-tailed) Q9Borrowings_And_Savings
Q9Transparency
Q9Financial_Statements
Q9Offers
Q9Executive_Remuneration
Q9Financial_Inclusion_SMEbanking
Q9MeetCustomers_Needs
.198 .450 .408 .528
.169 .492 .498 .395
.486 .572 .445 .489
.385 .584 .521 .442
.392 .573 .694 .592
.529 .575 .527 .450
.356 .492 .383 .587
.402 .410 .474 .427
.384 .573 .577 .531
.504 .595 .513 .600
.318 .608 .416 .505
.379 .398 .321 .385
.594 .411 .438 .492
.441 .479 .538 .452
1.000 .455 .343 .477
.455 1.000 .670 .657
.343 .670 1.000 .608
.477 .657 .608 1.000
.399 .530 .486 .546
.465 .647 .705 .567
.502 .561 .623 .498
.370 .380 .371 .549
.377 .664 .721 .625
.397 .591 .542 .561
.501 .623 .543 .546
.442 .587 .488 .494
.400 .701 .604 .548
.327 .531 .424 .492
.122 .105 .082 .178
.472 .458 .430 .471
.192 .255 .140 .299
.000 .000 .000 .000
.001 .000 .000 .000
.029 .000 .000 .000
.054 .000 .000 .000
.000 .000 .000 .000
.000 .000 .000 .000
.000 .000 .000 .000
.000 .000 .000
Correlation Matrixa
Q12Financial_S
tability
Q12Withdraw_
Money
Correlation
Q9Financial_Statements
Q9Offers
Q9Executive_Remuneration
Q9Financial_Inclusion_SMEbanking
Q9MeetCustomers_Needs
Q9Social_Attachment
Q9Confidentially
Q9Valued_Customer_Recognition
Q9Honest_Relationship
Q9Being_Accountable
Q9legal_Obligations
Q9Combating_Bribery
Q9Giving_Back_To_Community
Q9Financial_literacy
Q9Environmentally_branches
Q10
Q11
Q12Financial_Stability
Q12Withdraw_Money
Q12Treated
AQ12Advice_Quality
Q12Personal_Information_Safe
Q12Fees
Q12Interest_Rates_Accounts
Q12Interest_Rates_Loan
Q12Open_Or_Close_Branches
Q13
Q14
Q16
Q17
Q18
Sig. (1-tailed) Q9Borrowings_And_Savings
Q9Transparency
Q9Financial_Statements
Q9Offers
Q9Executive_Remuneration
Q9Financial_Inclusion_SMEbanking
Q9MeetCustomers_Needs
.528 .442 .455
.395 .302 .453
.489 .329 .398
.442 .385 .434
.592 .441 .679
.450 .335 .406
.587 .529 .559
.427 .393 .675
.531 .509 .646
.600 .399 .599
.505 .503 .497
.385 .464 .472
.492 .411 .493
.452 .355 .462
.477 .399 .465
.657 .530 .647
.608 .486 .705
1.000 .546 .567
.546 1.000 .681
.567 .681 1.000
.498 .560 .777
.549 .552 .432
.625 .540 .706
.561 .466 .599
.546 .441 .598
.494 .478 .528
.548 .407 .559
.492 .373 .478
.178 .303 .150
.471 .297 .509
.299 .205 .290
.000 .000 .000
.000 .000 .000
.000 .000 .000
.000 .002 .000
.000 .001 .000
.000 .000 .000
.000 .000 .000
.000 .000
Correlation Matrixa
Q12Treated
AQ12Advice_Q
uality
Correlation
Q9Financial_Statements
Q9Offers
Q9Executive_Remuneration
Q9Financial_Inclusion_SMEbanking
Q9MeetCustomers_Needs
Q9Social_Attachment
Q9Confidentially
Q9Valued_Customer_Recognition
Q9Honest_Relationship
Q9Being_Accountable
Q9legal_Obligations
Q9Combating_Bribery
Q9Giving_Back_To_Community
Q9Financial_literacy
Q9Environmentally_branches
Q10
Q11
Q12Financial_Stability
Q12Withdraw_Money
Q12Treated
AQ12Advice_Quality
Q12Personal_Information_Safe
Q12Fees
Q12Interest_Rates_Accounts
Q12Interest_Rates_Loan
Q12Open_Or_Close_Branches
Q13
Q14
Q16
Q17
Q18
Sig. (1-tailed) Q9Borrowings_And_Savings
Q9Transparency
Q9Financial_Statements
Q9Offers
Q9Executive_Remuneration
Q9Financial_Inclusion_SMEbanking
Q9MeetCustomers_Needs
.455 .461 .455
.453 .427 .260
.398 .451 .431
.434 .529 .293
.679 .666 .370
.406 .452 .259
.559 .421 .416
.675 .677 .375
.646 .672 .508
.599 .595 .348
.497 .528 .361
.472 .421 .395
.493 .487 .318
.462 .469 .235
.465 .502 .370
.647 .561 .380
.705 .623 .371
.567 .498 .549
.681 .560 .552
1.000 .777 .432
.777 1.000 .410
.432 .410 1.000
.706 .598 .491
.599 .518 .428
.598 .506 .450
.528 .487 .365
.559 .523 .301
.478 .514 .334
.150 .118 .108
.509 .534 .248
.290 .264 .171
.000 .000 .000
.000 .000 .000
.000 .000 .000
.000 .000 .006
.000 .000 .000
.000 .000 .002
.000 .000 .000
.000 .000 .006
Correlation Matrixa
Q12Personal_I
nformation_Saf
e Q12Fees
Correlation
Q9Financial_Statements
Q9Offers
Q9Executive_Remuneration
Q9Financial_Inclusion_SMEbanking
Q9MeetCustomers_Needs
Q9Social_Attachment
Q9Confidentially
Q9Valued_Customer_Recognition
Q9Honest_Relationship
Q9Being_Accountable
Q9legal_Obligations
Q9Combating_Bribery
Q9Giving_Back_To_Community
Q9Financial_literacy
Q9Environmentally_branches
Q10
Q11
Q12Financial_Stability
Q12Withdraw_Money
Q12Treated
AQ12Advice_Quality
Q12Personal_Information_Safe
Q12Fees
Q12Interest_Rates_Accounts
Q12Interest_Rates_Loan
Q12Open_Or_Close_Branches
Q13
Q14
Q16
Q17
Q18
Sig. (1-tailed) Q9Borrowings_And_Savings
Q9Transparency
Q9Financial_Statements
Q9Offers
Q9Executive_Remuneration
Q9Financial_Inclusion_SMEbanking
Q9MeetCustomers_Needs
.455 .519 .503
.260 .403 .392
.431 .442 .380
.293 .490 .413
.370 .568 .492
.259 .442 .430
.416 .385 .472
.375 .464 .462
.508 .575 .531
.348 .525 .488
.361 .426 .479
.395 .329 .409
.318 .445 .396
.235 .346 .326
.370 .377 .397
.380 .664 .591
.371 .721 .542
.549 .625 .561
.552 .540 .466
.432 .706 .599
.410 .598 .518
1.000 .491 .428
.491 1.000 .762
.428 .762 1.000
.450 .735 .792
.365 .670 .627
.301 .562 .442
.334 .465 .460
.108 .204 .126
.248 .375 .388
.171 .139 .126
.000 .000 .000
.000 .000 .000
.000 .000 .000
.006 .000 .000
.000 .000 .000
.002 .000 .000
.000 .000 .000
.006 .000 .000
Correlation Matrixa
Q12Interest_Ra
tes_Accounts
Q12Interest_Ra
tes_Loan
Correlation
Q9Financial_Statements
Q9Offers
Q9Executive_Remuneration
Q9Financial_Inclusion_SMEbanking
Q9MeetCustomers_Needs
Q9Social_Attachment
Q9Confidentially
Q9Valued_Customer_Recognition
Q9Honest_Relationship
Q9Being_Accountable
Q9legal_Obligations
Q9Combating_Bribery
Q9Giving_Back_To_Community
Q9Financial_literacy
Q9Environmentally_branches
Q10
Q11
Q12Financial_Stability
Q12Withdraw_Money
Q12Treated
AQ12Advice_Quality
Q12Personal_Information_Safe
Q12Fees
Q12Interest_Rates_Accounts
Q12Interest_Rates_Loan
Q12Open_Or_Close_Branches
Q13
Q14
Q16
Q17
Q18
Sig. (1-tailed) Q9Borrowings_And_Savings
Q9Transparency
Q9Financial_Statements
Q9Offers
Q9Executive_Remuneration
Q9Financial_Inclusion_SMEbanking
Q9MeetCustomers_Needs
.503 .450 .376
.392 .274 .355
.380 .378 .383
.413 .455 .459
.492 .524 .403
.430 .483 .357
.472 .390 .344
.462 .448 .351
.531 .470 .484
.488 .393 .474
.479 .423 .519
.409 .352 .275
.396 .435 .352
.326 .328 .286
.397 .501 .442
.591 .623 .587
.542 .543 .488
.561 .546 .494
.466 .441 .478
.599 .598 .528
.518 .506 .487
.428 .450 .365
.762 .735 .670
1.000 .792 .627
.792 1.000 .631
.627 .631 1.000
.442 .540 .466
.460 .416 .473
.126 .142 .154
.388 .330 .357
.126 .144 .035
.000 .000 .000
.000 .000 .000
.000 .000 .000
.000 .004 .000
.000 .000 .000
.000 .000 .000
.000 .000 .000
.000 .000
Correlation Matrixa
Q12Open_Or_
Close_Branche
s Q13 Q14
Correlation
Q9Financial_Statements
Q9Offers
Q9Executive_Remuneration
Q9Financial_Inclusion_SMEbanking
Q9MeetCustomers_Needs
Q9Social_Attachment
Q9Confidentially
Q9Valued_Customer_Recognition
Q9Honest_Relationship
Q9Being_Accountable
Q9legal_Obligations
Q9Combating_Bribery
Q9Giving_Back_To_Community
Q9Financial_literacy
Q9Environmentally_branches
Q10
Q11
Q12Financial_Stability
Q12Withdraw_Money
Q12Treated
AQ12Advice_Quality
Q12Personal_Information_Safe
Q12Fees
Q12Interest_Rates_Accounts
Q12Interest_Rates_Loan
Q12Open_Or_Close_Branches
Q13
Q14
Q16
Q17
Q18
Sig. (1-tailed) Q9Borrowings_And_Savings
Q9Transparency
Q9Financial_Statements
Q9Offers
Q9Executive_Remuneration
Q9Financial_Inclusion_SMEbanking
Q9MeetCustomers_Needs
.376 .415 .448 .241
.355 .357 .360 -.075
.383 .566 .553 -.217
.459 .598 .444 -.049
.403 .518 .540 .093
.357 .607 .393 -.028
.344 .368 .388 .185
.351 .534 .474 -.056
.484 .562 .544 .042
.474 .533 .561 .075
.519 .519 .463 .119
.275 .423 .442 .073
.352 .528 .526 .074
.286 .557 .404 -.095
.442 .400 .327 .122
.587 .701 .531 .105
.488 .604 .424 .082
.494 .548 .492 .178
.478 .407 .373 .303
.528 .559 .478 .150
.487 .523 .514 .118
.365 .301 .334 .108
.670 .562 .465 .204
.627 .442 .460 .126
.631 .540 .416 .142
1.000 .466 .473 .154
.466 1.000 .639 -.091
.473 .639 1.000 .010
.154 -.091 .010 1.000
.357 .413 .573 .195
.035 .110 .158 .254
.000 .000 .000 .138
.000 .000 .000 .187
.000 .000 .000 .010
.000 .000 .000 .237
.000 .000 .000 .019
.000 .000 .000 .321
.000 .000 .000 .190
.000 .000 .397
Correlation Matrixa
Q16 Q17 Q18
Correlation
Q9Financial_Statements
Q9Offers
Q9Executive_Remuneration
Q9Financial_Inclusion_SMEbanking
Q9MeetCustomers_Needs
Q9Social_Attachment
Q9Confidentially
Q9Valued_Customer_Recognition
Q9Honest_Relationship
Q9Being_Accountable
Q9legal_Obligations
Q9Combating_Bribery
Q9Giving_Back_To_Community
Q9Financial_literacy
Q9Environmentally_branches
Q10
Q11
Q12Financial_Stability
Q12Withdraw_Money
Q12Treated
AQ12Advice_Quality
Q12Personal_Information_Safe
Q12Fees
Q12Interest_Rates_Accounts
Q12Interest_Rates_Loan
Q12Open_Or_Close_Branches
Q13
Q14
Q16
Q17
Q18
Sig. (1-tailed) Q9Borrowings_And_Savings
Q9Transparency
Q9Financial_Statements
Q9Offers
Q9Executive_Remuneration
Q9Financial_Inclusion_SMEbanking
Q9MeetCustomers_Needs
.241 .472 .219
-.075 .368 .174
-.217 .411 .171
-.049 .370 .186
.093 .412 .222
-.028 .525 .141
.185 .364 .253
-.056 .350 .185
.042 .452 .225
.075 .545 .193
.119 .360 .177
.073 .409 .208
.074 .421 .241
-.095 .405 .145
.122 .472 .192
.105 .458 .255
.082 .430 .140
.178 .471 .299
.303 .297 .205
.150 .509 .290
.118 .534 .264
.108 .248 .171
.204 .375 .139
.126 .388 .126
.142 .330 .144
.154 .357 .035
-.091 .413 .110
.010 .573 .158
1.000 .195 .254
.195 1.000 .339
.254 .339 1.000
.138 .000 .009
.187 .000 .005
.010 .000 .018
.237 .000 .048
.019 .000 .051
.321 .000 .038
.190 .000 .017
.397 .000
Correlation Matrixa
Q9Borrowings_
And_Savings
Q9Transparenc
y
Sig. (1-tailed)
Q9Social_Attachment
Q9Confidentially
Q9Valued_Customer_Recognition
Q9Honest_Relationship
Q9Being_Accountable
Q9legal_Obligations
Q9Combating_Bribery
Q9Giving_Back_To_Community
Q9Financial_literacy
Q9Environmentally_branches
Q10
Q11
Q12Financial_Stability
Q12Withdraw_Money
Q12Treated
AQ12Advice_Quality
Q12Personal_Information_Safe
Q12Fees
Q12Interest_Rates_Accounts
Q12Interest_Rates_Loan
Q12Open_Or_Close_Branches
Q13
Q14
Q16
Q17
Q18
.000 .000 .011
.000 .000 .000
.000 .000 .000
.000 .000 .000
.000 .000 .000
.000 .000 .000
.000 .000 .000
.000 .000 .020
.000 .000 .142
.000 .001 .029
.000 .000 .000
.000 .000 .000
.000 .000 .000
.000 .000 .000
.000 .000 .000
.000 .000 .000
.000 .000 .000
.000 .000 .000
.000 .000 .000
.000 .000 .000
.000 .000 .000
.000 .000 .000
.000 .000 .000
.138 .187 .010
.000 .000 .000
.009 .005 .018
Correlation Matrixa
Q9Financial_St
atements Q9Offers
Sig. (1-tailed)
Q9Social_Attachment
Q9Confidentially
Q9Valued_Customer_Recognition
Q9Honest_Relationship
Q9Being_Accountable
Q9legal_Obligations
Q9Combating_Bribery
Q9Giving_Back_To_Community
Q9Financial_literacy
Q9Environmentally_branches
Q10
Q11
Q12Financial_Stability
Q12Withdraw_Money
Q12Treated
AQ12Advice_Quality
Q12Personal_Information_Safe
Q12Fees
Q12Interest_Rates_Accounts
Q12Interest_Rates_Loan
Q12Open_Or_Close_Branches
Q13
Q14
Q16
Q17
Q18
.011 .001 .000
.000 .000 .000
.000 .000 .000
.000 .000 .000
.000 .000 .000
.000 .000 .000
.000 .002 .000
.020 .001 .000
.142 .027 .000
.029 .054 .000
.000 .000 .000
.000 .000 .000
.000 .000 .000
.000 .002 .001
.000 .000 .000
.000 .000 .000
.000 .006 .000
.000 .000 .000
.000 .000 .000
.000 .004 .000
.000 .000 .000
.000 .000 .000
.000 .000 .000
.010 .237 .019
.000 .000 .000
.018 .048 .051
Correlation Matrixa
Q9Executive_R
emuneration
Q9Financial_In
clusion_SMEba
nking
Sig. (1-tailed)
Q9Social_Attachment
Q9Confidentially
Q9Valued_Customer_Recognition
Q9Honest_Relationship
Q9Being_Accountable
Q9legal_Obligations
Q9Combating_Bribery
Q9Giving_Back_To_Community
Q9Financial_literacy
Q9Environmentally_branches
Q10
Q11
Q12Financial_Stability
Q12Withdraw_Money
Q12Treated
AQ12Advice_Quality
Q12Personal_Information_Safe
Q12Fees
Q12Interest_Rates_Accounts
Q12Interest_Rates_Loan
Q12Open_Or_Close_Branches
Q13
Q14
Q16
Q17
Q18
.000 .000 .000
.000 .000 .000
.000 .000 .000
.000 .000 .000
.000 .000 .000
.000 .000 .000
.000 .001 .000
.000 .000 .000
.000 .000 .000
.000 .000 .000
.000 .000 .000
.000 .000 .000
.000 .000 .000
.001 .000 .000
.000 .000 .000
.000 .000 .000
.000 .002 .000
.000 .000 .000
.000 .000 .000
.000 .000 .000
.000 .000 .000
.000 .000 .000
.000 .000 .000
.019 .321 .190
.000 .000 .000
.051 .038 .017
Correlation Matrixa
Q9MeetCustom
ers_Needs
Q9Social_Attac
hment
Sig. (1-tailed)
Q9Social_Attachment
Q9Confidentially
Q9Valued_Customer_Recognition
Q9Honest_Relationship
Q9Being_Accountable
Q9legal_Obligations
Q9Combating_Bribery
Q9Giving_Back_To_Community
Q9Financial_literacy
Q9Environmentally_branches
Q10
Q11
Q12Financial_Stability
Q12Withdraw_Money
Q12Treated
AQ12Advice_Quality
Q12Personal_Information_Safe
Q12Fees
Q12Interest_Rates_Accounts
Q12Interest_Rates_Loan
Q12Open_Or_Close_Branches
Q13
Q14
Q16
Q17
Q18
.000 .014
.000 .014
.000 .000 .000
.000 .000 .000
.000 .000 .000
.000 .000 .000
.000 .000 .000
.000 .000 .000
.000 .000 .002
.000 .000 .000
.000 .000 .000
.000 .000 .000
.000 .000 .000
.000 .001 .000
.000 .000 .000
.000 .000 .000
.000 .006 .000
.000 .000 .000
.000 .000 .000
.000 .000 .000
.000 .000 .000
.000 .000 .000
.000 .000 .000
.190 .397 .039
.000 .000 .000
.017 .090 .007
Correlation Matrixa
Q9Confidentiall
y
Q9Valued_Cust
omer_Recogniti
on
Sig. (1-tailed)
Q9Social_Attachment
Q9Confidentially
Q9Valued_Customer_Recognition
Q9Honest_Relationship
Q9Being_Accountable
Q9legal_Obligations
Q9Combating_Bribery
Q9Giving_Back_To_Community
Q9Financial_literacy
Q9Environmentally_branches
Q10
Q11
Q12Financial_Stability
Q12Withdraw_Money
Q12Treated
AQ12Advice_Quality
Q12Personal_Information_Safe
Q12Fees
Q12Interest_Rates_Accounts
Q12Interest_Rates_Loan
Q12Open_Or_Close_Branches
Q13
Q14
Q16
Q17
Q18
.014 .000 .000
.000 .000
.000 .000
.000 .000
.000 .000 .000
.000 .000 .000
.000 .000 .000
.000 .000 .000
.002 .000 .000
.000 .000 .000
.000 .000 .000
.000 .000 .000
.000 .000 .000
.000 .000 .000
.000 .000 .000
.000 .000 .000
.000 .000 .000
.000 .000 .000
.000 .000 .000
.000 .000 .000
.000 .000 .000
.000 .000 .000
.000 .000 .000
.039 .297 .345
.000 .000 .000
.007 .038 .015
Correlation Matrixa
Q9Honest_Rela
tionship
Q9Being_Acco
untable
Sig. (1-tailed)
Q9Social_Attachment
Q9Confidentially
Q9Valued_Customer_Recognition
Q9Honest_Relationship
Q9Being_Accountable
Q9legal_Obligations
Q9Combating_Bribery
Q9Giving_Back_To_Community
Q9Financial_literacy
Q9Environmentally_branches
Q10
Q11
Q12Financial_Stability
Q12Withdraw_Money
Q12Treated
AQ12Advice_Quality
Q12Personal_Information_Safe
Q12Fees
Q12Interest_Rates_Accounts
Q12Interest_Rates_Loan
Q12Open_Or_Close_Branches
Q13
Q14
Q16
Q17
Q18
.000 .000 .000
.000 .000 .000
.000 .000 .000
.000 .000
.000 .000
.000 .000
.000 .000 .000
.000 .000 .000
.000 .000 .001
.000 .000 .001
.000 .000 .000
.000 .000 .000
.000 .000 .000
.000 .000 .000
.000 .000 .000
.000 .000 .000
.000 .000 .000
.000 .000 .000
.000 .000 .000
.000 .000 .000
.000 .000 .000
.000 .000 .000
.000 .000 .000
.345 .239 .128
.000 .000 .000
.015 .033 .046
Correlation Matrixa
Q9legal_Obliga
tions
Q9Combating_
Bribery
Sig. (1-tailed)
Q9Social_Attachment
Q9Confidentially
Q9Valued_Customer_Recognition
Q9Honest_Relationship
Q9Being_Accountable
Q9legal_Obligations
Q9Combating_Bribery
Q9Giving_Back_To_Community
Q9Financial_literacy
Q9Environmentally_branches
Q10
Q11
Q12Financial_Stability
Q12Withdraw_Money
Q12Treated
AQ12Advice_Quality
Q12Personal_Information_Safe
Q12Fees
Q12Interest_Rates_Accounts
Q12Interest_Rates_Loan
Q12Open_Or_Close_Branches
Q13
Q14
Q16
Q17
Q18
.000 .000 .000
.000 .000 .000
.000 .000 .000
.000 .000 .000
.000 .000 .000
.000 .000
.000 .000
.000 .000
.001 .001 .000
.001 .000 .000
.000 .000 .000
.000 .001 .000
.000 .000 .000
.000 .000 .000
.000 .000 .000
.000 .000 .000
.000 .000 .001
.000 .001 .000
.000 .000 .000
.000 .000 .000
.000 .004 .000
.000 .000 .000
.000 .000 .000
.128 .246 .242
.000 .000 .000
.046 .023 .010
Correlation Matrixa
Q9Giving_Back
_To_Communit
y
Q9Financial_lit
eracy
Sig. (1-tailed)
Q9Social_Attachment
Q9Confidentially
Q9Valued_Customer_Recognition
Q9Honest_Relationship
Q9Being_Accountable
Q9legal_Obligations
Q9Combating_Bribery
Q9Giving_Back_To_Community
Q9Financial_literacy
Q9Environmentally_branches
Q10
Q11
Q12Financial_Stability
Q12Withdraw_Money
Q12Treated
AQ12Advice_Quality
Q12Personal_Information_Safe
Q12Fees
Q12Interest_Rates_Accounts
Q12Interest_Rates_Loan
Q12Open_Or_Close_Branches
Q13
Q14
Q16
Q17
Q18
.000 .000 .000
.000 .002 .000
.000 .000 .000
.000 .000 .000
.000 .000 .000
.000 .001 .001
.000 .001 .000
.000 .000
.000 .000
.000 .000
.000 .000 .000
.000 .000 .000
.000 .000 .000
.000 .000 .000
.000 .000 .000
.000 .000 .000
.001 .012 .000
.000 .000 .000
.000 .001 .000
.000 .001 .000
.000 .003 .000
.000 .000 .000
.000 .000 .001
.242 .183 .123
.000 .000 .000
.010 .084 .033
Correlation Matrixa
Q9Environment
ally_branches Q10 Q11
Sig. (1-tailed)
Q9Social_Attachment
Q9Confidentially
Q9Valued_Customer_Recognition
Q9Honest_Relationship
Q9Being_Accountable
Q9legal_Obligations
Q9Combating_Bribery
Q9Giving_Back_To_Community
Q9Financial_literacy
Q9Environmentally_branches
Q10
Q11
Q12Financial_Stability
Q12Withdraw_Money
Q12Treated
AQ12Advice_Quality
Q12Personal_Information_Safe
Q12Fees
Q12Interest_Rates_Accounts
Q12Interest_Rates_Loan
Q12Open_Or_Close_Branches
Q13
Q14
Q16
Q17
Q18
.000 .000 .000 .000
.000 .000 .000 .000
.000 .000 .000 .000
.000 .000 .000 .000
.000 .000 .000 .000
.001 .000 .000 .000
.000 .000 .001 .000
.000 .000 .000 .000
.000 .000 .000 .000
.000 .000 .000
.000 .000 .000
.000 .000 .000
.000 .000 .000
.000 .000 .000 .000
.000 .000 .000 .000
.000 .000 .000 .000
.000 .000 .000 .000
.000 .000 .000 .000
.000 .000 .000 .000
.000 .000 .000 .000
.000 .000 .000 .000
.000 .000 .000 .000
.001 .000 .000 .000
.123 .160 .219 .045
.000 .000 .000 .000
.033 .007 .092 .002
Correlation Matrixa
Q12Financial_S
tability
Q12Withdraw_
Money
Sig. (1-tailed)
Q9Social_Attachment
Q9Confidentially
Q9Valued_Customer_Recognition
Q9Honest_Relationship
Q9Being_Accountable
Q9legal_Obligations
Q9Combating_Bribery
Q9Giving_Back_To_Community
Q9Financial_literacy
Q9Environmentally_branches
Q10
Q11
Q12Financial_Stability
Q12Withdraw_Money
Q12Treated
AQ12Advice_Quality
Q12Personal_Information_Safe
Q12Fees
Q12Interest_Rates_Accounts
Q12Interest_Rates_Loan
Q12Open_Or_Close_Branches
Q13
Q14
Q16
Q17
Q18
.000 .001 .000
.000 .000 .000
.000 .000 .000
.000 .000 .000
.000 .000 .000
.000 .000 .000
.000 .000 .000
.000 .000 .000
.000 .000 .000
.000 .000 .000
.000 .000 .000
.000 .000 .000
.000 .000
.000 .000
.000 .000
.000 .000 .000
.000 .000 .000
.000 .000 .000
.000 .000 .000
.000 .000 .000
.000 .000 .000
.000 .000 .000
.000 .000 .000
.045 .002 .077
.000 .002 .000
.002 .025 .002
Correlation Matrixa
Q12Treated
AQ12Advice_Q
uality
Sig. (1-tailed)
Q9Social_Attachment
Q9Confidentially
Q9Valued_Customer_Recognition
Q9Honest_Relationship
Q9Being_Accountable
Q9legal_Obligations
Q9Combating_Bribery
Q9Giving_Back_To_Community
Q9Financial_literacy
Q9Environmentally_branches
Q10
Q11
Q12Financial_Stability
Q12Withdraw_Money
Q12Treated
AQ12Advice_Quality
Q12Personal_Information_Safe
Q12Fees
Q12Interest_Rates_Accounts
Q12Interest_Rates_Loan
Q12Open_Or_Close_Branches
Q13
Q14
Q16
Q17
Q18
.000 .000 .006
.000 .000 .000
.000 .000 .000
.000 .000 .000
.000 .000 .000
.000 .000 .000
.000 .000 .000
.000 .000 .001
.000 .000 .012
.000 .000 .000
.000 .000 .000
.000 .000 .000
.000 .000 .000
.000 .000 .000
.000 .000
.000 .000
.000 .000
.000 .000 .000
.000 .000 .000
.000 .000 .000
.000 .000 .000
.000 .000 .002
.000 .000 .001
.077 .131 .152
.000 .000 .009
.002 .005 .051
Correlation Matrixa
Q12Personal_I
nformation_Saf
e Q12Fees
Sig. (1-tailed)
Q9Social_Attachment
Q9Confidentially
Q9Valued_Customer_Recognition
Q9Honest_Relationship
Q9Being_Accountable
Q9legal_Obligations
Q9Combating_Bribery
Q9Giving_Back_To_Community
Q9Financial_literacy
Q9Environmentally_branches
Q10
Q11
Q12Financial_Stability
Q12Withdraw_Money
Q12Treated
AQ12Advice_Quality
Q12Personal_Information_Safe
Q12Fees
Q12Interest_Rates_Accounts
Q12Interest_Rates_Loan
Q12Open_Or_Close_Branches
Q13
Q14
Q16
Q17
Q18
.006 .000 .000
.000 .000 .000
.000 .000 .000
.000 .000 .000
.000 .000 .000
.000 .000 .000
.000 .001 .000
.001 .000 .000
.012 .000 .001
.000 .000 .000
.000 .000 .000
.000 .000 .000
.000 .000 .000
.000 .000 .000
.000 .000 .000
.000 .000 .000
.000 .000
.000 .000
.000 .000
.000 .000 .000
.000 .000 .000
.002 .000 .000
.001 .000 .000
.152 .026 .117
.009 .000 .000
.051 .093 .115
Correlation Matrixa
Q12Interest_Ra
tes_Accounts
Q12Interest_Ra
tes_Loan
Sig. (1-tailed)
Q9Social_Attachment
Q9Confidentially
Q9Valued_Customer_Recognition
Q9Honest_Relationship
Q9Being_Accountable
Q9legal_Obligations
Q9Combating_Bribery
Q9Giving_Back_To_Community
Q9Financial_literacy
Q9Environmentally_branches
Q10
Q11
Q12Financial_Stability
Q12Withdraw_Money
Q12Treated
AQ12Advice_Quality
Q12Personal_Information_Safe
Q12Fees
Q12Interest_Rates_Accounts
Q12Interest_Rates_Loan
Q12Open_Or_Close_Branches
Q13
Q14
Q16
Q17
Q18
.000 .000 .000
.000 .000 .000
.000 .000 .000
.000 .000 .000
.000 .000 .000
.000 .000 .000
.000 .000 .004
.000 .000 .000
.001 .001 .003
.000 .000 .000
.000 .000 .000
.000 .000 .000
.000 .000 .000
.000 .000 .000
.000 .000 .000
.000 .000 .000
.000 .000 .000
.000 .000 .000
.000 .000
.000 .000
.000 .000
.000 .000 .000
.000 .000 .000
.117 .088 .072
.000 .001 .000
.115 .086 .370
Correlation Matrixa
Q12Open_Or_
Close_Branche
s Q13 Q14
Sig. (1-tailed)
Q9Social_Attachment
Q9Confidentially
Q9Valued_Customer_Recognition
Q9Honest_Relationship
Q9Being_Accountable
Q9legal_Obligations
Q9Combating_Bribery
Q9Giving_Back_To_Community
Q9Financial_literacy
Q9Environmentally_branches
Q10
Q11
Q12Financial_Stability
Q12Withdraw_Money
Q12Treated
AQ12Advice_Quality
Q12Personal_Information_Safe
Q12Fees
Q12Interest_Rates_Accounts
Q12Interest_Rates_Loan
Q12Open_Or_Close_Branches
Q13
Q14
Q16
Q17
Q18
.000 .000 .000 .397
.000 .000 .000 .039
.000 .000 .000 .297
.000 .000 .000 .345
.000 .000 .000 .239
.000 .000 .000 .128
.004 .000 .000 .246
.000 .000 .000 .242
.003 .000 .000 .183
.000 .000 .001 .123
.000 .000 .000 .160
.000 .000 .000 .219
.000 .000 .000 .045
.000 .000 .000 .002
.000 .000 .000 .077
.000 .000 .000 .131
.000 .002 .001 .152
.000 .000 .000 .026
.000 .000 .000 .117
.000 .000 .000 .088
.000 .000 .072
.000 .000 .195
.000 .000 .462
.072 .195 .462
.000 .000 .000 .031
.370 .147 .066 .007
Correlation Matrixa
Q16 Q17 Q18
Sig. (1-tailed)
Q9Social_Attachment
Q9Confidentially
Q9Valued_Customer_Recognition
Q9Honest_Relationship
Q9Being_Accountable
Q9legal_Obligations
Q9Combating_Bribery
Q9Giving_Back_To_Community
Q9Financial_literacy
Q9Environmentally_branches
Q10
Q11
Q12Financial_Stability
Q12Withdraw_Money
Q12Treated
AQ12Advice_Quality
Q12Personal_Information_Safe
Q12Fees
Q12Interest_Rates_Accounts
Q12Interest_Rates_Loan
Q12Open_Or_Close_Branches
Q13
Q14
Q16
Q17
Q18
.397 .000 .090
.039 .000 .007
.297 .000 .038
.345 .000 .015
.239 .000 .033
.128 .000 .046
.246 .000 .023
.242 .000 .010
.183 .000 .084
.123 .000 .033
.160 .000 .007
.219 .000 .092
.045 .000 .002
.002 .002 .025
.077 .000 .002
.131 .000 .005
.152 .009 .051
.026 .000 .093
.117 .000 .115
.088 .001 .086
.072 .000 .370
.195 .000 .147
.462 .000 .066
.031 .007
.031 .000
.007 .000
Determinant = 1.62E-013a.
KMO and Bartlett's Test
Kaiser-Meyer-Olkin Measure of Sampling Adequacy.
Bartlett's Test of Sphericity Approx. Chi-Square
df
Sig.
.896
2331.783
528
.000
Communalities
Initial Extraction
Q9Borrowings_And_Savings
Q9Transparency
Q9Financial_Statements
Q9Offers
Q9Executive_Remuneration
Q9Financial_Inclusion_SMEbanking
Q9MeetCustomers_Needs
Q9Social_Attachment
Q9Confidentially
Q9Valued_Customer_Recognition
Q9Honest_Relationship
Q9Being_Accountable
Q9legal_Obligations
Q9Combating_Bribery
Q9Giving_Back_To_Community
Q9Financial_literacy
Q9Environmentally_branches
Q10
Q11
Q12Financial_Stability
Q12Withdraw_Money
Q12Treated
AQ12Advice_Quality
Q12Personal_Information_Safe
Q12Fees
Q12Interest_Rates_Accounts
Q12Interest_Rates_Loan
Q12Open_Or_Close_Branches
Q13
Q14
Q16
Q17
Q18
1.000 .695
1.000 .681
1.000 .693
1.000 .598
1.000 .704
1.000 .541
1.000 .701
1.000 .774
1.000 .653
1.000 .776
1.000 .742
1.000 .727
1.000 .690
1.000 .641
1.000 .705
1.000 .693
1.000 .701
1.000 .739
1.000 .762
1.000 .631
1.000 .634
1.000 .843
1.000 .728
1.000 .533
1.000 .848
1.000 .723
1.000 .755
1.000 .661
1.000 .690
1.000 .554
1.000 .717
1.000 .672
1.000 .583
Extraction Method: Principal Component Analysis.
Total Variance Explained
Component
Initial Eigenvalues Extraction Sums of Squared Loadings
Total % of Variance Cumulative % Total % of Variance Cumulative %
1
2
3
4
5
6
7
8
9
10
11
12
13
14
15
16
17
18
19
20
21
22
23
24
25
26
27
28
29
30
31
32
33
15.465 46.863 46.863 15.465 46.863 46.863
2.022 6.127 52.990 2.022 6.127 52.990
1.610 4.877 57.867 1.610 4.877 57.867
1.371 4.154 62.021 1.371 4.154 62.021
1.194 3.618 65.640 1.194 3.618 65.640
1.124 3.407 69.047 1.124 3.407 69.047
.911 2.759 71.806
.792 2.400 74.206
.774 2.346 76.552
.708 2.145 78.697
.683 2.070 80.767
.665 2.016 82.783
.629 1.905 84.689
.539 1.634 86.322
.531 1.610 87.932
.485 1.471 89.403
.441 1.336 90.739
.436 1.322 92.061
.338 1.024 93.085
.317 .962 94.047
.297 .899 94.946
.234 .708 95.655
.223 .677 96.331
.198 .599 96.931
.170 .516 97.447
.158 .478 97.925
.144 .436 98.360
.125 .378 98.738
.110 .333 99.071
.088 .267 99.338
.084 .253 99.591
.073 .222 99.814
.061 .186 100.000
Extraction Method: Principal Component Analysis.
Component Number
333231302928272625242322212019181716151413121110987654321
Eigenvalue
20
15
10
5
0
Scree Plot
Appendix F - Research Objective one - Factor Analysis-before
components extraction
Correlation Matrixa
Q9Borrowings_
And_Savings
Q9Transparenc
y
Q9Financial_St
atements Q9Offers
Correlation Q9Borrowings_And_Saving
s
Q9Transparency
Q9Financial_Statements
Q9Offers
Q9Executive_Remuneratio
n
Q9Financial_Inclusion_SM
Ebanking
Q9MeetCustomers_Needs
Q9Social_Attachment
Q9Confidentially
Q9Valued_Customer_Reco
gnition
Q9Honest_Relationship
Q9Being_Accountable
Q9legal_Obligations
Q9Combating_Bribery
Q9Giving_Back_To_Comm
unity
Q9Financial_literacy
Q9Environmentally_branch
es
1.000 .559 .533 .495 .407
.559 1.000 .553 .518 .467
.533 .553 1.000 .428 .215
.495 .518 .428 1.000 .291
.407 .467 .215 .291 1.000
.512 .478 .365 .328 .566
.503 .503 .434 .490 .468
.579 .502 .240 .330 .537
.520 .390 .452 .371 .388
.413 .484 .363 .383 .457
.559 .605 .473 .414 .584
.570 .580 .421 .440 .600
.563 .489 .550 .440 .516
.446 .374 .376 .290 .471
.457 .455 .215 .333 .474
.410 .341 .113 .202 .538
.514 .329 .198 .169 .486
.633 .660 .450 .492 .572
Correlation Matrixa
Q9Executive_R
emuneration
Q9Financial_In
clusion_SMEba
nking
Q9MeetCustom
ers_Needs
Correlation Q9Borrowings_And_Saving
s
Q9Transparency
Q9Financial_Statements
Q9Offers
Q9Executive_Remuneratio
n
Q9Financial_Inclusion_SM
Ebanking
Q9MeetCustomers_Needs
Q9Social_Attachment
Q9Confidentially
Q9Valued_Customer_Reco
gnition
Q9Honest_Relationship
Q9Being_Accountable
Q9legal_Obligations
Q9Combating_Bribery
Q9Giving_Back_To_Comm
unity
Q9Financial_literacy
Q9Environmentally_branch
es
.407 .512 .503 .579
.467 .478 .503 .502
.215 .365 .434 .240
.291 .328 .490 .330
1.000 .566 .468 .537
.566 1.000 .609 .557
.468 .609 1.000 .455
.537 .557 .455 1.000
.388 .415 .520 .230
.457 .385 .614 .396
.584 .504 .595 .345
.600 .398 .605 .463
.516 .341 .438 .344
.471 .319 .427 .384
.474 .382 .561 .588
.538 .448 .431 .645
.486 .385 .392 .529
.572 .584 .573 .575
Correlation Matrixa
Q9Social_Attac
hment
Q9Confidentiall
y
Q9Valued_Cust
omer_Recogniti
on
Correlation Q9Borrowings_And_Saving
s
Q9Transparency
Q9Financial_Statements
Q9Offers
Q9Executive_Remuneratio
n
Q9Financial_Inclusion_SM
Ebanking
Q9MeetCustomers_Needs
Q9Social_Attachment
Q9Confidentially
Q9Valued_Customer_Reco
gnition
Q9Honest_Relationship
Q9Being_Accountable
Q9legal_Obligations
Q9Combating_Bribery
Q9Giving_Back_To_Comm
unity
Q9Financial_literacy
Q9Environmentally_branch
es
.579 .520 .413 .559
.502 .390 .484 .605
.240 .452 .363 .473
.330 .371 .383 .414
.537 .388 .457 .584
.557 .415 .385 .504
.455 .520 .614 .595
1.000 .230 .396 .345
.230 1.000 .506 .623
.396 .506 1.000 .700
.345 .623 .700 1.000
.463 .626 .624 .670
.344 .538 .494 .607
.384 .522 .510 .492
.588 .439 .629 .457
.645 .298 .489 .359
.529 .356 .402 .384
.575 .492 .410 .573
Correlation Matrixa
Q9Honest_Rela
tionship
Q9Being_Acco
untable
Q9legal_Obliga
tions
Correlation Q9Borrowings_And_Saving
s
Q9Transparency
Q9Financial_Statements
Q9Offers
Q9Executive_Remuneratio
n
Q9Financial_Inclusion_SM
Ebanking
Q9MeetCustomers_Needs
Q9Social_Attachment
Q9Confidentially
Q9Valued_Customer_Reco
gnition
Q9Honest_Relationship
Q9Being_Accountable
Q9legal_Obligations
Q9Combating_Bribery
Q9Giving_Back_To_Comm
unity
Q9Financial_literacy
Q9Environmentally_branch
es
.559 .570 .563 .446
.605 .580 .489 .374
.473 .421 .550 .376
.414 .440 .440 .290
.584 .600 .516 .471
.504 .398 .341 .319
.595 .605 .438 .427
.345 .463 .344 .384
.623 .626 .538 .522
.700 .624 .494 .510
1.000 .670 .607 .492
.670 1.000 .648 .596
.607 .648 1.000 .554
.492 .596 .554 1.000
.457 .627 .345 .542
.359 .459 .335 .332
.384 .504 .318 .379
.573 .595 .608 .398
Correlation Matrixa
Q9Combating_
Bribery
Q9Giving_Back
_To_Communit
y
Q9Financial_lit
eracy
Correlation Q9Borrowings_And_Saving
s
Q9Transparency
Q9Financial_Statements
Q9Offers
Q9Executive_Remuneratio
n
Q9Financial_Inclusion_SM
Ebanking
Q9MeetCustomers_Needs
Q9Social_Attachment
Q9Confidentially
Q9Valued_Customer_Reco
gnition
Q9Honest_Relationship
Q9Being_Accountable
Q9legal_Obligations
Q9Combating_Bribery
Q9Giving_Back_To_Comm
unity
Q9Financial_literacy
Q9Environmentally_branch
es
.446 .457 .410 .514
.374 .455 .341 .329
.376 .215 .113 .198
.290 .333 .202 .169
.471 .474 .538 .486
.319 .382 .448 .385
.427 .561 .431 .392
.384 .588 .645 .529
.522 .439 .298 .356
.510 .629 .489 .402
.492 .457 .359 .384
.596 .627 .459 .504
.554 .345 .335 .318
1.000 .542 .332 .379
.542 1.000 .590 .594
.332 .590 1.000 .441
.379 .594 .441 1.000
.398 .411 .479 .455
Correlation Matrixa
Q9Environment
ally_branches
I think that my
bank's actual
social activities
and ethical
behaviour
comply with
what they
committed to in
the media and
other channels
since the
Financial Crisis
of 2007
I feel that I am
getting an
economic value
in my dealings
with my bank
(Good quality
products that
efficiently
satisfy my
needs and
requirements)
Correlation Q9Borrowings_And_Saving
s
Q9Transparency
Q9Financial_Statements
Q9Offers
Q9Executive_Remuneratio
n
Q9Financial_Inclusion_SM
Ebanking
Q9MeetCustomers_Needs
Q9Social_Attachment
Q9Confidentially
Q9Valued_Customer_Reco
gnition
Q9Honest_Relationship
Q9Being_Accountable
Q9legal_Obligations
Q9Combating_Bribery
Q9Giving_Back_To_Comm
unity
Q9Financial_literacy
Q9Environmentally_branch
es
.514 .633 .492 .592
.329 .660 .578 .539
.198 .450 .408 .528
.169 .492 .498 .395
.486 .572 .445 .489
.385 .584 .521 .442
.392 .573 .694 .592
.529 .575 .527 .450
.356 .492 .383 .587
.402 .410 .474 .427
.384 .573 .577 .531
.504 .595 .513 .600
.318 .608 .416 .505
.379 .398 .321 .385
.594 .411 .438 .492
.441 .479 .538 .452
1.000 .455 .343 .477
.455 1.000 .670 .657
Correlation Matrixa
Q12Financial_S
tability
Q12Withdraw_
Money Q12Treated
Correlation Q9Borrowings_And_Saving
s
Q9Transparency
Q9Financial_Statements
Q9Offers
Q9Executive_Remuneratio
n
Q9Financial_Inclusion_SM
Ebanking
Q9MeetCustomers_Needs
Q9Social_Attachment
Q9Confidentially
Q9Valued_Customer_Reco
gnition
Q9Honest_Relationship
Q9Being_Accountable
Q9legal_Obligations
Q9Combating_Bribery
Q9Giving_Back_To_Comm
unity
Q9Financial_literacy
Q9Environmentally_branch
es
.592 .448 .474 .510
.539 .433 .616 .578
.528 .442 .455 .461
.395 .302 .453 .427
.489 .329 .398 .451
.442 .385 .434 .529
.592 .441 .679 .666
.450 .335 .406 .452
.587 .529 .559 .421
.427 .393 .675 .677
.531 .509 .646 .672
.600 .399 .599 .595
.505 .503 .497 .528
.385 .464 .472 .421
.492 .411 .493 .487
.452 .355 .462 .469
.477 .399 .465 .502
.657 .530 .647 .561
Correlation Matrixa
AQ12Advice_Q
uality
Q12Personal_I
nformation_Saf
e Q12Fees
Q12Interest_Ra
tes_Accounts
Correlation Q9Borrowings_And_Saving
s
Q9Transparency
Q9Financial_Statements
Q9Offers
Q9Executive_Remuneratio
n
Q9Financial_Inclusion_SM
Ebanking
Q9MeetCustomers_Needs
Q9Social_Attachment
Q9Confidentially
Q9Valued_Customer_Reco
gnition
Q9Honest_Relationship
Q9Being_Accountable
Q9legal_Obligations
Q9Combating_Bribery
Q9Giving_Back_To_Comm
unity
Q9Financial_literacy
Q9Environmentally_branch
es
.510 .423 .523 .667 .513
.578 .338 .761 .583 .529
.461 .455 .519 .503 .450
.427 .260 .403 .392 .274
.451 .431 .442 .380 .378
.529 .293 .490 .413 .455
.666 .370 .568 .492 .524
.452 .259 .442 .430 .483
.421 .416 .385 .472 .390
.677 .375 .464 .462 .448
.672 .508 .575 .531 .470
.595 .348 .525 .488 .393
.528 .361 .426 .479 .423
.421 .395 .329 .409 .352
.487 .318 .445 .396 .435
.469 .235 .346 .326 .328
.502 .370 .377 .397 .501
.561 .380 .664 .591 .623
Correlation Matrixa
Q12Interest_Ra
tes_Loan
Q12Open_Or_
Close_Branche
s
I think the
overall
approach of my
bank's social
responsibility
activities is
aligned with
customers’
needs and
demands in the
post financial
crisis of 2007
Correlation Q9Borrowings_And_Saving
s
Q9Transparency
Q9Financial_Statements
Q9Offers
Q9Executive_Remuneratio
n
Q9Financial_Inclusion_SM
Ebanking
Q9MeetCustomers_Needs
Q9Social_Attachment
Q9Confidentially
Q9Valued_Customer_Reco
gnition
Q9Honest_Relationship
Q9Being_Accountable
Q9legal_Obligations
Q9Combating_Bribery
Q9Giving_Back_To_Comm
unity
Q9Financial_literacy
Q9Environmentally_branch
es
.513 .549 .482 .490
.529 .480 .595 .458
.450 .376 .415 .448
.274 .355 .357 .360
.378 .383 .566 .553
.455 .459 .598 .444
.524 .403 .518 .540
.483 .357 .607 .393
.390 .344 .368 .388
.448 .351 .534 .474
.470 .484 .562 .544
.393 .474 .533 .561
.423 .519 .519 .463
.352 .275 .423 .442
.435 .352 .528 .526
.328 .286 .557 .404
.501 .442 .400 .327
.623 .587 .701 .531
Correlation Matrixa
Overall, I think
that no ethical
problems have
occurred at my
bank in the
years following
the Financial
Crisis of 2007
I think that
banks in
general are
likely to have
learned the
lesson in terms
of navigating a
balance
between the
pursuit of profit
and operating
in a socially
responsible
manner
Has your
confidence
towards the
banking
industry
changed in the
past seven
years?
Correlation Q9Borrowings_And_Saving
s
Q9Transparency
Q9Financial_Statements
Q9Offers
Q9Executive_Remuneratio
n
Q9Financial_Inclusion_SM
Ebanking
Q9MeetCustomers_Needs
Q9Social_Attachment
Q9Confidentially
Q9Valued_Customer_Reco
gnition
Q9Honest_Relationship
Q9Being_Accountable
Q9legal_Obligations
Q9Combating_Bribery
Q9Giving_Back_To_Comm
unity
Q9Financial_literacy
Q9Environmentally_branch
es
.490 .492 .245
.458 .448 .266
.448 .472 .219
.360 .368 .174
.553 .411 .171
.444 .370 .186
.540 .412 .222
.393 .525 .141
.388 .364 .253
.474 .350 .185
.544 .452 .225
.561 .545 .193
.463 .360 .177
.442 .409 .208
.526 .421 .241
.404 .405 .145
.327 .472 .192
.531 .458 .255
Correlation Matrixa
Q9Borrowings_
And_Savings
Q9Transparenc
y
Q9Financial_St
atements Q9Offers
I think that my bank's actual
social activities and ethical
behaviour comply with what
they committed to in the
media and other channels
since the Financial Crisis of
2007
I feel that I am getting an
economic value in my
dealings with my bank
(Good quality products that
efficiently satisfy my needs
and requirements)
Q12Financial_Stability
Q12Withdraw_Money
Q12Treated
AQ12Advice_Quality
Q12Personal_Information_
Safe
Q12Fees
Q12Interest_Rates_Accoun
ts
Q12Interest_Rates_Loan
Q12Open_Or_Close_Branc
hes
I think the overall approach
of my bank's social
responsibility activities is
aligned with customers’
needs and demands in the
post financial crisis of 2007
.633 .660 .450 .492 .572
.492 .578 .408 .498 .445
.592 .539 .528 .395 .489
.448 .433 .442 .302 .329
.474 .616 .455 .453 .398
.510 .578 .461 .427 .451
.423 .338 .455 .260 .431
.523 .761 .519 .403 .442
.667 .583 .503 .392 .380
.513 .529 .450 .274 .378
.549 .480 .376 .355 .383
.482 .595 .415 .357 .566
.490 .458 .448 .360 .553
Correlation Matrixa
Q9Executive_R
emuneration
Q9Financial_In
clusion_SMEba
nking
Q9MeetCustom
ers_Needs
I think that my bank's actual
social activities and ethical
behaviour comply with what
they committed to in the
media and other channels
since the Financial Crisis of
2007
I feel that I am getting an
economic value in my
dealings with my bank
(Good quality products that
efficiently satisfy my needs
and requirements)
Q12Financial_Stability
Q12Withdraw_Money
Q12Treated
AQ12Advice_Quality
Q12Personal_Information_
Safe
Q12Fees
Q12Interest_Rates_Accoun
ts
Q12Interest_Rates_Loan
Q12Open_Or_Close_Branc
hes
I think the overall approach
of my bank's social
responsibility activities is
aligned with customers’
needs and demands in the
post financial crisis of 2007
.572 .584 .573 .575
.445 .521 .694 .527
.489 .442 .592 .450
.329 .385 .441 .335
.398 .434 .679 .406
.451 .529 .666 .452
.431 .293 .370 .259
.442 .490 .568 .442
.380 .413 .492 .430
.378 .455 .524 .483
.383 .459 .403 .357
.566 .598 .518 .607
.553 .444 .540 .393
Correlation Matrixa
Q9Social_Attac
hment
Q9Confidentiall
y
Q9Valued_Cust
omer_Recogniti
on
I think that my bank's actual
social activities and ethical
behaviour comply with what
they committed to in the
media and other channels
since the Financial Crisis of
2007
I feel that I am getting an
economic value in my
dealings with my bank
(Good quality products that
efficiently satisfy my needs
and requirements)
Q12Financial_Stability
Q12Withdraw_Money
Q12Treated
AQ12Advice_Quality
Q12Personal_Information_
Safe
Q12Fees
Q12Interest_Rates_Accoun
ts
Q12Interest_Rates_Loan
Q12Open_Or_Close_Branc
hes
I think the overall approach
of my bank's social
responsibility activities is
aligned with customers’
needs and demands in the
post financial crisis of 2007
.575 .492 .410 .573
.527 .383 .474 .577
.450 .587 .427 .531
.335 .529 .393 .509
.406 .559 .675 .646
.452 .421 .677 .672
.259 .416 .375 .508
.442 .385 .464 .575
.430 .472 .462 .531
.483 .390 .448 .470
.357 .344 .351 .484
.607 .368 .534 .562
.393 .388 .474 .544
Correlation Matrixa
Q9Honest_Rela
tionship
Q9Being_Acco
untable
Q9legal_Obliga
tions
I think that my bank's actual
social activities and ethical
behaviour comply with what
they committed to in the
media and other channels
since the Financial Crisis of
2007
I feel that I am getting an
economic value in my
dealings with my bank
(Good quality products that
efficiently satisfy my needs
and requirements)
Q12Financial_Stability
Q12Withdraw_Money
Q12Treated
AQ12Advice_Quality
Q12Personal_Information_
Safe
Q12Fees
Q12Interest_Rates_Accoun
ts
Q12Interest_Rates_Loan
Q12Open_Or_Close_Branc
hes
I think the overall approach
of my bank's social
responsibility activities is
aligned with customers’
needs and demands in the
post financial crisis of 2007
.573 .595 .608 .398
.577 .513 .416 .321
.531 .600 .505 .385
.509 .399 .503 .464
.646 .599 .497 .472
.672 .595 .528 .421
.508 .348 .361 .395
.575 .525 .426 .329
.531 .488 .479 .409
.470 .393 .423 .352
.484 .474 .519 .275
.562 .533 .519 .423
.544 .561 .463 .442
Correlation Matrixa
Q9Combating_
Bribery
Q9Giving_Back
_To_Communit
y
Q9Financial_lit
eracy
I think that my bank's actual
social activities and ethical
behaviour comply with what
they committed to in the
media and other channels
since the Financial Crisis of
2007
I feel that I am getting an
economic value in my
dealings with my bank
(Good quality products that
efficiently satisfy my needs
and requirements)
Q12Financial_Stability
Q12Withdraw_Money
Q12Treated
AQ12Advice_Quality
Q12Personal_Information_
Safe
Q12Fees
Q12Interest_Rates_Accoun
ts
Q12Interest_Rates_Loan
Q12Open_Or_Close_Branc
hes
I think the overall approach
of my bank's social
responsibility activities is
aligned with customers’
needs and demands in the
post financial crisis of 2007
.398 .411 .479 .455
.321 .438 .538 .343
.385 .492 .452 .477
.464 .411 .355 .399
.472 .493 .462 .465
.421 .487 .469 .502
.395 .318 .235 .370
.329 .445 .346 .377
.409 .396 .326 .397
.352 .435 .328 .501
.275 .352 .286 .442
.423 .528 .557 .400
.442 .526 .404 .327
Correlation Matrixa
Q9Environment
ally_branches
I think that my
bank's actual
social activities
and ethical
behaviour
comply with
what they
committed to in
the media and
other channels
since the
Financial Crisis
of 2007
I feel that I am
getting an
economic value
in my dealings
with my bank
(Good quality
products that
efficiently
satisfy my
needs and
requirements)
I think that my bank's actual
social activities and ethical
behaviour comply with what
they committed to in the
media and other channels
since the Financial Crisis of
2007
I feel that I am getting an
economic value in my
dealings with my bank
(Good quality products that
efficiently satisfy my needs
and requirements)
Q12Financial_Stability
Q12Withdraw_Money
Q12Treated
AQ12Advice_Quality
Q12Personal_Information_
Safe
Q12Fees
Q12Interest_Rates_Accoun
ts
Q12Interest_Rates_Loan
Q12Open_Or_Close_Branc
hes
I think the overall approach
of my bank's social
responsibility activities is
aligned with customers’
needs and demands in the
post financial crisis of 2007
.455 1.000 .670 .657
.343 .670 1.000 .608
.477 .657 .608 1.000
.399 .530 .486 .546
.465 .647 .705 .567
.502 .561 .623 .498
.370 .380 .371 .549
.377 .664 .721 .625
.397 .591 .542 .561
.501 .623 .543 .546
.442 .587 .488 .494
.400 .701 .604 .548
.327 .531 .424 .492
Correlation Matrixa
Q12Financial_S
tability
Q12Withdraw_
Money Q12Treated
I think that my bank's actual
social activities and ethical
behaviour comply with what
they committed to in the
media and other channels
since the Financial Crisis of
2007
I feel that I am getting an
economic value in my
dealings with my bank
(Good quality products that
efficiently satisfy my needs
and requirements)
Q12Financial_Stability
Q12Withdraw_Money
Q12Treated
AQ12Advice_Quality
Q12Personal_Information_
Safe
Q12Fees
Q12Interest_Rates_Accoun
ts
Q12Interest_Rates_Loan
Q12Open_Or_Close_Branc
hes
I think the overall approach
of my bank's social
responsibility activities is
aligned with customers’
needs and demands in the
post financial crisis of 2007
.657 .530 .647 .561
.608 .486 .705 .623
1.000 .546 .567 .498
.546 1.000 .681 .560
.567 .681 1.000 .777
.498 .560 .777 1.000
.549 .552 .432 .410
.625 .540 .706 .598
.561 .466 .599 .518
.546 .441 .598 .506
.494 .478 .528 .487
.548 .407 .559 .523
.492 .373 .478 .514
Correlation Matrixa
AQ12Advice_Q
uality
Q12Personal_I
nformation_Saf
e Q12Fees
Q12Interest_Ra
tes_Accounts
I think that my bank's actual
social activities and ethical
behaviour comply with what
they committed to in the
media and other channels
since the Financial Crisis of
2007
I feel that I am getting an
economic value in my
dealings with my bank
(Good quality products that
efficiently satisfy my needs
and requirements)
Q12Financial_Stability
Q12Withdraw_Money
Q12Treated
AQ12Advice_Quality
Q12Personal_Information_
Safe
Q12Fees
Q12Interest_Rates_Accoun
ts
Q12Interest_Rates_Loan
Q12Open_Or_Close_Branc
hes
I think the overall approach
of my bank's social
responsibility activities is
aligned with customers’
needs and demands in the
post financial crisis of 2007
.561 .380 .664 .591 .623
.623 .371 .721 .542 .543
.498 .549 .625 .561 .546
.560 .552 .540 .466 .441
.777 .432 .706 .599 .598
1.000 .410 .598 .518 .506
.410 1.000 .491 .428 .450
.598 .491 1.000 .762 .735
.518 .428 .762 1.000 .792
.506 .450 .735 .792 1.000
.487 .365 .670 .627 .631
.523 .301 .562 .442 .540
.514 .334 .465 .460 .416
Correlation Matrixa
Q12Interest_Ra
tes_Loan
Q12Open_Or_
Close_Branche
s
I think the
overall
approach of my
bank's social
responsibility
activities is
aligned with
customers’
needs and
demands in the
post financial
crisis of 2007
I think that my bank's actual
social activities and ethical
behaviour comply with what
they committed to in the
media and other channels
since the Financial Crisis of
2007
I feel that I am getting an
economic value in my
dealings with my bank
(Good quality products that
efficiently satisfy my needs
and requirements)
Q12Financial_Stability
Q12Withdraw_Money
Q12Treated
AQ12Advice_Quality
Q12Personal_Information_
Safe
Q12Fees
Q12Interest_Rates_Accoun
ts
Q12Interest_Rates_Loan
Q12Open_Or_Close_Branc
hes
I think the overall approach
of my bank's social
responsibility activities is
aligned with customers’
needs and demands in the
post financial crisis of 2007
.623 .587 .701 .531
.543 .488 .604 .424
.546 .494 .548 .492
.441 .478 .407 .373
.598 .528 .559 .478
.506 .487 .523 .514
.450 .365 .301 .334
.735 .670 .562 .465
.792 .627 .442 .460
1.000 .631 .540 .416
.631 1.000 .466 .473
.540 .466 1.000 .639
.416 .473 .639 1.000
Correlation Matrixa
Overall, I think
that no ethical
problems have
occurred at my
bank in the
years following
the Financial
Crisis of 2007
I think that
banks in
general are
likely to have
learned the
lesson in terms
of navigating a
balance
between the
pursuit of profit
and operating
in a socially
responsible
manner
Has your
confidence
towards the
banking
industry
changed in the
past seven
years?
I think that my bank's actual
social activities and ethical
behaviour comply with what
they committed to in the
media and other channels
since the Financial Crisis of
2007
I feel that I am getting an
economic value in my
dealings with my bank
(Good quality products that
efficiently satisfy my needs
and requirements)
Q12Financial_Stability
Q12Withdraw_Money
Q12Treated
AQ12Advice_Quality
Q12Personal_Information_
Safe
Q12Fees
Q12Interest_Rates_Accoun
ts
Q12Interest_Rates_Loan
Q12Open_Or_Close_Branc
hes
I think the overall approach
of my bank's social
responsibility activities is
aligned with customers’
needs and demands in the
post financial crisis of 2007
.531 .458 .255
.424 .430 .140
.492 .471 .299
.373 .297 .205
.478 .509 .290
.514 .534 .264
.334 .248 .171
.465 .375 .139
.460 .388 .126
.416 .330 .144
.473 .357 .035
.639 .413 .110
1.000 .573 .158
Correlation Matrixa
Q9Borrowings_
And_Savings
Q9Transparenc
y
Q9Financial_St
atements Q9Offers
Overall, I think that no
ethical problems have
occurred at my bank in the
years following the
Financial Crisis of 2007
I think that banks in general
are likely to have learned
the lesson in terms of
navigating a balance
between the pursuit of profit
and operating in a socially
responsible manner
Has your confidence
towards the banking
industry changed in the
past seven years?
Sig. (1-tailed) Q9Borrowings_And_Saving
s
Q9Transparency
Q9Financial_Statements
Q9Offers
Q9Executive_Remuneratio
n
Q9Financial_Inclusion_SM
Ebanking
Q9MeetCustomers_Needs
Q9Social_Attachment
Q9Confidentially
Q9Valued_Customer_Reco
gnition
Q9Honest_Relationship
.490 .458 .448 .360 .553
.492 .448 .472 .368 .411
.245 .266 .219 .174 .171
.000 .000 .000 .000
.000 .000 .000 .000
.000 .000 .000 .020
.000 .000 .000 .002
.000 .000 .020 .002
.000 .000 .000 .001 .000
.000 .000 .000 .000 .000
.000 .000 .011 .001 .000
.000 .000 .000 .000 .000
.000 .000 .000 .000 .000
.000 .000 .000 .000 .000
.000 .000 .000 .000
Correlation Matrixa
Q9Executive_R
emuneration
Q9Financial_In
clusion_SMEba
nking
Q9MeetCustom
ers_Needs
Overall, I think that no
ethical problems have
occurred at my bank in the
years following the
Financial Crisis of 2007
I think that banks in general
are likely to have learned
the lesson in terms of
navigating a balance
between the pursuit of profit
and operating in a socially
responsible manner
Has your confidence
towards the banking
industry changed in the
past seven years?
Sig. (1-tailed) Q9Borrowings_And_Saving
s
Q9Transparency
Q9Financial_Statements
Q9Offers
Q9Executive_Remuneratio
n
Q9Financial_Inclusion_SM
Ebanking
Q9MeetCustomers_Needs
Q9Social_Attachment
Q9Confidentially
Q9Valued_Customer_Reco
gnition
Q9Honest_Relationship
.553 .444 .540 .393
.411 .370 .412 .525
.171 .186 .222 .141
.000 .000 .000 .000
.000 .000 .000 .000
.020 .000 .000 .011
.002 .001 .000 .001
.000 .000 .000
.000 .000 .000
.000 .000 .000
.000 .000 .000
.000 .000 .000 .014
.000 .000 .000 .000
.000 .000 .000 .000
.000 .000 .000 .000
Correlation Matrixa
Q9Social_Attac
hment
Q9Confidentiall
y
Q9Valued_Cust
omer_Recogniti
on
Overall, I think that no
ethical problems have
occurred at my bank in the
years following the
Financial Crisis of 2007
I think that banks in general
are likely to have learned
the lesson in terms of
navigating a balance
between the pursuit of profit
and operating in a socially
responsible manner
Has your confidence
towards the banking
industry changed in the
past seven years?
Sig. (1-tailed) Q9Borrowings_And_Saving
s
Q9Transparency
Q9Financial_Statements
Q9Offers
Q9Executive_Remuneratio
n
Q9Financial_Inclusion_SM
Ebanking
Q9MeetCustomers_Needs
Q9Social_Attachment
Q9Confidentially
Q9Valued_Customer_Reco
gnition
Q9Honest_Relationship
.393 .388 .474 .544
.525 .364 .350 .452
.141 .253 .185 .225
.000 .000 .000 .000
.000 .000 .000 .000
.011 .000 .000 .000
.001 .000 .000 .000
.000 .000 .000 .000
.000 .000 .000 .000
.000 .000 .000 .000
.014 .000 .000
.014 .000 .000
.000 .000 .000
.000 .000 .000
.000 .000 .000 .000
Correlation Matrixa
Q9Honest_Rela
tionship
Q9Being_Acco
untable
Q9legal_Obliga
tions
Overall, I think that no
ethical problems have
occurred at my bank in the
years following the
Financial Crisis of 2007
I think that banks in general
are likely to have learned
the lesson in terms of
navigating a balance
between the pursuit of profit
and operating in a socially
responsible manner
Has your confidence
towards the banking
industry changed in the
past seven years?
Sig. (1-tailed) Q9Borrowings_And_Saving
s
Q9Transparency
Q9Financial_Statements
Q9Offers
Q9Executive_Remuneratio
n
Q9Financial_Inclusion_SM
Ebanking
Q9MeetCustomers_Needs
Q9Social_Attachment
Q9Confidentially
Q9Valued_Customer_Reco
gnition
Q9Honest_Relationship
.544 .561 .463 .442
.452 .545 .360 .409
.225 .193 .177 .208
.000 .000 .000 .000
.000 .000 .000 .000
.000 .000 .000 .000
.000 .000 .000 .002
.000 .000 .000 .000
.000 .000 .000 .001
.000 .000 .000 .000
.000 .000 .000 .000
.000 .000 .000 .000
.000 .000 .000 .000
.000 .000 .000
.000 .000 .000
Correlation Matrixa
Q9Combating_
Bribery
Q9Giving_Back
_To_Communit
y
Q9Financial_lit
eracy
Overall, I think that no
ethical problems have
occurred at my bank in the
years following the
Financial Crisis of 2007
I think that banks in general
are likely to have learned
the lesson in terms of
navigating a balance
between the pursuit of profit
and operating in a socially
responsible manner
Has your confidence
towards the banking
industry changed in the
past seven years?
Sig. (1-tailed) Q9Borrowings_And_Saving
s
Q9Transparency
Q9Financial_Statements
Q9Offers
Q9Executive_Remuneratio
n
Q9Financial_Inclusion_SM
Ebanking
Q9MeetCustomers_Needs
Q9Social_Attachment
Q9Confidentially
Q9Valued_Customer_Reco
gnition
Q9Honest_Relationship
.442 .526 .404 .327
.409 .421 .405 .472
.208 .241 .145 .192
.000 .000 .000 .000
.000 .000 .000 .001
.000 .020 .142 .029
.002 .001 .027 .054
.000 .000 .000 .000
.001 .000 .000 .000
.000 .000 .000 .000
.000 .000 .000 .000
.000 .000 .002 .000
.000 .000 .000 .000
.000 .000 .000 .000
.000 .000 .000 .000
Correlation Matrixa
Q9Environment
ally_branches
I think that my
bank's actual
social activities
and ethical
behaviour
comply with
what they
committed to in
the media and
other channels
since the
Financial Crisis
of 2007
I feel that I am
getting an
economic value
in my dealings
with my bank
(Good quality
products that
efficiently
satisfy my
needs and
requirements)
Overall, I think that no
ethical problems have
occurred at my bank in the
years following the
Financial Crisis of 2007
I think that banks in general
are likely to have learned
the lesson in terms of
navigating a balance
between the pursuit of profit
and operating in a socially
responsible manner
Has your confidence
towards the banking
industry changed in the
past seven years?
Sig. (1-tailed) Q9Borrowings_And_Saving
s
Q9Transparency
Q9Financial_Statements
Q9Offers
Q9Executive_Remuneratio
n
Q9Financial_Inclusion_SM
Ebanking
Q9MeetCustomers_Needs
Q9Social_Attachment
Q9Confidentially
Q9Valued_Customer_Reco
gnition
Q9Honest_Relationship
.327 .531 .424 .492
.472 .458 .430 .471
.192 .255 .140 .299
.000 .000 .000 .000
.001 .000 .000 .000
.029 .000 .000 .000
.054 .000 .000 .000
.000 .000 .000 .000
.000 .000 .000 .000
.000 .000 .000 .000
.000 .000 .000 .000
.000 .000 .000 .000
.000 .000 .000 .000
.000 .000 .000 .000
.000 .000 .000 .000
Correlation Matrixa
Q12Financial_S
tability
Q12Withdraw_
Money Q12Treated
Overall, I think that no
ethical problems have
occurred at my bank in the
years following the
Financial Crisis of 2007
I think that banks in general
are likely to have learned
the lesson in terms of
navigating a balance
between the pursuit of profit
and operating in a socially
responsible manner
Has your confidence
towards the banking
industry changed in the
past seven years?
Sig. (1-tailed) Q9Borrowings_And_Saving
s
Q9Transparency
Q9Financial_Statements
Q9Offers
Q9Executive_Remuneratio
n
Q9Financial_Inclusion_SM
Ebanking
Q9MeetCustomers_Needs
Q9Social_Attachment
Q9Confidentially
Q9Valued_Customer_Reco
gnition
Q9Honest_Relationship
.492 .373 .478 .514
.471 .297 .509 .534
.299 .205 .290 .264
.000 .000 .000 .000
.000 .000 .000 .000
.000 .000 .000 .000
.000 .002 .000 .000
.000 .001 .000 .000
.000 .000 .000 .000
.000 .000 .000 .000
.000 .001 .000 .000
.000 .000 .000 .000
.000 .000 .000 .000
.000 .000 .000 .000
.000 .000 .000 .000
Correlation Matrixa
AQ12Advice_Q
uality
Q12Personal_I
nformation_Saf
e Q12Fees
Q12Interest_Ra
tes_Accounts
Overall, I think that no
ethical problems have
occurred at my bank in the
years following the
Financial Crisis of 2007
I think that banks in general
are likely to have learned
the lesson in terms of
navigating a balance
between the pursuit of profit
and operating in a socially
responsible manner
Has your confidence
towards the banking
industry changed in the
past seven years?
Sig. (1-tailed) Q9Borrowings_And_Saving
s
Q9Transparency
Q9Financial_Statements
Q9Offers
Q9Executive_Remuneratio
n
Q9Financial_Inclusion_SM
Ebanking
Q9MeetCustomers_Needs
Q9Social_Attachment
Q9Confidentially
Q9Valued_Customer_Reco
gnition
Q9Honest_Relationship
.514 .334 .465 .460 .416
.534 .248 .375 .388 .330
.264 .171 .139 .126 .144
.000 .000 .000 .000 .000
.000 .000 .000 .000 .000
.000 .000 .000 .000 .000
.000 .006 .000 .000 .004
.000 .000 .000 .000 .000
.000 .002 .000 .000 .000
.000 .000 .000 .000 .000
.000 .006 .000 .000 .000
.000 .000 .000 .000 .000
.000 .000 .000 .000 .000
.000 .000 .000 .000 .000
.000 .000 .000 .000
Correlation Matrixa
Q12Interest_Ra
tes_Loan
Q12Open_Or_
Close_Branche
s
I think the
overall
approach of my
bank's social
responsibility
activities is
aligned with
customers’
needs and
demands in the
post financial
crisis of 2007
Overall, I think that no
ethical problems have
occurred at my bank in the
years following the
Financial Crisis of 2007
I think that banks in general
are likely to have learned
the lesson in terms of
navigating a balance
between the pursuit of profit
and operating in a socially
responsible manner
Has your confidence
towards the banking
industry changed in the
past seven years?
Sig. (1-tailed) Q9Borrowings_And_Saving
s
Q9Transparency
Q9Financial_Statements
Q9Offers
Q9Executive_Remuneratio
n
Q9Financial_Inclusion_SM
Ebanking
Q9MeetCustomers_Needs
Q9Social_Attachment
Q9Confidentially
Q9Valued_Customer_Reco
gnition
Q9Honest_Relationship
.416 .473 .639 1.000
.330 .357 .413 .573
.144 .035 .110 .158
.000 .000 .000 .000
.000 .000 .000 .000
.000 .000 .000 .000
.004 .000 .000 .000
.000 .000 .000 .000
.000 .000 .000 .000
.000 .000 .000 .000
.000 .000 .000 .000
.000 .000 .000 .000
.000 .000 .000 .000
.000 .000 .000 .000
.000 .000 .000 .000
Correlation Matrixa
Overall, I think
that no ethical
problems have
occurred at my
bank in the
years following
the Financial
Crisis of 2007
I think that
banks in
general are
likely to have
learned the
lesson in terms
of navigating a
balance
between the
pursuit of profit
and operating
in a socially
responsible
manner
Has your
confidence
towards the
banking
industry
changed in the
past seven
years?
Overall, I think that no
ethical problems have
occurred at my bank in the
years following the
Financial Crisis of 2007
I think that banks in general
are likely to have learned
the lesson in terms of
navigating a balance
between the pursuit of profit
and operating in a socially
responsible manner
Has your confidence
towards the banking
industry changed in the
past seven years?
Sig. (1-tailed) Q9Borrowings_And_Saving
s
Q9Transparency
Q9Financial_Statements
Q9Offers
Q9Executive_Remuneratio
n
Q9Financial_Inclusion_SM
Ebanking
Q9MeetCustomers_Needs
Q9Social_Attachment
Q9Confidentially
Q9Valued_Customer_Reco
gnition
Q9Honest_Relationship
1.000 .573 .158
.573 1.000 .339
.158 .339 1.000
.000 .000 .009
.000 .000 .005
.000 .000 .018
.000 .000 .048
.000 .000 .051
.000 .000 .038
.000 .000 .017
.000 .000 .090
.000 .000 .007
.000 .000 .038
.000 .000 .015
.000 .000 .033 Page 66
Correlation Matrixa
Q9Borrowings_
And_Savings
Q9Transparenc
y
Q9Financial_St
atements Q9Offers
Sig. (1-tailed)
Q9Being_Accountable
Q9legal_Obligations
Q9Combating_Bribery
Q9Giving_Back_To_Comm
unity
Q9Financial_literacy
Q9Environmentally_branch
es
I think that my bank's actual
social activities and ethical
behaviour comply with what
they committed to in the
media and other channels
since the Financial Crisis of
2007
I feel that I am getting an
economic value in my
dealings with my bank
(Good quality products that
efficiently satisfy my needs
and requirements)
Q12Financial_Stability
Q12Withdraw_Money
Q12Treated
AQ12Advice_Quality
Q12Personal_Information_
Safe
Q12Fees
Q12Interest_Rates_Accoun
ts
Q12Interest_Rates_Loan
.000 .000 .000 .000 .000
.000 .000 .000 .000 .000
.000 .000 .000 .002 .000
.000 .000 .020 .001 .000
.000 .000 .142 .027 .000
.000 .001 .029 .054 .000
.000 .000 .000 .000 .000
.000 .000 .000 .000 .000
.000 .000 .000 .000 .000
.000 .000 .000 .002 .001
.000 .000 .000 .000 .000
.000 .000 .000 .000 .000
.000 .000 .000 .006 .000
.000 .000 .000 .000 .000
.000 .000 .000 .000 .000
.000 .000 .000 .004 .000
.000 .000 .000 .000 .000
Correlation Matrixa
Q9Executive_R
emuneration
Q9Financial_In
clusion_SMEba
nking
Q9MeetCustom
ers_Needs
Sig. (1-tailed)
Q9Being_Accountable
Q9legal_Obligations
Q9Combating_Bribery
Q9Giving_Back_To_Comm
unity
Q9Financial_literacy
Q9Environmentally_branch
es
I think that my bank's actual
social activities and ethical
behaviour comply with what
they committed to in the
media and other channels
since the Financial Crisis of
2007
I feel that I am getting an
economic value in my
dealings with my bank
(Good quality products that
efficiently satisfy my needs
and requirements)
Q12Financial_Stability
Q12Withdraw_Money
Q12Treated
AQ12Advice_Quality
Q12Personal_Information_
Safe
Q12Fees
Q12Interest_Rates_Accoun
ts
Q12Interest_Rates_Loan
.000 .000 .000 .000
.000 .000 .000 .000
.000 .001 .000 .000
.000 .000 .000 .000
.000 .000 .000 .000
.000 .000 .000 .000
.000 .000 .000 .000
.000 .000 .000 .000
.000 .000 .000 .000
.001 .000 .000 .001
.000 .000 .000 .000
.000 .000 .000 .000
.000 .002 .000 .006
.000 .000 .000 .000
.000 .000 .000 .000
.000 .000 .000 .000
.000 .000 .000 .000
Correlation Matrixa
Q9Social_Attac
hment
Q9Confidentiall
y
Q9Valued_Cust
omer_Recogniti
on
Sig. (1-tailed)
Q9Being_Accountable
Q9legal_Obligations
Q9Combating_Bribery
Q9Giving_Back_To_Comm
unity
Q9Financial_literacy
Q9Environmentally_branch
es
I think that my bank's actual
social activities and ethical
behaviour comply with what
they committed to in the
media and other channels
since the Financial Crisis of
2007
I feel that I am getting an
economic value in my
dealings with my bank
(Good quality products that
efficiently satisfy my needs
and requirements)
Q12Financial_Stability
Q12Withdraw_Money
Q12Treated
AQ12Advice_Quality
Q12Personal_Information_
Safe
Q12Fees
Q12Interest_Rates_Accoun
ts
Q12Interest_Rates_Loan
.000 .000 .000 .000
.000 .000 .000 .000
.000 .000 .000 .000
.000 .000 .000 .000
.000 .002 .000 .000
.000 .000 .000 .000
.000 .000 .000 .000
.000 .000 .000 .000
.000 .000 .000 .000
.001 .000 .000 .000
.000 .000 .000 .000
.000 .000 .000 .000
.006 .000 .000 .000
.000 .000 .000 .000
.000 .000 .000 .000
.000 .000 .000 .000
.000 .000 .000 .000
Correlation Matrixa
Q9Honest_Rela
tionship
Q9Being_Acco
untable
Q9legal_Obliga
tions
Sig. (1-tailed)
Q9Being_Accountable
Q9legal_Obligations
Q9Combating_Bribery
Q9Giving_Back_To_Comm
unity
Q9Financial_literacy
Q9Environmentally_branch
es
I think that my bank's actual
social activities and ethical
behaviour comply with what
they committed to in the
media and other channels
since the Financial Crisis of
2007
I feel that I am getting an
economic value in my
dealings with my bank
(Good quality products that
efficiently satisfy my needs
and requirements)
Q12Financial_Stability
Q12Withdraw_Money
Q12Treated
AQ12Advice_Quality
Q12Personal_Information_
Safe
Q12Fees
Q12Interest_Rates_Accoun
ts
Q12Interest_Rates_Loan
.000 .000 .000
.000 .000 .000
.000 .000 .000
.000 .000 .000 .000
.000 .000 .001 .001
.000 .000 .001 .000
.000 .000 .000 .000
.000 .000 .000 .001
.000 .000 .000 .000
.000 .000 .000 .000
.000 .000 .000 .000
.000 .000 .000 .000
.000 .000 .000 .000
.000 .000 .000 .001
.000 .000 .000 .000
.000 .000 .000 .000
.000 .000 .000 .004
Correlation Matrixa
Q9Combating_
Bribery
Q9Giving_Back
_To_Communit
y
Q9Financial_lit
eracy
Sig. (1-tailed)
Q9Being_Accountable
Q9legal_Obligations
Q9Combating_Bribery
Q9Giving_Back_To_Comm
unity
Q9Financial_literacy
Q9Environmentally_branch
es
I think that my bank's actual
social activities and ethical
behaviour comply with what
they committed to in the
media and other channels
since the Financial Crisis of
2007
I feel that I am getting an
economic value in my
dealings with my bank
(Good quality products that
efficiently satisfy my needs
and requirements)
Q12Financial_Stability
Q12Withdraw_Money
Q12Treated
AQ12Advice_Quality
Q12Personal_Information_
Safe
Q12Fees
Q12Interest_Rates_Accoun
ts
Q12Interest_Rates_Loan
.000 .000 .000 .000
.000 .000 .001 .001
.000 .001 .000
.000 .000 .000
.001 .000 .000
.000 .000 .000
.000 .000 .000 .000
.001 .000 .000 .000
.000 .000 .000 .000
.000 .000 .000 .000
.000 .000 .000 .000
.000 .000 .000 .000
.000 .001 .012 .000
.001 .000 .000 .000
.000 .000 .001 .000
.000 .000 .001 .000
.004 .000 .003 .000
Correlation Matrixa
Q9Environment
ally_branches
I think that my
bank's actual
social activities
and ethical
behaviour
comply with
what they
committed to in
the media and
other channels
since the
Financial Crisis
of 2007
I feel that I am
getting an
economic value
in my dealings
with my bank
(Good quality
products that
efficiently
satisfy my
needs and
requirements)
Sig. (1-tailed)
Q9Being_Accountable
Q9legal_Obligations
Q9Combating_Bribery
Q9Giving_Back_To_Comm
unity
Q9Financial_literacy
Q9Environmentally_branch
es
I think that my bank's actual
social activities and ethical
behaviour comply with what
they committed to in the
media and other channels
since the Financial Crisis of
2007
I feel that I am getting an
economic value in my
dealings with my bank
(Good quality products that
efficiently satisfy my needs
and requirements)
Q12Financial_Stability
Q12Withdraw_Money
Q12Treated
AQ12Advice_Quality
Q12Personal_Information_
Safe
Q12Fees
Q12Interest_Rates_Accoun
ts
Q12Interest_Rates_Loan
.000 .000 .000 .000
.001 .000 .000 .000
.000 .000 .001 .000
.000 .000 .000 .000
.000 .000 .000 .000
.000 .000 .000
.000 .000 .000
.000 .000 .000
.000 .000 .000
.000 .000 .000 .000
.000 .000 .000 .000
.000 .000 .000 .000
.000 .000 .000 .000
.000 .000 .000 .000
.000 .000 .000 .000
.000 .000 .000 .000
.000 .000 .000 .000
Correlation Matrixa
Q12Financial_S
tability
Q12Withdraw_
Money Q12Treated
Sig. (1-tailed)
Q9Being_Accountable
Q9legal_Obligations
Q9Combating_Bribery
Q9Giving_Back_To_Comm
unity
Q9Financial_literacy
Q9Environmentally_branch
es
I think that my bank's actual
social activities and ethical
behaviour comply with what
they committed to in the
media and other channels
since the Financial Crisis of
2007
I feel that I am getting an
economic value in my
dealings with my bank
(Good quality products that
efficiently satisfy my needs
and requirements)
Q12Financial_Stability
Q12Withdraw_Money
Q12Treated
AQ12Advice_Quality
Q12Personal_Information_
Safe
Q12Fees
Q12Interest_Rates_Accoun
ts
Q12Interest_Rates_Loan
.000 .000 .000 .000
.000 .000 .000 .000
.000 .000 .000 .000
.000 .000 .000 .000
.000 .000 .000 .000
.000 .000 .000 .000
.000 .000 .000 .000
.000 .000 .000 .000
.000 .000 .000
.000 .000 .000
.000 .000 .000
.000 .000 .000
.000 .000 .000 .000
.000 .000 .000 .000
.000 .000 .000 .000
.000 .000 .000 .000
.000 .000 .000 .000
Correlation Matrixa
AQ12Advice_Q
uality
Q12Personal_I
nformation_Saf
e Q12Fees
Q12Interest_Ra
tes_Accounts
Sig. (1-tailed)
Q9Being_Accountable
Q9legal_Obligations
Q9Combating_Bribery
Q9Giving_Back_To_Comm
unity
Q9Financial_literacy
Q9Environmentally_branch
es
I think that my bank's actual
social activities and ethical
behaviour comply with what
they committed to in the
media and other channels
since the Financial Crisis of
2007
I feel that I am getting an
economic value in my
dealings with my bank
(Good quality products that
efficiently satisfy my needs
and requirements)
Q12Financial_Stability
Q12Withdraw_Money
Q12Treated
AQ12Advice_Quality
Q12Personal_Information_
Safe
Q12Fees
Q12Interest_Rates_Accoun
ts
Q12Interest_Rates_Loan
.000 .000 .000 .000 .000
.000 .000 .000 .000 .000
.000 .000 .001 .000 .000
.000 .001 .000 .000 .000
.000 .012 .000 .001 .001
.000 .000 .000 .000 .000
.000 .000 .000 .000 .000
.000 .000 .000 .000 .000
.000 .000 .000 .000 .000
.000 .000 .000 .000 .000
.000 .000 .000 .000 .000
.000 .000 .000 .000
.000 .000 .000 .000
.000 .000 .000 .000
.000 .000 .000 .000
.000 .000 .000 .000
.000 .000 .000 .000 .000
Correlation Matrixa
Q12Interest_Ra
tes_Loan
Q12Open_Or_
Close_Branche
s
I think the
overall
approach of my
bank's social
responsibility
activities is
aligned with
customers’
needs and
demands in the
post financial
crisis of 2007
Sig. (1-tailed)
Q9Being_Accountable
Q9legal_Obligations
Q9Combating_Bribery
Q9Giving_Back_To_Comm
unity
Q9Financial_literacy
Q9Environmentally_branch
es
I think that my bank's actual
social activities and ethical
behaviour comply with what
they committed to in the
media and other channels
since the Financial Crisis of
2007
I feel that I am getting an
economic value in my
dealings with my bank
(Good quality products that
efficiently satisfy my needs
and requirements)
Q12Financial_Stability
Q12Withdraw_Money
Q12Treated
AQ12Advice_Quality
Q12Personal_Information_
Safe
Q12Fees
Q12Interest_Rates_Accoun
ts
Q12Interest_Rates_Loan
.000 .000 .000 .000
.000 .000 .000 .000
.000 .004 .000 .000
.000 .000 .000 .000
.001 .003 .000 .000
.000 .000 .000 .001
.000 .000 .000 .000
.000 .000 .000 .000
.000 .000 .000 .000
.000 .000 .000 .000
.000 .000 .000 .000
.000 .000 .000 .000
.000 .000 .002 .001
.000 .000 .000 .000
.000 .000 .000 .000
.000 .000 .000
.000 .000 .000
Correlation Matrixa
Overall, I think
that no ethical
problems have
occurred at my
bank in the
years following
the Financial
Crisis of 2007
I think that
banks in
general are
likely to have
learned the
lesson in terms
of navigating a
balance
between the
pursuit of profit
and operating
in a socially
responsible
manner
Has your
confidence
towards the
banking
industry
changed in the
past seven
years?
Sig. (1-tailed)
Q9Being_Accountable
Q9legal_Obligations
Q9Combating_Bribery
Q9Giving_Back_To_Comm
unity
Q9Financial_literacy
Q9Environmentally_branch
es
I think that my bank's actual
social activities and ethical
behaviour comply with what
they committed to in the
media and other channels
since the Financial Crisis of
2007
I feel that I am getting an
economic value in my
dealings with my bank
(Good quality products that
efficiently satisfy my needs
and requirements)
Q12Financial_Stability
Q12Withdraw_Money
Q12Treated
AQ12Advice_Quality
Q12Personal_Information_
Safe
Q12Fees
Q12Interest_Rates_Accoun
ts
Q12Interest_Rates_Loan
.000 .000 .033
.000 .000 .046
.000 .000 .023
.000 .000 .010
.000 .000 .084
.001 .000 .033
.000 .000 .007
.000 .000 .092
.000 .000 .002
.000 .002 .025
.000 .000 .002
.000 .000 .005
.001 .009 .051
.000 .000 .093
.000 .000 .115
.000 .001 .086
.000 .000 .370
Correlation Matrixa
Q9Borrowings_
And_Savings
Q9Transparenc
y
Q9Financial_St
atements Q9Offers
Q12Open_Or_Close_Branc
hes
I think the overall approach
of my bank's social
responsibility activities is
aligned with customers’
needs and demands in the
post financial crisis of 2007
Overall, I think that no
ethical problems have
occurred at my bank in the
years following the
Financial Crisis of 2007
I think that banks in general
are likely to have learned
the lesson in terms of
navigating a balance
between the pursuit of profit
and operating in a socially
responsible manner
Has your confidence
towards the banking
industry changed in the
past seven years?
.000 .000 .000 .000 .000
.000 .000 .000 .000 .000
.000 .000 .000 .000 .000
.000 .000 .000 .000 .000
.009 .005 .018 .048 .051
Correlation Matrixa
Q9Executive_R
emuneration
Q9Financial_In
clusion_SMEba
nking
Q9MeetCustom
ers_Needs
Q12Open_Or_Close_Branc
hes
I think the overall approach
of my bank's social
responsibility activities is
aligned with customers’
needs and demands in the
post financial crisis of 2007
Overall, I think that no
ethical problems have
occurred at my bank in the
years following the
Financial Crisis of 2007
I think that banks in general
are likely to have learned
the lesson in terms of
navigating a balance
between the pursuit of profit
and operating in a socially
responsible manner
Has your confidence
towards the banking
industry changed in the
past seven years?
.000 .000 .000 .000
.000 .000 .000 .000
.000 .000 .000 .000
.000 .000 .000 .000
.051 .038 .017 .090
Correlation Matrixa
Q9Social_Attac
hment
Q9Confidentiall
y
Q9Valued_Cust
omer_Recogniti
on
Q12Open_Or_Close_Branc
hes
I think the overall approach
of my bank's social
responsibility activities is
aligned with customers’
needs and demands in the
post financial crisis of 2007
Overall, I think that no
ethical problems have
occurred at my bank in the
years following the
Financial Crisis of 2007
I think that banks in general
are likely to have learned
the lesson in terms of
navigating a balance
between the pursuit of profit
and operating in a socially
responsible manner
Has your confidence
towards the banking
industry changed in the
past seven years?
.000 .000 .000 .000
.000 .000 .000 .000
.000 .000 .000 .000
.000 .000 .000 .000
.090 .007 .038 .015
Correlation Matrixa
Q9Honest_Rela
tionship
Q9Being_Acco
untable
Q9legal_Obliga
tions
Q12Open_Or_Close_Branc
hes
I think the overall approach
of my bank's social
responsibility activities is
aligned with customers’
needs and demands in the
post financial crisis of 2007
Overall, I think that no
ethical problems have
occurred at my bank in the
years following the
Financial Crisis of 2007
I think that banks in general
are likely to have learned
the lesson in terms of
navigating a balance
between the pursuit of profit
and operating in a socially
responsible manner
Has your confidence
towards the banking
industry changed in the
past seven years?
.000 .000 .000 .004
.000 .000 .000 .000
.000 .000 .000 .000
.000 .000 .000 .000
.015 .033 .046 .023
Correlation Matrixa
Q9Combating_
Bribery
Q9Giving_Back
_To_Communit
y
Q9Financial_lit
eracy
Q12Open_Or_Close_Branc
hes
I think the overall approach
of my bank's social
responsibility activities is
aligned with customers’
needs and demands in the
post financial crisis of 2007
Overall, I think that no
ethical problems have
occurred at my bank in the
years following the
Financial Crisis of 2007
I think that banks in general
are likely to have learned
the lesson in terms of
navigating a balance
between the pursuit of profit
and operating in a socially
responsible manner
Has your confidence
towards the banking
industry changed in the
past seven years?
.004 .000 .003 .000
.000 .000 .000 .000
.000 .000 .000 .001
.000 .000 .000 .000
.023 .010 .084 .033
Correlation Matrixa
Q9Environment
ally_branches
I think that my
bank's actual
social activities
and ethical
behaviour
comply with
what they
committed to in
the media and
other channels
since the
Financial Crisis
of 2007
I feel that I am
getting an
economic value
in my dealings
with my bank
(Good quality
products that
efficiently
satisfy my
needs and
requirements)
Q12Open_Or_Close_Branc
hes
I think the overall approach
of my bank's social
responsibility activities is
aligned with customers’
needs and demands in the
post financial crisis of 2007
Overall, I think that no
ethical problems have
occurred at my bank in the
years following the
Financial Crisis of 2007
I think that banks in general
are likely to have learned
the lesson in terms of
navigating a balance
between the pursuit of profit
and operating in a socially
responsible manner
Has your confidence
towards the banking
industry changed in the
past seven years?
.000 .000 .000 .000
.000 .000 .000 .000
.001 .000 .000 .000
.000 .000 .000 .000
.033 .007 .092 .002
Correlation Matrixa
Q12Financial_S
tability
Q12Withdraw_
Money Q12Treated
Q12Open_Or_Close_Branc
hes
I think the overall approach
of my bank's social
responsibility activities is
aligned with customers’
needs and demands in the
post financial crisis of 2007
Overall, I think that no
ethical problems have
occurred at my bank in the
years following the
Financial Crisis of 2007
I think that banks in general
are likely to have learned
the lesson in terms of
navigating a balance
between the pursuit of profit
and operating in a socially
responsible manner
Has your confidence
towards the banking
industry changed in the
past seven years?
.000 .000 .000 .000
.000 .000 .000 .000
.000 .000 .000 .000
.000 .002 .000 .000
.002 .025 .002 .005
Correlation Matrixa
AQ12Advice_Q
uality
Q12Personal_I
nformation_Saf
e Q12Fees
Q12Interest_Ra
tes_Accounts
Q12Open_Or_Close_Branc
hes
I think the overall approach
of my bank's social
responsibility activities is
aligned with customers’
needs and demands in the
post financial crisis of 2007
Overall, I think that no
ethical problems have
occurred at my bank in the
years following the
Financial Crisis of 2007
I think that banks in general
are likely to have learned
the lesson in terms of
navigating a balance
between the pursuit of profit
and operating in a socially
responsible manner
Has your confidence
towards the banking
industry changed in the
past seven years?
.000 .000 .000 .000 .000
.000 .002 .000 .000 .000
.000 .001 .000 .000 .000
.000 .009 .000 .000 .001
.005 .051 .093 .115 .086
Correlation Matrixa
Q12Interest_Ra
tes_Loan
Q12Open_Or_
Close_Branche
s
I think the
overall
approach of my
bank's social
responsibility
activities is
aligned with
customers’
needs and
demands in the
post financial
crisis of 2007
Q12Open_Or_Close_Branc
hes
I think the overall approach
of my bank's social
responsibility activities is
aligned with customers’
needs and demands in the
post financial crisis of 2007
Overall, I think that no
ethical problems have
occurred at my bank in the
years following the
Financial Crisis of 2007
I think that banks in general
are likely to have learned
the lesson in terms of
navigating a balance
between the pursuit of profit
and operating in a socially
responsible manner
Has your confidence
towards the banking
industry changed in the
past seven years?
.000 .000 .000
.000 .000 .000
.000 .000 .000
.001 .000 .000 .000
.086 .370 .147 .066
Correlation Matrixa
Overall, I think
that no ethical
problems have
occurred at my
bank in the
years following
the Financial
Crisis of 2007
I think that
banks in
general are
likely to have
learned the
lesson in terms
of navigating a
balance
between the
pursuit of profit
and operating
in a socially
responsible
manner
Has your
confidence
towards the
banking
industry
changed in the
past seven
years?
Q12Open_Or_Close_Branc
hes
I think the overall approach
of my bank's social
responsibility activities is
aligned with customers’
needs and demands in the
post financial crisis of 2007
Overall, I think that no
ethical problems have
occurred at my bank in the
years following the
Financial Crisis of 2007
I think that banks in general
are likely to have learned
the lesson in terms of
navigating a balance
between the pursuit of profit
and operating in a socially
responsible manner
Has your confidence
towards the banking
industry changed in the
past seven years?
.000 .000 .370
.000 .000 .147
.000 .066
.000 .000
.066 .000
Determinant = 3.25E-013a.
KMO and Bartlett's Test
Kaiser-Meyer-Olkin Measure of Sampling Adequacy.
Bartlett's Test of Sphericity Approx. Chi-Square
df
Sig.
.900
2285.941
496
.000
Communalities
Initial Extraction
Q9Borrowings_And_Savings
Q9Transparency
Q9Financial_Statements
Q9Offers
Q9Executive_Remuneration
Q9Financial_Inclusion_SMEbanking
Q9MeetCustomers_Needs
Q9Social_Attachment
Q9Confidentially
Q9Valued_Customer_Recognition
Q9Honest_Relationship
Q9Being_Accountable
Q9legal_Obligations
Q9Combating_Bribery
Q9Giving_Back_To_Community
Q9Financial_literacy
Q9Environmentally_branches
Q10
Q11
Q12Financial_Stability
Q12Withdraw_Money
Q12Treated
AQ12Advice_Quality
Q12Personal_Information_Safe
Q12Fees
Q12Interest_Rates_Accounts
Q12Interest_Rates_Loan
Q12Open_Or_Close_Branches
Q13
Q14
Q17
Q18
1.000 .569
1.000 .593
1.000 .572
1.000 .346
1.000 .576
1.000 .460
1.000 .586
1.000 .616
1.000 .445
1.000 .527
1.000 .624
1.000 .638
1.000 .501
1.000 .401
1.000 .652
1.000 .649
1.000 .465
1.000 .665
1.000 .578
1.000 .601
1.000 .486
1.000 .680
1.000 .616
1.000 .380
1.000 .719
1.000 .652
1.000 .567
1.000 .513
1.000 .599
1.000 .490
1.000 .429
1.000 .091
Extraction Method: Principal Component Analysis.
Total Variance Explained
Component
Initial Eigenvalues Extraction Sums of Squared Loadings
Total % of Variance Cumulative % Total % of Variance Cumulative %
1
2
3
4
5
6
7
8
9
10
11
12
13
14
15
16
17
18
19
20
21
22
23
24
25
26
27
28
29
30
31
32
15.449 48.279 48.279 15.449 48.279 48.279 13.962
1.838 5.743 54.022 1.838 5.743 54.022 11.766
1.583 4.945 58.967
1.209 3.778 62.745
1.140 3.562 66.307
1.096 3.426 69.733
.897 2.804 72.537
.780 2.438 74.974
.708 2.214 77.188
.696 2.175 79.363
.683 2.134 81.498
.633 1.978 83.476
.623 1.948 85.423
.537 1.678 87.101
.496 1.549 88.650
.473 1.479 90.129
.441 1.377 91.506
.375 1.173 92.678
.324 1.012 93.690
.303 .946 94.637
.246 .767 95.404
.229 .717 96.121
.210 .655 96.776
.174 .543 97.319
.159 .498 97.817
.146 .455 98.272
.125 .392 98.664
.113 .352 99.015
.089 .278 99.294
.084 .262 99.556
.075 .236 99.792
.067 .208 100.000
Total Variance Explained
Component
Rotation Sums
of Squared
Loadingsa
Total
1
2
3
4
5
6
7
8
9
10
11
12
13
14
15
16
17
18
19
20
21
22
23
24
25
26
27
28
29
30
31
32
13.962
11.766
Extraction Method: Principal Component Analysis.
When components are correlated, sums of squared loadings cannot be added to obtain a total variance.a.
Pattern Matrixa
Component
1 2
Q9Financial_Statements
Q12Fees
Q12Interest_Rates_Accounts
Q12Interest_Rates_Loan
Q12Open_Or_Close_Branches
Q9Transparency
Q12Treated
Q12Withdraw_Money
Q12Personal_Information_Safe
Q12Financial_Stability
Q9legal_Obligations
Q10
Q9Honest_Relationship
Q9Borrowings_And_Savings
Q9Offers
Q9Confidentially
Q11
AQ12Advice_Quality
Q9MeetCustomers_Needs
Q9Financial_literacy
Q9Giving_Back_To_Community
Q9Social_Attachment
Q9Executive_Remuneration
Q9Environmentally_branches
Q13
Q9Being_Accountable
Q17
Q9Valued_Customer_Recognition
Q9Financial_Inclusion_SMEbanking
Q14
Q9Combating_Bribery
Q18
.904
.883
.858
.740
.734
.687
.686
.684
.647
.627
.616
.613
.612
.589
.572
.568
.566
.520
.465
.915
.822
.806
.717
.638
.557
.527
.498
.498
.461
.452
.444
Extraction Method: Principal Component Analysis.
Rotation Method: Oblimin with Kaiser Normalization.a
Rotation converged in 10 iterations.a.
Component Correlation Matrix
Component 1 2
1
2
1.000 .634
.634 1.000
Extraction Method: Principal
Component Analysis.
Rotation Method: Oblimin with
Kaiser Normalization.
Appendix G - Research Objective One - Factor and Reliability Analyses
KMO and Bartlett's Test
Kaiser-Meyer-Olkin Measure of Sampling Adequacy.
Bartlett's Test of Sphericity Approx. Chi-Square
df
Sig.
.896
2331.783
528
.000
Communalities
Initial Extraction
Q9Borrowings_And_Savings
Q9Transparency
Q9Financial_Statements
Q9Offers
Q9Executive_Remuneration
Q9Financial_Inclusion_SMEbanking
Q9MeetCustomers_Needs
Q9Social_Attachment
Q9Confidentially
Q9Valued_Customer_Recognition
Q9Honest_Relationship
Q9Being_Accountable
Q9legal_Obligations
Q9Combating_Bribery
Q9Giving_Back_To_Community
Q9Financial_literacy
Q9Environmentally_branches
Q10
Q11
Q12Financial_Stability
Q12Withdraw_Money
Q12Treated
AQ12Advice_Quality
Q12Personal_Information_Safe
Q12Fees
Q12Interest_Rates_Accounts
Q12Interest_Rates_Loan
Q12Open_Or_Close_Branches
Q13
1.000 .695
1.000 .681
1.000 .693
1.000 .598
1.000 .704
1.000 .541
1.000 .701
1.000 .774
1.000 .653
1.000 .776
1.000 .742
1.000 .727
1.000 .690
1.000 .641
1.000 .705
1.000 .693
1.000 .701
1.000 .739
1.000 .762
1.000 .631
1.000 .634
1.000 .843
1.000 .728
1.000 .533
1.000 .848
1.000 .723
1.000 .755
1.000 .661
1.000 .690
1.000 .554
Communalities
Initial Extraction
Q14
Q16
Q17
Q18
1.000 .554
1.000 .717
1.000 .672
1.000 .583
Extraction Method: Principal Component Analysis.
Total Variance Explained
Component
Initial Eigenvalues Extraction Sums of Squared Loadings
Total % of Variance Cumulative % Total % of Variance Cumulative %
1
2
3
4
5
6
7
8
9
10
11
12
13
14
15
16
17
18
19
20
21
22
23
24
25
26
27
28
29
15.465 46.863 46.863 15.465 46.863 46.863
2.022 6.127 52.990 2.022 6.127 52.990
1.610 4.877 57.867 1.610 4.877 57.867
1.371 4.154 62.021 1.371 4.154 62.021
1.194 3.618 65.640 1.194 3.618 65.640
1.124 3.407 69.047 1.124 3.407 69.047
.911 2.759 71.806
.792 2.400 74.206
.774 2.346 76.552
.708 2.145 78.697
.683 2.070 80.767
.665 2.016 82.783
.629 1.905 84.689
.539 1.634 86.322
.531 1.610 87.932
.485 1.471 89.403
.441 1.336 90.739
.436 1.322 92.061
.338 1.024 93.085
.317 .962 94.047
.297 .899 94.946
.234 .708 95.655
.223 .677 96.331
.198 .599 96.931
.170 .516 97.447
.158 .478 97.925
.144 .436 98.360
.125 .378 98.738
.110 .333 99.071
.088 .267 99.338
Total Variance Explained
Component
Initial Eigenvalues Extraction Sums of Squared Loadings
Total % of Variance Cumulative % Total % of Variance Cumulative %
30
31
32
33
.088 .267 99.338
.084 .253 99.591
.073 .222 99.814
.061 .186 100.000
Extraction Method: Principal Component Analysis.
Component Number
333231302928272625242322212019181716151413121110987654321
Eigenvalue
20
15
10
5
0
Scree Plot
Appendix G - Research Objective One - Factor and Reliability Analyses
Communalities
Initial Extraction
Q9Borrowings_And_Savings
Q9Transparency
Q9Financial_Statements
Q9Offers
Q9Executive_Remuneration
Q9Financial_Inclusion_SMEbanking
Q9MeetCustomers_Needs
Q9Social_Attachment
Q9Confidentially
Q9Valued_Customer_Recognition
Q9Honest_Relationship
Q9Being_Accountable
Q9legal_Obligations
Q9Combating_Bribery
Q9Giving_Back_To_Community
Q9Financial_literacy
Q9Environmentally_branches
Q10
Q11
Q12Financial_Stability
Q12Withdraw_Money
Q12Treated
AQ12Advice_Quality
Q12Personal_Information_Safe
Q12Fees
Q12Interest_Rates_Accounts
Q12Interest_Rates_Loan
Q12Open_Or_Close_Branches
Q13
Q14
Q15
Q16
Q17
Q18
1.000 .572
1.000 .623
1.000 .569
1.000 .322
1.000 .630
1.000 .532
1.000 .585
1.000 .638
1.000 .620
1.000 .591
1.000 .642
1.000 .698
1.000 .524
1.000 .573
1.000 .633
1.000 .619
1.000 .419
1.000 .711
1.000 .643
1.000 .608
1.000 .550
1.000 .683
1.000 .621
1.000 .397
1.000 .816
1.000 .675
1.000 .634
1.000 .597
1.000 .693
1.000 .507
1.000 .676
1.000 .434
1.000 .431
1.000 .269
Extraction Method: Principal Component Analysis.
Total Variance Explained
Component
Initial Eigenvalues Extraction Sums of Squared Loadings
Total % of Variance Cumulative % Total % of Variance Cumulative %
1
2
3
4
5
6
7
8
9
10
11
12
13
14
15
16
17
18
19
20
21
22
23
24
25
26
27
28
29
30
31
32
33
34
16.058 47.228 47.228 16.058 47.228 47.228 14.311
2.027 5.961 53.190 2.027 5.961 53.190 3.280
1.652 4.859 58.049 1.652 4.859 58.049 11.658
1.382 4.063 62.112
1.250 3.676 65.788
1.129 3.321 69.110
.914 2.688 71.798
.851 2.503 74.301
.774 2.277 76.578
.708 2.083 78.661
.684 2.010 80.671
.665 1.957 82.628
.629 1.849 84.477
.540 1.587 86.065
.534 1.572 87.637
.498 1.464 89.100
.459 1.351 90.451
.438 1.287 91.738
.338 .995 92.733
.320 .942 93.675
.298 .877 94.552
.246 .725 95.276
.228 .671 95.948
.201 .591 96.538
.195 .575 97.113
.170 .501 97.614
.156 .457 98.071
.135 .396 98.467
.115 .338 98.805
.109 .319 99.124
.087 .256 99.380
.080 .234 99.614
.071 .209 99.823
.060 .177 100.000
Total Variance Explained
Component
Rotation Sums
of Squared
Loadingsa
Total
1
2
3
4
5
6
7
8
9
10
11
12
13
14
15
16
17
18
19
20
21
22
23
24
25
26
27
28
29
30
31
32
33
34
14.311
3.280
11.658
Extraction Method: Principal Component Analysis.
When components are correlated, sums of squared loadings cannot be added to obtain a total variance.a.
Pattern Matrixa
Component
1 2 3
Q12Fees
Q12Open_Or_Close_Branches
Q12Interest_Rates_Accounts
Q12Interest_Rates_Loan
Q10
Q11
Q9Transparency
Q15
Q9Financial_Statements
Q13
Q9Borrowings_And_Savings
Q12Treated
Q9Financial_Inclusion_SMEbanking
Q12Financial_Stability
Q9Offers
AQ12Advice_Quality
Q9MeetCustomers_Needs
Q12Withdraw_Money
Q14
Q12Personal_Information_Safe
Q16
Q9Financial_literacy
Q9Social_Attachment
Q9Executive_Remuneration
Q9Combating_Bribery
Q9Confidentially
Q9Being_Accountable
Q9Giving_Back_To_Community
Q9Valued_Customer_Recognition
Q18
Q9Honest_Relationship
Q17
Q9Environmentally_branches
Q9legal_Obligations
.997
.860
.859
.858
.756
.751
.743
.723
.605
.568 -.418
.566
.546
.542
.536
.461
.456 .403
.441
.431
.631
-.580
-.532
-.494 .402
.789
.708
.666
.659
.630
.568
.507
.474
.473
.454
Extraction Method: Principal Component Analysis.
Rotation Method: Oblimin with Kaiser Normalization.a
Rotation converged in 12 iterations.a.
Component Correlation Matrix
Component 1 2 3
1
2
3
1.000 -.191 .615
-.191 1.000 -.117
.615 -.117 1.000
Extraction Method: Principal Component
Analysis.
Rotation Method: Oblimin with Kaiser
Normalization.
Appendix G - Research Objective One - Factor and Reliability Analyses
Reliability Statistics
Cronbach's
Alpha
Cronbach's
Alpha Based on
Standardized
Items N of Items
.532 .545 4
Inter-Item Correlation Matrix
Q16
Q9Financial_lit
eracy
Q9Social_Attac
hment
Q9Executive_R
emuneration
Q16
Q9Financial_literacy
Q9Social_Attachment
Q9Executive_Remuneration
1.000 -.095 -.028 -.217
-.095 1.000 .645 .538
-.028 .645 1.000 .537
-.217 .538 .537 1.000
Item-Total Statistics
Scale Mean if
Item Deleted
Scale Variance
if Item Deleted
Corrected Item-
Total
Correlation
Squared
Multiple
Correlation
Q16
Q9Financial_literacy
Q9Social_Attachment
Q9Executive_Remuneration
7.99 4.846 -.132 .059 .802
9.17 2.783 .566 .468 .232
9.13 2.598 .611 .473 .173
9.09 3.179 .418 .383 .376
Item-Total Statistics
Cronbach's
Alpha if Item
Deleted
Q16
Q9Financial_literacy
Q9Social_Attachment
Q9Executive_Remuneration
.802
.232
.173
.376
Appendix G - Research Objective One - Factor and Reliability Analyses
Communalities
Initial Extraction
Q9Borrowings_And_Savings
Q9Transparency
Q9Financial_Statements
Q9Offers
Q9Executive_Remuneration
Q9Financial_Inclusion_SMEbanking
Q9MeetCustomers_Needs
Q9Social_Attachment
Q9Confidentially
Q9Valued_Customer_Recognition
Q9Honest_Relationship
Q9Being_Accountable
Q9legal_Obligations
Q9Combating_Bribery
Q9Giving_Back_To_Community
Q9Financial_literacy
Q9Environmentally_branches
Q10
Q11
Q12Financial_Stability
Q12Withdraw_Money
Q12Treated
AQ12Advice_Quality
Q12Personal_Information_Safe
Q12Fees
Q12Interest_Rates_Accounts
Q12Interest_Rates_Loan
1.000 .570
1.000 .599
1.000 .576
1.000 .346
1.000 .578
1.000 .467
1.000 .584
1.000 .625
1.000 .438
1.000 .520
1.000 .622
1.000 .635
1.000 .503
1.000 .392
1.000 .642
1.000 .651
1.000 .453
1.000 .668
1.000 .580
1.000 .597
1.000 .481
1.000 .674
1.000 .616
1.000 .376
1.000 .721
1.000 .649
1.000 .560
1.000 .516
Communalities
Initial Extraction
Q12Open_Or_Close_Branches
Q13
Q14
Q15
Q17
Q18
1.000 .516
1.000 .610
1.000 .501
1.000 .609
1.000 .431
1.000 .089
Extraction Method: Principal Component Analysis.
Total Variance Explained
Component
Initial Eigenvalues Extraction Sums of Squared Loadings
Total % of Variance Cumulative % Total % of Variance Cumulative %
1
2
3
4
5
6
7
8
9
10
11
12
13
14
15
16
17
18
19
20
21
22
23
24
25
16.042 48.613 48.613 16.042 48.613 48.613 14.534
1.838 5.570 54.183 1.838 5.570 54.183 12.143
1.625 4.924 59.107
1.296 3.926 63.033
1.141 3.456 66.489
1.111 3.367 69.856
.898 2.723 72.578
.804 2.437 75.016
.710 2.152 77.168
.699 2.118 79.286
.683 2.070 81.356
.633 1.919 83.275
.623 1.889 85.164
.537 1.628 86.792
.500 1.516 88.308
.475 1.440 89.748
.456 1.381 91.129
.392 1.189 92.318
.327 .991 93.310
.304 .920 94.229
.249 .753 94.983
.242 .734 95.717
.211 .638 96.355
.200 .606 96.961
.174 .526 97.487
.157 .476 97.963
Total Variance Explained
Component
Rotation Sums
of Squared
Loadingsa
Total
1
2
3
4
5
6
7
8
9
10
11
12
13
14
15
16
17
18
19
20
21
22
23
24
25
14.534
12.143
Total Variance Explained
Component
Initial Eigenvalues Extraction Sums of Squared Loadings
Total % of Variance Cumulative % Total % of Variance Cumulative %
26
27
28
29
30
31
32
33
.157 .476 97.963
.140 .424 98.387
.115 .348 98.735
.112 .341 99.076
.089 .269 99.345
.081 .244 99.590
.071 .215 99.804
.065 .196 100.000
Total Variance Explained
Component
Rotation Sums
of Squared
Loadingsa
Total
26
27
28
29
30
31
32
33
Extraction Method: Principal Component Analysis.
When components are correlated, sums of squared loadings cannot be added to obtain a total variance.a.
Pattern Matrixa
Component
1 2
Q9Financial_Statements
Q12Fees
Q12Interest_Rates_Accounts
Q12Interest_Rates_Loan
Q12Open_Or_Close_Branches
Q12Treated
Q9Transparency
Q12Withdraw_Money
Q12Personal_Information_Safe
Q12Financial_Stability
Q9legal_Obligations
Q9Honest_Relationship
Q10
Q9Borrowings_And_Savings
Q9Confidentially
Q9Offers
Q11
AQ12Advice_Quality
Q15
Q9MeetCustomers_Needs
Q9Financial_literacy
Q9Giving_Back_To_Community
Q9Social_Attachment
Q9Executive_Remuneration
Q9Environmentally_branches
Q13
Q9Being_Accountable
Q17
Q9Valued_Customer_Recognition
Q9Financial_Inclusion_SMEbanking
Q14
Q9Combating_Bribery
Q18
.908
.884
.859
.739
.735
.691
.690
.689
.652
.632
.622
.619
.616
.593
.576
.574
.567
.526
.505
.470
.914
.812
.810
.714
.627
.561
.517
.495
.485
.464
.455
.429
Extraction Method: Principal Component Analysis.
Rotation Method: Oblimin with Kaiser Normalization.a
Rotation converged in 11 iterations.a.
Component Correlation Matrix
Component 1 2
1
2
1.000 .635
.635 1.000
Extraction Method: Principal
Component Analysis.
Rotation Method: Oblimin with
Kaiser Normalization.
Apendix H- Research Objective One- Regression Analysis
Descriptive Statistics
Mean Std. Deviation N
Q15
ECandLG
PHandET
3.11 .883 92
.0000000 1.00000000 92
.0000000 1.00000000 92
Correlations
Q15 ECandLG PHandET
Pearson Correlation Q15
ECandLG
PHandET
Sig. (1-tailed) Q15
ECandLG
PHandET
N Q15
ECandLG
PHandET
1.000 .712 .656
.712 1.000 .634
.656 .634 1.000
. .000 .000
.000 . .000
.000 .000 .
92 92 92
92 92 92
92 92 92
Variables Entered/Removeda
Model
Variables
Entered
Variables
Removed Method
1 PH&ET,
EC&LGb . Enter
Dependent Variable: I think the overall approach of my bank's social responsibility efforts after the financial
crisis of 2007 are satisfactory
a.
All requested variables entered.b.
Model Summary
Model R R Square
Adjusted R
Square
Std. Error of the
Estimate
1 .760a
.577 .568 .580
Predictors: (Constant), PH&ET, EC&LGa.
ANOVAa
Model
Sum of
Squares df Mean Square F Sig.
1 Regression
Residual
Total
40.927 2 20.464 60.738 .000b
29.986 89 .337
70.913 91
Dependent Variable: I think the overall approach of my bank's social responsibility efforts after the financial
crisis of 2007 are satisfactory
a.
Predictors: (Constant), PH&ET, EC&LGb.
Coefficientsa
Model
Unstandardized Coefficients
Standardized
Coefficients
t Sig.
Collinearity
Statistics
B Std. Error Beta Tolerance
1 (Constant)
EC&LG
PH&ET
3.109 .061 51.370 .000
.438 .079 .496 5.564 .000 .598 1.672
.301 .079 .341 3.829 .000 .598 1.672
Coefficientsa
Model
Collinearity
Statistics
VIF
1 (Constant)
EC&LG
PH&ET
1.672
1.672
Dependent Variable: I think the overall approach of my bank's social responsibility efforts after the financial
crisis of 2007 are satisfactory
a.
Appendix I - Research Objective Two - Factor and Reliability Analyses
Descriptive Statistics
Mean Std. Deviation Analysis N
Q19Reasonable_Interest_Rates
Q19Payments_Fees_Transparency
Q19Account_Information_Confidentiality
Q19CEO_Cuts
Q19Financial_Inclusion
Q19Projects_With_Adverse_Impacts
Q19ValuedCustomer_Treating
Q19Honest_Financial_Advice
Q19CEO_dont_Misreport
Q19Compliance_With_Law
4.20 .975 92
4.26 .850 92
4.27 .939 92
3.16 1.252 92
3.18 1.195 92
3.71 1.218 92
4.34 .842 92
4.29 .871 92
3.92 1.061 92
4.22 .936 92
Correlation Matrixa
Q19Reasonabl
e_Interest_Rate
s
Q19Payments_
Fees_Transpar
ency
Correlation Q19Reasonable_Interest_Rates
Q19Payments_Fees_Transparency
Q19Account_Information_Confidentiality
Q19CEO_Cuts
Q19Financial_Inclusion
Q19Projects_With_Adverse_Impacts
Q19ValuedCustomer_Treating
Q19Honest_Financial_Advice
Q19CEO_dont_Misreport
Q19Compliance_With_Law
Sig. (1-tailed) Q19Reasonable_Interest_Rates
Q19Payments_Fees_Transparency
Q19Account_Information_Confidentiality
Q19CEO_Cuts
Q19Financial_Inclusion
Q19Projects_With_Adverse_Impacts
Q19ValuedCustomer_Treating
Q19Honest_Financial_Advice
Q19CEO_dont_Misreport
Q19Compliance_With_Law
1.000 .627 .458
.627 1.000 .626
.458 .626 1.000
.046 .156 .261
.138 .277 .200
.123 .351 .436
.575 .613 .745
.449 .623 .667
.216 .363 .506
.326 .481 .683
.000 .000
.000 .000
.000 .000
.333 .069 .006
.094 .004 .028
.122 .000 .000
.000 .000 .000
.000 .000 .000
.019 .000 .000
.001 .000 .000
Correlation Matrixa
Q19Account_In
formation_Confi
dentiality Q19CEO_Cuts
Correlation Q19Reasonable_Interest_Rates
Q19Payments_Fees_Transparency
Q19Account_Information_Confidentiality
Q19CEO_Cuts
Q19Financial_Inclusion
Q19Projects_With_Adverse_Impacts
Q19ValuedCustomer_Treating
Q19Honest_Financial_Advice
Q19CEO_dont_Misreport
Q19Compliance_With_Law
Sig. (1-tailed) Q19Reasonable_Interest_Rates
Q19Payments_Fees_Transparency
Q19Account_Information_Confidentiality
Q19CEO_Cuts
Q19Financial_Inclusion
Q19Projects_With_Adverse_Impacts
Q19ValuedCustomer_Treating
Q19Honest_Financial_Advice
Q19CEO_dont_Misreport
Q19Compliance_With_Law
.458 .046 .138
.626 .156 .277
1.000 .261 .200
.261 1.000 .501
.200 .501 1.000
.436 .406 .513
.745 .260 .309
.667 .167 .338
.506 .589 .471
.683 .317 .337
.000 .333 .094
.000 .069 .004
.006 .028
.006 .000
.028 .000
.000 .000 .000
.000 .006 .001
.000 .056 .000
.000 .000 .000
.000 .001 .001
Correlation Matrixa
Q19Financial_I
nclusion
Q19Projects_W
ith_Adverse_Im
pacts
Correlation Q19Reasonable_Interest_Rates
Q19Payments_Fees_Transparency
Q19Account_Information_Confidentiality
Q19CEO_Cuts
Q19Financial_Inclusion
Q19Projects_With_Adverse_Impacts
Q19ValuedCustomer_Treating
Q19Honest_Financial_Advice
Q19CEO_dont_Misreport
Q19Compliance_With_Law
Sig. (1-tailed) Q19Reasonable_Interest_Rates
Q19Payments_Fees_Transparency
Q19Account_Information_Confidentiality
Q19CEO_Cuts
Q19Financial_Inclusion
Q19Projects_With_Adverse_Impacts
Q19ValuedCustomer_Treating
Q19Honest_Financial_Advice
Q19CEO_dont_Misreport
Q19Compliance_With_Law
.138 .123 .575
.277 .351 .613
.200 .436 .745
.501 .406 .260
1.000 .513 .309
.513 1.000 .462
.309 .462 1.000
.338 .569 .762
.471 .646 .595
.337 .577 .631
.094 .122 .000
.004 .000 .000
.028 .000 .000
.000 .000 .006
.000 .001
.000 .000
.001 .000
.000 .000 .000
.000 .000 .000
.001 .000 .000
Correlation Matrixa
Q19ValuedCust
omer_Treating
Q19Honest_Fin
ancial_Advice
Correlation Q19Reasonable_Interest_Rates
Q19Payments_Fees_Transparency
Q19Account_Information_Confidentiality
Q19CEO_Cuts
Q19Financial_Inclusion
Q19Projects_With_Adverse_Impacts
Q19ValuedCustomer_Treating
Q19Honest_Financial_Advice
Q19CEO_dont_Misreport
Q19Compliance_With_Law
Sig. (1-tailed) Q19Reasonable_Interest_Rates
Q19Payments_Fees_Transparency
Q19Account_Information_Confidentiality
Q19CEO_Cuts
Q19Financial_Inclusion
Q19Projects_With_Adverse_Impacts
Q19ValuedCustomer_Treating
Q19Honest_Financial_Advice
Q19CEO_dont_Misreport
Q19Compliance_With_Law
.575 .449 .216
.613 .623 .363
.745 .667 .506
.260 .167 .589
.309 .338 .471
.462 .569 .646
1.000 .762 .595
.762 1.000 .595
.595 .595 1.000
.631 .743 .637
.000 .000 .019
.000 .000 .000
.000 .000 .000
.006 .056 .000
.001 .000 .000
.000 .000 .000
.000 .000
.000 .000
.000 .000
.000 .000 .000
Correlation Matrixa
Q19CEO_dont_
Misreport
Q19Complianc
e_With_Law
Correlation Q19Reasonable_Interest_Rates
Q19Payments_Fees_Transparency
Q19Account_Information_Confidentiality
Q19CEO_Cuts
Q19Financial_Inclusion
Q19Projects_With_Adverse_Impacts
Q19ValuedCustomer_Treating
Q19Honest_Financial_Advice
Q19CEO_dont_Misreport
Q19Compliance_With_Law
Sig. (1-tailed) Q19Reasonable_Interest_Rates
Q19Payments_Fees_Transparency
Q19Account_Information_Confidentiality
Q19CEO_Cuts
Q19Financial_Inclusion
Q19Projects_With_Adverse_Impacts
Q19ValuedCustomer_Treating
Q19Honest_Financial_Advice
Q19CEO_dont_Misreport
Q19Compliance_With_Law
.216 .326
.363 .481
.506 .683
.589 .317
.471 .337
.646 .577
.595 .631
.595 .743
1.000 .637
.637 1.000
.019 .001
.000 .000
.000 .000
.000 .001
.000 .001
.000 .000
.000 .000
.000 .000
.000
.000
Determinant = .002a.
KMO and Bartlett's Test
Kaiser-Meyer-Olkin Measure of Sampling Adequacy.
Bartlett's Test of Sphericity Approx. Chi-Square
df
Sig.
.850
556.572
45
.000
Communalities
Initial Extraction
Q19Reasonable_Interest_Rates
Q19Payments_Fees_Transparency
Q19Account_Information_Confidentiality
Q19CEO_Cuts
Q19Financial_Inclusion
Q19Projects_With_Adverse_Impacts
Q19ValuedCustomer_Treating
Q19Honest_Financial_Advice
Q19CEO_dont_Misreport
Q19Compliance_With_Law
1.000 .617
1.000 .680
1.000 .717
1.000 .634
1.000 .558
1.000 .657
1.000 .788
1.000 .767
1.000 .758
1.000 .680
Extraction Method: Principal Component Analysis.
Total Variance Explained
Component
Initial Eigenvalues Extraction Sums of Squared Loadings
Total % of Variance Cumulative % Total % of Variance Cumulative %
1
2
3
4
5
6
7
8
9
10
5.229 52.290 52.290 5.229 52.290 52.290 4.528
1.627 16.275 68.564 1.627 16.275 68.564 3.516
.814 8.140 76.705
.619 6.193 82.897
.394 3.939 86.836
.368 3.683 90.520
.310 3.104 93.624
.288 2.878 96.502
.206 2.065 98.567
.143 1.433 100.000
Total Variance Explained
Component
Rotation Sums
of Squared
Loadingsa
Total
1
2
3
4
5
6
7
8
9
10
4.528
3.516
Extraction Method: Principal Component Analysis.
When components are correlated, sums of squared loadings cannot be added to obtain a total variance.a.
Component Number
10987654321
Eigenvalue
6
5
4
3
2
1
0
Scree Plot
Component Matrixa
Component
1 2
Q19Honest_Financial_Advi
ce
Q19ValuedCustomer_Treati
ng
Q19Compliance_With_Law
Q19Account_Information_C
onfidentiality
Q19CEO_dont_Misreport
Q19Payments_Fees_Trans
parency
Q19Projects_With_Adverse
_Impacts
Q19Financial_Inclusion
Q19CEO_Cuts
Q19Reasonable_Interest_R
ates
.857
.853
.824
.806
.784
.722
.709
.529 .528
.470 .643
.548 -.563
Extraction Method: Principal Component Analysis.
2 components extracted.a.
Pattern Matrixa
Component
1 2
Q19Payments_Fees_Transparency
Q19Reasonable_Interest_Rates
Q19ValuedCustomer_Treating
Q19Account_Information_Confidentiality
Q19Honest_Financial_Advice
Q19Compliance_With_Law
Q19CEO_Cuts
Q19Financial_Inclusion
Q19CEO_dont_Misreport
Q19Projects_With_Adverse_Impacts
.838
.837
.816
.793
.770
.595 .401
.836
.753
.732
.710
Extraction Method: Principal Component Analysis.
Rotation Method: Oblimin with Kaiser Normalization.a
Rotation converged in 7 iterations.a.
Structure Matrix
Component
1 2
Q19ValuedCustomer_Treating
Q19Honest_Financial_Advice
Q19Account_Information_Confidentiality
Q19Payments_Fees_Transparency
Q19Reasonable_Interest_Rates
Q19Compliance_With_Law
Q19CEO_dont_Misreport
Q19Projects_With_Adverse_Impacts
Q19CEO_Cuts
Q19Financial_Inclusion
.874 .450
.849 .495
.838 .404
.824
.740
.734 .607
.536 .829
.462 .785
.784
.747
Extraction Method: Principal Component Analysis.
Rotation Method: Oblimin with Kaiser Normalization.
Component Correlation Matrix
Component 1 2
1
2
1.000 .346
.346 1.000
Extraction Method: Principal
Component Analysis.
Rotation Method: Oblimin with
Kaiser Normalization.
Component Score Coefficient Matrix
Component
1 2
Q19Reasonable_Interest_R
ates
Q19Payments_Fees_Trans
parency
Q19Account_Information_C
onfidentiality
Q19CEO_Cuts
Q19Financial_Inclusion
Q19Projects_With_Adverse
_Impacts
Q19ValuedCustomer_Treati
ng
Q19Honest_Financial_Advi
ce
Q19CEO_dont_Misreport
Q19Compliance_With_Law
.247 -.163
.232 -.069
.209 .001
-.094 .338
-.052 .297
.015 .265
.213 .015
.196 .042
.032 .270
.138 .120
Extraction Method: Principal Component Analysis.
Rotation Method: Oblimin with Kaiser
Normalization.
Component Scores.
Component Score Covariance
Matrix
Component 1 2
1
2
1.119 .691
.691 1.119
Extraction Method: Principal
Component Analysis.
Rotation Method: Oblimin with
Kaiser Normalization.
Component Scores.
Reliability Analysis for ECP&LGP
Case Processing Summary
N %
Cases Valid
Excludeda
Total
92 100.0
0 .0
92 100.0
Listwise deletion based on all variables in the procedure.a.
Reliability Statistics
Cronbach's
Alpha
Cronbach's
Alpha Based on
Standardized
Items N of Items
.898 .900 6
Item Statistics
Mean Std. Deviation N
Q19Payments_Fees_Transparency
Q19Reasonable_Interest_Rates
Q19ValuedCustomer_Treating
Q19Account_Information_Confident
iality
Q19Honest_Financial_Advice
Q19Compliance_With_Law
4.26 .850 92
4.20 .975 92
4.34 .842 92
4.27 .939 92
4.29 .871 92
4.22 .936 92
Inter-Item Correlation Matrix
Q19Payments_
Fees_Transpar
ency
Q19Reasonabl
e_Interest_Rate
s
Q19ValuedCust
omer_Treating
Q19Account_In
formation_Confi
dentiality
Q19Payments_Fees_Trans
parency
Q19Reasonable_Interest_R
ates
Q19ValuedCustomer_Treati
ng
Q19Account_Information_C
onfidentiality
Q19Honest_Financial_Advi
ce
Q19Compliance_With_Law
1.000 .627 .613 .626 .623
.627 1.000 .575 .458 .449
.613 .575 1.000 .745 .762
.626 .458 .745 1.000 .667
.623 .449 .762 .667 1.000
.481 .326 .631 .683 .743
Inter-Item Correlation Matrix
Q19Honest_Fin
ancial_Advice
Q19Complianc
e_With_Law
Q19Payments_Fees_Trans
parency
Q19Reasonable_Interest_R
ates
Q19ValuedCustomer_Treati
ng
Q19Account_Information_C
onfidentiality
Q19Honest_Financial_Advi
ce
Q19Compliance_With_Law
.623 .481
.449 .326
.762 .631
.667 .683
1.000 .743
.743 1.000
Item-Total Statistics
Scale Mean if
Item Deleted
Scale Variance
if Item Deleted
Corrected Item-
Total
Correlation
Squared
Multiple
Correlation
Q19Payments_Fees_Trans
parency
Q19Reasonable_Interest_R
ates
Q19ValuedCustomer_Treati
ng
Q19Account_Information_C
onfidentiality
Q19Honest_Financial_Advi
ce
Q19Compliance_With_Law
21.32 14.108 .721 .581 .880
21.38 14.304 .567 .466 .905
21.24 13.613 .822 .718 .865
21.30 13.247 .776 .662 .871
21.28 13.568 .796 .719 .869
21.36 13.793 .686 .622 .885
Item-Total Statistics
Cronbach's
Alpha if Item
Deleted
Q19Payments_Fees_Trans
parency
Q19Reasonable_Interest_R
ates
Q19ValuedCustomer_Treati
ng
Q19Account_Information_C
onfidentiality
Q19Honest_Financial_Advi
ce
Q19Compliance_With_Law
.880
.905
.865
.871
.869
.885
Scale Statistics
Mean Variance Std. Deviation N of Items
25.58 19.434 4.408 6
Reliability Analysis for ETP&PHP
Case Processing Summary
N %
Cases Valid
Excludeda
Total
92 100.0
0 .0
92 100.0
Listwise deletion based on all variables in the procedure.a.
Reliability Statistics
Cronbach's
Alpha
Cronbach's
Alpha Based on
Standardized
Items N of Items
.809 .813 4
Item Statistics
Mean Std. Deviation N
Q19CEO_Cuts
Q19Financial_Inclusion
Q19CEO_dont_Misreport
Q19Projects_With_Adverse
_Impacts
3.16 1.252 92
3.18 1.195 92
3.92 1.061 92
3.71 1.218 92
Inter-Item Correlation Matrix
Q19CEO_Cuts
Q19Financial_I
nclusion
Q19CEO_dont_
Misreport
Q19Projects_W
ith_Adverse_Im
pacts
Q19CEO_Cuts
Q19Financial_Inclusion
Q19CEO_dont_Misreport
Q19Projects_With_Adverse
_Impacts
1.000 .501 .589 .406
.501 1.000 .471 .513
.589 .471 1.000 .646
.406 .513 .646 1.000
Item-Total Statistics
Scale Mean if
Item Deleted
Scale Variance
if Item Deleted
Corrected Item-
Total
Correlation
Squared
Multiple
Correlation
Q19CEO_Cuts
Q19Financial_Inclusion
Q19CEO_dont_Misreport
Q19Projects_With_Adverse
_Impacts
10.82 8.394 .593 .413 .779
10.79 8.649 .596 .368 .776
10.05 8.711 .707 .545 .729
10.27 8.376 .624 .475 .762
Item-Total Statistics
Cronbach's
Alpha if Item
Deleted
Q19CEO_Cuts
Q19Financial_Inclusion
Q19CEO_dont_Misreport
Q19Projects_With_Adverse
_Impacts
.779
.776
.729
.762
Scale Statistics
Mean Variance Std. Deviation N of Items
13.98 14.263 3.777 4
Regression Analysis for Research Objective Two
Variables Entered/Removeda
Model
Variables
Entered
Variables
Removed Method
1 REGR factor
score 2 for
analysis 1,
REGR factor
score 1 for
analysis 1b
. Enter
Dependent Variable: I think that the more meaningful the social activities a bank engages in are, the more
preference will be given to them
a.
All requested variables entered.b.
Model Summaryb
Model R R Square
Adjusted R
Square
Std. Error of the
Estimate
1 .556a
.309 .294 .811
Predictors: (Constant), REGR factor score 2 for analysis 1, REGR factor score 1 for analysis 1a.
Dependent Variable: I think that the more meaningful the social activities a bank engages in are, the more
preference will be given to them
b.
ANOVAa
Model
Sum of
Squares df Mean Square F Sig.
1 Regression
Residual
Total
26.238 2 13.119 19.929 .000b
58.588 89 .658
84.826 91
Dependent Variable: I think that the more meaningful the social activities a bank engages in are, the more
preference will be given to them
a.
Predictors: (Constant), REGR factor score 2 for analysis 1, REGR factor score 1 for analysis 1b.
Coefficientsa
Model
Unstandardized Coefficients
Standardized
Coefficients
t Sig.
95.0%
Confidence ...
B Std. Error Beta Lower Bound
1 (Constant)
ECP&LGP
ETP&PHP
3.543 .085 41.891 .000 3.375 3.712
.291 .091 .301 3.210 .002 .111 .471
.362 .091 .375 3.993 .000 .182 .542
Coefficientsa
Model
95.0%
Confidence ...
Upper Bound
1 (Constant)
ECP&LGP
ETP&PHP
3.712
.471
.542
Dependent Variable: I think that the more meaningful the social activities a bank engages in are, the more
preference will be given to them
a.
Residuals Statisticsa
Minimum Maximum Mean Std. Deviation N
Predicted Value
Residual
Std. Predicted Value
Std. Residual
1.45 4.31 3.54 .537 92
-2.203 1.402 .000 .802 92
-3.900 1.435 .000 1.000 92
-2.716 1.728 .000 .989 92
Dependent Variable: I think that the more meaningful the social activities a bank engages in are, the more
preference will be given to them
a.
Appendix J- Research Objective Three- Correlation Coefficient and
Reliability analyses
Descriptive Statistics
Mean Std. Deviation N
Q21CSR_strategy
Q21Confidence
Q21Reputable_Business
Q21High_CSR_rating
Q22
3.91 .847 92
4.00 .784 92
3.98 .784 92
3.98 .784 92
3.54 .965 92
Correlations
Q21CSR_strate
gy Q21Confidence
Q21Reputable_
Business
Q21CSR_strategy Pearson Correlation
Sig. (2-tailed)
N
Q21Confidence Pearson Correlation
Sig. (2-tailed)
N
Q21Reputable_Business Pearson Correlation
Sig. (2-tailed)
N
Q21High_CSR_rating Pearson Correlation
Sig. (2-tailed)
N
Q22 Pearson Correlation
Sig. (2-tailed)
N
1 .695**
.543**
.593**
.000 .000 .000
92 92 92 92
.695**
1 .643**
.679**
.000 .000 .000
92 92 92 92
.543**
.643**
1 .732**
.000 .000 .000
92 92 92 92
.593**
.679**
.732**
1
.000 .000 .000
92 92 92 92
.327**
.464**
.495**
.582**
.001 .000 .000 .000
92 92 92 92
Correlations
Q21High_CSR
_rating Q22
Q21CSR_strategy Pearson Correlation
Sig. (2-tailed)
N
Q21Confidence Pearson Correlation
Sig. (2-tailed)
N
Q21Reputable_Business Pearson Correlation
Sig. (2-tailed)
N
Q21High_CSR_rating Pearson Correlation
Sig. (2-tailed)
N
Q22 Pearson Correlation
Sig. (2-tailed)
N
.593**
.327**
.000 .001
92 92
.679**
.464**
.000 .000
92 92
.732**
.495**
.000 .000
92 92
1 .582**
.000
92 92
.582**
1
.000
92 92
Correlation is significant at the 0.01 level (2-tailed).**.
Correlations
Q21CSR_strate
gy Q21Confidence
Q21Reputable_
Business
Q21CSR_strategy Pearson Correlation
Sig. (2-tailed)
N
Q21Confidence Pearson Correlation
Sig. (2-tailed)
N
Q21Reputable_Business Pearson Correlation
Sig. (2-tailed)
N
Q21High_CSR_rating Pearson Correlation
Sig. (2-tailed)
N
1 .695
**
.543
**
.593
**
.000 .000 .000
92 92 92 92
.695**
1 .643**
.679**
.000 .000 .000
92 92 92 92
.543**
.643**
1 .732**
.000 .000 .000
92 92 92 92
.593**
.679**
.732**
1
.000 .000 .000
92 92 92 92
.327**
.464**
.495 .582**
Correlations
Q21High_CSR
_rating
I think that the
more
meaningful the
social activities
a bank engages
in are, the more
preference will
be given to
them
Q21CSR_strategy Pearson Correlation
Sig. (2-tailed)
N
Q21Confidence Pearson Correlation
Sig. (2-tailed)
N
Q21Reputable_Business Pearson Correlation
Sig. (2-tailed)
N
Q21High_CSR_rating Pearson Correlation
Sig. (2-tailed)
N
.593**
.327**
.000 .001
92 92
.679**
.464**
.000 .000
92 92
.732**
.495**
.000 .000
92 92
1 .582**
.000
92 92
.582**
1Correlations
Q21CSR_strate
gy Q21Confidence
Q21Reputable_
Business
I think that the more
meaningful the social
activities a bank engages in
are, the more preference
will be given to them
Pearson Correlation
Sig. (2-tailed)
N
.327**
.464**
.495**
.582**
.001 .000 .000 .000
92 92 92 92
Correlations
Q21High_CSR
_rating
I think that the
more
meaningful the
social activities
a bank engages
in are, the more
preference will
be given to
them
I think that the more
meaningful the social
activities a bank engages in
are, the more preference
will be given to them
Pearson Correlation
Sig. (2-tailed)
N
.582**
1
.000
92 92
Correlation is significant at the 0.01 level (2-tailed).**.
Reliability
Scale: ALL VARIABLES
Case Processing Summary
N %
Cases Valid
Excludeda
Total
92 100.0
0 .0
92 100.0
Listwise deletion based on all variables in the procedure.a.
Reliability Statistics
Cronbach's
Alpha
Cronbach's
Alpha Based on
Standardized
Items N of Items
.781 .800 5
Item Statistics
Mean Std. Deviation N
Q21CSR_strategy
Q21Confidence
Q21Reputable_Business
Q21High_CSR_rating
Would you recommend
your bank based on its
socially responsible
behaviour ?
3.91 .847 92
4.00 .784 92
3.98 .784 92
3.98 .784 92
3.09 .957 92
Inter-Item Correlation Matrix
Q21CSR_strate
gy Q21Confidence
Q21Reputable_
Business
Q21High_CSR
_rating Q23
Q21CSR_strategy
Q21Confidence
Q21Reputable_Business
Q21High_CSR_rating
Q23
1.000 .695 .543 .593 -.004
.695 1.000 .643 .679 .102
.543 .643 1.000 .732 .208
.593 .679 .732 1.000 .252
-.004 .102 .208 .252 1.000
Item-Total Statistics
Scale Mean if
Item Deleted
Scale Variance
if Item Deleted
Corrected Item-
Total
Correlation
Squared
Multiple
Correlation
Q21CSR_strategy
Q21Confidence
Q21Reputable_Business
Q21High_CSR_rating
Would you recommend
your bank based on its
socially responsible
behaviour ?
15.04 6.130 .578 .527 .733
14.96 5.954 .706 .614 .692
14.98 5.934 .713 .580 .690
14.98 5.758 .771 .637 .670
15.87 7.521 .159 .105 .879
Item-Total Statistics
Cronbach's
Alpha if Item
Deleted
Q21CSR_strategy
Q21Confidence
Q21Reputable_Business
Q21High_CSR_rating
Would you recommend
your bank based on its
socially responsible
behaviour ?
.733
.692
.690
.670
.879
Reliability
Scale: ALL VARIABLES
Reliability Statistics
Cronbach's
Alpha
Cronbach's
Alpha Based on
Standardized
Items N of Items
.879 .880 4
Item Statistics
Mean Std. Deviation N
Q21CSR_strategy
Q21Confidence
Q21Reputable_Business
Q21High_CSR_rating
3.91 .847 92
4.00 .784 92
3.98 .784 92
3.98 .784 92
Inter-Item Correlation Matrix
Q21CSR_strate
gy Q21Confidence
Q21Reputable_
Business
Q21High_CSR
_rating
Q21CSR_strategy
Q21Confidence
Q21Reputable_Business
Q21High_CSR_rating
1.000 .695 .543 .593
.695 1.000 .643 .679
.543 .643 1.000 .732
.593 .679 .732 1.000
Item-Total Statistics
Scale Mean if
Item Deleted
Scale Variance
if Item Deleted
Corrected Item-
Total
Correlation
Squared
Multiple
Correlation
Q21CSR_strategy
Q21Confidence
Q21Reputable_Business
Q21High_CSR_rating
11.96 4.372 .687 .512 .867
11.87 4.356 .779 .614 .829
11.89 4.494 .726 .577 .850
11.89 4.384 .768 .620 .833
Item-Total Statistics
Cronbach's
Alpha if Item
Deleted
Q21CSR_strategy
Q21Confidence
Q21Reputable_Business
Q21High_CSR_rating
.867
.829
.850
.833
Appendix K- Research Objective Four - Hierarchical
Regression Analysis
Variables Entered/Removeda
Model Variables Entered
Variables
Removed Method
1
2
SectionC_final1b
. Enter
Q22b
. Enter
Dependent Variable: Q20a.
All requested variables entered.b.
Model Summary
Model R R Square
Adjusted R
Square
Std. Error of the
Estimate
1
2
.714a
.510 .505 .784
.760b
.577 .568 .732
Predictors: (Constant), REGR factor score 1 for analysis 1a.
Predictors: (Constant), REGR factor score 1 for analysis 1, I think that the more meaningful the social activities
a bank engages in are, the more preference will be given to them
b.
ANOVAa
Model
Sum of
Squares df Mean Square F Sig.
1 Regression
Residual
Total
2 Regression
Residual
Total
57.604 1 57.604 93.733 .000b
55.309 90 .615
112.913 91
65.185 2 32.592 60.775 .000c
47.728 89 .536
112.913 91
Dependent Variable: I think that, when/if I switch banks, I will form my decision highly based on their social
responsibly activities
a.
Predictors: (Constant), REGR factor score 1 for analysis 1b.
Predictors: (Constant), REGR factor score 1 for analysis 1, I think that the more meaningful the social activities
a bank engages in are, the more preference will be given to them
c.
Coefficientsa
Model
Unstandardized Coefficients
Standardized
Coefficients
t Sig.B Std. Error Beta
1 (Constant)
SectionC_final1
2 (Constant)
SectionC_final1
Q22
3.109 .082 38.036 .000
.796 .082 .714 9.682 .000
1.841 .346 5.328 .000
.606 .092 .544 6.600 .000
.358 .095 .310 3.760 .000
Dependent Variable: Q20a.
Excluded Variablesa
Model Beta In t Sig.
Partial
Correlation
Collinearity
Statistics
Tolerance
1 Q22 .310b
3.760 .000 .370 .699
Dependent Variable: Q20a.
Predictors in the Model: (Constant), SectionC_final1b.

MBA Dissertation - The voice of the Stakeholder: Customer attitudes to the role of Corporate Social Responsibility (CSR) in the UK Banking Sector since the Financial Crisis (2007)

  • 1.
    The voice ofthe Stakeholder Customer attitudes to the role of Corporate Social Responsibility (CSR) in the UK Banking Sector since the Financial Crisis (2007) Author: Amany Hamza Submitted in partial fulfilment of the requirements for the degree of MBA Supervisor: Dr. Alireza Nazarian University of West London August 2014
  • 2.
    Acknowledgments First and foremost,I am bound to express my heartfelt gratitude to my husband for his encouragement and forbearance as well as my lovely kids who have been extremely patient with me during this challenging task. The successful completion of this work is actually attributed to their unlimited support throughout the whole process of writing my dissertation. On the professional level, I wish to express my profound gratitude to my supervisor, Dr. Alireza Nazarian, whom I am forever indebted for the immense advice and guidance he has given me. I would also like to sincerely thank the study participants who took the time to respond to the study questionnaire.
  • 3.
    Abstract Seven years onfrom the tumultuous events of 2007 financial crisis (FC), yet, many aspects of the banking industry are unrecognisable when compared to the pre-crisis era despite the growth in the UK economy that seems finally to be gaining traction. One consequence of the ethical violations and corporate excess malfeasance of many banks that brought UK banking industry into the firing line (Herzig & Moon, 2011; Bouvain et al, 2013) has been the call for reforms concerning its responsibilities towards the society (Williams & Elliott, 2010; Sun et al, 2010). This study attempts to get to the heart of much of the debate about CSR development in light of that FC. It is concerned with the perception of CSR activities in the post FC, the likelihood of the convergence between banks CSR activities and its customer-stakeholder needs and the implications of CSR on their attitudes as well as on Corporate Reputation (CR). The study reviews various works of literature concerning the topic at hand. The hypothesised relationships between CSR and respectively customer satisfaction, customer purchasing decision and CR were evaluated using a quantitative method based on a positivist research paradigm. Primary data was sourced from 92 usable questionnaires (response rate 46%) from UK banks customers. Drawing from the analysis, it was found that there is a significant positive relationship between perceived CSR activities and customer-stakeholder satisfaction in the post FC which is in line with literature of stakeholder model and supports the views of Luo & Bhattacharya (2006). With reference to CSR practices and customer purchasing decision, the results revealed a positive significant relationship between them, also consistent with the results of the study of Klein & Dawar (2004). Moreover, the analysis of this relation contributed to CSR literature by investigating the multidisciplinary domain of CSR on customer purchasing intention. CSR was also found to have a significant positive relationship with Corporate Reputation which shares the view of Reputation Institute (2009, cited in Trotta et al, 2011). Remarkably, the findings indicated a partial mediation effect of CSR on the relationship between CR and customer behavioural intention. Concluding remarks highlight further theoretical development of CSR and managerial implications as well as limitations for future research.
  • 4.
    Table of Contents Acknowledgments...................................................................................................................................2 Abstract...................................................................................................................................................3 Tableof Contents....................................................................................................................................4 Chapter 1: Introduction ..........................................................................................................................6 1.1. INTRODUCTION ...............................................................................................................................6 1.2. BACKGROUND.................................................................................................................................7 1.3. THE PROBLEM STATEMENT ...............................................................................................................9 1.4. RESEARCH AIM AND OBJECTIVES......................................................................................................11 1.5. SCOPE OF THE DISSERTATION...........................................................................................................12 1.6. STRUCTURE OF THE DISSERTATION....................................................................................................14 1.7. CONCLUSION ................................................................................................................................14 Chapter 2: Literature Review................................................................................................................15 2.1. INTRODUCTION .............................................................................................................................15 2.2. FRAMING CSR ..............................................................................................................................15 2.3. STRATEGIC CSR.............................................................................................................................28 2.4. CONCLUSION ................................................................................................................................38 Chapter 3: Methodology.......................................................................................................................39 3.1. INTRODUCTION .............................................................................................................................39 3.2. RESEARCH PHILOSOPHY ..................................................................................................................39 3.3. RESEARCH DESIGN.........................................................................................................................46 3.4. DATA TREATMENT AND DATA ANALYSIS TECHNIQUES..........................................................................65 3.5. CONCLUSION ................................................................................................................................71 Chapter 4: Analysis and Discussion of Findings ....................................................................................72 4.1. INTRODUCTION .............................................................................................................................72 4.2. DESCRIPTIVE STATISTICS .................................................................................................................72 4.3. EMPIRICAL FINDINGS OF PARAMETRIC DATA ......................................................................................75 4.4. DISCUSSION OF FINDINGS ...............................................................................................................87 4.5. CONCLUSION ................................................................................................................................92 Chapter 5: Conclusion and Recommendations.....................................................................................93 5.1. INTRODUCTION .............................................................................................................................93 5.2. CONCLUSION ................................................................................................................................93 5.3. PRACTITIONER CONTRIBUTIONS .......................................................................................................94
  • 5.
    5.4. THEORETICAL CONTRIBUTIONS.........................................................................................................95 5.5.RECOMMENDATIONS FOR FUTURE RESEARCH AND RESEARCH LIMITATIONS..............................................96 References ............................................................................................................................................98 Appendices..........................................................................................................................................106 APPENDIX A – SURVEY EMAIL INVITATION ...................................................................................................106 APPENDIX B1 – SURVEY FIRST REMINDER....................................................................................................107 APPENDIX B2 – SURVEY FINAL REMINDER ...................................................................................................108 APPENDIX C – SURVEY .............................................................................................................................109 APPENDIX D – ACRONYMS........................................................................................................................118 APPENDIX E – RESEARCH OBJECTIVE ONE – RELIABILITY ANALYSIS 1................................................................119 APPENDIX F – RESEARCH OBJECTIVE ONE – FACTOR ANALYSIS (BEFORE COMPONENT EXTRACTION) ....................134 APPENDIX G – RESEARCH OBJECTIVE ONE- FACTOR AND RELIABILITY ANALYSES ................................................225 APPENDIX H – RESEARCH OBJECTIVE ONE – REGRESSION ANALYSIS.................................................................239 APPENDIX I – RESEARCH OBJECTIVE TWO – FACTOR AND RELIABILITY ANALYSES................................................241 APPENDIX J – RESEARCH OBJECTIVE THREE – CORRELATION COEFFICIENT AND REGRESSION ANALYSES.................258 APPENDIX K – RESEARCH OBJECTIVE FOUR – HIERARCHICAL REGRESSION ANALYSIS...........................................264
  • 6.
    Chapter 1: Introduction 1.1.INTRODUCTION To some, 2013 has showed modest improvements in the banking industry, making 2014 the year that banks might see their best profits since the beginnings of the financial crisis (FC) according to S&P (Standard & Poor) credit rating agency (Croucher, 2014). To others, the UK banking industry entered the global lexicon of infamy whereby the ten leading banks have cost the industry hefty fines of nearly £148bn – according to the LSE’s (London School of Economics) report – with a string of scandals since the FC. Notwithstanding, the study by the LSE did not include the Standard Chartered settlement of £407 million last year with the US authorities for the violation of breaching the sanctions with Iran. Still, the fines and financial penalties of £148bn are, ironically, larger than the economic output of a country such as Ireland (Davies, 2013). The partial nationalisation and bail out of two of the country’s biggest banks – Lloyds Banking Group and the Royal Bank of Scotland (RBS) – using the UK taxpayer funds have exacerbated the industry’s reputation to the extent that the FC is regarded as analogous to reputational crisis per se (Trotta et al, 2011). As 2014 unfolds, the preceding controversial state of the UK banking industry in the post FC raised pertinent questions on the development of Corporate Social Responsibility (hereafter CSR) activities to meet its customer-stakeholders’ expectations and, concurrently, address the dynamic demands of the social system. That is, the tenet of CSR has resurged to figure prominently in the academic and business community debate. Yet, to date, there is a dearth of academic literature about CSR in the financial services which spans a wide range of areas from its characteristics and nature to its implications on corporate performance and customers’ attitudes (Chomvilailuk & Butcher, 2010; Bennett & Kottasz, 2011; Bouvain et al,
  • 7.
    2013). Drawing fromthese remarks, this study intends to pinpoint key insights in this field and shed the light on issues impeding its development, hence offer a managerial agenda to identify and stimulate practices consistent with commonly recognised norms and ethical behaviour. 1.2. BACKGROUND Although the CSR credo has been with the business world for centuries (Ahenkora et al, 2013), little is known of CSR literature prior to the 1950s. Some substantial writings can be traced back as early as the 1776 manifested in the notion of the invisible hand published in Adam Smith’s vintage book titled The Wealth of Nations. This view holds that exigencies of profit justify self-interest pursuit and, in tandem, respond to societal demands insofar free market mechanism is allowed. Smith had set a precedent to the neoliberal advocates of shareholder principles in which the sole fiduciary duty of business is wealth creation for its owners (Garriga & Mele, 2004; Carroll & Shabana, 2010). On the other hand, Andrew Carneige, in his seminal publication, The Gospel of Wealth (1889), argued fervently that business has a broader role towards society at large given the credence nature of managers as public trustees (Pearce II & Doh, 2005). As such, CSR intensified as of 1960s with the emergence of academic and managerial interests (Garriga & Mele, 2004; Carroll & Shabana, 2010) to contribute either to the expansion of business’ broad role towards society or the contraction and resistant advocated by the shareholder view. The dichotomy between the narrow wealth creation for shareholders and the holistic view of business societal role towards society is mirrored in the current state of banking industry. The line of thinking developed in this thesis belongs to the latter stream clustered around the societal paradigm given the interrelationship rationalisation in the business-society interactions. In this context, business seeks to integrate both explicit and implicit societal
  • 8.
    concerns in itsDNA (its strategy and culture) (EU Commission, 2001 cited in Decker, 2004). One such integrative framework incorporates business responsiveness by accommodating explicit claims together with evolving proactive strand from addressing implicit concerns (Wood, 1991). By doing so, some empirical researches, in particular since last decade, consent that the aggregation of external consonance and internal consistency to operationalise societal obligations can reap many tangible advantages; in essence, this can lead to stimulate durable relationships with broader constituency (e.g. Maignan & Ferrell, 2001; Bhattarcharya & Sen, 2001). Although these endeavour to bring CSR from ideology to reality, extant studies lack analytical rigour given the tendency to justify CSR in terms of a direct link to corporate financial performance as the critical criterion (e.g. McWilliams & Siegel, 2001; Pomering & Dolnicar, 2009; Carroll & Shabana, 2010). By doing so, academic research address one dimension of CSR though is considered a multidimensional construct based on the embodiment of economic, social, ethical and environmental responsibilities that business should strive to uphold at any given time (Carroll, 1979). This has contributed to equivocal results of the CSR effects on the corporate financial performance in which empirical support falls short by directly measuring a non-economic construct – CSR – using economic metrics. Given the nature of CSR as based on a qualitative relationship between business and society, measurement should employ mediating variables to gauge this relationship. Accordingly, the empirical research was primarily produced from the corporate perspective whereas the effects of CSR on customers were under-researched (Chomvilailuk & Butcher, 2010). While, Bhattacharya & Sen (2001) called for exploring CSR outcomes from customers
  • 9.
    perspective, most ofacademic research addressed consumer goods with little investigation of the services business (McDonald & Thiele, 2007). Noting these gaps in the CSR academic literature, this study tends to fill this void and put forward propositions for verifiable criteria for business success voiced by customer stakeholder. 1.3. THE PROBLEM STATEMENT It was the best of times; it was the worst of times… so begins Charles Dickens “A Tale of Two Cities” The increased public scrutiny of business behaviour since the near-death experience of the global FC has borne witness to radical change in the bank industry by espousing societal implementations to align its institutional activities with its stakeholder demands. In this sense, it can regain the lost trust in business while also avert new regulations of closer scrutiny of its conduct (Bouvain et al, 2013). In other words, it can be argued that banks have rethought their role in society in which parity has once again reverted to this industry (Condosta, 2012). Recalling Charles Dickens quotation, the state of the banking industry is the worst of times and the banking community has not learnt the lesson from the FC. Seemingly, this is attributed to many issues that remain unresolved whereby a series of jaw-dropping scandals are in flux. Cynically, in 2013, Lloyds was fined £28million for exploiting customers by introducing a flawed incentive scheme between 2010 and 2012 (Shannon, 2013), while RBS has been accused of pushing 'viable' businesses into default in order to seize their properties and make a profit for the bank (Parker & Moore, 2013). A large portion of these big losses were incurred in the subsequent years of the FC in 2007, hence the CSR practices of the banking sector were called into question. There is doubt that these causalities lie in
  • 10.
    the irresponsible behavioursof these practices, associated with the inability of either these practices or the external structures of regulation to prevent these behaviours. 1.3.1. RESEARCH QUESTION Against this backdrop, this study’s fundamental question emerged as whether the current CSR activities in the UK banking industry have acquired accepted resonance through the inclusion of societal expectations in the years that followed the FC, in particular: Has the financial crisis been a wake-up call for CSR activities to resonate with customer- stakeholder expectations to create sustainable business? 1.3.2. THE DEVELOPMENT OF THE RESEARCH HYPOTHESES The following hypotheses were developed to help answer the aforementioned question. The dominant debate on favouring CSR or refuting it has populated the literature that there is no consensus on its conceptual or its practical implementation. The manifest failure of CSR to conceive the dynamics of business and social systems is apparent in Bennett & Kottasz’ (2012) claim that the British public’s evaluation of both the integrity and calibre of banking industry has declined. On the other hand, there is the proposition that banks have embraced socially responsible behaviour to address the needs of its customer-stakeholders in the post FC of 2007. This formulated the assumption – first hypothesis – as: H01: There is a relationship between perceived bank’s CSR activities and customer- stakeholder satisfaction in the post-financial crisis of 2007. The other hypotheses suggested pinning down a management agenda that elicit favourable customer attitudes. The recent surge of ethical and social screened investment acknowledge the possibility that there are customers who support socially responsible practices (Peters, 2007) and are likely to influence their behavioural intention (Bhattacharya & Sen, 2001). Hence the researchable hypothesis was:
  • 11.
    H02: There isa relationship between CSR practices and customer-stakeholders’ behavioural intention. CSR is regarded as a form of investment that constitutes sustainable competitive advantages. In this vein, Porter & Kramer (2006) argue that satisfying the economic and non-economic demands of stakeholders incorporates creating a solid reputation in the marketplace by gaining society confidence. More so, it is considered the single most important commodity which all transactions and trade are based upon in the banking industry and, in the absence of it, the banking system reputation is on the line (Rothschild, 2013). This led to the hypothesis: H03: There is a relationship between CSR fit practices and bank reputation. The last hypothesis ascribed whether CSR practices mediate the link between customer- stakeholders' behavioural intentions and banks reputation: H04: There is a mediation effect of CSR practices in the relationship between customer- stakeholders' behavioural intentions and banks reputation. 1.4. RESEARCH AIM AND OBJECTIVES This study aimed to contribute towards a dynamic evolution of the CSR literature that is echoed by the emerging norms and expectations of customer-stakeholders in the post FC of 2007 within the context of UK banking sector. This research sought out to investigate the likelihood of CSR development in the banking context to meet customer-stakeholders emerging expectations. To this end, the objectives were based on: • investigate whether perceived CSR activities in the post FC of 2007 have an impact on banks’ customer-stakeholders satisfaction.
  • 12.
    • evaluate whetherthere is a relationship between CSR practices and bank customer- stakeholder behavioural intention (purchase behaviour). • determine whether there is a relationship between CSR fit practices and bank reputation. • investigate whether CSR practices mediates the relationship between bank reputation and stakeholders' behavioural intentions. • provide an interdisciplinary and systematic framework for CSR literature by delineating the customer attitudes towards a multidimensional CSR activities • analyse pertinent literature underlying the CSR and Corporate Reputation (CR) link 1.5. SCOPE OF THE DISSERTATION Corresponding to the research aim, the scope at hand was articulated around the normative factor of social perceived value of the banking CSR activities in the post FC and the strategic potential of CSR to create value for both the corporate entity and its constituencies. In this setting, the analysis was derived from customer stakeholder-based views of CSR in which fourfold of expectations – namely economic, ethical, legal and philanthropic of the so-called Carroll’s CSR pyramid model (1979) – were used as a proxy for these views. The study’s theoretical framework and analysis incorporated a pragmatic approach to CSR by reconciling the emergent post FC normative views of customer stakeholder and business’ socially accepted activities obtained from the empirical analysis into a consolidative construct of CSR development that reaps competitive advantage to contribute to business financial well-being or, in other words, developing a strategic CSR that yields value-creation to both ends. Building on this distinction, this thesis contributed to the literature of CSR by investigating the attitude of customer-stakeholder towards multidimensional social responsibilities. Furthermore, it scrutinized the case for strategic CSR to justify the
  • 13.
    pragmatic approach toCSR activities in the banking industry based on the mediation effect of CSR on the relationship between CR and customer attitude. It is acknowledged that CR constitutes strategic advantage that is ascribable to the reputational capital in which businesses leverage intangible organisational resource (Maden et al, 2012; Peters, 2007). The notion of CR is rooted in perceptions. Hence, it is argued that the point of departure is that CR is a collective representation of behaviour and activities carried out by business to render valued results to various constituents (Caruana, 2008) and therefore provide signals to that reduce uncertainty when customers choose among products (Bouvain et al, 2013). This is particularly evident for services segment as it is associated with high-involvement in which consumers’ process information actively before making a purchase decision (Pomering & Dolnicar, 2009). To accommodate this research scope, a web-based questionnaire was conducted for which a convenience – non-probability – sampling method was employed. Consequently, the study followed a deductive research strategy in which collected quantitative data was produced by customers resident in the UK against the banking industry. The rationale for this approach is considered justifiable as the UK banking sector is dominated by a few very large banks making Britain one of the most concentrated banking systems in the world (Chalabi, 2014). Moreover, it is also based on the collective identity elicited by the impact of the FC and mainly in the present context of collective culpability (Bennett & Kottasz, 2012). In addition, the intensity of the banking scandals, since the acute crisis broke out in summer 2007, made it apparent that it is not just one part of banking that has problems; it is probably the whole sector.
  • 14.
    1.6. STRUCTURE OFTHE DISSERTATION This introductory chapter underpins the foundation of the study. Chapter 2 critically discusses comprehensive literature involving the topic at hand. In Chapter 3, the methodology is outlined through the adoption of a quantitative method where a survey was developed through which customers voiced their opinions on banks CSR activities in the post FC of 2007. Chapter 4 furnished the set of analyses that were utilised to form the study findings in order to answer the Research Question. The final chapter, Chapter 5, brings it all together through the conclusion and recommendations. 1.7. CONCLUSION This first chapter introduced the topic of the research, setting the foundation by demonstrating CSR background and history. It then shed light on the formulation of the Problem Statement leading to the Research Question. This was elaborated by discussing the development of the Research Hypotheses. The Research Aim, Objectives and Scope were then presented and, finally, the structure of this dissertation was then laid out.
  • 15.
    Chapter 2: LiteratureReview 2.1. INTRODUCTION This chapter presents an overview of distinct but integrated realms of literature. These include CSR and CR. The opening section starts with critically recounting the genesis of CSR. Afterwards, it synthesises key arguments to pursue insights into the role of business in society to evaluate CSR construct in the twenty-first century. Guided by Carroll’s (1991) CSR model, the definition of CSR is then discussed. The second section explores the literature regarding Strategic CSR. A review of customer-stakeholders’ attitudes towards CSR is then addressed to determine what has been proposed and found regarding the theoretical relationships between the two domains. Thereafter, it demonstrates relevant theoretical framework on the relationship between CSR and CR. A discussion of the mediation effect of CSR marks the end of the chapter. 2.2. FRAMING CSR The high profile scandals and ethical violations of some corporate entities of the early 1980s and mid 2000s coupled with many new age problems – manifested in terms of poverty, artificial market bubbling and the like (Louche et al, 2010, Sun et al, 2010) – have brought contemporary business under siege by critical public scrutiny of its behaviour and its raison d'être in society (Pendse, 2012). Underpinning these issues is the lack of a socially responsible behaviour of businesses that contributed to the resurgence of interest in CSR. A casual glance back over mid-20th century in business management reveals the upward surge of the quest for businesses to embrace a responsible ethical behaviour in response, most likely, to the negative externalities of its operations and activities (Pomering & Donicar, 2009) and the recurring repercussion of the capitalism model. Beyond this proposition,
  • 16.
    cynics of CSRposit that it implies a risk to modern corporations of damaging them through the discussion of their weaknesses instead of praising their strengths (Blowfield & Murray, 2008). A contrasting view holds that sane corporations have responsibility towards society to ameliorate the adverse impacts which they create to adhere to their ascribed role in society and apply ethical and social standards to their business (Carroll & Shabana, 2010; Lindgreen & Swaen, 2010). In support, Hay & Gray (1974) opined that the development of CSR is touted as Quality of Life Management. Furthermore, the flurry of literature about CSR in 1960s and 1970s has promoted the theoretical context for corporate responsibility (Blowerfield & Murray, 2008). However, it also spawned an array of overlapping concepts that demonstrates the quest to incorporate CSR agendas that acknowledge the interests of constituent groups in society (Maon et al, 2009) and the discernibly changes in business’s relationship with other elements of society (Branco & Rodrigues, 2007; Smissen, 2012). This rather a concise sketch of the variation dominated the CSR premise since the second half of the 20th century in which a philosophically and economically intriguing debate on the proper role of CSR has been taken place (Garriga & Mele, 2004). Set against this outlook, the notion of CSR is regarded as an immensely contested construct that convey vividly the long-standing debate between two discernible streams of thought characterised as the neoliberal classic perspective of shareholder sovereignty and the neo- Keynesian model that champions the stakeholder paradigm (Chomvilailuk & Butcher, 2010; Mullerat, 2010). To illustrate this dilemma, key arguments around a bundle of questions surrounding the determinants and dimension of CSR emerged with regards to the fundamental purpose and responsibilities of businesses. Questions were raised about the
  • 17.
    role of thebusiness in society, its legitimate goal, the motives of CSR, the scope of the managerial responsibility, the rationales concerned with business pursuing doing good to do well and whether business’s primary endeavour to maximise the wealth creation of its stockowners is synonymous to greed. The answers given have been forged by a proliferation of theories and approaches that contributed to the development of CSR analysis (Garriga & Mele, 2004). Noticeably, a plethora of cognate concepts such as stakeholder management, corporate citizenship, sustainable business and business ethics have been developed in an effort to justify arguments for why management needs to align corporation and societal values to reap long-term prosperity (Carroll & Shabana, 2010; Herzig & Moon, 2011). While other concepts generated such as value based management or enlightened value maximisation advocated by contemporary adherents to the classical view (Martin et al, 2009). Despite the rise of these new concepts that are vying to supplant CSR to be the descriptor of the field, the term Corporate Social Responsibility still serves as the reference point in both the academic domain and the management realm. Yet the development of CSR unfolded in uneven ways, albeit the theoretical context for CSR is evolving, the practitioner communities might lag behind for the lack of cut-clear vision of reliable guidance and standards to evaluate and control the actions of corporations (Frederick, 2006). McWilliams & Siegel (2001) and McWilliams et al (2006), on the other hand, contend that CSR became a mainstream in many business practices whereas others might eschew the inclusion of societal values into their practices concerned about such efforts being portrayed as dereliction of their duty to the business owners or subvert corporate resources.
  • 18.
    Notwithstanding, the abundantliterature on CSR yet to date there is no definite consensus exits on the definition of CSR given the complexity and the competing challenges expressed by key stakeholders (Duarte et al, 2010; Nilsen, 2010). In this vain, it is argued that CSR remit range from a narrow functionalist vision of business that involves economic and legal responsibilities to a broader stance of enhancing the welfare society (Crane & Matten, 2010). Votaw (1972, cited in Garriga & Mele, 2004) summed up the multitude of meanings given to the concept as to some it espouses responsible ethical behaviour, to others it is tantamount to corporate liability and abiding by the law; to still others it is synonym for philanthropic contributions. Votaw proceeded to critique the term for being a bewildering premise leading to a high level of heterogeneity in how it is depicted. Sun et al (2010) help to end on a positive end that CSR per se is a dynamic and contextual term bound up to its application, societal conditions and political forces. 2.2.1. CSR DEBATE- THE ROLE OF BUSINESS IN SOCIETY The CSR thrust rooted in the two controversy views amid the classical view based on the shareholder view imposed by neoliberal economist adherents and the stakeholder view for the role of business within society (Bhattacharya & Sen, 2001; Jamali, 2007; Sweeney, 2009). The former is attributed to the invisible hand metaphor coined by Adam Smith (1776), the 18th century pioneer of political economics and is credited as the founder of capitalism model and free market system. It implies that self-interest pursuit of business to create its wealth spurs, de facto, society’s prosperity that is promoted by such acts (Carroll & Buchholtz, 2009). The central claim of the free enterprise system is conceived as immoral or unethical-free predominantly driven by the forces of free competition. The latter view was brought forward and developed by R. Edward Freeman (1984) building on the inducement contribution of Howard Bowen (1953, cited in Carroll & Shabana 2010) which was the initial
  • 19.
    point in thefield of CSR. Bowen (1953) in his landmark book, Social Responsibilities of the Businessman, argues that the business community has moral obligations to society arises from the impact of their decisions and activities whilst he goes on claiming that business should conduct in line with the values of its society (Bartscht, 2013). Along with the rise of CSR, detractors of CSR exemplified by Theodore Levitt (1958) warned business to take heed of the adverse impacts of CSR on their business (Carroll & Shabana 2010; Cheers, 2011). Nobel laureate Milton Friedman (1970) – the originator of the shareholder view- furthers Adam’s line of thinking whereby the main credo entails that business’s only responsibility is to maximise shareholder’s wealth as long as it stays within the rules of the game which is to say the justifications of Adam’s invisible hand view in terms of unfettered competitive market (Crane & Matten, 2010; Bartscht, 2013). Frideman concurs with Levitt’s view that social responsibility is subversive to business in terms it diverts management from pursuing its legitimate goal of increasing the economic value of stockholders who are considered the primary constituent in business. Friedman (1970) claims that a broad stakeholder accountability of business is symptomatic of an agency problem. In this context, he contemplated engaging into such social activities as a betrayal of manager’s fiduciary duty to the owners. He notoriously proclaimed that acting for any other purpose is tantamount to fraud and political subversion (Margolis et al, 2009; Crane & Matten, 2010). The well-established credence of shareholder primacy in the latter part of the twentieth century sparked what has become a watershed debate on the role of business. Shareholder- centric came under attack from a number of quarters for serving the interest of one cohort with no regards to other stakeholders (Samy et al, 2010). A contrasting thinking emerged
  • 20.
    epitomising the relationshipbetween business and many stakeholder groups who have stake and legitimate interest in the business. Providing an interesting slant on stakeholder model, Bartscht (2013) posits that engaging in stakeholder relationships implies an opportunity to build relative competitive advantage. Concerning this aspect, it was acknowledged that the narrow view of maximising shareholder profit embodies a myopic stance (Cheers, 2011). This incorporates taking the risk of producing short-term profit which might lead to jeopardizing business viability and even shareholder wealth. Clarkson (1995, cited in Lech 2013) proposes two typologies of stakeholders termed as primary and secondary stakeholders. The former ascribes to prominent participants whose support is pivotal for the existence and survival of business. It encompasses shareholders, employees, customers, suppliers and local communities. On the other hand, the secondary stakeholders are the non-participants who can have an impact on business and in a same vein business’s actions can have an impact on them. The consideration of the interest of business multiple stakeholders maintains a durable relationship which intensifies the significance of advocating CSR ideology. In essence, business and society are inextricably intertwined as Wood (1991) argues; hence business has three roles to address the expectations of society. She proposes three typologies of roles constitute business as an institution in society, as a particular corporation in society and as individual managers. The level of analysis for these roles comprises three principles of CSR in terms of legitimacy, public responsibility and managerial discretion. The principle of legitimacy is rooted in society endorsing business legitimacy whereby business is viewed as a social institution adheres to social norms of society. Furthermore, the principle of public responsibility ultimately promotes actions that attuned to the societal needs of its
  • 21.
    environment, whereas detrimentalimpacts of business practices involve admonishing its failure. The last principle comes as a realisation of Wood (1991) that business managers are not by some abstract actors but are individuals who have moral and ethos and need to straddle the demands of both the shareholder and other stakeholders (Sexty, 2010). 2.2.2. DEFINING CSR AND THE EMERGENCE OF NEW VIEW Carroll (1979, cited in Carroll & Shabna 2010) – an authoritative and progressive advocate of CSR – has proposed a four-fold concept of CSR which manifests a set of interrelated responsibilities that business is beholden to society at any given time. In essence, Carroll’s analysis assimilates both the classical model and the social values underpinning CSR creed (Carroll, 1991). Given this, Carroll’s concept entails an entire spectrum of economic and non- economic expectations of maintaining a profitable sustainable business complemented with the provision of products and services with economic and technical values to society, while business is also expected to abiding by the law, by the ethical norms and standards and to strive to promote the betterment of society (Carroll, 1999; Carroll & Buchholtz, 2009). The four-part concept was depicted as a pyramid after been revised in 1991, as illustrated in Figure 1. Carroll portrayed a multi-layered CSR model comprised of economic, legal, ethical and philanthropic responsibilities that society expects business to meet. At its basis the economic responsibility is ingrained for being the bedrock for business, hence, it undergirds the other responsibilities (Crane & Matten, 2010), which are built upward through legal, ethical while philanthropic responsibilities are at the tip of the pyramid. The crux of fusing ethical and philanthropic responsibilities springs from McGuire’s (1963, cited in Carroll & Shabana, 2010) arguing that CSR has other obligations than the growth of economic value and obedience to the law to typify the entire CSR spectrum.
  • 22.
    Economic Responsibilities capturethe rational of the neoclassical ideology of having a profitable business while Carroll asserts that sufficient profit is the acceptable perception as legitimate to align the rest of the other three responsibilities, hence, the precept of maximisation profit of neoliberal theme is unfeasible (Carroll & Shabana, 2010; Park et al, 2014). Accordingly, other responsibilities become moot considerations in the absence of a sufficient profit that does not predispose other responsibilities to be unmet. The underlying economic imperative is derived from its high relative weighting, as Crane & Matten (2010) claims, in achieving the other three responsibilities and its importance for business to strive for stimulating innovation, promoting fair work practices, creating jobs and the like (Jamali, 2007; Yelkikalan & Kose, 2012). The second category is the legal responsibilities; in essence, it addresses generating profit within the local and international compulsory regulatory framework under which business must operate. By doing so, Carroll asserts that the legal responsibilities are mandatory whereas if business breaches them they do that at their peril on the one hand by revoking its social contract to continue and by becoming ostracised. On the other hand, these legal violation and illicit practices can transcend society reproach to a conviction, herein the first two of what dubbed as ‘a triple-tier Who’s Who for officials under investigations – those who are jail bound, those who might be sentenced and those who have the good luck merely to be embarrassed’, as coined by Hahn (2002, cited in Sims 2003) have given business a somewhat of tattered reputation and eroded confidence in corporate governance integrity and ethicality. By and large the promulgated laws and regulations by governments are touted as ‘codified ethics’ of acceptable and unacceptable obligations placed on the business, as Carroll (1991)
  • 23.
    suggests. To someextent, they constitute the minimum tolerable business behaviour, given its deficiency they do not explicitly covering many morally contestable issues of newly emerging values and still amorphous responsibilities, therefore Jamali (2007) concludes that these legal responsibilities are reactive in nature. Ethical dimension refers to the expected or prohibited business behaviour that is not codified into the letter of the law. Respectively, Davis’s (1973, cited in Sun et al, 2010) goes further acknowledging that responsible ethical behaviour can be said to embody the periphery of values that situated beyond the legal obligation confines. These responsibilities incorporate business values and those notions of justice, integrity, honesty, trust, incorporeal rights of stakeholders and fairness into its practices, policies and decision making (Crane & Matten, 2010). Sun et al (2010) argue that this dimension implies two aspirations. First inspiration is cultivated in the Kantian deontological ethics which comprise the fundamental principles of moral philosophy, whereby the second one emanates from emerging values and changes in social norms, which may later lead to the creation of new laws under the pressure of NGOs or civil groups or other stakeholders, however, most regulations are enacted over time once some kind of consensus is reached (Carroll, 1991; Cheers, 2011). Lastly at the apex of the pyramid, the fourth dimension of responsibility refers to actively engaging in local community through financial and non-financial contributions for a good cause, promoting the quality of life of employees and the sponsorship of art or education programs (Carroll, 1991; Jamali, 2007).
  • 24.
    Carroll’s four-part definitionof CSR has been the most durable and widely quoted model for its relevant analysis of CSR (Carroll & Shabana, 2010), for its significant contribution of demonstrating the false status quo concerning the paradox between economic and social objectives, hence, this model bridges the gap between the two contradictory views. Moreover its considerable value is associated with the identification of issues in the sphere of each of the four preceding responsibilities such as employment discrimination, consumerism and others (Branco & Rodrigues, 2007). Depicting the responsibilities in four separate building blocks, on the one hand Carroll’s emphasises the multiplicity of responsibilities that business should strive to uphold. On the other hand this separation sheds light on a constant and dynamic tension amid these obligations whereby this can help management accommodating an agenda that redresses these issues (Jamali, 2007; Carroll & Buchholtz, 2009). Despite this separation, a true CSR Figure 1 – Carroll’s Pyramid of Corporate Social Responsibility (Carroll, 1991)
  • 25.
    paradigm should composethe fulfilment of these four responsibilities at the same time (Carroll & Shabana, 2010; Crane & Matten, 2010). Taken together the foregoing discussion and Carroll’s (1979, 1991) four-fold definition and analysis of CSR, there is a set of philosophical and normative management concerns to the duty of business in society addresses opposite ends of a continuum. In other words, ‘the business of business is business’ that Friedman (1970) argues fervently for only maximising returns of shareholder and any contribution of corporate resources is deemed to be depressing the financial value of the business. On the other hand, consideration of social, legal, ethical and philanthropic responsibilities in business mission, values and strategy to satisfy the burgeoning demands of these societal attributes can yield strategic advantages to business. Some of the prominent supporters of this strand are Fombrun et al (2000), Drucker (2002), Porter & Kramer (2006) and others. To this regard, CSR became a mainstream in business management by advancing appropriate CSR strategies and effective CSR activities to reconcile both the economic and the social objectives and achieve suitably significant return to outweigh the expenditure (Vogel, 2005). Porter & Kramer (2006) elaborate that business should stray from implying a reactive CSR strategies to a more proactive CSR that spur the whole ambit of business operations such as value chain activities and the like (Bartscht, 2013; Bouvain et al, 2013). This view came complementing on Davis (1973) stance that CSR activities are deemed as institutionalised commitments of business (Haynes et al, 2012; Idowu & Filh, 2008). Building on this distinction, CSR has moved from ideology to be an integral part of business canvas (McDonald & Thiele, 2008; Sexty, 2010). Using this view as a context, Mintzberg (1983, cited in Pomering & Dolnicar, 2008) calls this theme as enlightened self-interest, in which he asserts that pure economic strategic
  • 26.
    decision weeds outbusiness’s commitment to address society claims (Mintzberg, 1978, cited in Samy et al, 2010). In this regard, business’s growth and continuity are subject to consumers’ rewarding and punishing influence, thereof managers should honour their duties both the implicit social and explicit contracts (Isaksson, 2012). On reflection, Carroll & Shabana (2010) present the business case for CSR corresponding to the weak justification of CSR on normative grounds pertaining to ethics-orientation of CSR predisposing it to be criticised by the shareholder camp. The reasoning for the business case based on its contribution to nurture business economic bottom line as a result of business’s culture, strategies and operational mechanisms are bound by to act in responsible behaviour, social and legal manner. The imperative to engage in CSR activities is to produce direct and clear link to corporate financial performance (Lindgreen & Swaen, 2010; Blowfield & Murray, 2008). Given its narrow perspective to link CSR to corporate financial performance as a rationale for the business case for CSR, Vogel (2005) adapts a holistic view coined as ‘doing good to do well’ that he argues to be the essence of new CSR premise. The high profile of CSR in the contemporary business is afforded to the support of multilateral institutions such as the Prince of Wales International Business Leaders Forum casting CSR activities as: CSR means open and transparent business practices that are based on ethical values and respect for employees, communities and the environment. It is designed to deliver sustainable value to society at large, as well as to shareholder. Sharma & Kiran, 2013
  • 27.
    More contemporarily, EUCommission (2010, cited in Condosta, 2012) has addressed the financial sector in its Sixth Environmental Action Program to improve transparency of their reporting that: […] the financial sector’s lending and investment activities have significant indirect environmental impacts by determining which companies and activities have access to finance and the conditions attached. Facilitating disclosure of relevant information by the financial sector and companies could create an incentive for greener behaviour… One of the striking initiatives was HSBC reporting its CSR in 2003 to communicate its philanthropic and community engagement disclosures (Dusuki, 2008). Another manifestation to promote social voluntary obligations in financial sector social is the Equator Principles launched in 2003 to provide guidance on the assessment and implementation of social risks in project financing. It was signed by 30 major international banks – such as JPMorgan, Citibank, HSBC, Barclays and others (McDonald & Thiele, 2008) – some of which were involved in the financial meltdown of 2007 onwards. In turn, this has been faced with cynicism and scepticism about business’s motivations and amount to discrepancies between CSR rhetoric and practices. Given this, it is argued that banking industry is dominated by the shareholder paradigm (Mayer, 2013). The views of Dicken (2011) and Relaño (2011) are quite similar to those of Mayer, they claim that UK economy market deliver on the neoliberal model of free market capitalism. By contrast, at the heart of Blowfield & Murray’s (2008) claim is that stakeholder view is the feature of the modern corporate responsibility. Louche et al (2010) claim that a wide- ranging CSR – namely economic, ethical, altruistic and strategic – has come to prominence in the twenty first century. More interestingly, Friedman has alluded in part the importance of the pertinent ethical custom embedded in discharging business’s function (Carroll &
  • 28.
    Buchholtz, 2009). Thus,there are valid reasons to argue that the gaze turned towards finding guidepost to implement and meet stakeholders’ expectations (Griseri & Seppala, 2010). At the heart of the preceding controversies, an important question lingering in the public or a segment of the public that have the practices of the banking industry after the jaw dropping scandals and fiascos of the FC of 2007 adhering to a cohesive CSR to meet their expectations and satisfy their conceived demands. One consequence of this contentious situation is the claim that CSR analysis remains in an embryonic stage which on one hand creates a perplexing influence on practitioners and elude further development. On the other hand, it might be argued that the unclear management strategies for CSR would impact stakeholders perceived CSR. 2.3. STRATEGIC CSR An economist…and a sociologist are standing in front of a painting by Lucas Cranach in the museum in Berlin. The picture is of Adam and Eve. The economist says, ‘I see Adam with an apple and Eve with a leaf. The economic paradigm is simple. Adam is offering to trade in his apple for a leaf.’ …‘No, no,’ says the sociologist, ‘they have nothing to eat, nothing to wear, and they think that they are in paradise. Mayer, 2013 Contemporarily, the stimulus for business to jump on the CSR bandwagon varies along a continuum ranging from reactivity to proactivity mainstreams (Boomhill, 2007; Lindgreen & Swaen, 2010). Likewise, Kurucz et al (2008, cited in Carroll & Shabana, 2010) have articulated four generic impetuses of the business strategic case for CSR relative to ‘a) cost and risk reduction; b) gaining competitive advantage; c) developing reputation and legitimacy; d) seeking win-win outcomes through synergistic value creation.’ While it is wise
  • 29.
    for a businessto adopt a CSR approach, there is no concrete correlation between CSR and corporate financial performance as such finding has not yet been conclusively established (Bhattacharya & Sen, 2001; Pearce II & Doh, 2005; Smissen, 2012). The three decade quest for the business case legitimate hinges on CSR direct link in boosting the economic bottom line of the business (Carroll & Shabana, 2010). By contrast, Vogel’s (2005) syncretic stewardship model for a consolidative framework is based on both direct and indirect CSR-firm performance relationship. In this view, business can create value to its stakeholders and capture that value in the form of an enduring and beneficial relationship with their stakeholders and long term profitability (Freeman & Liedtka, 1997). Substantively, stakeholder model can be thought of as the acid test of CSR for its application validity. Outwardly, stakeholder stance is driven by a nexus of relationships envisaged the interplay between business and diverse constituents, however its manifestation hinges on the spelt out societal responsibility by identifying the interests of business’s key stakeholders to integrate them into CSR strategies. Yet, the apparent strength of stakeholder model might, at least in part, be its major weakness concerning the competing needs and challenges for each cohort (Mostovicz et al, 2011). To help avert the threatened conflict of these challenges, management should identify and balance the competing interests of various stakeholders (Broomhill, 2007). In this regard, one of the key stakeholder groups is the customer-stakeholder whose attitudes and responses towards business conduct and behaviour can engender a vigorous criterion for the business’s viability and profitability (Branco & Rodrigues, 2007; Isaksson, 2012).
  • 30.
    2.3.1. CUSTOMER-STAKEHOLDER’S BEHAVIOURALAND ATTITUDINAL DIMENSIONS AND CSR Overwhelmingly, there is an extensive literature of CSR in the realm of management dominated by the multifaceted debate on the feasibility of CSR to business. To illustrate, the opening quotation marks how much the views of different premises can be contradictory. As regards the foregoing CSR debate, it has only accommodated the views of both contemporary economists and business practitioners alike with no regards to one justifiable avenue pertaining to the quintessential role that customers play in the marketplace which, arguably, can shed further light on the possible rationales of CSR benefits in terms of customers’ perceptions of and attitudes towards socially responsible initiatives and activities. Mulling CSR through the lens of marketing discipline can add another dimension to the CSR frontier. The marketing literature of CSR has emerged since the 1960s-1970s with a limited focus on two streams namely, cause-related marketing (CRM) and environmental marketing (Maignan & Ferrell, 2004; Beckmann, 2007). Prior research results are generally – though not completely - supportive of the idea that there is positive association between CSR behaviours and customers’ responses and attitudes (e.g. Brown & Dacin, 1997; Berens et al, 2007). However, research investigations of others such as Boulstridge & Carrigan (2000) and Cardigan & Attalla (2001) cast doubt upon the link between CSR and customers’ behaviour intentions or attitudes. Most studies have focused on either limited customers’ attitudinal measures including satisfaction, recommendation, loyalty, trust and the like or behavioural intentions relative to repeat patronage, exclusive purchase, merchandise consumption, switch brands and others (Maignan & Ferrell, 2004). These studies sought to answer important questions
  • 31.
    raised regarding thecustomer’s likelihood of engaging in an evaluation of CSR and if so the extent of it, moreover, the direct and indirect effects of CSR on the evaluation of both company’s CSR actions and its specific product offering, customer’s purchase intensions, his/her motivations to pick one brand with CSR attribute over the other and the effects of CSR campaigns on their loyalty and purchase decision. In essence, understanding customers’ reactions in the domain of CSR marketing research strand is developed by three self-connected theories pertaining to ‘consumer inference making, signalling theory and social identity theory. Customer inference making theory implies that when customers form a purchase decision about a new product/service, they may lack information about it. Whereas, they may know that this business incorporate a social dimension into its behaviour and actions, hence, they may infer positively about the product (Maignan & Ferrell, 2001). Congruent with this, McWilliams & Siegel (2001) conclude that the likelihood of a business with ethical standards and norms to offer quality products/services is high given its reliability attribute in its performance. Signalling theory addresses the problem of information asymmetry that encounters customers’ purchase decision making. For example, CSR attribute may act as a signal to external parties about business’ attributes such as quality, genuine commitment, hence, customer can distinguish between businesses with high attributes salience to those inferior (Lech, 2013). The last conceptual framework of social identity theory relates to customer's degree of affinity with not just the corporation attributes but also the producing corporation. Hence, they may identify with a business that enhances their self-esteem when buying from a business that contributes to worthwhile cause. Building on this, the congruence between
  • 32.
    customer characteristics andthat of the business is likely to create both positive business’s evaluation and positive recommendation about the business (Maignan & Ferrell, 2001). In this context, Vershoor (1997, cited in Bouldstridge & Carrigan, 2000) claims that the empirical finding of CSR’s influence on customer response demonstrated a positive association resonated by 75% of customers switching brands to give their patronage to businesses that behave as responsible citizen. In effect, such business ethical contributions can have positive influence on customer’s attitudes towards the business in the form of purchase intention as an ethical behaviour can act as a transceiver of a differentiated strategy as well as a basis for trust, that is, it can result in favourable evaluation of the business and in turn can create favourable attitude towards its products (e.g. Brown & Dacin, 1997; Bhattacharya & Sen, 2001). Furthermore, Choi & La (2013) suggest that cause-related marketing is allied with philanthropic activities. In this context, it is argued that customers’ responses to philanthropic initiatives are complex in which conditional donations elicit a negative response whereas the unconditional scenario has positive influence on their responses (Dean, 2003-2004, cited in Chomvilailuk & Butcher, 2010). The conditional donations incur as a feature of a sales promotion. An illustrative example is the case of the American Express card donated a penny on each use of the card while contributed a dollar for issuing a new card. Just over four month, it collated two USD million as a donation and boosted its market value by 28% (Sweeney, 2009). In another sense, business can be effective into two different patterns of philanthropic activities by maintaining a ‘low engagement’ pattern such as cash donations and/or a ‘high
  • 33.
    commitment’ which addressesa collaboration approach to assist the efforts of external non- profit organisations (Pearce II & Doh, 2005). Moreover, a proactive CSR strategy can increase customer loyalty, as Maignan et al (1999, cited in Maignan & Ferrell, 2001) claim, that is, business social values can directly influence customers’ loyalty whereby their moral cognition works as a normative guideline that affects their behaviour towards business (Roig et al,2013). It is acknowledged that the sincerity of a company’s CSR motives can help building durable relationships with customers which, in turn, empirically proved to influence directly customers’ responses (e.g. Bernes et al, 2005); purchase intention (e.g. Klein & Dawar, 2004); customer satisfaction (Luo & Bhattacharya, 2006); product evaluation (e.g. Brown & Dacin, 1997); overall evaluation of service quality (e.g. Salmones et al, 2005). Conversely, if the motives behind pursuing CSR are perceived to be dubious and with ulterior endeavours, in turn, this may leave the company with negative evaluations and run the risk of consumer backlash (Mittal, 2008). Another avenue in the research strand of CSR marketing relates to investigating customers’ responses to a multiple CSR domains. Prior research suggests that combined CSR program of community involvement, cause-related marketing and environmental concerns influenced customers’ overall company evaluation (e.g. Brown & Dacin, 1997). Consistent with this, are the findings of Murray & Vogel (1997, cited in McDonald & Thiele, 2008) research in which a battery of CSR activities such as socially responsible workplace, worthy causes and consumer protection resulted in positive responses ranging from pro-employee attitudes to customers’ improved attitudes.
  • 34.
    Despite that potentialfindings from such research strand can provide sophisticated attributional reasoning which can reduce the likelihood of falling prey to the critics of investigating a single domain of CSR which belies the nature of its broad spectrum, there is scant research in the extant studies. Thus, some academics call for more studies into this research stream (e.g. Maignan & Ferrell, 2004). Taken together these studies presumptions and empirical implications, the argument put forward is that CSR is likely to influence customers attitude in which a multiple CSR domain is deployed using Carroll’s CSR model. 2.3.2. CSR AND CR To gain a good reputation, endeavour to be what you desire to appear. Socrates, long time ago! In analogy with the study of CSR, the CR has an array of definitions addressing different disciplines which results in myriad dimensions that are meant to capture its analytical framework (Caruana, 2008). In the light of the daunting challenges arising from the thorny issues of the globalising knowledge economy era and from the mounting public scrutiny, firms have become cognizant of the importance of building and nurturing a good business reputation that signifies its ability to deliver valued outcomes to its stakeholders (Fombrun & Shanley, 1990). In their review, Bennett & Kottasz (2000, cited in Trotta et al, 2011) suggest that CR is best defined as the integration of stakeholders’ perceptions and expectations and personal opinions that developed over time about a business know-how and capacity to fulfil stakeholders’ interests. In this view, stakeholder’s future expectation is likely to be articulated by his/her past perceptions of business behaviour.
  • 35.
    Accordingly, CR implieson one hand conveying cues of business’s differentiated strategy and the intrinsic values of its products CR to the stakeholder groups (Gatti et al, 2012), on the other hand its multidimensional perspectives articulated upon the different perceptions of each stakeholders group investigated (Trotta et al, 2011). Underlying these vantage points are the similarities and differences between CSR and CR. it can be well argued that both concepts are cultivated within corporate behaviour investigations and stakeholder model. Arguably, if unattached to stakeholders and not heeded to their interests, both concepts would be seen as merely abstract concepts (Trotta et al, 2011). With reference to the differences, it is acknowledged in some studies that CR is of multidimensional nature while CSR has a descriptive-objective nature (Trotta et al, 2011), thereof, their complementary interaction constitute value attributable to characterising business intangible responsibilities and hence accommodating efficient strategies to respond to these responsibilities, ultimately, in turn capture these opportunities into intangible assets alongside its physical ones. Emerging from this remark is that strengthening business’s social bonds with stakeholders can be considered a form of reputation building and maintenance which in turn undergirds a competitive advantage in the market place (e.g. McWilliams et al, 2006; Peloza & Shang, 2011) and ultimately reaps long-term prosperity and viability of the business especially in the turbulent business environment of today. Subsequently, one instrumental that has widespread application for many companies seeking to bolster their reputations is the surge up of reputation index ranking of accredited institutions such as Reputation Institute, Fortune index of CR and Britain’s ‘Most Admired’ Companies wherein amid the rated criteria is quality of management as well as community
  • 36.
    and environmental performance(Boulstridge & Carrigan, 2000; Peters, 2007). In one sense, business uses these tools to heighten business accountability and constructively influence its social behaviour. In another sense, it uses them to communicate its social commitment and the different facets it is engage in to convey to stakeholders its coalescence with its society to promote society well-being (Peters, 2007). The eminence of businesses’ reputation for deploying socially responsible practices and social attributes to their offering can enhance business financial posture through cost reduction that accrues from customer satisfaction and productivity of employees (Isaksson, 2012). In turn, such positive outcomes accumulate a stock of a firm’s reputational capital. In other words, if CR is not maintained negative outcomes incur translated into impoverished revenues, the volatility of CR is touted as reputational capital which constitute business intangible assets. Under this reasoning, Accenture - a global consulting firm – draws attention to the upsurge in businesses’ intangibles from 38 per cent of total business value in 1982 to 84 per cent in 1999 (Bouvain et al, 2013). Furthermore, a reactive CSR strategy, as Broomhill (2007) claims, embodies the adoption of socially responsible manner in business’s decisions to alleviate negative reputation and potentially regain legitimacy. By doing good, arguably, business can mitigate the risk of reputational losses which if not wisely treated can rigorously damage the consumers’ confidence and trust in business (Boulstridge & Carrigan, 2000) and even worse by having a negative effect on generalised trust (Cruijsen et al, 2013). This could be, at least in part, because it takes decades to build up a reputation, however, it can be ruined in a split second by incidents such as the corruption scandals or the environmental accidents, hence, causing a bottom line backlash for these businesses.
  • 37.
    Moreover, Park etal (2014) claim that there is a direct positive link between economic and legal CSR and CR, though an indirect impact of ethical, philanthropic CSR on CR was found in which customer trust fully mediated this relationship. Regarding economic CSR and CR, the product safety and its quality have a positive impact on CR, whereby the wrongdoings of some companies for their illegal acts lead to a tarnished CR and to public resentments. With respect to the latter two CSR activities, the logic behind this is that the perception of the sincerity and trust surrounding CSR motives are the factors of creating positive corporate evaluation. 2.3.3. THE MEDIATION EFFECT OF CSR From the aforementioned review, the argument put forward is that CSR can influence the relationship between CR and customer behavioural intentions. As such, CR can have an impact on customer behavioural intentions through the effect of CSR. In this regard, many authors pinpoint a positive association between CSR reputation and customers’ responses. It is worth noting that reputation is likely to lead to customer engaging in positive word of mouth, emotional attachment to the store and repeat patronage (e.g. Lichtenstein et al, 2004, cited in Chomvilailuk, & Butcher, 2010). As alluded to in the foregoing sections, the prevailing assumptions insofar yield customers’ support to and favouring of social responsible businesses. The well-documented CSR effects on customers’ responses and behaviour spring from the ensemble of CSR social attributes that inculcate customers’ confidence and trust into business which go hand in hand with bolstering its reputation as a social responsible business. Drawing from this, it could be said that CSR activities mediate the relationship between CR and customer behaviour intentions which this study tends to investigate.
  • 38.
    2.4. CONCLUSION This chapteris articulated around the multifaceted debate on CSR justifications either on shareholder or stakeholder grounds. Martin et al (2009) bluntly pronounced the state of affairs surrounding the debate on CSR as ‘both would argue, vehemently, at times that it is an either-or proposition: if I am wrong, then you must be wrong.’ Metaphorically, the shareholder and stakeholder could be seen as the unattuned strings of a violin. Hence, the composed CSR mantra is one of dissonant as the violin’s bow sometimes hits only the shareholder string to reflect the domination of the neoclassical economists view; another time it would only hit the stakeholder’s one. Thus, the tune composed is missing a sharp stroke to create a well-tuned mantra – the rationale behind justifying the adaptation of CSR. To gain a dynamic articulation of this mantra, there is a need to calibrate the two strings into a vibrant theme that strikes the listeners – the business’s constituent groups including the shareholders cohort. Hence, to unveil whether the presumption of an untuned theme is the status quo or the current CSR activities have been tuned after the FC of 2007 to meet its stakeholder’s needs and expectations, the research will seek the voice of customer-stakeholders. Set against this outlook is the research question: Has the FC been a wake-up call for CSR activities to resonate with customer-stakeholder expectations to create a sustainable business?
  • 39.
    Chapter 3: Methodology 3.1.INTRODUCTION This chapter is built upon the pillars of formulating a coherent research design. It sheds light on the adopted philosophical stance concerning the nature of the research enquiry which is dovetailed with the formation of the research methodological choice and related strategy (or strategies). That is, it implies the rationale behind the chosen methodology, the verified research approach and data collection techniques that are developed to answer the research question with reliable results and to fulfil its objectives. Finally, the data analysis techniques are outlined. 3.2. RESEARCH PHILOSOPHY The definition of a “research process” – a systematic way of collating and construing information to generate or increase our knowledge in a rigorous analytical way to provide valid and reliable findings – had a profound influence on the constitution of the three phases, illustrated in Figure 2, that were used to help achieve the objectives of the research (Saunders et al, 2012). To leverage a coherent research process, the two latter phases – execution and analytical – were informed and guided by the development of the research question and objectives in the formulation phase – Introduction and Literature Review.
  • 40.
    To address this,the formulation phase provided the theoretical framework for the proposed hypotheses that aimed at answering the research question. Embedded within this framework is the philosophical perspective which maintains the study worldview about the nature of what we seek to know and the process by which acceptable knowledge is developed. Thereof, the research philosophy constitutes the assumptions that relate these theoretical ideas to the real world (Figure 3) through two lenses relative to the issues of what is the nature of the social entity to be researched (ontology) and how can (or should) we develop our knowledge in this discipline (epistemology) (Creswell, 2003; Bryman & Bell, 2011). (Adapted from Hair et al, 2007) Figure 2 – Research Process
  • 41.
    3.2.1. ONTOLOGY: THENATURE OF REALITY Ontology comprises the substantial precepts for every research blueprint which is anchored in our beliefs about the nature of reality and the constituents of the object of investigation. The ontological assumptions are related to what is out there to know about the social entities. To this regard, the central point of orientation stems from whether these social entities can or should be regarded as objective entities that have a reality independent of the social actors or whether they can or should be constructed by them (Bryman & Bell, 2011; Camilleri, 2012). These contrasting views are respectively referred to as objectivism and constructionism (or subjectivism) (Porta & Keating, 2008) which portray opposite ends of continuum’s polar to which researcher embarks upon one end that would enhance the understanding and the justification of the research strategy and data collection techniques. While researchers who adopt the objectivist approach hold the view that social phenomena is independent of their perceptions of it, the subjective stance views reality as being socially constructed for which individuals develop subjective meanings of their own experiences and backgrounds. As such, these meanings are formed through active involvement of people in Figure 3 – (Lee & Lings, 2008)
  • 42.
    reality construction andthrough historical and cultural norms of the context (Creswell, 2003) which result in multiple perspectives of an event by virtue of the different interpretations being engendered. 3.2.2. EPISTEMOLOGY: HOW WE JUSTIFY OUR KNOWLEDGE OF THAT REALITY The ontological stance entails the point of departure from which the core assumptions concerning epistemology initiated (Lee & Lings, 2008). In this context, epistemology is concerned with the relationship between the researcher and reality. Ultimately, it underlies the nature of knowledge, the most appropriate ways of pursuing, acquiring and/or creating that knowledge as well as the limits of knowledge (Porta & Keating, 2008; Camilleri, 2012). Notably, given the propositional claim of this knowledge, it needs to rest on a body of evidence (induction) or a reliable theory (deduction) to promote valid and well- substantiated findings, thus this knowledge can be well justified (Lee & Lings, 2008). The underlying epistemological assumption draws on how one comes to know reality (Camilleri, 2012). In turn, it informs the choice of research methods ranging from the quantitative and statistical techniques, the qualitative research methods to mixed-methods research design. 3.2.3. RESEARCH PARADIGM At a broad level, the epistemological considerations render into the research work plan of how to go about generating this knowledge, that is, these processes that govern the methods by which research is carried out form the research methodology. Building on this, what Lee & Lings (2008) term as the ‘ologies’, which are derived from research ontology, epistemology and methodology, embody an ‘interpretive framework’, as Denzin & Lincoln (2000, cited in Le Roux, 2012) purport. This framework forms the so-called research
  • 43.
    paradigm; in effectthese ologies directly or indirectly outline the research paradigms. More interestingly, the word paradigm – origin Greek paradeigma – symbolises a pattern. In this view, research paradigm is a pattern of scientific and academic ideas, key issues, assumptions and data collection methods. The most prevalent paradigms embody a long standing tension about whether the social world should be studied according to the application of the methods of the natural sciences. Advocates of the natural science’s ethos to the study of social reality cultivate the precepts of positivist research paradigm. On the other end of the spectrum is the interpretivist research paradigm denoting an alternative to the positivist orthodoxy which is based on an understanding of human behaviour and subjective meaning of social action through the eyes of different participants (Camilleri, 2012). 3.2.3.1. POSITIVISM The tenets of the positivist stance emanate from the philosophical ideas of the French Philosopher August Comte (1798-1857, cited in Neuman, 2006) which implies that valid knowledge (truth) exists, is already there waiting to be revealed, and is independent of the human mind. Hence, the researcher’s task is to uncover truth using quantitative and statistical methods. At the ontological level, philosophical positivism is articulated around facts that exist objectively which are directly observable and measurable (e.g. Walsham 1995; Blumberg et al 2008). Positivistic thinkers emphasise the verifiability of theories through empirical testing of deduced hypotheses which are only considered meaningful if they are empirically verified, thereof this leads to the discovery of universal laws of human behaviour (Lee & Lings, 2008; Bryman & Bell, 2011).
  • 44.
    The positivist socialscience takes the stance that knowledge is acquirable and methodologically naturalistic to systematise the knowledge generation process with the help of rigorous measures and careful collection of data to explain cause-and-effect relationships and predict general patterns of human activity (Neuman, 2006). However, the detached epistemological stance of the positivism and reducing the world to observable objects and facts, in the view of critics, are not very justified. Critics attribute this to the establishment of superficial correlation of the observable elements with no regard to the unobservable mechanisms that underlie institutional forms and practices. Opponents of positivism also reject the application and interpretation of science to the study of social reality (Alvesson, 2009; Camilleri, 2012). Notwithstanding, proponents of positivism assert that observing external reality is prominent than developing subjective meanings of the social actions in terms of providing adequate explanations of human thought and action which is the manifestation of direct observation of realities and regularities (Camilleri, 2012). Positivists hold the view that reality is patterned and has order, however, if it is bypassed, or if there is no regularity in social reality, a rational logic of decision making and prediction would be impossible. 3.2.3.2. INTERPRETIVISM Another intellectual tradition contrasting the epistemology of positivism is interpretivism which holds that social life is underpinned by social interactions and socially constructed meanings stem from people’s subjective experiences. Given the complexity of the contemporary social world, the focus of this tradition is to develop inferential generalisation to capture insights of this complex world rather than reducing this world into a series of law- like generations of the positivist stance. In this sense, a qualitative analysis (versus
  • 45.
    quantifiable) is employedin the domain of interpretive research whereby meaning-oriented methodologies such as ethnography and in-depth interviews are highly contextual (Saunders et al, 2012). As such, the nature of the interpretive methodology and the context- specific orientation make generalizability – which is concerned with the results of the undertaken research being transferrable to other situations – far more difficult. Hence, these results cannot be widely generalisable instead they generate local understanding (Lee & Lings, 2008; Camilleri, 2012). Owing to the ontology’s tendency towards exploring reality through meaningful actions, this results in forming multiple realities whereby there is no single correct route to knowledge (Alvesson, 2009). 3.2.3.3. RATIONALE BEHIND CHOSEN PARADIGM Emerging from the preceding remarks of the two paradigms, the framework of this study adopted the positivism tradition. The crux of this reasoning lies in some propositions shaped in the multifaceted debate on CSR that gripped the banking sector with regards to its ascribed role in the post FC of 2007. Also, this study is set out to capture the social reality pertaining to the CSR streams that gauge customer-stakeholders’ attitudes towards CSR that symbolises its development to meet their demands. In line with this reasoning, the positivism philosophy maintains that there is one reality that is observable and meaningful based on a proper treatment of empirical data which is not the case with interpreivism (Holden & Lynch, 2004). Given this, adopting a positivistic stance is consistent with the study’s aim to find out a consensus on CSR activities that is likely to address customers’ demands and provide means for business sustainability.
  • 46.
    Moreover, the applicationof scientific methods to create generalisable knowledge stemming from the causal analysis of the operationalised concepts that constitute the research variables resembles the study aim. This approach would equip the study with rigorous analytical methods to investigate whether the shareholder-stakeholder debate is pseudo or there is a real issue in this discipline which if confirmed would provide legitimate grounds for the next implications of adhering to the positivist stance. In this context, the causal analysis can help in promoting a management agenda by gaining insights into the causes and effects of the research variables to inflict reflective decisions. 3.3. RESEARCH DESIGN If we knew what it was we were doing, it would not be called research, would it? Albert Einstein In light of Einstein quotation, a crucial tool in the social researcher’s armoury is the research design which is regarded as the ‘recipe for carrying out the project’ as Hair et al (2007) pinpoints. From the outset, the researcher needs to devise a coherent research strategy which is guided by the researcher’s adopted philosophy, research approach (relationship to theory), the nature of research and access to data.
  • 47.
    3.3.1. RESEARCH APPROACHES:DEDUCTIVE, INDUCTIVE AND ABDUCTIVE - FROM REASON TO RESEARCH The ‘research approach’ indicates how data can be collected by delineating the relationship between theory and research. There are three different approaches based upon the reasoning adopted through the research paradigm: deductive, inductive and abductive (Table 1). With regards to deductive approach, the emphasis is on the development of a theory for which an empirical scrutiny is deployed to test a hypothesis(ses) (Bryman & Bell, 2012; Saunders et al, 2012). These hypotheses will need to be translated into operational terms (Bryman & Bell, 2012) in the form of independent variables that can be active – variables that the researcher can manipulate – or attribute – in contrast with the active ones as they relate to gender, race and the like (Newman & Benz, 1998). The point is that the independent variables are the measurable characteristics which cause effects on the dependent variables. Hence, these measured concepts can be formed into Table 1 – Research Approaches: Deduction, Induction, Abduction (Saunders et al, 2012)
  • 48.
    quantifiable data collectedthrough quantitative instruments such as a survey questionnaire. As such, after the rigorous evaluation – based on testing the reliability and validity – of the measures of concepts, the hypotheses can then be tested using an appropriate statistical technique and will only be accepted if they survive the ordeal (Sohail et al, 2008). This scientific approach is called a hypothetico-deductive (deductive-empirical) method in which the aim is theory testing. Hence, it is contrasted with the other two approaches: inductive and abductive (Hair et al, 2007). The notion hypothetico-deductive first emerged from the perceptions of philosopher Karl Popper (1959, cited in Juma'h, 2006) which rely on the logic of testing falsifiable hypotheses for which the scientific approach is driven by systemising the search for conflicting information. The falsification principle contrasts the empirical verification in which hypotheses are either verified or refuted by the observed effects. The last characteristic of deductive reasoning is the embedded causal explanation that incorporates a sufficient level of generalisation to apply findings of the research study to other settings (Camilleri, 2012; Saunders et al, 2012). With inductive reasoning, the outcome is the formulation of a theory which entails generating inferences out of observations. By its very nature, inductive research employs qualitative methods and often uses a grounded theory approach to the analysis of data and to the generation of theory (Porta & Keating, 2008; Saunders et al, 2012). On the other hand, the abductive stance involves weaving back and forth between data and theory. In effect, it leverages a complementary approach which entails a process that iterates between deduction and induction (Hair et al, 2007).
  • 49.
    3.3.2. FIXED ANDFLEXIBLE ORIENTATIONS TOWARD RESEARCH DESIGN Research designs are mapped based on distinguishing between two salient typologies – fixed and flexible. One of the differences between them comes from the degree of pre- specification of procedures that characterises the requirements for the most suitable design to be employed such as the use of pilot testing in the quantitative approach. Another difference is the nature of the data. The former – fixed – is characterised by data collection techniques and analysis procedures that generate or use numerical (hard) data, thus researchers deploy the positivism paradigm. Conversely, the latter design collects qualitative (soft) data in the form of words, impressions and so forth which means that social researchers rely on interpretive paradigm (Robson, 2011). Quantitative research is most likely constructed using a deductive approach whereby the focus is on collecting data to test theory. Hence, the strength of its implication capitalises on three factors – concepts’ measurement, causality and generalisation. Measurement involves the consistency of the research results and assesses whether the indicators devised to gauge the concepts – the building blocks of theory that can be observed and measured to explain variations when testing hypotheses – really do reflect those concepts. These sketch respectively the research reliability and validity (Bryman & Bell, 2012). With regards to causality, its importance is driven by the researcher’s ability to impute it in their findings. In terms of quantitative research, the daunting challenge is to explain the causal relationships that are responsible for some phenomena by identifying the possible correlation between its dependent and independent variables. Moreover, this causal explanation strives for generalising findings from a sample to a wider population. Given this,
  • 50.
    the sample hasto be as representative as possible in order to be applicable to other settings (Hair et al, 2007; Tam, 2007). In contrast is its qualitative counterpart whereby data gathered is not statistically representative. Hence, researchers confine themselves to providing contextual generalisations or making theoretical generalisations that are concerned with the empathic understanding of human actions rather than with the explanation of these actions as in the case of quantitative research. In this framework, qualitative research design is associated with inductive approach for which limited or no prior specification of variables of interest is required (Creswell, 2003; Bryman & Bell, 2012). Moreover, flexible can coincide with mixed method which is not within this study scope. 3.3.3. RESEARCH STRATEGY Drawing on the fixed and flexible research design typologies as sketched by Robson (2011), the fixed designs can constitute experimental and non-experimental strategies. The typical form of the experimental strategy owes its nature to the quantitative research design that implies manipulating the independent variable to assess its influence on the dependent variable whereby the researcher conducts quantitative comparisons between control and experimental groups with regards to the dependent variable. On the other hand, the non-experimental strategy for the fixed research design includes survey study and secondary data collection methods. With reference to flexible design, it is carried out by one of the following approaches: case study – which could be conducted using qualitative, quantitative or mixed as Robson (2011) argues – whereas the remaining strategies embody only qualitative data collection such as ethnography, interview study and discourse analysis.
  • 51.
    Guided by theadopted positivistic stance, a fixed survey study was used. In light of the deductive approach of this research, the generalisability property of the quantitative survey study, its causal analysis and condensed data fit its descriptive and explanatory nature. Descriptive Research is designed to provide an accurate profile of what has been observed. The outcome is a detailed sketch that can be an extension of exploratory research or, more likely, a piece of explanatory research. Accordingly, this social research focuses on questions as how, who, when and where to present a snapshot of events over time – longitudinal studies – or situations at a given time – cross-sectional results. It can be a forerunner to explanatory studies. Such studies are so-called descripto-explanatory (Saunders et al, 2012). With reference to explanatory research, the primary purpose is to seek explanation of how and why events occurred; thereof it strives to establish cause-and-effect relationships (Saunders et al, 2012). Building on this, the nature of this research subscribes to a descripto-explanatory stance. Given the multidimensional nature of the CSR paradigm, the rationale behind conducting a descriptive study is to obtain data that identifies and describes the characteristics of multiple CSR domains relevant to the level of importance concerning CSR activities to customer-stakeholders. Moreover, at the heart of this research lies a systematic quest to reveal enlightening insights by explaining the likelihood of a bundling of CSR activities that can influence customers’ attitudes and behaviours as well as the possibility of CSR to affect the reputation of the business.
  • 52.
    3.3.4. THE DATACOLLECTION PHASE –SURVEY QUESTIONNAIRE Questionnaire instrument is the most widely used data gathering technique within the survey strategy. It is perceived to be used as an interactive method of sourcing primary data (Lee & Lings, 2008; Saunders et al, 2012) that represents a snapshot of a situation at a single point in time – cross-sectional study – or that is captured over a longer period time at a number of points in time (Creswell, 2003; Hair et al, 2007). Respondents are asked to respond to a consistent set of clear and unambiguous statements or questions that might comprise open-ended questions in which respondents provide their own answers and/or standardised, also referred to as close-ended, questions in which predetermined mutually exclusive and exhaustive responses are formed (Babbie, 2004; Hair et al,2007; Saunders et al, 2012). Framing relevant questions convey a set of interrelated activities that must be considered to develop an efficient and well-structured survey. In this sense, a good design of these questions, a logical flow in the structure of a questionnaire, an appropriate method by which the questionnaire is administrated and a rigour of its pilot testing would foster an adequate reliability of the data collected and acceptable or even sometimes significant response rates (Hair et al,2007; Saunders et al, 2012). With reference to the methods of administration to sample, there are wide-ranging means with which a questionnaire can be delivered, returned or collected. This is exemplified in using self-administrated (or completion) methods which include postal and electronic surveys whereby they are completed without a researcher present. Hence, this type of survey requires a highly structured questionnaire with an easy-to-follow design and a clear presentation with spreading out questions in the questionnaire to be sufficiently appealing
  • 53.
    that participants actuallycomplete and return it, potentially increasing the response rate (Bryman & Bell, 2012). Saunders et al (2012) point out that a feasible length of questionnaire should be between six to eight A4 pages for postal survey or the equivalent of them for the online. A covering letter should accompany the questionnaire introducing it and its content along with ethical commitment. This implies avoiding confusion and vagueness of the research purpose as well as building up trust and confidence to induce respondents to complete it. Self-administrated questionnaires are especially advantageous over structured interviews for being cheap and quicker to administer, more convenient to respondents in terms of the time and speed of completing them and, most importantly, eliminating the social desirability bias due to the absence of an interviewer. However, this type of questionnaire has some drawbacks such as that it can be read as a whole without control over the sequence in answering the questions; it could suffer from a low response rate and greater risk of missing data (Sweeney, 2009; Bryman & Bell, 2012). To elicit the benefits from using a self-administrated questionnaire whilst overcoming and minimising its pitfalls, the survey devised for the research in question took the format of a self-completion questionnaire that was administrated via the Internet using the Survey Monkey software. Notably, the internet is having a substantial impact upon research within which the use of web-delivered surveys is growing for a multitude of reasons that include quick and direct form of access to sample, the economical collection of large amounts of data, the moderate response or return rate compared to lower rates associated with postal questionnaires, and its technical features that help spreading out questions over a number of pages, having questions answered in a sequence and help avert the risk of missing data
  • 54.
    by not progressingthrough before answering all questions on each page (Babbie, 2004; Neuman, 2006; Barton, 2010). 3.3.4.1. THE QUESTIONNAIRE’S LAYOUT AND CONTENT To operationalise the ‘Total Design Method’ purported by Dillman (1978, cited in Babbie, 2004), the preceding considerations were taken into account to exhort valid findings confined by the specifications of the quantitative scientific research e.g. being logical, objective, value-free and empirical verification. Drawing on these insights, the web-based questionnaire was disclosed with a clear unbiased title, followed by an introductory covering letter tapping on the aim of the study, the structure of the questionnaire, instructions of how to complete it and an explanation of CSR terminology accompanied by real-life examples to illustrate the responsibilities in order to make it easier for the respondents to relate to the questions and statements and, at the end, a thank you note for their valuable participation. The questionnaire had a clear layout and care was taken to avoid leading questions, double- barrelled statements and unbalanced responses. By using the features of the Survey Monkey software, the survey was programmed so that respondents could not proceed to a new page before answering all questions on a given page which is used to control missing data. Another feature was used to lock the questionnaire so that at completion it would not be done twice by the same IP address. The survey comprised four sections over five pages and consists of 23 close-ended questions. The justifications for that over open-ended questions are that less time is needed for answering them which justifies the twenty minutes estimated for its completion in the introduction, maintaining uniformity in the data gathering process and making it easier to
  • 55.
    compare the answersof different respondents whereas open-ended questions are most suited to exploratory research whereby little or nothing is known (Appendix C). In section A, eight list questions (e.g. tick the appropriate box) requested background information concerning age, education and so forth. These questions are of a factual nature for which a single variable is used in each question to collect socio-demographic characteristics about the sample. Even though it is preferable to have this section at the end of the questionnaire so that the participant does not break off early, it was placed at the beginning because one of its subset questions is designed as a filtering question to circumscribe progressing into the questionnaire if the participant does not have a UK account. Section B consisted of ten questions that canvassed customer-stakeholders’ satisfaction of perceived CSR following the FC of 2007. The participants were asked to respond using a five-point Likert scale to a range of questions, some of which were constructed into a matrix format for subscale questions. The Likert rating scale was used to assess the strength of agreement or disagreement about their banks adhering to four dimensions of CSR activities adapted from Carroll’s CSR framework which deal with economic, ethical, legal and philanthropic dimensions in the post FC of 2007. A five-point Likert scale ranging from 1 (Strongly disagree) to 5 (Strongly agree) was used. Using the same five-point scale, respondents were also asked to indicate their level of agreement or disagreement with each statement relevant to their trust into their banks after 2007. They were requested to divulge their level of expectations of the bank sector aligning with their demands and needs after 2007 by interpreting the Likert five-
  • 56.
    point interval scale– 1 (Substantially below expectations) to 5 (Substantially exceed expectations). Since the sequence of the questions have a major influence on the accuracy of the collected data, the logical flow of questions geared to capture respondents’ perceptions of their bank CSR activities first and then their overall perceptions of the bank sector. This sought to get their brain primed for the more salient questions gauging their satisfaction of the banking sector. Section C delved into the level of importance of Carroll’s CSR four dimensions to influence their purchase decision of bank’s financial products in which the five-point Likert scale is coded from 1 (Not at all important) to 5 (Very important). Finally, Section D catered to capturing the level of agreement-disagreement with statements gauging the effect of engaging into CSR activities on bank’s CR. The statements and variables in the research instrument are derived from and built upon the analysis of secondary sources constitute of literature that are based on a number of critical theoretical threads presented in Chapter 2 and other items from earlier questionnaires that were culled or adapted to reflect the objectives of the current study. Question 9 was partly derived from Choi & La (2013). Question 14 was adapted from Mulki & Jaramillo (2011). Question 21 was adapted from Ellen et al (2006) and Osterhus (1997). Incorporating items from previous research allowed reliability and validity in the sense that these questions have already been pilot-tested; hence, they are empirically founded (Barton, 2010; Bryman & Bell, 2012).
  • 57.
    3.3.4.2. PRETESTING ANDPILOTING THE SURVEY Questionnaires do not emerge fully-fledged; they have to be created or adapted, fashioned and developed to maturity after many test flights. In fact, every aspect of a survey has to be tried out beforehand to make sure that it works as intended Oppenheum, 1999 cited in Sweeney, 2009:130 Guided by the ‘Total Design Method’ of Dillman’s (1978) proposition and the insights of Oppenheum to ensure that the research instrument as a whole functions well and evaluate its feasibility, the developed questionnaire should be pilot-tested prior to administrating the final survey study to the sample. This evaluation is in the form of a small scale replica of the actual survey to be carried out to reveal issues related to wording, sequencing, questions duplication, the adequacy of the range of responses to each question and any weaknesses in the design. As this would suggest, calibrating the questionnaire draft in accordance to these revealed insights will help enhancing the validity of the questions and the reliability of the data that will be collected. It will also acquaint the researcher with an indication of the response rate to be expected of the final study (Sweeney, 2009; Barton, 2010). The first draft of the questionnaire was presented to the research supervisor and then pre- tested among academics and professionals. The feedback received reported duplication in some questions and some wording errors. Hence, the draft of 26 questions was refined to 23 questions and some examples of CSR activities in the banking sectors were given for more clarity. The survey was redrafted and then tested with a sample of ten respondents of bank customer-stakeholders. The number of ten participants in the pilot is acceptable which is in line with the recommendation of Saunders et al (2012) as a minimum number to conduct a pilot for most questionnaires.
  • 58.
    Each participant receivedan email informing them that the questionnaire for which a link was attached was for a pilot study and they were encouraged to provide their feedback on irrelevant questions, inappropriate flow of the questions, technical jargon or ambiguous scale items. Concerns over the usage of American terms for describing the types of bank accounts were voiced during the second stage and also the pilot indicated a low response to few statements that needed to be associated with examples of these CSR activities in the banking sector. Accordingly, typographical changes were made and these statements with low response contained an example related to these CSR undertaken in the banking sector. These recommendations were incorporated into the survey before the final administration of the survey. 3.3.4.3. THE SURVEY ADMINISTRATION AND RESPONSE RATE After adjusting the second draft of the questionnaire following the pilot study, the survey was fielded from the 14th of July until 12th of August 2014 and included two reminders. An invitation email including the URL link was sent to respondents who can click-thru sequences on Survey Monkey web site to complete the questionnaire online (Appendix A). The email was sent to all 200 email addresses on the researcher’s list. Within the first five days 38 responses were collected. Using a feature of the Survey Monkey software, the non- respondents were located. Thereof, the first follow-up email was sent after six days to all recipients. It included a thank you note to early respondents and the located non- respondents received a reminder to answer with a copy of the link. The first reminder produced only 26 additional responses (Appendix B1). Therefore, ten days later, a final reminder was sent with the closing date for the survey to highlight the
  • 59.
    urgency of completingit (Appendix B2). This resulted in a further 62 responses and the questionnaire was closed at midnight on 12th August. Guided by the techniques used during the data collection – analysed and synthesised in the methodology literature, sufficient response rate for the research in question was achieved whereby 127 questionnaires were returned thus yielded an initial response rate of 63%. Of these, 4 questionnaires were disqualified by using the filter criteria for allowing only respondents who currently have UK account to progress. In addition, 31 questionnaires were excluded from analysis as they were only partially completed. Although the survey was programmed for not advancing to the next page if a question is skipped, the 31 uncompleted questionnaires were incurred by exiting the website of the survey. The final response rate is 46% for the 92 usable questionnaires that were accepted as valid for the data analysis. 3.3.5. SAMPLING METHOD The setting for this empirical study was the UK banking industry given its vital role to the development of the country’s economy based stemming from its part in bridging surpluses and deficits in the economy. Within this context, the study population and sample elements were drawn. Sampling constitutes a key step in the social research process. It is the method by which specific cases or events are selected for participation in a study whereby the gist of it is to estimate some unknown characteristics of the population (Zhowa, 2010). As its name implies, a sample is a segment of the population that a researcher selects to arrive at a conclusion regarding the whole population (Bryman & Bell, 2012). Accordingly, a population
  • 60.
    or universe isthat aggregation of the units in a study which have some homogeneous characteristics that may influence the variables of interest (Lee & Lings, 2008; Zhowa, 2010). The method of selection was articulated by one of two approaches namely: probability and non-probability methods. With probability sampling (or representative sampling), some random-selection mechanisms are employed in which the chance of each unit being selected from the population is known, thus each case has an equal possibility of being selected. Consequently, a probability sample is considered representative of the population from which it is drawn (Babbie, 2004; Neuman, 2006; Han, 2006; Bryman & Bell, 2011). The aim of recruiting this technique is to keep sampling error to a minimum. This error refers to the degree of deviation between a sample and its population (Neuman, 2006). Garnering a representative sample is based on five sufficient steps as presented in Figure 4. A target population embodies the specific pool of sampling units that the researcher aspires to generalise the results of. Obtaining a sampling frame is essential for providing a working definition of the target population as it encompasses all units in the population from which the sample will be drawn (Saunders et al, 2012). Another critical factor in creating a representative sample is contingent on its size. In essence, the larger the size of the sample, the higher the likelihood of the precision and accuracy of data collection from it because that is more likely to reduce error in generalising to the population. Moreover, the type of Figure 4 – The Process of Probability Defining the target population Choosing the sampling frame Determining the sample size Selecting the most appropriate sampling technique Checking that the sample is representative of the population (Saunders et al, 2012)
  • 61.
    analysis that isintended to be used will determine the threshold of the sample size. Another two constrains that can affect the choice of the sample size are the amount of time and cost that are needed to collect, check and analyse the data (Bryman & Bell, 2012, Saunders et al, 2012). Probability sampling techniques include simple random, systematic random, stratified random and cluster sampling. The choice between these techniques depends on which is most appropriate to answer the research question and address its objectives. The first technique entails randomly selecting the sample elements from the list of all units of the population. A slight modification is systematic sampling, where every Kth (e.g. 15th) unit in the sampling frame is selected at regular intervals (Babbie, 2004; Hair et al, 2007). With stratified random sampling, the sampling frame is divided into relevant strata – relatively homogenous subgroups – and then randomly or systematically sampling within these strata. Thus, each of the strata is represented proportionally to accurately mirror the population (Hair et al, 2007). As for cluster sampling, it involves breaking the population into discrete groups (clusters) and then samples are drawn from the aggregated units or clusters. In this criterion, the sampling frame comprises a complete list of clusters rather than individual cases (Neuman, 2006; Hair et al, 2007). The fundamental idea behind employing probability sampling techniques is that it is more likely to yield a representative sample that allows for drawing a statistical generalisation from it to its population. To achieve a perfect representative sample, a sampling frame of all units must be available which can hardly ever be achieved for some research inquiries. In addition, it is considerably more expensive and time-consuming which does not fit with limited research sources. However, there are other ways that could be considered to
  • 62.
    evaluate the worthof a good sample strategy such as sample size, the level of response rate and the construction of the instrument questions (Lee & Lings, 2008). Constructing scientifically sound samples can be constituted by using non-probability sampling methods which address those challenges of employing a probability sampling in terms of safeguarding the use of non-random techniques in which units of the sample are selected on the basis of different settings such as convenience, personal judgment, snowballing and quota sampling. Given this, non- probability samples can be used for such quantitative studies where it is not possible to establish a clear frame (Turner, 2003; Brown, 2012). On the other hand, the subjective judgement involved with selecting such samples is conducive to be used for sampling in qualitative research which leads to generalising findings to theory – theoretical generalisation – than statistically generalising to a population- effect generalisation (Lee & Lings, 2008; Lynchi, 2011). Subsequently drawing a representative sample is not necessarily required since the significance of the research findings relates to its relevance to the research question and objectives; that is, statistical generalisation of findings is not the goal (Neuman, 2006; Lee & Lings, 2008). The canons of non-random techniques are briefly outlined hereunder. In convenience sampling (or availability sampling), sampling units are selected out of convenience (Babbie, 2004; Bryman & Bell, 2012). Whilst the main drawback for using convenience sampling is embedded in the generalisability of findings concerning the selection bias of participants being different from the target population, it is widely used in social research inquiries because of benefits such as accessibility and a low non-response (Lee & Lings, 2008; Saunders et al, 2012).
  • 63.
    A snowball sampling,as the name implies, is a referral sample for which the researcher uses the initial respondents to help identify other cases relevant to the research topic and then repeats the process again until it reaches a saturation point where there are no new names given. However, the danger of using such a technique is embedded in the problems of bias as respondents are most likely to identify others based on interrelationships (Saunders et al, 2012). A purposive technique involves selecting units for a specific purpose on the basis of the researcher’s judgement. These units are the ones that will be the most useful to answer the research question or representative of the target population (Babbie, 2004). However, the views of Hair et al (2007) are quite similar to those voiced by Neuman (2006) and Lee & Lings (2008) that this technique is not necessarily representative of a population. Another non-probability technique is the quota sampling that resembles stratified random sampling, however the selection of units is entirely non-random (Bryman & Bell, 2012; Saunders et al, 2012). Although this technique may reflect a population in terms of the relative proportions of people in different categories, opponents of probability sampling attribute its representation of a population to superficial characteristics that are influenced by bias in selection of sample units (Bryman & Bell, 2012). The economic havoc wreaked by most UK banks that were the catalysts of the FC in 2007 has induced a collective identity for this sector. In turn, this FC has yielded certain common perceptions amid public, as Bennett & Kottasz (2012) argue. Moreover, the UK banking sector is dominated by few very large banks which, after the FC of 2007, became even more concentrated with the merge of some banks together such as that between Halifax Bank of Scotland (HBOS) and Lloyds TBS to create the Lloyds Group (Chalabi, 2014). These factors
  • 64.
    spurred conducting theresearch for the UK entire banking sector given the temporal effect of the FC that has created a collective identity for the whole sector (Bennett & Kottasz, 2012). Given the above reasoning, along with the infeasibility to identify and create a sampling frame due to the confidentiality policies in the banking sector, a non-probability sampling method in the form of convenience and purposive sampling were recruited. The underlying justification is driven by constructing a coherent sampling strategy to test the research hypotheses statistically with the consideration to capture the advantages of implementing a non-probability method in terms of drawing a convenience sample to collect a large number of completed questionnaire economically through sample units that are most readily available to participate and who can provide the data required. In this setting, response rate techniques with a screening feature were planned to achieve a high response rate with controlled missing data to minimise non-sample errors. On the other hand, purposive sampling was also used in conjunction with the requirements of the research question to collect data from participants with low income less than £14,999 to explore the financial exclusion issue of banks. The proposed hypotheses were tested on a sample of 127 participants who are current customers at one or more of UK banks. The respondents participating in the survey were selected on the basis of varied demographic characteristics, such as age being within a wide range from below 25 to 55 and above years, both male and female customers were invited from different education backgrounds, income categories and diversity in the type of employment status was ensured.
  • 65.
    3.4. DATA TREATMENTAND DATA ANALYSIS TECHNIQUES The data set was exported from Survey Monkey into Excel format and then imported into the Statistical Package for the Social Science (SPSS Version 22.0) to analyse the data. Data preparation constituted coding the data and adjusting the level of measurements to the variables. To this point, the measurements were allocated in accordance with the data type and the technique to apply for the analysis. 3.4.1. SCALES OF MEASUREMENT There are four levels of measurements are depicted in ascending power order as following first nominal scales which represent variables with numeric labels whereby having no order of magnitude classifies them as the least powerful scales. Variables measured using this scale, hence, cannot be placed in rank order. These are non-metric scales that suited non- parametric statistics such as Chi-square statistic (Hair et al, 2007). In this sense, nominal scale is used as a level of measurement to classify the gender and relationship status variables for this study. The inability of ranking variables on nominal scales contrasts with ordinal scales. As its name implies, variables can be ranked. However, the distance between scale points is not equal across the range (Bryman & Bell, 2012). The ranking characteristic of this scale allows for higher level of analysis than with nominal data relevant to non-parametric statistics such as Spearman’s correlation. Given this, ordinal scale was allocated to the education and the duration of maintaining a UK bank account variables. The interval and ratio scales address the arithmetic quality that differences between points on the scale are identical. Whilst ratio scales incorporate the qualities of the other three scales, they diverge from interval for stating the relative difference between any two values
  • 66.
    for a particularvariable, that is, this scale is the highest level of measurement (Lee & Lings, 2008). While Likert scale is characterised as an ordinal scale, it can be argued that Likert scale can be treated as an interval scale given the justification that the gaps between its points are equal in magnitude across the whole range of the scale (Han, 2006; Lee & Lings, 2008; Hair et al, 2007). In addition, this scale is characterised as a metric scale employed with parametric statistics such as Correlation Analysis, Multiple Regression (Hair et al, 2007) which this study implemented to analyse the collected data. Based on this, the independent variables (IVs which are the predictors) and dependent variables (DVs - also known as outcome variables) of this study are measured using Likert five-point scale which is assumed to be interval whereby the gaps between its points are equidistant as illustrated in Figure 5. Figure 5 - Five-point Likert Scale 1 2 3 4 5 Strongly Neutral Strongly Disagree Agree 3.4.2. RELIABILITY ANALYSIS One way of testing internal reliability is the Cronbach’s alpha method which was used in this research to assess whether the items that make up the scale were internally consistent. Cronbach’s (coefficient) alpha is the most common measure of scale reliability that ranges from 0 to 1 within which a value of 0.7 to 0.9 indicates good reliability and 0.7 is the accepted benchmark for Cronbach’s alpha. However 0.60 can be an acceptable level of internal reliability in exploratory research. Consequently, high reliability is explained by (Han, 2006)
  • 67.
    highly correlated itemsthat are measuring the same thing whereby low reliability denotes that the items measuring the scale have very little in common (Hair et al, 2007; Bryman & Bell, 2012). 3.4.3. FACTOR ANALYSIS Aggregating a group of interrelated variables into a smaller set of factors is one of the main objectives to perform factor analysis which is regarded as a versatile means to provide preliminary solution for multivariate data analysis. Two methods can be used in factor analysis, Principle Component Analysis (PCA) and Common Factor analysis. PCA allows for the analysis of both the common and unique variance of a score hence used for data reduction whereas Common Factor analysis is only concerned with the common (shared) variance thus it is used in uncovering construct dimensionality. Based on this, calibration sample was subject to PCA (Field, 2009). The initial step in the preliminary analysis is concerned with checking R-matrix for any extreme scenarios such as multicollinearity of highly correlated variable and low singularity correlation. The suitability of the sample size has to be considered by assessing the Kaiser- Meyer-Olkin (KMO) statistic and Bartlett’s Test of Sphericity. The threshold of 0.6 for KMO indicates an adequate sample size, also Barlett’s test signals the significance of the overall correlations in R-matrix (Field, 2009). Using PCA, the number of components is extracted based on the Kaiser criterion of Eigen values over one, also scree plot aides in the decision by visually spotting where the point of inflexion occurs to retain only components to the left of this point. Regarding rotation, two methods can be used to improve factor solution by maximising the loadings of some of the items. An oblique rotational method allows factors to correlate whereby the other method
  • 68.
    – orthogonal –does not. Thus, the former rotation was sought for the analysis for which factor loading was set as 0.4 as recommended by Field (2009). 3.4.4. CORRELATION ANALYSIS This analysis gauges the degree of covariation between two variables. It can be conducted by using one of the two bivariate correlation coefficients – Pearson’s product-moment correlation coefficient (PMCC) and Spearman’s rho. While the latter deals with ordinal data, the former calculates interval/ratio data which is the level of measurement assigned for the study’s IVs and DVs. Hence, this is the used statistic to quantify the strength of the linear relationship between a pair of variables (Hair et al, 2007). Pearson r assesses the strength and direction of association between two variables such as CSR fit and CR in which the correlation coefficient ranges between -1 and +1. A Pearson r value between +0.9 and +1 denotes a very strong positive correlation, whereby a value between -0.9 and -1 still indicates a very strong correlation but negative which means when one variable increases, the other variable decreases. Moreover, the correlation has no meaning if it is not statistically significant whereby the p-value is less than 0.05. This implies that the relationship is statistically significant hence the null hypothesis is rejected (Bryman & Bell, 2012). 3.4.5. REGRESSION ANALYSIS It is closely connected to Pearson’s r with regards that correlations between variables are linear, however, this analysis allows to ‘predict an outcome variable from one predictor variable (simple regression) or several predictor variables (multiple regression)’ (Field, 2009). The coefficient of determination or R squared entails the amount of variability in one variable explained by the other variable. It can have any value between 0.00 to 1.0 whereby
  • 69.
    the greater theR2 the stronger the association. The F- statistics and its associated probability in the ANOVA table assess the statistical significance of the overall regression model (Hair et al, 2007). In the coefficients table, the regression coefficients (b values) point out the amount of change in the outcome variable resulting from a one unit increase in the predictor. To evaluate the statistical significance of betas (b vales), the t-statistic tests the null hypothesis for the value of b, whereby less than 0.05 it is rejected and b-value is statistically significant. A predictor variable with insignificant beta is not a good predictor of the dependent variable and should be removed from the regression model (Hair et al, 2007). 3.4.6. MEDIATION ANALYSIS Baron & Kenny's mediation approach involves following four steps (Figure 6) to analyse whether certain variable – a mediator – exerts an effect by intervening a relationship between an independent (IV) and dependent variable (DV) (Janice, 2012). Step 1: Involves portraying a structural model to estimate path c in which the IV is assessed whether it correlates significantly with the DV. Based on the existence of a significant correlation between both variable, the rest of the procedure is validated. Step 2: Establishes path a in which the direct relationship between the IV and mediator is tested whereby mediator is regressed on the IV. They must correlate to validate next step. Step 3: Includes testing path b by performing a hierarchical regression whereby, in first step, the DV is regressed on the mediator while, in second step, DV is regressed on the IV. Step 4: Tests path c’ by assessing the relationship between the independent and outcome variables. If it becomes insignificant, then there is full mediation while if this relation remains significant then it confirms a partial mediation.
  • 70.
    Independent variable Dependent variable C’ (Path c) Mediator 3.4.7.ETHICAL CONSIDERATIONS Within the realm of conducting a research, there are some obligations that revolve around ethical concerns starting from the appropriateness of the research to issues emerge in each phase of the research process. This includes not avoiding any risk of causing harm or intruding on privacy to access data, disclosure about the nature of the research and sufficient information to avoid lack of informed consent and maintaining confidentiality of data and anonymity of participants’ identities (Hair et al, 2007; Bryman & Bell, 2012). In compliance with this continuum of ethical principles, this dissertation is also regulated by the Code of Research Practice of The University of West London which sets out researchers’ broad responsibilities. In doing so, a disclosure of the nature and purpose was encapsulated in the introduction of the online questionnaire as well as the invitation email sent to take part in the study. This invitation stated explicitly that participants’ privacy will be protected and that their participation is voluntary whereby they have the right to decline or not to participate in the study (see Appendix II). Confidentiality and anonymity of all participants were dealt with as (Janice, 2012) Figure 6 – Mediation Model
  • 71.
    questionnaires were anonymousand participants were informed that all data collected will remain confidential and are protected according to the Data Protection Act 1998 (DPA). Data will be processed and analysed objectively and a summary of the research findings can be obtained if requested. 3.5. CONCLUSION The study adopted a quantitative method and followed a deductive approach. A questionnaire survey was designed as the primary data source. The collected dataset was analysed using rigorous relevant methods to get the most out of the data in order to have a deep investigation and render sufficient results.
  • 72.
    Chapter 4: Analysisand Discussion of Findings 4.1. INTRODUCTION Given the baseline for the research design to collate the data and methods of analysing it in the methodology chapter, this chapter explores the empirical findings of descriptive and parametric statistics. 4.2. DESCRIPTIVE STATISTICS To tap into the socio-demographic profiles of respondents, a Univariate analysis was conducted via frequency distributions and diagrams to explore the data of one variable at a time. With regards to age distribution, most of the respondents – 41 out of the 92 – were aged 35-44 years (44.6%). The younger age group (less than 25 years) contributed with only 5 respondents (5.4%) while 22 (23.9%) belonged to the middle age group (26-34 years). There were 14 respondents (44.6%) from the older age group (45-54 years) with the remaining 10 (10.9%) belonging to oldest one (55 years and above). As illustrated in Table 2, the figures in the Percent and Valid Percent are the same as there is no missing data. Which of the following categories best describes your age? Frequency Percent Valid Percent Cumulative Percent Valid Below 25 5 5.4 5.4 5.4 26-34 22 23.9 23.9 29.3 35-44 41 44.6 44.6 73.9 45-54 14 15.2 15.2 89.1 55 and above 10 10.9 10.9 100.0 Total 92 100.0 100.0 Table 2 – Age of Respondents (Questionnaire Section A- Q1)
  • 73.
    As for thegender distribution, it was evenly spread across the dataset with 50 female (54.3%) and 42 male (45.7%) (Figure 7). Figure 8 presents the relationship status of respondents, about 50 (54.4%) are married while the remaining 45.65% are spread out over the other different relationships. Regarding the type of employment, 66 respondents were in full time employment (66.30%) followed by 18.48% of being self-employed. Only 1.09% are on retirement (Figure 9). Figure 7 – Gender of Respondents (Questionnaire Section A- Q2) Figure 8 – Relationship status of Respondents (Questionnaire Section A- Q3)
  • 74.
    Table 3 –Respondents’ Annual Income (Questionnaire Section A- Q6) A large group of respondents (35.9%) has an annual income of £75,000 and above. The breakdown of the responses shows that 8.9% earn less than £14,999. The deployment of the purposive sampling technique helped in the inclusion of this segment to ensure covering all relevant questions that address the research objectives. Equally, around 13% of respondents earn within the income brackets of £30,000 - £44,999 and £45,000 - £59,999. What is your current household income (£ gross)? Frequency Percent Valid Percent Cumulative Percent Valid Less than 14,999 8 8.7 8.7 8.7 15,000 - 29,999 17 18.5 18.5 27.2 30,000 - 44,999 12 13.0 13.0 40.2 45,000 - 59,999 12 13.0 13.0 53.3 60,000 - 74,999 10 10.9 10.9 64.1 75,000 and above 33 35.9 35.9 100.0 Total 92 100.0 100.0 Figure 9 – Respondents’ Type of Employment (Questionnaire Section A- Q5)
  • 75.
    Figure 10 showsthat the majority have more than ten years’ experience with their banks which makes up almost 59% of the sample, while only 16.30% have been with their banks for less than five. 4.3. EMPIRICAL FINDINGS OF PARAMETRIC DATA Before analysing the dataset, the data was prepared pertaining to editing, coding and data transformation as appropriate; the data was also examined for anomalies. The research question and objectives were addressed through the statistical analysis of the data in four analytical frameworks. This included performing a number of relevant analysis comprised of reliability analysis to test for the level of consistency among the items within each framework. It was followed by conducting a Factor Analysis for each of the first and the second frameworks. The rationale behind using the Factor Analytic approach is to reduce the large dataset into a smaller set of salient items, hence producing a more manageable number of variables to submit for the subsequent analysis of Multiple Regression (Multivariate analysis) in the analysis of each of the aforementioned frameworks. For the third framework, Pearson product-moment correlation coefficient was performed. The last Figure 10 – Respondents’ relationship duration with their banks (Questionnaire Section A- Q8)
  • 76.
    analytical framework tappedon the mediation effect of CSR on customer-stakeholder purchasing decision (behavioural intention) and bank’s corporate reputation. This was tested by using Baron & Kenny's Mediation procedure (1986, cited in Aggarwal, 2004). 4.3.1. RESEARCH OBJECTIVE ONE Investigate whether perceived CSR activities in the post FC of 2007 has an impact on banks’ customer-stakeholders satisfaction 4.3.1.1. RELIABILITY ANALYSIS Initially, the Cronbach’s alpha was checked to assess the interrelatedness of items that gauge customers’ perception of CSR activities. The estimation of the intercorrelation among these items came satisfactory as 0.96 which reflects a reliable scale (Table 4). Although the scale met the criterion of a very good coefficient alpha, yet, according to Hair et al (2007), an alpha of ≥0.95 should be inspected to eschew a limited breadth of items focus if they do not measure difference aspects of the concept. To address this, the inter-item correlation matrix was visually scanned for high correlation where r ≥ 0.85 (Ioannou, 2009) or r ≥ 0.80 (Field, 2009) as this would exhibit considerable redundancy among items. The preliminary test of multicollinearity revealed that correlation coefficient was within the acceptable margins. Given this, there was not any multicollinearity of perfect linearly relationship between the items. Another investigation was sought pertaining to checking the determinant of the correlation matrix whereby if it is greater than 0.00001 then multicollinearity is not a problem. Thus the determinant value was 1.615E-13- which is 0.00016 which did not signal multicollinearity (Appendix E).
  • 77.
    Table 4 –Reliability Statistics for perceived CSR activities Cronbach's Alpha Cronbach's Alpha Based on Standardized Items N of Items 0.961 0.962 33 Two items with low correlation where r is less than threshold 0.3 were detected in the inter- item correlation matrix. However, by deleting these items, alpha value will not change. This was seen as an early stage to eliminate these items because more rigorous analysis can be sought by checking their level of significance in next stage to consider discarding them from the analysis if they have an adverse effect. Consequently, it was decided not to exclude them as they may contribute differently to the content coverage of the subscale. The overall coefficient alpha was 0.96 thus the scale was adequately reliable. It reflected that all items are positively contributing to the overall reliability. The justification of such value can be a function of the scale length for which factor analysis was used as a remedy to cluster the 33 items into a small set of components with efficient traits to explain as much of the variance in the original data set which would be sufficient enough to perform the regression analysis (Field, 2009; Iatridis, 2011). 4.3.1.2. FACTOR ANALYSIS The calculated KMO statistic on the 33 items gave a result of 0.896 which verified the sampling adequacy. A KMO in the region of 0.8-0.9 is considered perfect and indicated that the sample size was adequate for the factor analysis solution. Furthermore, the Bartlett’s test of sphericity χ² (528) = 2331.783, p < .005 (Table 5) indicated that correlations between items were sufficiently large for factor analysis. While, items Q16 and Q18 have high p-value (> 0.05) with some other items in the R-matrix, overall there was a positive strong correlation among the residual items of the matrix (Appendix F). Moreover, the Bartlett’s
  • 78.
    test was highlysignificant, hence, before deciding to exclude these two items, their communalities were considered. The values came as 0.717 and 0.583 respectively which reflected that both items contribute fairly well to the factor structure and should not be discarded in order not to lose important information. The yardstick was to compare communalities before and after extraction in following steps. Overall, this allowed for factorising the 33 items using PCA to investigate these relationships further and gain deeper insight. Table 5 – KMO and Bartlett's Test Kaiser-Meyer-Olkin Measure of Sampling Adequacy. .896 Bartlett's Test of Sphericity Approx. Chi-Square 2331.783 Df 528 Sig. .000 An initial analysis was performed to obtain Eigen values for each component in the data. Six components had Eigenvalues over Kaiser’s criterion of 1. The first component explained 46.86% of total variance and, in combination, the six components explained about 69.05% of the variance. The point of inflexion in the scree plot occurred at the second point (component). Both Kaiser’s and scree plot criteria have justified retaining two components. The second component constituted of two items which is not an adequate number of items for providing feasible factor solution. Hair et al (1998, cited in Coleman, 2011) advocate for more than three items to generate a reliable solution. Hence, three components with Eigen values greater than one were extracted and oblique rotation was conducted to optimise the factor structure by maximising the loadings of some of the items whereby a factor loading of 0.4 – which is in line with Field’s (2009) suggestion – was used.
  • 79.
    This structure hasyielded insufficient value of alpha coefficient for the second component as Cronbach’s alpha was 0.532 (Appendix G). However, deleting Q16 from the construct would improve alpha value to 0.802, excluding this item hence was corroborated. After deleting Q16, PCA was rerun then the previous analytical approach of extracting and rotating was reiterated. This led to two components retained. They together accounted for 54.02% of the total variance and therefore the factor extraction results were generally satisfactory. The first component was labelled Economic & Legal focus (EC&LG) given the salience of those items with the higher loadings. The second component emerged from Philanthropic & Ethical statements and was named as PH&ET. Moreover, through this process Q18 proved to be inadequate as it has low communality (0.91), thus it was not calculated within any of the components (Table 6). The final two components intercorrelated with r value of 0.634 whereby an r of 0.40 to 0.69 is mediocre as recommended by Cohen & Holliday (1982, cited in Bryman & Cramer, 2005) thereof, overall, there was a positive association between the two components (Appendix H). Table 6 – The Extracted Factor Components and their Alpha values Items Component Cronbach’s Alpha EC&LG PH&ET Q9Financial_Statements .904 .953 Q12Fees .883 Q12Interest_Rates_Accounts .858 Q12Interest_Rates_Loan .740 Q12Open_Or_Close_Branches .734 Q9Transparency .687
  • 80.
    Q12Treated .686 Q12Withdraw_Money .684 Q12Personal_Information_Safe.647 Q12Financial_Stability .627 Q9legal_Obligations .616 Q10 .613 Q9Honest_Relationship .612 Q9Borrowings_And_Savings .589 Q9Offers .572 Q9Confidentially .568 Q11 .566 AQ12Advice_Quality .520 Q9MeetCustomers_Needs .465 Q9Financial_literacy .915 .917 Q9Giving_Back_To_Community .822 Q9Social_Attachment .806 Q9Executive_Remuneration .717 Q9Environmentally_branches .638 Q13 .557 Q9Being_Accountable .527 Q17 .498 Q9Valued_Customer_Recognition .498 Q9Financial_Inclusion_SMEbanking .461 Q14 .452 Q9Combating_Bribery .444 Q18 4.3.1.3. MULTIVARIATE REGRESSION ANALYSIS Based on the findings of factor analysis, the original hypothesis that investigated the relationship between the perceived CSR activities and customer satisfaction was reformulated as follows:
  • 81.
    H1.a: There isa relationship between perceived CSR’ EC&LG activities and customer- stakeholder satisfaction in the post FC of 2007. H1.b: There is a relationship between perceived CSR’ PH&ET activities and customer- stakeholder satisfaction in the post FC of 2007. Multiple linear regression analysis was performed to assess the relationship between the DV – customer satisfaction – and the two IVs – EC&LG and PH&ET. Enter method was used to bring both IVs into the model. The results incorporated that correlation matrix reported a significant positive relationship among all the variables with one-tailed significance of 0.000. Within the R-matrix, the highest correlation was between EC&LG and customer satisfaction (r=0.712). The matrix also did not cast any doubt on multicollinearity issues which was in line with Variance Inflation Factor (VIF) benchmark as being less than ten according to Field (2009) and did not exceed the warrant point of five which is the borderline of diagnosing some multicollinearity (Appendix I). Furthermore, the R-squared showed that EC&LG and PH&ET approximately accounts for 57.7% of the variation in customer satisfaction. The regression model was statistically significant with F-ratio=60.738 and probability level=0.000. It transpired that EC&LG (beta=0.496, p<0.05) and PH&ET (beta=0.341, p<0.05) are positively and significantly related to customer satisfaction. From the magnitude of the b- values, the 0.496 is the estimated increase in likelihood to have a satisfied bank customer- stakeholder associated with a one-unit increase in EC&LG CSR activities. Likewise, customer satisfaction would rise 0.341 for every one-unit increase in PH&ET.
  • 82.
    Table 7 –Multiple linear regression analysis: Impact of CSR activities on Customer Satisfaction Model Unstandardized Coefficients Standardized Coefficients t Sig. B Std. Error Beta 1 (Constant) 3.109 .061 51.370 .000 EC&LG .438 .079 .496 5.564 .000 PH&ET .301 .079 .341 3.829 .000 Taken together, these figures provide evidence of model fit, revealing that the null hypothesis of no relationship between customer-stakeholder satisfaction and both EC&LG and PH&ET CSR activities is rejected, that is, this confirmed supporting the alternative hypothesis of a relationship. Moreover, the findings from the regression model embodied a statistically significant positive relationship between these variables. Based on this, H1.1 and H1.2 are supported. 4.3.2. RESEARCH OBJECTIVE TWO Find out whether there is a relationship between CSR practices and bank customer- stakeholder behavioural intention (purchase behaviour). 4.3.2.1. RELIABILITY ANALYSIS The Cronbach’s alpha value for CSR practices was 0.923 which reflected a good degree of reliability. Four items were very highly correlated with r≥0.80 (Field, 2009; Ioannou, 2009). Rhese items were Q19Compliance with more than minimum regulation, Q19Welfare and goodwill, Q19Low-involvement of philanthropic and Q19High-involvement. r values ranged from 0.807 to 0.893 were detected and deleted from the analysis to avoid multicollinearity. Coefficient alpha value was still good after the removal of these items (Cronbach’s alpha=0.882). Moreover, careful screening of Item-Total Statistics table verified that deleting any other items would not substantially increase the coefficient.
  • 83.
    Table 8 –Reliability Estimates of CSR practices subscale Scale Mean if Item Deleted Scale Variance if Item Deleted Corrected Item-Total Correlation Squared Multiple Correlation Cronbach's Alpha if Item Deleted Q19Reasonable_Interest_Rates 35.36 44.540 .411 .496 .884 Q19Payments_Fees_Transparency 35.29 43.243 .615 .592 .871 Q19Account_Information_Confidentiality 35.28 41.590 .691 .679 .865 Q19CEO_Cuts 36.39 42.263 .431 .490 .887 Q19Financial_Inclusion 36.37 41.818 .492 .407 .881 Q19ValuedCustomer_Treating 35.22 41.842 .761 .742 .862 Q19Honest_Financial_Advice 35.26 41.602 .755 .754 .862 Q19Compliance_With_Law 35.34 41.127 .737 .669 .862 Q19Projects_With_Adverse_Impacts 35.85 39.471 .646 .546 .868 Q19CEO_dont_Misreport 35.63 39.752 .745 .673 .860 4.3.2.2. FACTOR ANALYSIS Both the KMO (0.878) and Bartlett’s test of sphericity χ² (45)=556.572, p<0.05 indicated the suitability of the data for performing factor analysis. Next step involved determining a set of components which had Eigenvalues over Kaiser’s criterion of 1. The suitable factorial method incorporated using Oblique (Direct Oblimin) rotation with factor loading of 0.4. Two components were constructed which explained about 16.28% of the variance in the customer purchasing decision of bank’s products and services. From the pool of ten items, component one included six items within the domain of Economic & Legal practices in accordance to their loading magnitude, thus labelled ECP&LGP. On the other hand, the other four items portrayed the traits of Ethical & Philanthropic practices hence named ETP&PHP. The two components have an adequate correlation (r=0.346). The coefficient alpha for ECP&LGP was 0.898 while alpha for ETP&PHP came as 0.809. That is, both had reliable scales with meaningful indices that gauged customers’ behavioural intention.
  • 84.
    4.3.2.3. REGRESSION ANALYSIS Amultiple linear regression analysis was performed for which ECP&LGP and ETP&PHP articulated the IVs to assess whether they have an impact on customer purchasing decision. The R-squared revealed that approximately 30.9% of variation in customer purchasing decision is explained by IVs. The F-statistic (19.929) in the ANOVA table transpired that the regression model is significant at 0.000 level. Furthermore, ECP&LGP had beta=0.301, p<0.05 and ETP&PHP had beta=0.375, p<0.05 indicated that both were significant predictors of customer purchasing decision (Appendix I). The IVs of CSR practices on purchasing decision (DV) were statistically significant in the model, thereof a statistically significant positive relationship exists between purchasing decision and CSR practices. As such, this lent support to the research hypothesis where customer-stakeholder purchasing decision is associated with CSR practices. 4.3.3. RESEARCH OBJECTIVE THREE Determine whether there is a relationship between CSR fit practices and bank reputation. 4.3.3.1. RELIABILITY ANALYSIS The Cronbach’s alpha for the subscale items of CSR fit practices was 0.879 after deleting Q23 which had a negative r value in the R-matrix. According to Hair et al (2007), all items must be positively correlated. Consequently, the deletion of this item was shown to improve the overall coefficients value from 0.781 to 0.879 which is regarded as a very good value that has exceeded the recommended threshold limits of 0.6. Cronbach alpha coefficient before the deletion of item Q23 is illustrated in Appendix J.
  • 85.
    4.3.3.2. CORRELATION COEFFICIENTANALYSIS The correlation coefficient analysis showed that there was a significant linear association between bank reputation (DV) and the subscale of CSR practices (IV). According to Table 9, bank reputation was positively correlated at the 1% level of significance with CSR subscale (Q21) at r=.372**, r=.464**, r=.495** and r=.582** respectively. Table 9 – Correlation Coefficients for bank reputation and CSR fit practices subscale Mean St.(Dev) Q21CSR_s trategy Q21Confidence Q21Reputable _Business Q21High_ CSR_rating Q22 Q21CSR_strategy 3.91 .847 1 Q21Confidence 4.00 .784 .695** 1 Q21Reputable_ Business 3.98 .784 .543** .643** 1 Q21High_CSR _rating 3.98 .784 .593** .679** .732** 1 Q22More preference will be given to banks 3.54 .965 .372** .464** .495** .582** 1 N of respondents 92 92 92 92 92 Note: ** indicates that Correlation is significant at the 0.01 level (2-tailed). Most CSR subscale items had moderate positive correlation with bank reputation, while high CSR rating criteria had strong – as advocated by Field (2009) when r is higher than .50 – associative relationship with bank reputation. Moreover, Table 9 revealed that the means for all the items were above the mid-point (3.0) of the five –point scale. From the positive correlation of the variables and the statistically significant level, the null hypothesis of no relationship between CSR fit practise and bank reputation was rejected and the alternative hypothesis was verified.
  • 86.
    4.3.4. RESEARCH OBJECTIVEFOUR Investigate whether CSR practices mediates the relationship between bank reputation – the independent variable (X) – and stakeholders' behavioural intentions – the dependent variable (Y). 4.3.4.1. MEDIATION ANALYSIS The procedure of Baron & Kenny (1986, cited in Aggarwal, 2004) used designate CSR practices as the mediator – denoted as M – between bank reputation (X) and stakeholders' behavioural intentions (Y). A Linear regression analysis was performed between bank reputation and customer behavioural intention (purchase behaviour) to assess the validation of conducting the mediation processes based on the criterion of a significant correlation between these variables. Meeting this criterion, three models were constructed to test the mediation effect of CSR practices. Table 10 – Regression Models of Mediation Effect (CSR practices) Model Independent Variable (X) Dependent Variable (Y) R-Square Coefficient (Predictor) P-Value (Predictor) Model 1 Path c Bank reputation Purchase behaviour .370 .609 .000 Model 2 Path a Bank reputation CSR Practices .301 .549 .000 Model 3 Path c’ Bank reputation CSR Practices Purchase behaviour .577 .310 .544 .000 .000 The results for Model 1 (path c) emerged from the verified relationship between bank reputation and purchase behaviour (b=0.609 and p<0.05). This model entailed the direct relationship between these two variables. Likewise, Model 2 (path a) was constructed from
  • 87.
    the statistically significantpositive relationship between bank reputation and CSR practices (b=0.549, p<0.05). By performing hierarchical regression analysis, the last Model 3 (path c’) stemmed from the significant positive relationship between CSR practices, bank reputation and purchase behaviour. This model unveiled the effect of CSR practices variable whereby a significant positive regression coefficient of 0.310 (p<0.05) between bank reputation and purchase behaviour was indicated. Also CSR practices remained significant with p<0.05 when it was added into the relationship. On the other hand, when comparing the beta of Model 1 with that of Model 3, b values had a significant drop from 0.609 to 0.310 (29.9%) which indicated that CSR practices influenced the relationship. Results of the mediation analysis confirmed a partial mediating role of positive CSR practices in the relation between bank reputation and customer behavioural intention. 4.4. DISCUSSION OF FINDINGS The analyses of the collected data have revealed key findings that could be explicated within the ambit of the research aim of contributing towards a dynamic evolution of the CSR construct. The discussion draws out on the empirical findings in relation to the study literature. 4.4.1. CUSTOMER-STAKEHOLDER’S PERCEPTION OF CSR ACTIVITIES IN THE POST FC OF 2007 The empirical results with regards to Research Objective One supported the hypothesised relationship between perceived CSR activities and customer-stakeholder satisfaction. This positive relation indicates that banks have been accountable for the failures of their practices around the FC of 2007 which emanated from adhering to satisfying shareholders at the expense of other stakeholders. This is in line with the argument of Carroll & Shabana (2010) that businesses’ accountability for their impact should extend beyond the narrow
  • 88.
    view of shareholdermodel to incorporate the interests of other stakeholders by integrating social activities in order to leverage the means of satisfying its stakeholders. The fact that a good number of customers have been found to contribute to this study indicates that banks perceive them as an important segment of stakeholders. As this study has shown, customer-stakeholder satisfaction is engendered owing to the inclusion of their interests and meeting their expectations. Hence, the argument made by Freidman advocating a primacy of shareholder is no longer feasible. Moreover, as the findings show, the claim of Windsor (2001, cited in Garriga & Mele, 2004) that the paradigm of short- termism gain and shareholder primacy is still the leitmotiv in business lacks credibility. As such, contemporary disciples of Friedman’s neoliberal premise of shareholder such as Barry 2000, Henderson, 2005 and Jensen, 2001 are not opposing social responsibility actions by companies. Sternberg (1997) defends embracing socio-economic posture in line with business stakeholders to spur efficiency as the exclusion of any stakeholder might affects its ability to attain economic ends (Branco & Rodrigues, 2007). This stakeholder view challenged the single-minded focus of shareholder primacy pointing that the interests of shareholders and stakeholders are aligned rather than in conflict. In this context, the societal values alleged by stakeholders are expected to be satisfied as business functions by the consent of society, thereof these expectations are justifiably attested by business (Lindgreen & Swaen, 2010). The study’s statistical results reveal that the jointly approach of aligning stakeholders’ needs to business activities positively influenced customer-stakeholder perceptions of these activities. They were labelled in the empirical analysis as EC&LG and PH&ET.
  • 89.
    The findings concurwith Carroll’s (1991) CSR model which incorporates these four activities. As it has been reported in the literature review, business has sprung up as an economic unit whereas its driver is a profit motive. It also has an obligation to produce valuable goods and services that meet consumers’ needs at a fair price (Branco & Rodrigues, 2007; Duarte et al, 2010). The salient embodiment of this category is relating business economic objectives to producing goods and services of value to society in tandem to thriving to generate profit. Hence, these responsibilities are required in order to secure their license to operate. The study’s relevant analysis has shared this view whereby customers’ satisfaction of perceiving the economic value from their dealings with businesses precedes the other activities. The second category in Carroll model is the legal responsibilities which captures ‘playing by the rules of the game’ of Friedman’s metaphor, thence, it is presupposed that they coexist with the economic responsibilities as a rationale to the free market paradigm. This activity shared the same weight of importance with Carroll’s model to achieve customer’ satisfaction in the research findings. Carroll (1991) pinpoints that ethical responsibilities imply doing what is right and taking into account the moral duty that business has to society. Philanthropic activities are allied to the idea of giving back to society as the recognition of business to be a good citizen (Crane & Matten, 2010). The study results have reported a discrepancy in the order of the last two CSR activities where perceived philanthropic activities had higher weighting with regards to customer satisfaction than ethical activities. On that point, for both the economic and legal responsibilities Carroll (1991) asserts that they are required while the ethical responsibilities are expected and the philanthropic is desired. By doing so, his model provides insightful assessment of the relative weighting of these responsibilities to set priorities upon them.
  • 90.
    However, Visser (2005)rigidly criticises the relative importance that Carroll has assigned to each responsibility for being biased towards USA context. He has emphasised on the culture context for these assigned priorities giving the example of the high importance of philanthropy in Africa to others. Carroll & Buchholtz (2009) argue that the responsibilities are not mutually exclusive nor intended to be sketched as a continuum from economic to social obligations. The theoretical clouding with regards to the order of these activities can be cleared out based on the practical outcome of this study in which the relative order of these activities adheres to the attribute attached to it. In this context, the perceived CSR activities that have caused customer satisfaction were economic, legal, and philanthropic with ethical as last domain. This might be as a result of business being recovering from the ethical issues provoked by the FC of 2007. Moreover, it could also be derived from the ill-defined characterisation of newly emerging values which can result in an equivocal stance in which there may not be a definitive right answer to resolve many of these ethical issues and result into conflict with the other responsibilities (Jamali, 2007). 4.4.2. CSR PRACTICES AND CUSTOMER-STAKEHOLDER BEHAVIOURAL INTENTIONS The research findings revealed a significant relationship between CSR practices and customer purchasing decision. These outcomes have rekindled Forte & Lamont’s (1998, cited in Boulstridge & Carrigan, 2000) claim that the societal role of the business influences the customer’s criterion in purchasing decision. In a conjunctive scenario, Mohr & Webb (2005, cited in Chomvilailuk & Butcher, 2010) point out that customer’s purchasing decision and company evaluation are positively influenced by CSR initiatives. The study results
  • 91.
    confirm these argumentsand shed light on the importance of different multiple CSR practices which were labelled as ECP&LGP while ETP&PHP on customer purchase decision. These practices built on Carroll’s CSR model in the foregoing discussion. The order of CSR practices is congruent with Carroll’s model. This may be attributable to the different dimensions that have been gauged using the model. In the analysis of perceived CSR activities and customer satisfaction, the dimension measured the level of satisfaction of the perceived CSR. Within the CSR practices and purchasing decision, the dimension measured the level of importance of CSR practices in relation to customer behaviour. This study shares the view of Pirsch et al (2006, cited in Chomvilailuk & Butcher, 2010) that societal attributes which are woven into business operations and core competences can elicit significant positive customers’ behavioural and attitudinal measures such as patronage intention. The high level of economic importance that was highlighted in the research findings tap on the core competencies of business as CSR economic practice induce cost effective products to customers. 4.4.3. CSR AND BANK REPUTATION The emergence of a significant positive relationship between CSR and bank reputation is congruent with the findings of Reputation Institute (2009, cited in Trotta et al, 2011) whereby a positive direct relationship between CSR and CR is reported in the sense that when the commitment to CSR is augmented, the value of CR would be boosted. Moreover, Martin & Ruiz (2007, cited in Chomvilailuk & Butcher, 2010) conjecture a direct link between a customer’s liking for the bank and the bank CSR reputation. The second statement in Q21 with regards to customers’ confidence in business had a significant good correlation with r= 0.464. This came in line with previous studies (Fombrun,
  • 92.
    1996; Trotta etal, 2011) in which CR is regarded as an indicator of business’s legitimacy premised on its credibility in maintaining society’s trust in business and potentially influencing the purchasing behaviour of that public. 4.4.4. MEDITATION EFFECT OF CSR ON CR AND CUSTOMER-STAKEHOLDER BEHAVIOURAL INTENTION The mediation effect emerged from the data is consistent with the findings of Lichtenstein et al (2004, cited in Chomvilailuk & Butcher, 2010). The study findings showed that there is a partial mediation effect of CSR on the relation between CR and customer purchasing behaviour. This would provide a new understanding of the role of CSR for its mediation effect on such relation. This approach would facilitate CSR role in developing business sustainability through its indirect effect on the business economic bottom line. While Carroll & Shabana (2010) argue that the justification of the business case for CSR is based on a direct link to economic ends, the findings add credence to the business case by justifying it on more plausible indices based on the indirect effect of CSR on business economic value. 4.5. CONCLUSION The findings of the four analyses supported the alternative hypotheses of a positive correlation between CSR and customer satisfaction, customer purchase behaviour and CR respectively. The findings for the CSR mediation effect also revealed a partial mediation of CSR on the relationship between CR and customer purchase behaviour. The discussion of these findings was compared with findings of pertinent studies from the literature review.
  • 93.
    Chapter 5: Conclusionand Recommendations 5.1. INTRODUCTION The previous chapter evolved around the critical discussion of the study findings in the context of the literature. This involved comparing the empirical findings to the results of previous studies. The discussion was guided by four research objectives that were geared towards the empirical testing of the hypothesised relationships. Consequently, the objective of this chapter is to draw conclusions from these findings to answer the research question and address the research objectives. This is followed by demonstrating the theoretical and practitioner contributions that this research makes. It also discloses recommendations for future research and limitations concerning this research. 5.2. CONCLUSION At the outset, this study’s objectives aimed at investigating the likelihood of CSR development in the post FC of 2007 with regards to two avenues. The first was customer- stakeholders’ satisfaction of perceived CSR activities in the FC whereas the second was related to the implications of strategic CSR on CR as well as the possibility of influencing customers purchasing decision. As illustrated in the analytical framework, using Carroll’s (1991) CSR four dimensions to assess whether these dimensions affect customer satisfaction and their purchasing decision, the empirical outcomes highlighted some similarities as well as an angle of difference with Carroll model. The similarity pertains to the order of the economic and legal CSR dimensions. The findings showed that these two dimensions came in the same order as Carroll model.
  • 94.
    Aligned with Carroll’smodel in terms of designating CSR economic activities as the base for the other three activities, the findings demonstrated the banks’ commitment to deliver highly satisfactory economic value to their customers. This manifests their recognition of the importance of customer-stakeholder group to their continuity. As for the legal dimension, it has been argued that while business is obliged to perform in a law-abiding manner, most businesses would cultivate CSR practices as self-regulatory to keep at bay more legalisations (Freeman & Liedtka, 1997). In support, the perceived CSR legal activities seemed to encounter high level of customer satisfaction, indicating how most banks have been able to seize the advantages of adhering to CSR by maintaining a plausible satisfactory level of legal compliance. Some key findings have emerged from the preceding remarks pertaining to banks’ discerning CSR practices that elicit high satisfactory levels for the activities that are conceived to be most important to customers when making purchasing decision. These findings support the view of a win-win scenario exhorted via the value creation perspective of strategic CSR (Mullerat, 2010). Accordingly, this reveals that the dynamics of banks’ CSR practices are in line with customers’ expectation. As such, CSR has evolved whereby practitioners have developed CSR activities by sustaining value-creation for their customer-stakeholders. This, along with the four verified hypotheses, unveiled the answer to the research question. And the study was able to establish that the FC of 2007 has been a wake-up call for banks’ CSR activities to resonate customers’ expectations and needs. 5.3. PRACTITIONER CONTRIBUTIONS While the inclusion of stakeholders’ interests into business strategies can act as a point of differentiation and be a source of sustainable competitive advantage (Fombrun, 1996 cited
  • 95.
    in Nilsen, 2010),it is pivotal to map out the level of importance of CSR practices to fulfil them accordingly. This was the case with regards to the difference in the order of the ethical and philanthropic dimensions between Carroll CSR model and the empirical outcomes. For the satisfaction avenue, philanthropic had preceded the ethical dimension, but was the other way around for the case of the purchasing decision. In this context, while the level of ethical CSR activities had a moderate importance on customer purchasing decision, the level of customer satisfaction of perceived CSR ethical activities was the least fulfilled dimension. This discrepancy can provide insights on the level of CSR efforts that need to be maintained to, on one hand, capitalise on the core competences in how to be active in this dimension and, on the other hand, achieve competitive advantage by attaching attributes favoured by customer-stakeholders. Furthermore, the mediation effect that CSR exerts on banks reputation to influence customers’ purchasing decision can enhance their respective financial well-being and hence achieve a pragmatic approach to CSR. While CSR can provide competitive advantages to a business, if banks’ CSR motives are questionable, they could have far detrimental effects on the business possibly amounting to customers exerting their purchasing influence as a means of punishing them. Taken together, CSR can be considered the business’s compass guiding them to develop societal activities that create value to both ends when fulfilling the role that business was set out to achieve. 5.4. THEORETICAL CONTRIBUTIONS These contributions are threefold. As emphasised in the introduction, CSR literature on the financial sector is under-researched and, with regards to CSR marketing, there is a distinct lack in investigating the effect of multiple CSR activities on customers’ attitudes. Given this, the study’s intended contribution was to provide empirical findings to fill this void and
  • 96.
    contribute to betterunderstand one of the most contestable fields in contemporary management. The application of strategic CSR can yield sustainable competitive advantages if applied in tandem to the dynamics of social structure. The second contribution stems from the study findings showing positive significant CSR- customer relationships. This stresses that CSR became a management mainstream which shed further light on the prominence of stakeholder orientation to shareholder. Moreover, adhering to stakeholder approach resulted in the significant findings of this study from which emerged the indirect impact of CSR on CR and hence customer purchase behaviour. This in turn have an effect on business economic ends. The debate on whether CSR should be abandoned is no longer valid. However, the focus should be on what kind of benefits businesses can capitalise on to leverage efficient CSR practices and adoption. As for the third contribution, the stakeholder modus operandi attribute provides a systematic framework approach to the CSR literature which helps mapping out stakeholders’ needs. 5.5. RECOMMENDATIONS FOR FUTURE RESEARCH AND RESEARCH LIMITATIONS This study provided new insights in CSR topics by arguing the indirect effect of CSR in yielding competitive advantage that gives credence to the business case for CSR. As the field of banking and CSR-CR is relatively a new one, research in many avenues on CSR can be unlocked. One interesting area in investigating the business case for CSR is that of CSR mediation effect. Another avenue is to investigate multiple CSR domains on different customer attitudes as, so far, most extant studies offer very limited insights into customers’ attitudes relative to one or two dimensions of CSR. Regarding stakeholder approach, the focus-to-date has been limited to customers and employees whereas other stakeholders could influence business performance in different
  • 97.
    ways. This wouldprovide better understanding of the field therefore a replication of this study in other contexts is noteworthy as well as extending it into other countries. Nevertheless, the results are quite robust. The study’s drawback stems from the employment of a non-random sampling technique. This could represent a study limitation in terms of generalizability. However, the response rate was 46% which led to in-depth investigation considered representative of the population (Ismail et al, 2012). As a final remark, all of the research objectives, as stated in Chapter 1, were met.
  • 98.
    References Aggarwal, P (2004)The Effects of Brand Relationship Norms on Consumer Attitudes and Behavior, Journal of Consumer Research, 31 (1), 87–101 Ahenkora, K, Banahene, S & Quartey, J (2013) Societal Value Antecedent of Corporate Social Responsibility and Business Strategy. Journal of Management and Strategy, 4(4), 58–64 Alvesson, M (2009) (Post-) Positivism, Social Constructionism, Critical Realism: Three Reference Points in the philosophy of science [Accessed 10Jul 2014] http://www.sagepub.com/upm- data/28039_02_Alvesson_2e_Ch_02.pdf Babbie, E (2004) The Practice of Social Research, 10th ed. Wadsworth/Thomson Learning Barry, N P (2000) Controversy: Do Corporations Have Any Responsibility Beyond Making a Profit? Journal of Markets and Morality, 3(1), 100-107 Barth, R & Wolff, F (2009) Corporate Social Responsibility in Europe: Rhetoric and Realities. Edward Elgar Pub Barton, C E (2010) Understanding Corporate Social Responsibility Engagement In Small And Medium Tourism Businesses. Bachelor Thesis, Faculty of Business, University Of Technology, Sydney Bartscht, M (2013) Corporate Social Responsibility In The Information Technology Sector A Focus Group Study On How European Consumers View CSR And Corporate Behavior. Master Thesis, Erasmus School of History, Culture and Communication, Erasmus University Rotterdam Beckmann, S C (2007) Consumers and corporate social responsibility: matching the unmatchable? Australasian Marketing Journal, 15(1), 27-36 Bennett, R & Kottasz, R (2012) Public attitudes towards the UK banking industry following the global financial crisis. International Journal of Bank Marketing, 30(2), 128–147 Berens, G, Van Riel, C B M & Van Rekom, J (2007) The CSR-quality trade-off: when can corporate social responsibility and corporate ability compensate each other? Journal of Business Ethics. 74(3), 233–252 Bhasker, R A (1978) Realist Theory of Science. Harvester Press Bhattacharya C B & Sen, S (2001) Does Doing Good Always Lead to Doing Better? Consumer Reactions to Corporate Social Responsibility. Journal of Marketing Research, 38(2), 225–243 Blowfield, M & Murray, A (2008) Corporate Responsibility: A Critical Introduction. Oxford University Press Blumberg, B, Cooper, D R, Schindler, P S (2008) Business Research Methods, 2nd European ed. McGraw-Hill Higher Education Bouldstridge, E & Carrigan, M (2000) Do consumer really care about corporate responsibility? Highlighting the attitude-behaviour gap. Journal of Communication Management, 4(4), 355–68 Bouvain, P, Baumann, C, Lundmark, E (2013) Corporate social responsibility in financial services: A comparison of Chinese and East Asian banks vis‐à‐vis American banks. International Journal of Bank Marketing, 31(6), 420–439 Bowen H (1953) Social Responsibility of the Businessman. Harper & Row: New York Brammer, S, Millington, A & Rayton, B (2007) The contribution of corporate social responsibility to organizational commitment. The International Journal of Human Resource Management, 18(10), 1701–19
  • 99.
    Branco, M C& Rodrigues, L L (2007) Positioning stakeholder theory within the debate on corporate social responsibility. Electronic Journal of Business Ethics and Organization Studies, 12(1), 5–15 Broomhill, R (2007) Corporate Social Responsibility: Key Issues and Debates, The Dunstan Papers Brown, L E (2012) Corporate Social Responsibility in NCAA Athletics: Institutional Practices and Decision Makers. PhD Dissertation, Ohio State University Brown, T & P A Dacin (1997) The Company and the Product: Corporate Associations and Consumer Product Responses. Journal of Marketing, 61(1), 68–84 Bryman, A & Bell, E (2011) Business Research Methods, 3rd ed. Oxford University Press Camilleri, M A (2012) Creating Shared Value through Strategic CSR in Tourism. PhD Thesis, University of Edinburgh Business School, The University of Edinburgh Cardigan, M & Attalla, A (2001) The myth of the ethical consumer – do ethics matter in purchase behaviour? Journal of Customer Marketing, 18(7), 560–78 Carroll, A B (1979) A three-dimensional conceptual model of corporate performance. Academy of Management Review, 4(4), 497–505 Carroll, A B (1991) The Pyramid of Corporate Social Responsibility: Towards the Moral Management of Organisational Stakeholders. Business Horizons, 34(4), 39–48 Carroll, A B (1999) Corporate social responsibility: Evolution of a definitional construct. Business and Society, 38 (3), 268–96 Carroll, A B & Shabana, K (2010) The Business Case for Corporate Social Responsibility: A Review of Concepts, Research and Practice, 12(1), 85–105 Carroll, A B & Buchholtz, A (2009) Business & Society: Ethics, Sustainability, and Stakeholder Management, 7th ed. Cengage Learning Caruana, A (2008) Facets of corporate identity, communication and reputation. Edited by T. C. Melewar Chalabi, M (2014) UK banks: how powerful are they? [Accessed 10 Jun 2014] www.theguardian.com/news/reality-check/2014/jan/17/uk-banks-how-powerful-are-they-ed- miliband-labour Cheers, Z (2011) The Corporate Social Responsibility Debate. Senior Honours Thesis, School of Business, Liberty University Choi, B & La, S (2013) The impact of corporate social responsibility (CSR) and customer trust on the restoration of loyalty after service failure and recovery. Journal of Services Marketing, 27(3), 223– 233 Chomvilailuk, R & Butcher, K (2010) Enhancing brand preference through corporate social responsibility initiatives in the Thai banking sector. Asia Pacific Journal of Marketing and Logistics, 22(3), 397–418 Condosta, L (2012) How banks are supporting local economies facing the current financial crisis: An Italian perspective. International Journal of Bank Marketing, 30(6), 485–502 Crane, A & Matten, D (2010) Business Ethics: Managing Corporate Citizenship and Sustainability in the Age of Globalization, 3rd ed. Oxford University Press Creswell, J (2003) Research Design: Qualitative, Quantitative, and Mixed Methods Approaches, 4th ed. SAGE Publications, Inc Croucher, S (2014) S&P: UK Banks Face Best Profits Since Financial Crisis in 2014 [Accessed 10 Jun 2014] www.ibtimes.co.uk/sp-uk-banks-face-best-profits-since-financial-crisis-2014-1432390
  • 100.
    Cruijsen, C, Haan,J & Jansen, D (2013) Trust and Financial Crisis Experiences. DNB Working Paper 389. De Nederlandsche Bank Davies, R (2013) Banks cost investors almost £150billion after string of scandals since the financial crisis, says report [Accessed 10 of Jul 2014] www.thisismoney.co.uk/money/news/article- 2529203/LSE-Banks-cost-investors-150billion-string-scandals-financial-crisis.html Davis K (1973) Social Responsibility is Inevitable. California Management Review, 14(1), 14–20 Decker, O S (2004) Corporate Social Responsibility and structural change in the financial services. Managerial Auditing Journal, 19(6), 712–728 Dicken, P (2011) Global Shift, Sixth Edition: Mapping the Changing Contours of the World Economy, 6th ed. The Guilford Press Drucker, P (2002) Managing in the Next Society Duarte, A P, Mouro, C & Neves, J (2010) Corporate social responsibility: Mapping its social meaning. Management Research: The Journal of the Iberoamerican Academy of Management, 8 (2), 101–122 Dusuki, A W (2008) What does Islam say about corporate social responsibility (CSR)? Review of Islamic Economics, 12(1), 5–28 Edelman (2014) Trust In Financial Services [Accessed 15 Aug 2014] www.edelman.com/insights/intellectual-property/2014-edelman-trust-barometer/trust-in- business/trust-in-financial-services/ Ellen, P S, Webb, D J & Mohr, L A (2006) Building corporate associations: Consumer attributions for corporate socially responsible programs. Journal of the Academy of Marketing Science, 34(2), 147−158 Field, A (2009) Discovering Statistics Using SPSS, 3rd ed. SAGE Publications Ltd Fombrun, C J (1996) Reputation: Realizing Value from the Corporate Image. Harvard Business School Press Fombrun, C J & Shanley, M (1990) What’s in a Name? Reputation Building and Corporate Strategy. The Academy of Management Journal, 33(2), 233–258 Fombrun , C J, Gardberg, N A & Sever, J (2000) The Reputation Quotient: A multi-stakeholder measure of corporate reputation. Journal of Brand Management, 7 (4), 241–55 Freeman, E & Liedtka, J (1997) Stakeholder capitalism and the value chain. European Management Journal, 15(3), 286–296 Freeman, R E (1984) Strategic Management: A Stakeholder Perspective. Englewood Cliffs, NJ: Prentice Hall Frederick, W C (1994) From CSR1 to CSR2. Business and Society, 33(2), 150–166 Frederick, W C (2006) Corporation, Be Good! The Story of Corporate Social Responsibility. Dogear Publishing Friedman, M (1970) The Social Responsibility of Business is to Increase its Profits [Accessed 10 Mar 2014] www.colorado.edu/studentgroups/libertarians/issues/friedman-soc-resp-business.html Garriga, E & Mele, D (2004) Corporate Social Responsibility Theories: Mapping the Territory, Journal of Business Ethics, 53(1-2), 51–71 Gatti, L, Caruana, A & Snehota, I (2012) The role of corporate social responsibility, perceived quality and corporate reputation on purchase intention: Implications for brand management. Journal of Brand Management. 20(1), 65–76
  • 101.
    Griseri, P &Seppala, N (2010) Business Ethics and Corporate Social Responsibility, 1st ed. Cengage Learning Hair, J F Jr, Money, A H, Samouel, P, Page, M (2007) Research Methods for Business. John Wiley & Sons Han, Y (2006) Impact of Brand Identity on Perceived Brand Image of the Nelson Mandela Metropolitan University. Master Thesis, Faculty of Business and Economic Sciences, Nelson Mandela Metropolitan University Hay, R & Gray, E (1974) Social responsibilities of business managers. Academy of Management Journal, 17, 135–143 Haynes, K, Dillard, J & Murray, A (2012) Corporate Social Responsibility - A Research Handbook, Routledge Henderson, D (2005) The role of business in the world today. Journal of Corporate Citizenship, 17, 30-32 Herzig, C & Moon, J (2011) Corporate Social Responsibility, the Financial Sector and Economic Recession. Financial Services Research Forum Holden, M & Lynch, P (2004) Choosing the Appropriate Methodology: Understanding Research Philosophy (RIKON Group). The Marketing Review, 4(4), 397–409 Iatridis, K (2011) The Influence of Corporate Social Responsibility on Business Practice: The Case of International Certifiable Management Standards. PhD Thesis, Lancashire Business School, University of Central Lancashire Idowu, S & Filh, W (2008) Global Practices of Corporate Social Responsibility, Springer Ioannou, A (2009) Development and Initial Validation of a Satisfaction Scale on Diversity, University of Connecticut Isaksson, L (2012) Corporate social responsibility :a study of strategic management and performance in Swedish firms. PhD Thesis, School of Business, Bond University Ismail, R, Boye, C & Muth, A (2012) Customer Brand Relationship – An empirical study of customers’ perception of brand experience, brand satisfaction, brand trust and how they affect brand loyalty. Bachelor Thesis, Linnaeus University, School of Business and Economics. Jamali, D (2007) The Case for Strategic Corporate Social Responsibility in Developing Countries. Business and Society Review, 112(1), 1–27 Janice, W (2012) The study of Consumer Perception on Corporate Social Responsibility (CSR) Towards Consumers Attitude and Purchase Behavior, BA Thesis, Institute of Textiles & Clothing, The Hong Kong Polytechnic University Jensen, M C (2001) Value maximization, Stakeholder Theory, and the Corporate Objective Function. Journal of Applied Corporate Finance, 14(3), 8-21 Juma'h, A H (2006) Empirical And Realistic Approaches Of Research. Inter Metro Business Journal, 2(1), 88–108 Karlsson, F (2013) CSR In China For China: A qualitative study of how National Business System influences Corporate Social Responsibility in China and its implications for Swedish firms. Master Thesis. Copenhagen Business School Kotler, P & Lee, N (2005) Corporate Social Responsibility – Doing the Most Good for Your Company and Your Cause. New Jersey: John Wiley and Sons, Inc
  • 102.
    Lantos, G P(2001) The Boundaries of Strategic Corporate Social Responsibility. Journal of Consumer Marketing, 18(7), 595–630 Lantos, G P (2002) The Ethicality of Altrustic Corporate Social Responsibility. Journal of Consumer Marketing, 19(3), 205–232 Lech, A (2013) Corporate Social Responsibility and Financial Performance. Theoretical and Empirical Aspects. Comparative Economic Research, 16(3), 49–62 Le Roux, C (2012) An Assessment Of The Role Of Corporate Brand Identity In Corporate Brand Image Formation. PhD Thesis, University of South Africa Lee, N & Lings, I (2008) Doing Business Research: A Guide to Theory and Practice. SAGE Publications Ltd Levitt T (1958) The Dangers of Social Responsibility. Harvard Business Review, 36(5), 41–50 Lewis, S (2003) Reputation and corporate responsibility. Journal of Communication Management, 7(4), 356–366 Lindgreen, A & Swaen, V (2010) Corporate Social Responsibility. International Journal of Management Reviews, 12(1), 1–7 Louche, C, Idowu, S O & Filho, W L (2010) Innovative CSR: From Risk Management to Value Creation. Greenleaf Publishing Luo, X & Bhattacharya, C B (2006) Corporate social responsibility, customer satisfaction, and market value. Journal of Marketing, 70(4), 1–18 Lynchi, G (2011) Research Methods for the study of religion: Sampling. University of Kent Maden, C, Arıkan, E, Telci, E E & Kantur, D (2012) Linking Corporate Social Responsibility to Corporate Reputation: A Study on Understanding Behavioral Consequences. Procedia - Social and Behavioral Sciences, 58 (1), 655–664 Maignan, I (2001) ‘‘Consumers’’ Perceptions of Corporate Social Responsibilities: A Cross-Cultural Comparison. Journal of Business Ethics, 30(1), 57–72 Maignan, I & Ferrell, O C (2001) Corporate citizenship as a marketing instrument – Concepts, evidence, and research directions. European Journal of Marketing, 35 (3/4), 457–484 Maignan, I & Ferrell, O C (2004) Corporate social responsibility and marketing: An integrative framework. Journal of the Academy of Marketing Science, 32(1), 3–19 Mandhachitara, R & Poolthong, Y (2011) A model of customer loyalty and corporate social responsibility. Journal of Services Marketing, 25(2), 122–133 Maon, F, Lindgreen, A & Swaen, V (2009) Designing and implementing corporate social responsibility: an integrative framework grounded in theory and practice. Journal of Business Ethics, 87(1), 71-89 Margolis, J, Elfenbein, H & Walsh, J (2009) Does it pay to be good…And Does it matter? A meta- analysis of the relationship between corporate social and financial performance [Accessed 1 Jul 2014] http://ssrn.com/abstract=1866371 Martin, J, Petty, J W & Wallace, J S (2009) Value Based Management with Corporate Social Responsibility (Financial Management Association Survey and Synthesis), 2nd ed. Oxford University Press Mayer, C (2013) Firm Commitment: Why the corporation is failing us and how to restore trust in it, Oxford University Press
  • 103.
    McDonald, L M& Thiele, S R (2008) Corporate social responsibility and bank customers satisfaction: A research agenda. International Journal of Bank Marketing, 26(3), 170–182 McWilliams, A & Siegel, A D (2001) Corporate Social Responsibility: A Theory of the Firm Perspective. The Academy of Management Review, 26(1), 117–127 McWilliams, A, Siegel, A D & Wright, P (2006) Corporate social responsibility: Strategic implications. Journal of Management Studies, 43(1), 1-18. Mittal, R (2008) Corporate Social Responsibility – Consumers’ Perspective. Master Thesis, University of Nottingham Mostovicz, E, Kakabadse, A & Kakabadse, N (2011) The four pillars of corporate responsibility: ethics, leadership, personal responsibility and trust. Corporate Governance: The International Journal of Effective Board Performance, Vol. 11 (4), pp. 489–500. Mulki, J P & Jaramillo, F (2011) Ethical reputation and value received: customer perceptions. International Journal of Bank Marketing, 29(5), 358–372 Mullerat, R (2010) International Corporate Social Responsibility: The Role of Corporations, Kluwer Law International Newman, I & Benz, C (1998) Qualitative-quantitative Research Methodology: Exploring the Interactive Continuum, Southern Illinois University Press Neuman, W (2006) Social Research Methods: Qualitative and Quantitative Approaches, 6th ed. Pearson Education Inc Nilsen, H (2010) CSR in banking: The pursuit toward repairing legitimacy and reputation. M.Sc. Thesis, Copenhagen Business School Osterhus, T L (1997) Pro-social Consumer Influence Strategies: When and How Do They Work?, Journal of Marketing, 61(4), 16–29 Park, J, Hanjoon, L & Chankon, K (2014) Corporate social responsibilities, consumer trust and corporate reputation: South Korean consumers' perspectives. Journal of Business Research, 67(3), 295–302 Parker, G & Moore, E (2013) RBS faces accusations on client treatment [Accessed 1Apr 2014] www.ft.com/cms/s/0/f8da353e-5515-11e3-a321-00144feabdc0.html#axzz2xbuZpHVB Pearce, J A II, & Doh, J P (2005) The high impact of collaborative social initiatives. MIT Sloan Management Review, 46(3) 30–38 Peloza, J & Shang, J (2011) Investing in CSR to enhance customer value. Director Notes of the Conference Board, 3(3), 1-10. http://papers.ssrn.com/sol3/papers.cfm?abstract_id=1843308 Pendse, S (2012) Ethical Hazards: A Motive, Means, and Opportunity Approach Curbing Corporate Unethical Behavior, Journal of Business Ethics, 107(3), 265–279 Pomering, A & Dolnicar, S (2009) Assessing the prerequisite of successful CSR implementation: Are consumers aware of CSR initiatives? Journal of Business Ethics, 85 (2s), 285–301 Porta, D D & Keating, M (2008) Approaches and Methodologies in the Social Sciences: A Pluralist Perspective. Cambridge University Press Porter, M E & Kramer, M R (2002) The competitive advantage of corporate philanthropy. Harvard Business Review, 80(12), 57-68 Porter, M E & Kramer, M R (2006) Strategy and society: The link between competitive advantage and corporate social responsibility. Harvard Business Review, 84(12), 1–15
  • 104.
    Reinhardt, F, Stavins,R & Vietor, R (2008) Corporate Social Responsibility Through an Economic Lens. NBER Working Paper 13989, National Bureau of Economic Research Relaño, F (2011) Maximizing social return in the banking sector. Corporate Governance: The international journal of business in society, 11(3), 274–284 Robson, C (2011) Real World Research, 3rd ed. Wiley Roig , J, Guillen, M, Coll, S & Saumell, R (2013) Social value in retail banking. International Journal of Bank Marketing, 31(5), 348–367 Rothschild, E (2013) Banking must pursue the holy grail of confidence [Accessed 1Apr 2014] www.ft.com/cms/s/0/d9d7b490-dcbb-11e2-b52b- 00144feab7de.html?siteedition=uk#axzz2oqsNxq00 Samy, M, Odemilin, G & Bampton, R (2010) Corporate social responsibility: a strategy for sustainable business success. An analysis of 20 selected British companies. Corporate Governance: The international journal of business in society, 10(2), 203–217 Saunders, M N K, Lewis, P, Thornhill, A (2012) Research Methods for Business Students, 6th ed. Financial Times/ Prentice Hall Sexty, R (2010) Canadian Business and Society: Ethics and Responsibilities, 2nd ed. McGraw-Hill Ryerson Higher Education Shannon, L (2013) Give your bank its marching orders - Why you should ditch the giants such as Lloyds and RBS for a tiny building society [Accessed 1Apr 2013] www.thisismoney.co.uk/money/saving/article-2527524/Give-bank-marching-orders-Why-ditch- giants-Lloyds-RBS-tiny-building-society.html Sharma, A & Kiran, R (2013) Corporate Social Responsibility: Driving forces and challenges. International Journal of Business Research and Development, 2(1), 18–27 Sims, R (2003) Ethics and Corporate Social Responsibility: Why Giants Fall, Praeger Smissen, L V D (2012) The value of Corporate Social Responsibility for consumers. Master Thesis, Faculty of Economics & Management, Hogeschool - Universiteit Brussel Smith A (1776) An Inquiry into the Nature and Causes of the Wealth of Nations. W. Strahon and T. Cadell: London Sohail, A, Shahzad, K & Din, I A (2008) The role of corporate social responsibility to create positive positioning in the branding of a country and particular to Pakistan. Master Thesis. School of Management, Blekinge Institute of Technology Sun, W, Stewart, J & Pollard, D (2010) Reframing Corporate Social Responsibility: Lessons from the Global Financial Crisis. Emerald Group Publishing Limited Sternberg, E (1997) The Defects of Stakeholder Theory. Corporate Governance, 5(1), 3–10 Sweeney, L (2009) A Study of Current Practice of Corporate Social Responsibility (CSR) and an Examination of the Relationship Between CSR and Financial Performance Using Structural Equation Modelling (SEM). PhD Thesis, College of Business, Dublin Institute of Technology Tam, K K (2007) Effect of Brand Image on Consumer Purchasing Behaviour on Clothing: Comparison between China and the UK’s Consumers. PhD Thesis, University of Nottingham The Telegraph (2014) Economy growing at fastest pace since financial crisis [Accessed 1Apr 2014] www.telegraph.co.uk/finance/economics/10600424/Economy-growing-at-fastest-pace-since- financial-crisis.html
  • 105.
    Thomas, P (2010)Research Methodology and Design [Accessed 2Jul 2014] http://uir.unisa.ac.za/bitstream/handle/10500/4245/05Chap%204_Research%20methodology%20a nd%20design.pdf Trotta, A, Lannuzzi, A, Cavallaro, G & Dell’atti, S (2011) Banking reputation and CSR: a stakeholder value approach. In Gummesson E., C. Apples, Polese F. Service Dominant logic, Network & System Theory and Service Science: Integrating Three Perspectives for a New Service Agenda, Giannini Editore, The 2011 Naples Forum On Service, Napoli, Italy Turner, A (2003) Sampling strategies. United Nations Secretariat, Statistics Division, Expert Group Meeting to Review the Draft Handbook on Designing of Household Sample Surveys Visser, W (2005) Revisiting Carroll’s CSR Pyramid: An African Perspective. In Corporate Citizenship in a Development Perspective, edited by Esben Rahbek Pedersen & Mahad Huniche, Copenhagen: Copenhagen Business School Press Visser, W (2010) The Age of Responsibility: CSR 2.0 and the New DNA of Business. Journal of Business Systems, Governance and Ethics, 5 (3), 7–22 Vogel, D J (2005) Is there a market for virtue? The business case for corporate social responsibility. California Management Review, 47(4), 19–45 Walsham, R (1995) Interpretive case studies in IS research: nature and method. European Journal of Information System, 4(2), 74–81 Williams, R & Elliott, L (2010) Crisis and Recovery: Ethics Economics and Justice. Palgrave Macmillan Wood D (1991) Social Issues in Management: Theory and Research in Corporate Social Performance. Journal of Management, 17(2), 383–406 Yelkikalan, N & Kose, C (2012) The Effects of The Financial Crisis on Corporate Social Responsibility. International Journal of Business and Social Science, 3(3), 292–300 Zhowa, T (2010) Corporate social responsibility – As A Competitive Advantage Strategy by Community Banks in Tshwane. Master Thesis, Faculty of Management Sciences, Tshwane University of Technology
  • 106.
    Appendices APPENDIX A –SURVEY EMAIL INVITATION Dear (name of respondent), I hope my email finds you well. I am writing to you requesting the completion of a survey on CSR (Corporate Social Responsibility). It is part of my MBA Dissertation at University of West London Business School. The research aims to investigate “Customer attitudes to the role of Corporate Social Responsibility (CSR) in the UK Banking Sector since the financial crisis in 2007”. The respondents need to have a UK Bank Account and the survey ensures that before continuing. The survey is administered using Survey Monkey and, to complete the survey, you need to go to the following link: https://www.surveymonkey.com/s/YL28TTG The connection is secured and the survey ensures the confidentially of the information received. All data will be anonymous and no inferences regarding any individual will be made. If you require more information or assistance or would like to receive a copy of the results please do not hesitate to contact me on my email address below. Thank you for your assistance in this important research. Best Regards, _______________________ Amany Hamza Executive MBA student at University of West London Business School Email: amany@student.uwl.ac.uk
  • 107.
    APPENDIX B1 –SURVEY FIRST REMINDER Dear (name of respondent), Thank you very much for those who completed the survey sent out on the 14th of July. This is a reminder for those who haven’t been able to complete it yet. We’d appreciate it very much if you can complete it as soon as possible. For any questions, please feel free to contact me on my email below. Thank you very much for your cooperation. Best Regards, _______________________ Amany Hamza Executive MBA student at University of West London Business School Email: amany@student.uwl.ac.uk
  • 108.
    APPENDIX B2 –SURVEY FINAL REMINDER Dear (name of respondent), Thank you very much for those who completed the survey sent out on the 14th of July. This is a reminder for those who haven’t been able to complete it yet. There is still a chance to complete and contribute to a research that could benefit of all us. We’d appreciate it very much if you can complete the survey as soon as possible as we will be closing it by the 12th of August. For any questions, please feel free to contact me on my email below. Thank you very much for your cooperation. Best Regards, _______________________ Amany Hamza Executive MBA student at University of West London Business School Email: amany@student.uwl.ac.uk
  • 109.
  • 118.
    APPENDIX D –ACRONYMS CSR Corporate Social Responsibility CR Corporate Reputation DV Dependent Variable EC&LG Economic & Legal ECP&LGP Economic Practices & Legal Practices ETP&PHP Ethical Practices & Philanthropic Practices FC Financial Crisis IV Independent Variable KMO Kaiser-Meyer-Olkin PCA Principle Component Analysis PH&ET Philanthropic & Ethical
  • 119.
    Appendix E- ResearchObjective one - Reliability Analysis 1 Reliability Statistics Cronbach's Alpha Cronbach's Alpha Based on Standardized Items N of Items .961 .962 33 Inter-Item Correlation Matrix Q9Borrowings_ And_Savings Q9Transparenc y Q9Financial_St atements Q9Offers Q9Borrowings_And_Savings Q9Transparency Q9Financial_Statements Q9Offers Q9Executive_Remuneration Q9Financial_Inclusion_SMEbanking Q9MeetCustomers_Needs Q9Social_Attachment Q9Confidentially Q9Valued_Customer_Recognition Q9Honest_Relationship Q9Being_Accountable Q9legal_Obligations Q9Combating_Bribery Q9Giving_Back_To_Community Q9Financial_literacy Q9Environmentally_branches Q10 Q11 Q12Financial_Stability Q12Withdraw_Money Q12Treated AQ12Advice_Quality Q12Personal_Information_Safe Q12Fees Q12Interest_Rates_Accounts Q12Interest_Rates_Loan 1.000 .559 .533 .495 .407 .559 1.000 .553 .518 .467 .533 .553 1.000 .428 .215 .495 .518 .428 1.000 .291 .407 .467 .215 .291 1.000 .512 .478 .365 .328 .566 .503 .503 .434 .490 .468 .579 .502 .240 .330 .537 .520 .390 .452 .371 .388 .413 .484 .363 .383 .457 .559 .605 .473 .414 .584 .570 .580 .421 .440 .600 .563 .489 .550 .440 .516 .446 .374 .376 .290 .471 .457 .455 .215 .333 .474 .410 .341 .113 .202 .538 .514 .329 .198 .169 .486 .633 .660 .450 .492 .572 .492 .578 .408 .498 .445 .592 .539 .528 .395 .489 .448 .433 .442 .302 .329 .474 .616 .455 .453 .398 .510 .578 .461 .427 .451 .423 .338 .455 .260 .431 .523 .761 .519 .403 .442 .667 .583 .503 .392 .380 .513 .529 .450 .274 .378 .549 .480 .376 .355 .383
  • 120.
    Inter-Item Correlation Matrix Q9Executive_R emuneration Q9Financial_In clusion_SMEba nking Q9MeetCustom ers_Needs Q9Borrowings_And_Savings Q9Transparency Q9Financial_Statements Q9Offers Q9Executive_Remuneration Q9Financial_Inclusion_SMEbanking Q9MeetCustomers_Needs Q9Social_Attachment Q9Confidentially Q9Valued_Customer_Recognition Q9Honest_Relationship Q9Being_Accountable Q9legal_Obligations Q9Combating_Bribery Q9Giving_Back_To_Community Q9Financial_literacy Q9Environmentally_branches Q10 Q11 Q12Financial_Stability Q12Withdraw_Money Q12Treated AQ12Advice_Quality Q12Personal_Information_Safe Q12Fees Q12Interest_Rates_Accounts Q12Interest_Rates_Loan .407.512 .503 .579 .467 .478 .503 .502 .215 .365 .434 .240 .291 .328 .490 .330 1.000 .566 .468 .537 .566 1.000 .609 .557 .468 .609 1.000 .455 .537 .557 .455 1.000 .388 .415 .520 .230 .457 .385 .614 .396 .584 .504 .595 .345 .600 .398 .605 .463 .516 .341 .438 .344 .471 .319 .427 .384 .474 .382 .561 .588 .538 .448 .431 .645 .486 .385 .392 .529 .572 .584 .573 .575 .445 .521 .694 .527 .489 .442 .592 .450 .329 .385 .441 .335 .398 .434 .679 .406 .451 .529 .666 .452 .431 .293 .370 .259 .442 .490 .568 .442 .380 .413 .492 .430 .378 .455 .524 .483 .383 .459 .403 .357
  • 121.
    Inter-Item Correlation Matrix Q9Social_Attac hment Q9Confidentiall y Q9Valued_Cust omer_Recogniti on Q9Borrowings_And_Savings Q9Transparency Q9Financial_Statements Q9Offers Q9Executive_Remuneration Q9Financial_Inclusion_SMEbanking Q9MeetCustomers_Needs Q9Social_Attachment Q9Confidentially Q9Valued_Customer_Recognition Q9Honest_Relationship Q9Being_Accountable Q9legal_Obligations Q9Combating_Bribery Q9Giving_Back_To_Community Q9Financial_literacy Q9Environmentally_branches Q10 Q11 Q12Financial_Stability Q12Withdraw_Money Q12Treated AQ12Advice_Quality Q12Personal_Information_Safe Q12Fees Q12Interest_Rates_Accounts Q12Interest_Rates_Loan .579.520 .413 .559 .502 .390 .484 .605 .240 .452 .363 .473 .330 .371 .383 .414 .537 .388 .457 .584 .557 .415 .385 .504 .455 .520 .614 .595 1.000 .230 .396 .345 .230 1.000 .506 .623 .396 .506 1.000 .700 .345 .623 .700 1.000 .463 .626 .624 .670 .344 .538 .494 .607 .384 .522 .510 .492 .588 .439 .629 .457 .645 .298 .489 .359 .529 .356 .402 .384 .575 .492 .410 .573 .527 .383 .474 .577 .450 .587 .427 .531 .335 .529 .393 .509 .406 .559 .675 .646 .452 .421 .677 .672 .259 .416 .375 .508 .442 .385 .464 .575 .430 .472 .462 .531 .483 .390 .448 .470 .357 .344 .351 .484
  • 122.
    Inter-Item Correlation Matrix Q9Honest_Rela tionship Q9Being_Acco untable Q9legal_Obliga tions Q9Borrowings_And_Savings Q9Transparency Q9Financial_Statements Q9Offers Q9Executive_Remuneration Q9Financial_Inclusion_SMEbanking Q9MeetCustomers_Needs Q9Social_Attachment Q9Confidentially Q9Valued_Customer_Recognition Q9Honest_Relationship Q9Being_Accountable Q9legal_Obligations Q9Combating_Bribery Q9Giving_Back_To_Community Q9Financial_literacy Q9Environmentally_branches Q10 Q11 Q12Financial_Stability Q12Withdraw_Money Q12Treated AQ12Advice_Quality Q12Personal_Information_Safe Q12Fees Q12Interest_Rates_Accounts Q12Interest_Rates_Loan .559.570 .563 .446 .605 .580 .489 .374 .473 .421 .550 .376 .414 .440 .440 .290 .584 .600 .516 .471 .504 .398 .341 .319 .595 .605 .438 .427 .345 .463 .344 .384 .623 .626 .538 .522 .700 .624 .494 .510 1.000 .670 .607 .492 .670 1.000 .648 .596 .607 .648 1.000 .554 .492 .596 .554 1.000 .457 .627 .345 .542 .359 .459 .335 .332 .384 .504 .318 .379 .573 .595 .608 .398 .577 .513 .416 .321 .531 .600 .505 .385 .509 .399 .503 .464 .646 .599 .497 .472 .672 .595 .528 .421 .508 .348 .361 .395 .575 .525 .426 .329 .531 .488 .479 .409 .470 .393 .423 .352 .484 .474 .519 .275
  • 123.
    Inter-Item Correlation Matrix Q9Combating_ Bribery Q9Giving_Back _To_Communit y Q9Financial_lit eracy Q9Borrowings_And_Savings Q9Transparency Q9Financial_Statements Q9Offers Q9Executive_Remuneration Q9Financial_Inclusion_SMEbanking Q9MeetCustomers_Needs Q9Social_Attachment Q9Confidentially Q9Valued_Customer_Recognition Q9Honest_Relationship Q9Being_Accountable Q9legal_Obligations Q9Combating_Bribery Q9Giving_Back_To_Community Q9Financial_literacy Q9Environmentally_branches Q10 Q11 Q12Financial_Stability Q12Withdraw_Money Q12Treated AQ12Advice_Quality Q12Personal_Information_Safe Q12Fees Q12Interest_Rates_Accounts Q12Interest_Rates_Loan .446.457 .410 .514 .374 .455 .341 .329 .376 .215 .113 .198 .290 .333 .202 .169 .471 .474 .538 .486 .319 .382 .448 .385 .427 .561 .431 .392 .384 .588 .645 .529 .522 .439 .298 .356 .510 .629 .489 .402 .492 .457 .359 .384 .596 .627 .459 .504 .554 .345 .335 .318 1.000 .542 .332 .379 .542 1.000 .590 .594 .332 .590 1.000 .441 .379 .594 .441 1.000 .398 .411 .479 .455 .321 .438 .538 .343 .385 .492 .452 .477 .464 .411 .355 .399 .472 .493 .462 .465 .421 .487 .469 .502 .395 .318 .235 .370 .329 .445 .346 .377 .409 .396 .326 .397 .352 .435 .328 .501 .275 .352 .286 .442
  • 124.
    Inter-Item Correlation Matrix Q9Environment ally_branchesQ10 Q11 Q12Financial_S tability Q9Borrowings_And_Savings Q9Transparency Q9Financial_Statements Q9Offers Q9Executive_Remuneration Q9Financial_Inclusion_SMEbanking Q9MeetCustomers_Needs Q9Social_Attachment Q9Confidentially Q9Valued_Customer_Recognition Q9Honest_Relationship Q9Being_Accountable Q9legal_Obligations Q9Combating_Bribery Q9Giving_Back_To_Community Q9Financial_literacy Q9Environmentally_branches Q10 Q11 Q12Financial_Stability Q12Withdraw_Money Q12Treated AQ12Advice_Quality Q12Personal_Information_Safe Q12Fees Q12Interest_Rates_Accounts Q12Interest_Rates_Loan .514 .633 .492 .592 .448 .329 .660 .578 .539 .433 .198 .450 .408 .528 .442 .169 .492 .498 .395 .302 .486 .572 .445 .489 .329 .385 .584 .521 .442 .385 .392 .573 .694 .592 .441 .529 .575 .527 .450 .335 .356 .492 .383 .587 .529 .402 .410 .474 .427 .393 .384 .573 .577 .531 .509 .504 .595 .513 .600 .399 .318 .608 .416 .505 .503 .379 .398 .321 .385 .464 .594 .411 .438 .492 .411 .441 .479 .538 .452 .355 1.000 .455 .343 .477 .399 .455 1.000 .670 .657 .530 .343 .670 1.000 .608 .486 .477 .657 .608 1.000 .546 .399 .530 .486 .546 1.000 .465 .647 .705 .567 .681 .502 .561 .623 .498 .560 .370 .380 .371 .549 .552 .377 .664 .721 .625 .540 .397 .591 .542 .561 .466 .501 .623 .543 .546 .441 .442 .587 .488 .494 .478
  • 125.
    Inter-Item Correlation Matrix Q12Withdraw_ MoneyQ12Treated AQ12Advice_Q uality Q9Borrowings_And_Savings Q9Transparency Q9Financial_Statements Q9Offers Q9Executive_Remuneration Q9Financial_Inclusion_SMEbanking Q9MeetCustomers_Needs Q9Social_Attachment Q9Confidentially Q9Valued_Customer_Recognition Q9Honest_Relationship Q9Being_Accountable Q9legal_Obligations Q9Combating_Bribery Q9Giving_Back_To_Community Q9Financial_literacy Q9Environmentally_branches Q10 Q11 Q12Financial_Stability Q12Withdraw_Money Q12Treated AQ12Advice_Quality Q12Personal_Information_Safe Q12Fees Q12Interest_Rates_Accounts Q12Interest_Rates_Loan .448 .474 .510 .423 .433 .616 .578 .338 .442 .455 .461 .455 .302 .453 .427 .260 .329 .398 .451 .431 .385 .434 .529 .293 .441 .679 .666 .370 .335 .406 .452 .259 .529 .559 .421 .416 .393 .675 .677 .375 .509 .646 .672 .508 .399 .599 .595 .348 .503 .497 .528 .361 .464 .472 .421 .395 .411 .493 .487 .318 .355 .462 .469 .235 .399 .465 .502 .370 .530 .647 .561 .380 .486 .705 .623 .371 .546 .567 .498 .549 1.000 .681 .560 .552 .681 1.000 .777 .432 .560 .777 1.000 .410 .552 .432 .410 1.000 .540 .706 .598 .491 .466 .599 .518 .428 .441 .598 .506 .450 .478 .528 .487 .365
  • 126.
    Inter-Item Correlation Matrix Q12Personal_I nformation_Saf eQ12Fees Q12Interest_Ra tes_Accounts Q12Interest_Ra tes_Loan Q9Borrowings_And_Savings Q9Transparency Q9Financial_Statements Q9Offers Q9Executive_Remuneration Q9Financial_Inclusion_SMEbanking Q9MeetCustomers_Needs Q9Social_Attachment Q9Confidentially Q9Valued_Customer_Recognition Q9Honest_Relationship Q9Being_Accountable Q9legal_Obligations Q9Combating_Bribery Q9Giving_Back_To_Community Q9Financial_literacy Q9Environmentally_branches Q10 Q11 Q12Financial_Stability Q12Withdraw_Money Q12Treated AQ12Advice_Quality Q12Personal_Information_Safe Q12Fees Q12Interest_Rates_Accounts Q12Interest_Rates_Loan .423 .523 .667 .513 .549 .338 .761 .583 .529 .480 .455 .519 .503 .450 .376 .260 .403 .392 .274 .355 .431 .442 .380 .378 .383 .293 .490 .413 .455 .459 .370 .568 .492 .524 .403 .259 .442 .430 .483 .357 .416 .385 .472 .390 .344 .375 .464 .462 .448 .351 .508 .575 .531 .470 .484 .348 .525 .488 .393 .474 .361 .426 .479 .423 .519 .395 .329 .409 .352 .275 .318 .445 .396 .435 .352 .235 .346 .326 .328 .286 .370 .377 .397 .501 .442 .380 .664 .591 .623 .587 .371 .721 .542 .543 .488 .549 .625 .561 .546 .494 .552 .540 .466 .441 .478 .432 .706 .599 .598 .528 .410 .598 .518 .506 .487 1.000 .491 .428 .450 .365 .491 1.000 .762 .735 .670 .428 .762 1.000 .792 .627 .450 .735 .792 1.000 .631 .365 .670 .627 .631 1.000
  • 127.
    Inter-Item Correlation Matrix Q12Open_Or_ Close_Branche sQ13 Q14 Q16 Q17 Q9Borrowings_And_Savings Q9Transparency Q9Financial_Statements Q9Offers Q9Executive_Remuneration Q9Financial_Inclusion_SMEbanking Q9MeetCustomers_Needs Q9Social_Attachment Q9Confidentially Q9Valued_Customer_Recognition Q9Honest_Relationship Q9Being_Accountable Q9legal_Obligations Q9Combating_Bribery Q9Giving_Back_To_Community Q9Financial_literacy Q9Environmentally_branches Q10 Q11 Q12Financial_Stability Q12Withdraw_Money Q12Treated AQ12Advice_Quality Q12Personal_Information_Safe Q12Fees Q12Interest_Rates_Accounts Q12Interest_Rates_Loan .549 .482 .490 .115 .492 .245 .480 .595 .458 .094 .448 .266 .376 .415 .448 .241 .472 .219 .355 .357 .360 -.075 .368 .174 .383 .566 .553 -.217 .411 .171 .459 .598 .444 -.049 .370 .186 .403 .518 .540 .093 .412 .222 .357 .607 .393 -.028 .525 .141 .344 .368 .388 .185 .364 .253 .351 .534 .474 -.056 .350 .185 .484 .562 .544 .042 .452 .225 .474 .533 .561 .075 .545 .193 .519 .519 .463 .119 .360 .177 .275 .423 .442 .073 .409 .208 .352 .528 .526 .074 .421 .241 .286 .557 .404 -.095 .405 .145 .442 .400 .327 .122 .472 .192 .587 .701 .531 .105 .458 .255 .488 .604 .424 .082 .430 .140 .494 .548 .492 .178 .471 .299 .478 .407 .373 .303 .297 .205 .528 .559 .478 .150 .509 .290 .487 .523 .514 .118 .534 .264 .365 .301 .334 .108 .248 .171 .670 .562 .465 .204 .375 .139 .627 .442 .460 .126 .388 .126 .631 .540 .416 .142 .330 .144 1.000 .466 .473 .154 .357 .035
  • 128.
    Inter-Item Correlation Matrix Q18 Q9Borrowings_And_Savings Q9Transparency Q9Financial_Statements Q9Offers Q9Executive_Remuneration Q9Financial_Inclusion_SMEbanking Q9MeetCustomers_Needs Q9Social_Attachment Q9Confidentially Q9Valued_Customer_Recognition Q9Honest_Relationship Q9Being_Accountable Q9legal_Obligations Q9Combating_Bribery Q9Giving_Back_To_Community Q9Financial_literacy Q9Environmentally_branches Q10 Q11 Q12Financial_Stability Q12Withdraw_Money Q12Treated AQ12Advice_Quality Q12Personal_Information_Safe Q12Fees Q12Interest_Rates_Accounts Q12Interest_Rates_Loan .245 .266 .219 .174 .171 .186 .222 .141 .253 .185 .225 .193 .177 .208 .241 .145 .192 .255 .140 .299 .205 .290 .264 .171 .139 .126 .144 .035 Inter-ItemCorrelation Matrix Q9Borrowings_ And_Savings Q9Transparenc y Q9Financial_St atements Q9Offers Q12Open_Or_Close_Branches Q13 Q14 Q16 Q17 Q18 .549 .480 .376 .355 .383 .482 .595 .415 .357 .566 .490 .458 .448 .360 .553 .115 .094 .241 -.075 -.217 .492 .448 .472 .368 .411 .245 .266 .219 .174 .171
  • 129.
    Inter-Item Correlation Matrix Q9Executive_R emuneration Q9Financial_In clusion_SMEba nking Q9MeetCustom ers_Needs Q12Open_Or_Close_Branches Q13 Q14 Q16 Q17 Q18 .383.459 .403 .357 .566 .598 .518 .607 .553 .444 .540 .393 -.217 -.049 .093 -.028 .411 .370 .412 .525 .171 .186 .222 .141 Inter-Item Correlation Matrix Q9Social_Attac hment Q9Confidentiall y Q9Valued_Cust omer_Recogniti on Q12Open_Or_Close_Branches Q13 Q14 Q16 Q17 Q18 .357 .344 .351 .484 .607 .368 .534 .562 .393 .388 .474 .544 -.028 .185 -.056 .042 .525 .364 .350 .452 .141 .253 .185 .225 Inter-Item Correlation Matrix Q9Honest_Rela tionship Q9Being_Acco untable Q9legal_Obliga tions Q12Open_Or_Close_Branches Q13 Q14 Q16 Q17 Q18 .484 .474 .519 .275 .562 .533 .519 .423 .544 .561 .463 .442 .042 .075 .119 .073 .452 .545 .360 .409 .225 .193 .177 .208 Inter-Item Correlation Matrix Q9Combating_ Bribery Q9Giving_Back _To_Communit y Q9Financial_lit eracy Q12Open_Or_Close_Branches Q13 Q14 Q16 Q17 Q18 .275 .352 .286 .442 .423 .528 .557 .400 .442 .526 .404 .327 .073 .074 -.095 .122 .409 .421 .405 .472 .208 .241 .145 .192
  • 130.
    Inter-Item Correlation Matrix Q9Environment ally_branchesQ10 Q11 Q12Financial_S tability Q12Open_Or_Close_Branches Q13 Q14 Q16 Q17 Q18 .442 .587 .488 .494 .478 .400 .701 .604 .548 .407 .327 .531 .424 .492 .373 .122 .105 .082 .178 .303 .472 .458 .430 .471 .297 .192 .255 .140 .299 .205 Inter-Item Correlation Matrix Q12Withdraw_ Money Q12Treated AQ12Advice_Q uality Q12Open_Or_Close_Branches Q13 Q14 Q16 Q17 Q18 .478 .528 .487 .365 .407 .559 .523 .301 .373 .478 .514 .334 .303 .150 .118 .108 .297 .509 .534 .248 .205 .290 .264 .171 Inter-Item Correlation Matrix Q12Personal_I nformation_Saf e Q12Fees Q12Interest_Ra tes_Accounts Q12Interest_Ra tes_Loan Q12Open_Or_Close_Branches Q13 Q14 Q16 Q17 Q18 .365 .670 .627 .631 1.000 .301 .562 .442 .540 .466 .334 .465 .460 .416 .473 .108 .204 .126 .142 .154 .248 .375 .388 .330 .357 .171 .139 .126 .144 .035 Inter-Item Correlation Matrix Q12Open_Or_ Close_Branche s Q13 Q14 Q16 Q17 Q12Open_Or_Close_Branches Q13 Q14 Q16 Q17 Q18 1.000 .466 .473 .154 .357 .035 .466 1.000 .639 -.091 .413 .110 .473 .639 1.000 .010 .573 .158 .154 -.091 .010 1.000 .195 .254 .357 .413 .573 .195 1.000 .339 .035 .110 .158 .254 .339 1.000
  • 131.
    Inter-Item Correlation Matrix Q18 Q12Open_Or_Close_Branches Q13 Q14 Q16 Q17 Q18 .035 .110 .158 .254 .339 1.000 Item-TotalStatistics Scale Mean if Item Deleted Scale Variance if Item Deleted Corrected Item- Total Correlation Q9Borrowings_And_Savings Q9Transparency Q9Financial_Statements Q9Offers Q9Executive_Remuneration Q9Financial_Inclusion_SMEbanking Q9MeetCustomers_Needs Q9Social_Attachment Q9Confidentially Q9Valued_Customer_Recognition Q9Honest_Relationship Q9Being_Accountable Q9legal_Obligations Q9Combating_Bribery Q9Giving_Back_To_Community Q9Financial_literacy Q9Environmentally_branches Q10 Q11 Q12Financial_Stability Q12Withdraw_Money Q12Treated AQ12Advice_Quality Q12Personal_Information_Safe Q12Fees Q12Interest_Rates_Accounts Q12Interest_Rates_Loan 101.18 396.570 .732 . 100.87 395.631 .728 . 100.63 402.214 .596 . 100.96 402.504 .528 . 101.58 401.983 .630 . 101.46 404.229 .626 . 101.30 394.214 .740 . 101.62 401.051 .621 . 100.75 400.717 .639 . 101.26 396.700 .674 . 100.99 395.000 .761 . 101.21 392.363 .760 . 100.90 399.540 .669 . 101.11 403.219 .592 . 101.60 400.573 .658 . 101.66 403.962 .559 . 101.48 401.483 .584 . 101.21 396.869 .790 . 101.21 391.792 .727 . 100.78 394.919 .754 . 100.39 401.779 .648 . 100.70 391.203 .800 . 101.02 393.252 .767 . 100.64 402.628 .542 . 100.84 394.687 .762 . 100.87 394.950 .710 . 101.03 398.977 .688 . 101.14 398.298 .635 .
  • 132.
    Item-Total Statistics Squared Multiple Correlation Cronbach's Alpha ifItem Deleted Q9Borrowings_And_Savings Q9Transparency Q9Financial_Statements Q9Offers Q9Executive_Remuneration Q9Financial_Inclusion_SMEbanking Q9MeetCustomers_Needs Q9Social_Attachment Q9Confidentially Q9Valued_Customer_Recognition Q9Honest_Relationship Q9Being_Accountable Q9legal_Obligations Q9Combating_Bribery Q9Giving_Back_To_Community Q9Financial_literacy Q9Environmentally_branches Q10 Q11 Q12Financial_Stability Q12Withdraw_Money Q12Treated AQ12Advice_Quality Q12Personal_Information_Safe Q12Fees Q12Interest_Rates_Accounts Q12Interest_Rates_Loan . .959 . .959 . .960 . .960 . .960 . .960 . .959 . .960 . .960 . .959 . .959 . .959 . .960 . .960 . .960 . .960 . .960 . .959 . .959 . .959 . .960 . .959 . .959 . .960 . .959 . .959 . .959 . .960 Item-Total Statistics Scale Mean if Item Deleted Scale Variance if Item Deleted Corrected Item- Total Correlation Q12Open_Or_Close_Branches Q13 Q14 Q16 Q17 Q18 101.14 398.298 .635 . 101.52 403.615 .709 . 101.35 397.746 .656 . 100.48 418.296 .132 . 101.51 395.923 .615 . 101.80 408.313 .293 .
  • 133.
    Item-Total Statistics Squared Multiple Correlation Cronbach's Alpha ifItem Deleted Q12Open_Or_Close_Branches Q13 Q14 Q16 Q17 Q18 . .960 . .960 . .960 . .963 . .960 . .963
  • 134.
    Appendix F -Research Objective one - Factor Analysis-before compon ents extraction Correlation Matrixa Q9Borrowings_ And_Savings Q9Transparenc y Correlation Q9Borrowings_And_Savings Q9Transparency 1.000 .559 .533 .559 1.000 .553 .533 .553 1.000 Correlation Matrixa Q9Financial_St atements Q9Offers Correlation Q9Borrowings_And_Savings Q9Transparency .533 .495 .407 .553 .518 .467 1.000 .428 .215 Correlation Matrixa Q9Executive_R emuneration Q9Financial_In clusion_SMEba nking Correlation Q9Borrowings_And_Savings Q9Transparency .407 .512 .503 .467 .478 .503 .215 .365 .434 Correlation Matrixa Q9MeetCustom ers_Needs Q9Social_Attac hment Correlation Q9Borrowings_And_Savings Q9Transparency .503 .579 .520 .503 .502 .390 .434 .240 .452 Correlation Matrixa Q9Confidentiall y Q9Valued_Cust omer_Recogniti on Correlation Q9Borrowings_And_Savings Q9Transparency .520 .413 .559 .390 .484 .605 .452 .363 .473
  • 135.
    Correlation Matrixa Q9Honest_Rela tionship Q9Being_Acco untable Correlation Q9Borrowings_And_Savings Q9Transparency .559.570 .563 .605 .580 .489 .473 .421 .550 Correlation Matrixa Q9legal_Obliga tions Q9Combating_ Bribery Correlation Q9Borrowings_And_Savings Q9Transparency .563 .446 .457 .489 .374 .455 .550 .376 .215 Correlation Matrixa Q9Giving_Back _To_Communit y Q9Financial_lit eracy Correlation Q9Borrowings_And_Savings Q9Transparency .457 .410 .514 .455 .341 .329 .215 .113 .198 Correlation Matrixa Q9Environment ally_branches Q10 Q11 Correlation Q9Borrowings_And_Savings Q9Transparency .514 .633 .492 .592 .329 .660 .578 .539 .198 .450 .408 .528 Correlation Matrixa Q12Financial_S tability Q12Withdraw_ Money Correlation Q9Borrowings_And_Savings Q9Transparency .592 .448 .474 .539 .433 .616 .528 .442 .455 Correlation Matrixa Q12Treated AQ12Advice_Q uality Correlation Q9Borrowings_And_Savings Q9Transparency .474 .510 .423 .616 .578 .338 .455 .461 .455
  • 136.
    Correlation Matrixa Q12Personal_I nformation_Saf e Q12Fees CorrelationQ9Borrowings_And_Savings Q9Transparency .423 .523 .667 .338 .761 .583 .455 .519 .503 Correlation Matrixa Q12Interest_Ra tes_Accounts Q12Interest_Ra tes_Loan Correlation Q9Borrowings_And_Savings Q9Transparency .667 .513 .549 .583 .529 .480 .503 .450 .376 Correlation Matrixa Q12Open_Or_ Close_Branche s Q13 Q14 Correlation Q9Borrowings_And_Savings Q9Transparency .549 .482 .490 .115 .480 .595 .458 .094 .376 .415 .448 .241 Correlation Matrixa Q16 Q17 Q18 Correlation Q9Borrowings_And_Savings Q9Transparency .115 .492 .245 .094 .448 .266 .241 .472 .219
  • 137.
    Correlation Matrixa Q9Borrowings_ And_Savings Q9Transparenc y Correlation Q9Financial_Statements Q9Offers Q9Executive_Remuneration Q9Financial_Inclusion_SMEbanking Q9MeetCustomers_Needs Q9Social_Attachment Q9Confidentially Q9Valued_Customer_Recognition Q9Honest_Relationship Q9Being_Accountable Q9legal_Obligations Q9Combating_Bribery Q9Giving_Back_To_Community Q9Financial_literacy Q9Environmentally_branches Q10 Q11 Q12Financial_Stability Q12Withdraw_Money Q12Treated AQ12Advice_Quality Q12Personal_Information_Safe Q12Fees Q12Interest_Rates_Accounts Q12Interest_Rates_Loan Q12Open_Or_Close_Branches Q13 Q14 Q16 Q17 Q18 Sig. (1-tailed)Q9Borrowings_And_Savings Q9Transparency Q9Financial_Statements Q9Offers Q9Executive_Remuneration Q9Financial_Inclusion_SMEbanking Q9MeetCustomers_Needs .533 .553 1.000 .495 .518 .428 .407 .467 .215 .512 .478 .365 .503 .503 .434 .579 .502 .240 .520 .390 .452 .413 .484 .363 .559 .605 .473 .570 .580 .421 .563 .489 .550 .446 .374 .376 .457 .455 .215 .410 .341 .113 .514 .329 .198 .633 .660 .450 .492 .578 .408 .592 .539 .528 .448 .433 .442 .474 .616 .455 .510 .578 .461 .423 .338 .455 .523 .761 .519 .667 .583 .503 .513 .529 .450 .549 .480 .376 .482 .595 .415 .490 .458 .448 .115 .094 .241 .492 .448 .472 .245 .266 .219 .000 .000 .000 .000 .000 .000 .000 .000 .000 .000 .000 .020 .000 .000 .000 .000 .000 .000 .000 .011
  • 138.
    Correlation Matrixa Q9Financial_St atements Q9Offers Correlation Q9Financial_Statements Q9Offers Q9Executive_Remuneration Q9Financial_Inclusion_SMEbanking Q9MeetCustomers_Needs Q9Social_Attachment Q9Confidentially Q9Valued_Customer_Recognition Q9Honest_Relationship Q9Being_Accountable Q9legal_Obligations Q9Combating_Bribery Q9Giving_Back_To_Community Q9Financial_literacy Q9Environmentally_branches Q10 Q11 Q12Financial_Stability Q12Withdraw_Money Q12Treated AQ12Advice_Quality Q12Personal_Information_Safe Q12Fees Q12Interest_Rates_Accounts Q12Interest_Rates_Loan Q12Open_Or_Close_Branches Q13 Q14 Q16 Q17 Q18 Sig.(1-tailed) Q9Borrowings_And_Savings Q9Transparency Q9Financial_Statements Q9Offers Q9Executive_Remuneration Q9Financial_Inclusion_SMEbanking Q9MeetCustomers_Needs 1.000 .428 .215 .428 1.000 .291 .215 .291 1.000 .365 .328 .566 .434 .490 .468 .240 .330 .537 .452 .371 .388 .363 .383 .457 .473 .414 .584 .421 .440 .600 .550 .440 .516 .376 .290 .471 .215 .333 .474 .113 .202 .538 .198 .169 .486 .450 .492 .572 .408 .498 .445 .528 .395 .489 .442 .302 .329 .455 .453 .398 .461 .427 .451 .455 .260 .431 .519 .403 .442 .503 .392 .380 .450 .274 .378 .376 .355 .383 .415 .357 .566 .448 .360 .553 .241 -.075 -.217 .472 .368 .411 .219 .174 .171 .000 .000 .000 .000 .000 .000 .000 .020 .000 .002 .020 .002 .000 .001 .000 .000 .000 .000 .011 .001 .000
  • 139.
    Correlation Matrixa Q9Executive_R emuneration Q9Financial_In clusion_SMEba nking Correlation Q9Financial_Statements Q9Offers Q9Executive_Remuneration Q9Financial_Inclusion_SMEbanking Q9MeetCustomers_Needs Q9Social_Attachment Q9Confidentially Q9Valued_Customer_Recognition Q9Honest_Relationship Q9Being_Accountable Q9legal_Obligations Q9Combating_Bribery Q9Giving_Back_To_Community Q9Financial_literacy Q9Environmentally_branches Q10 Q11 Q12Financial_Stability Q12Withdraw_Money Q12Treated AQ12Advice_Quality Q12Personal_Information_Safe Q12Fees Q12Interest_Rates_Accounts Q12Interest_Rates_Loan Q12Open_Or_Close_Branches Q13 Q14 Q16 Q17 Q18 Sig. (1-tailed)Q9Borrowings_And_Savings Q9Transparency Q9Financial_Statements Q9Offers Q9Executive_Remuneration Q9Financial_Inclusion_SMEbanking Q9MeetCustomers_Needs .215 .365 .434 .291 .328 .490 1.000 .566 .468 .566 1.000 .609 .468 .609 1.000 .537 .557 .455 .388 .415 .520 .457 .385 .614 .584 .504 .595 .600 .398 .605 .516 .341 .438 .471 .319 .427 .474 .382 .561 .538 .448 .431 .486 .385 .392 .572 .584 .573 .445 .521 .694 .489 .442 .592 .329 .385 .441 .398 .434 .679 .451 .529 .666 .431 .293 .370 .442 .490 .568 .380 .413 .492 .378 .455 .524 .383 .459 .403 .566 .598 .518 .553 .444 .540 -.217 -.049 .093 .411 .370 .412 .171 .186 .222 .000 .000 .000 .000 .000 .000 .020 .000 .000 .002 .001 .000 .000 .000 .000 .000 .000 .000 .000 .000
  • 140.
    Correlation Matrixa Q9MeetCustom ers_Needs Q9Social_Attac hment Correlation Q9Financial_Statements Q9Offers Q9Executive_Remuneration Q9Financial_Inclusion_SMEbanking Q9MeetCustomers_Needs Q9Social_Attachment Q9Confidentially Q9Valued_Customer_Recognition Q9Honest_Relationship Q9Being_Accountable Q9legal_Obligations Q9Combating_Bribery Q9Giving_Back_To_Community Q9Financial_literacy Q9Environmentally_branches Q10 Q11 Q12Financial_Stability Q12Withdraw_Money Q12Treated AQ12Advice_Quality Q12Personal_Information_Safe Q12Fees Q12Interest_Rates_Accounts Q12Interest_Rates_Loan Q12Open_Or_Close_Branches Q13 Q14 Q16 Q17 Q18 Sig. (1-tailed)Q9Borrowings_And_Savings Q9Transparency Q9Financial_Statements Q9Offers Q9Executive_Remuneration Q9Financial_Inclusion_SMEbanking Q9MeetCustomers_Needs .434 .240 .452 .490 .330 .371 .468 .537 .388 .609 .557 .415 1.000 .455 .520 .455 1.000 .230 .520 .230 1.000 .614 .396 .506 .595 .345 .623 .605 .463 .626 .438 .344 .538 .427 .384 .522 .561 .588 .439 .431 .645 .298 .392 .529 .356 .573 .575 .492 .694 .527 .383 .592 .450 .587 .441 .335 .529 .679 .406 .559 .666 .452 .421 .370 .259 .416 .568 .442 .385 .492 .430 .472 .524 .483 .390 .403 .357 .344 .518 .607 .368 .540 .393 .388 .093 -.028 .185 .412 .525 .364 .222 .141 .253 .000 .000 .000 .000 .000 .000 .000 .011 .000 .000 .001 .000 .000 .000 .000 .000 .000 .000 .000 .000 .000 .014
  • 141.
    Correlation Matrixa Q9Confidentiall y Q9Valued_Cust omer_Recogniti on Correlation Q9Financial_Statements Q9Offers Q9Executive_Remuneration Q9Financial_Inclusion_SMEbanking Q9MeetCustomers_Needs Q9Social_Attachment Q9Confidentially Q9Valued_Customer_Recognition Q9Honest_Relationship Q9Being_Accountable Q9legal_Obligations Q9Combating_Bribery Q9Giving_Back_To_Community Q9Financial_literacy Q9Environmentally_branches Q10 Q11 Q12Financial_Stability Q12Withdraw_Money Q12Treated AQ12Advice_Quality Q12Personal_Information_Safe Q12Fees Q12Interest_Rates_Accounts Q12Interest_Rates_Loan Q12Open_Or_Close_Branches Q13 Q14 Q16 Q17 Q18 Sig. (1-tailed)Q9Borrowings_And_Savings Q9Transparency Q9Financial_Statements Q9Offers Q9Executive_Remuneration Q9Financial_Inclusion_SMEbanking Q9MeetCustomers_Needs .452 .363 .473 .371 .383 .414 .388 .457 .584 .415 .385 .504 .520 .614 .595 .230 .396 .345 1.000 .506 .623 .506 1.000 .700 .623 .700 1.000 .626 .624 .670 .538 .494 .607 .522 .510 .492 .439 .629 .457 .298 .489 .359 .356 .402 .384 .492 .410 .573 .383 .474 .577 .587 .427 .531 .529 .393 .509 .559 .675 .646 .421 .677 .672 .416 .375 .508 .385 .464 .575 .472 .462 .531 .390 .448 .470 .344 .351 .484 .368 .534 .562 .388 .474 .544 .185 -.056 .042 .364 .350 .452 .253 .185 .225 .000 .000 .000 .000 .000 .000 .000 .000 .000 .000 .000 .000 .000 .000 .000 .000 .000 .000 .000 .000 .000 .014 .000
  • 142.
    Correlation Matrixa Q9Honest_Rela tionship Q9Being_Acco untable Correlation Q9Financial_Statements Q9Offers Q9Executive_Remuneration Q9Financial_Inclusion_SMEbanking Q9MeetCustomers_Needs Q9Social_Attachment Q9Confidentially Q9Valued_Customer_Recognition Q9Honest_Relationship Q9Being_Accountable Q9legal_Obligations Q9Combating_Bribery Q9Giving_Back_To_Community Q9Financial_literacy Q9Environmentally_branches Q10 Q11 Q12Financial_Stability Q12Withdraw_Money Q12Treated AQ12Advice_Quality Q12Personal_Information_Safe Q12Fees Q12Interest_Rates_Accounts Q12Interest_Rates_Loan Q12Open_Or_Close_Branches Q13 Q14 Q16 Q17 Q18 Sig. (1-tailed)Q9Borrowings_And_Savings Q9Transparency Q9Financial_Statements Q9Offers Q9Executive_Remuneration Q9Financial_Inclusion_SMEbanking Q9MeetCustomers_Needs .473 .421 .550 .414 .440 .440 .584 .600 .516 .504 .398 .341 .595 .605 .438 .345 .463 .344 .623 .626 .538 .700 .624 .494 1.000 .670 .607 .670 1.000 .648 .607 .648 1.000 .492 .596 .554 .457 .627 .345 .359 .459 .335 .384 .504 .318 .573 .595 .608 .577 .513 .416 .531 .600 .505 .509 .399 .503 .646 .599 .497 .672 .595 .528 .508 .348 .361 .575 .525 .426 .531 .488 .479 .470 .393 .423 .484 .474 .519 .562 .533 .519 .544 .561 .463 .042 .075 .119 .452 .545 .360 .225 .193 .177 .000 .000 .000 .000 .000 .000 .000 .000 .000 .000 .000 .000 .000 .000 .000 .000 .000 .000 .000 .000 .000 .000 .000
  • 143.
    Correlation Matrixa Q9legal_Obliga tions Q9Combating_ Bribery Correlation Q9Financial_Statements Q9Offers Q9Executive_Remuneration Q9Financial_Inclusion_SMEbanking Q9MeetCustomers_Needs Q9Social_Attachment Q9Confidentially Q9Valued_Customer_Recognition Q9Honest_Relationship Q9Being_Accountable Q9legal_Obligations Q9Combating_Bribery Q9Giving_Back_To_Community Q9Financial_literacy Q9Environmentally_branches Q10 Q11 Q12Financial_Stability Q12Withdraw_Money Q12Treated AQ12Advice_Quality Q12Personal_Information_Safe Q12Fees Q12Interest_Rates_Accounts Q12Interest_Rates_Loan Q12Open_Or_Close_Branches Q13 Q14 Q16 Q17 Q18 Sig. (1-tailed)Q9Borrowings_And_Savings Q9Transparency Q9Financial_Statements Q9Offers Q9Executive_Remuneration Q9Financial_Inclusion_SMEbanking Q9MeetCustomers_Needs .550 .376 .215 .440 .290 .333 .516 .471 .474 .341 .319 .382 .438 .427 .561 .344 .384 .588 .538 .522 .439 .494 .510 .629 .607 .492 .457 .648 .596 .627 1.000 .554 .345 .554 1.000 .542 .345 .542 1.000 .335 .332 .590 .318 .379 .594 .608 .398 .411 .416 .321 .438 .505 .385 .492 .503 .464 .411 .497 .472 .493 .528 .421 .487 .361 .395 .318 .426 .329 .445 .479 .409 .396 .423 .352 .435 .519 .275 .352 .519 .423 .528 .463 .442 .526 .119 .073 .074 .360 .409 .421 .177 .208 .241 .000 .000 .000 .000 .000 .000 .000 .000 .020 .000 .002 .001 .000 .000 .000 .000 .001 .000 .000 .000 .000 .000 .000
  • 144.
    Correlation Matrixa Q9Giving_Back _To_Communit y Q9Financial_lit eracy Correlation Q9Financial_Statements Q9Offers Q9Executive_Remuneration Q9Financial_Inclusion_SMEbanking Q9MeetCustomers_Needs Q9Social_Attachment Q9Confidentially Q9Valued_Customer_Recognition Q9Honest_Relationship Q9Being_Accountable Q9legal_Obligations Q9Combating_Bribery Q9Giving_Back_To_Community Q9Financial_literacy Q9Environmentally_branches Q10 Q11 Q12Financial_Stability Q12Withdraw_Money Q12Treated AQ12Advice_Quality Q12Personal_Information_Safe Q12Fees Q12Interest_Rates_Accounts Q12Interest_Rates_Loan Q12Open_Or_Close_Branches Q13 Q14 Q16 Q17 Q18 Sig. (1-tailed)Q9Borrowings_And_Savings Q9Transparency Q9Financial_Statements Q9Offers Q9Executive_Remuneration Q9Financial_Inclusion_SMEbanking Q9MeetCustomers_Needs .215 .113 .198 .333 .202 .169 .474 .538 .486 .382 .448 .385 .561 .431 .392 .588 .645 .529 .439 .298 .356 .629 .489 .402 .457 .359 .384 .627 .459 .504 .345 .335 .318 .542 .332 .379 1.000 .590 .594 .590 1.000 .441 .594 .441 1.000 .411 .479 .455 .438 .538 .343 .492 .452 .477 .411 .355 .399 .493 .462 .465 .487 .469 .502 .318 .235 .370 .445 .346 .377 .396 .326 .397 .435 .328 .501 .352 .286 .442 .528 .557 .400 .526 .404 .327 .074 -.095 .122 .421 .405 .472 .241 .145 .192 .000 .000 .000 .000 .000 .001 .020 .142 .029 .001 .027 .054 .000 .000 .000 .000 .000 .000 .000 .000 .000 .000 .000
  • 145.
    Correlation Matrixa Q9Environment ally_branches Q10Q11 Correlation Q9Financial_Statements Q9Offers Q9Executive_Remuneration Q9Financial_Inclusion_SMEbanking Q9MeetCustomers_Needs Q9Social_Attachment Q9Confidentially Q9Valued_Customer_Recognition Q9Honest_Relationship Q9Being_Accountable Q9legal_Obligations Q9Combating_Bribery Q9Giving_Back_To_Community Q9Financial_literacy Q9Environmentally_branches Q10 Q11 Q12Financial_Stability Q12Withdraw_Money Q12Treated AQ12Advice_Quality Q12Personal_Information_Safe Q12Fees Q12Interest_Rates_Accounts Q12Interest_Rates_Loan Q12Open_Or_Close_Branches Q13 Q14 Q16 Q17 Q18 Sig. (1-tailed) Q9Borrowings_And_Savings Q9Transparency Q9Financial_Statements Q9Offers Q9Executive_Remuneration Q9Financial_Inclusion_SMEbanking Q9MeetCustomers_Needs .198 .450 .408 .528 .169 .492 .498 .395 .486 .572 .445 .489 .385 .584 .521 .442 .392 .573 .694 .592 .529 .575 .527 .450 .356 .492 .383 .587 .402 .410 .474 .427 .384 .573 .577 .531 .504 .595 .513 .600 .318 .608 .416 .505 .379 .398 .321 .385 .594 .411 .438 .492 .441 .479 .538 .452 1.000 .455 .343 .477 .455 1.000 .670 .657 .343 .670 1.000 .608 .477 .657 .608 1.000 .399 .530 .486 .546 .465 .647 .705 .567 .502 .561 .623 .498 .370 .380 .371 .549 .377 .664 .721 .625 .397 .591 .542 .561 .501 .623 .543 .546 .442 .587 .488 .494 .400 .701 .604 .548 .327 .531 .424 .492 .122 .105 .082 .178 .472 .458 .430 .471 .192 .255 .140 .299 .000 .000 .000 .000 .001 .000 .000 .000 .029 .000 .000 .000 .054 .000 .000 .000 .000 .000 .000 .000 .000 .000 .000 .000 .000 .000 .000 .000 .000 .000 .000
  • 146.
    Correlation Matrixa Q12Financial_S tability Q12Withdraw_ Money Correlation Q9Financial_Statements Q9Offers Q9Executive_Remuneration Q9Financial_Inclusion_SMEbanking Q9MeetCustomers_Needs Q9Social_Attachment Q9Confidentially Q9Valued_Customer_Recognition Q9Honest_Relationship Q9Being_Accountable Q9legal_Obligations Q9Combating_Bribery Q9Giving_Back_To_Community Q9Financial_literacy Q9Environmentally_branches Q10 Q11 Q12Financial_Stability Q12Withdraw_Money Q12Treated AQ12Advice_Quality Q12Personal_Information_Safe Q12Fees Q12Interest_Rates_Accounts Q12Interest_Rates_Loan Q12Open_Or_Close_Branches Q13 Q14 Q16 Q17 Q18 Sig. (1-tailed)Q9Borrowings_And_Savings Q9Transparency Q9Financial_Statements Q9Offers Q9Executive_Remuneration Q9Financial_Inclusion_SMEbanking Q9MeetCustomers_Needs .528 .442 .455 .395 .302 .453 .489 .329 .398 .442 .385 .434 .592 .441 .679 .450 .335 .406 .587 .529 .559 .427 .393 .675 .531 .509 .646 .600 .399 .599 .505 .503 .497 .385 .464 .472 .492 .411 .493 .452 .355 .462 .477 .399 .465 .657 .530 .647 .608 .486 .705 1.000 .546 .567 .546 1.000 .681 .567 .681 1.000 .498 .560 .777 .549 .552 .432 .625 .540 .706 .561 .466 .599 .546 .441 .598 .494 .478 .528 .548 .407 .559 .492 .373 .478 .178 .303 .150 .471 .297 .509 .299 .205 .290 .000 .000 .000 .000 .000 .000 .000 .000 .000 .000 .002 .000 .000 .001 .000 .000 .000 .000 .000 .000 .000 .000 .000
  • 147.
    Correlation Matrixa Q12Treated AQ12Advice_Q uality Correlation Q9Financial_Statements Q9Offers Q9Executive_Remuneration Q9Financial_Inclusion_SMEbanking Q9MeetCustomers_Needs Q9Social_Attachment Q9Confidentially Q9Valued_Customer_Recognition Q9Honest_Relationship Q9Being_Accountable Q9legal_Obligations Q9Combating_Bribery Q9Giving_Back_To_Community Q9Financial_literacy Q9Environmentally_branches Q10 Q11 Q12Financial_Stability Q12Withdraw_Money Q12Treated AQ12Advice_Quality Q12Personal_Information_Safe Q12Fees Q12Interest_Rates_Accounts Q12Interest_Rates_Loan Q12Open_Or_Close_Branches Q13 Q14 Q16 Q17 Q18 Sig. (1-tailed)Q9Borrowings_And_Savings Q9Transparency Q9Financial_Statements Q9Offers Q9Executive_Remuneration Q9Financial_Inclusion_SMEbanking Q9MeetCustomers_Needs .455 .461 .455 .453 .427 .260 .398 .451 .431 .434 .529 .293 .679 .666 .370 .406 .452 .259 .559 .421 .416 .675 .677 .375 .646 .672 .508 .599 .595 .348 .497 .528 .361 .472 .421 .395 .493 .487 .318 .462 .469 .235 .465 .502 .370 .647 .561 .380 .705 .623 .371 .567 .498 .549 .681 .560 .552 1.000 .777 .432 .777 1.000 .410 .432 .410 1.000 .706 .598 .491 .599 .518 .428 .598 .506 .450 .528 .487 .365 .559 .523 .301 .478 .514 .334 .150 .118 .108 .509 .534 .248 .290 .264 .171 .000 .000 .000 .000 .000 .000 .000 .000 .000 .000 .000 .006 .000 .000 .000 .000 .000 .002 .000 .000 .000 .000 .000 .006
  • 148.
    Correlation Matrixa Q12Personal_I nformation_Saf e Q12Fees Correlation Q9Financial_Statements Q9Offers Q9Executive_Remuneration Q9Financial_Inclusion_SMEbanking Q9MeetCustomers_Needs Q9Social_Attachment Q9Confidentially Q9Valued_Customer_Recognition Q9Honest_Relationship Q9Being_Accountable Q9legal_Obligations Q9Combating_Bribery Q9Giving_Back_To_Community Q9Financial_literacy Q9Environmentally_branches Q10 Q11 Q12Financial_Stability Q12Withdraw_Money Q12Treated AQ12Advice_Quality Q12Personal_Information_Safe Q12Fees Q12Interest_Rates_Accounts Q12Interest_Rates_Loan Q12Open_Or_Close_Branches Q13 Q14 Q16 Q17 Q18 Sig.(1-tailed) Q9Borrowings_And_Savings Q9Transparency Q9Financial_Statements Q9Offers Q9Executive_Remuneration Q9Financial_Inclusion_SMEbanking Q9MeetCustomers_Needs .455 .519 .503 .260 .403 .392 .431 .442 .380 .293 .490 .413 .370 .568 .492 .259 .442 .430 .416 .385 .472 .375 .464 .462 .508 .575 .531 .348 .525 .488 .361 .426 .479 .395 .329 .409 .318 .445 .396 .235 .346 .326 .370 .377 .397 .380 .664 .591 .371 .721 .542 .549 .625 .561 .552 .540 .466 .432 .706 .599 .410 .598 .518 1.000 .491 .428 .491 1.000 .762 .428 .762 1.000 .450 .735 .792 .365 .670 .627 .301 .562 .442 .334 .465 .460 .108 .204 .126 .248 .375 .388 .171 .139 .126 .000 .000 .000 .000 .000 .000 .000 .000 .000 .006 .000 .000 .000 .000 .000 .002 .000 .000 .000 .000 .000 .006 .000 .000
  • 149.
    Correlation Matrixa Q12Interest_Ra tes_Accounts Q12Interest_Ra tes_Loan Correlation Q9Financial_Statements Q9Offers Q9Executive_Remuneration Q9Financial_Inclusion_SMEbanking Q9MeetCustomers_Needs Q9Social_Attachment Q9Confidentially Q9Valued_Customer_Recognition Q9Honest_Relationship Q9Being_Accountable Q9legal_Obligations Q9Combating_Bribery Q9Giving_Back_To_Community Q9Financial_literacy Q9Environmentally_branches Q10 Q11 Q12Financial_Stability Q12Withdraw_Money Q12Treated AQ12Advice_Quality Q12Personal_Information_Safe Q12Fees Q12Interest_Rates_Accounts Q12Interest_Rates_Loan Q12Open_Or_Close_Branches Q13 Q14 Q16 Q17 Q18 Sig. (1-tailed)Q9Borrowings_And_Savings Q9Transparency Q9Financial_Statements Q9Offers Q9Executive_Remuneration Q9Financial_Inclusion_SMEbanking Q9MeetCustomers_Needs .503 .450 .376 .392 .274 .355 .380 .378 .383 .413 .455 .459 .492 .524 .403 .430 .483 .357 .472 .390 .344 .462 .448 .351 .531 .470 .484 .488 .393 .474 .479 .423 .519 .409 .352 .275 .396 .435 .352 .326 .328 .286 .397 .501 .442 .591 .623 .587 .542 .543 .488 .561 .546 .494 .466 .441 .478 .599 .598 .528 .518 .506 .487 .428 .450 .365 .762 .735 .670 1.000 .792 .627 .792 1.000 .631 .627 .631 1.000 .442 .540 .466 .460 .416 .473 .126 .142 .154 .388 .330 .357 .126 .144 .035 .000 .000 .000 .000 .000 .000 .000 .000 .000 .000 .004 .000 .000 .000 .000 .000 .000 .000 .000 .000 .000 .000 .000
  • 150.
    Correlation Matrixa Q12Open_Or_ Close_Branche s Q13Q14 Correlation Q9Financial_Statements Q9Offers Q9Executive_Remuneration Q9Financial_Inclusion_SMEbanking Q9MeetCustomers_Needs Q9Social_Attachment Q9Confidentially Q9Valued_Customer_Recognition Q9Honest_Relationship Q9Being_Accountable Q9legal_Obligations Q9Combating_Bribery Q9Giving_Back_To_Community Q9Financial_literacy Q9Environmentally_branches Q10 Q11 Q12Financial_Stability Q12Withdraw_Money Q12Treated AQ12Advice_Quality Q12Personal_Information_Safe Q12Fees Q12Interest_Rates_Accounts Q12Interest_Rates_Loan Q12Open_Or_Close_Branches Q13 Q14 Q16 Q17 Q18 Sig. (1-tailed) Q9Borrowings_And_Savings Q9Transparency Q9Financial_Statements Q9Offers Q9Executive_Remuneration Q9Financial_Inclusion_SMEbanking Q9MeetCustomers_Needs .376 .415 .448 .241 .355 .357 .360 -.075 .383 .566 .553 -.217 .459 .598 .444 -.049 .403 .518 .540 .093 .357 .607 .393 -.028 .344 .368 .388 .185 .351 .534 .474 -.056 .484 .562 .544 .042 .474 .533 .561 .075 .519 .519 .463 .119 .275 .423 .442 .073 .352 .528 .526 .074 .286 .557 .404 -.095 .442 .400 .327 .122 .587 .701 .531 .105 .488 .604 .424 .082 .494 .548 .492 .178 .478 .407 .373 .303 .528 .559 .478 .150 .487 .523 .514 .118 .365 .301 .334 .108 .670 .562 .465 .204 .627 .442 .460 .126 .631 .540 .416 .142 1.000 .466 .473 .154 .466 1.000 .639 -.091 .473 .639 1.000 .010 .154 -.091 .010 1.000 .357 .413 .573 .195 .035 .110 .158 .254 .000 .000 .000 .138 .000 .000 .000 .187 .000 .000 .000 .010 .000 .000 .000 .237 .000 .000 .000 .019 .000 .000 .000 .321 .000 .000 .000 .190 .000 .000 .397
  • 151.
    Correlation Matrixa Q16 Q17Q18 Correlation Q9Financial_Statements Q9Offers Q9Executive_Remuneration Q9Financial_Inclusion_SMEbanking Q9MeetCustomers_Needs Q9Social_Attachment Q9Confidentially Q9Valued_Customer_Recognition Q9Honest_Relationship Q9Being_Accountable Q9legal_Obligations Q9Combating_Bribery Q9Giving_Back_To_Community Q9Financial_literacy Q9Environmentally_branches Q10 Q11 Q12Financial_Stability Q12Withdraw_Money Q12Treated AQ12Advice_Quality Q12Personal_Information_Safe Q12Fees Q12Interest_Rates_Accounts Q12Interest_Rates_Loan Q12Open_Or_Close_Branches Q13 Q14 Q16 Q17 Q18 Sig. (1-tailed) Q9Borrowings_And_Savings Q9Transparency Q9Financial_Statements Q9Offers Q9Executive_Remuneration Q9Financial_Inclusion_SMEbanking Q9MeetCustomers_Needs .241 .472 .219 -.075 .368 .174 -.217 .411 .171 -.049 .370 .186 .093 .412 .222 -.028 .525 .141 .185 .364 .253 -.056 .350 .185 .042 .452 .225 .075 .545 .193 .119 .360 .177 .073 .409 .208 .074 .421 .241 -.095 .405 .145 .122 .472 .192 .105 .458 .255 .082 .430 .140 .178 .471 .299 .303 .297 .205 .150 .509 .290 .118 .534 .264 .108 .248 .171 .204 .375 .139 .126 .388 .126 .142 .330 .144 .154 .357 .035 -.091 .413 .110 .010 .573 .158 1.000 .195 .254 .195 1.000 .339 .254 .339 1.000 .138 .000 .009 .187 .000 .005 .010 .000 .018 .237 .000 .048 .019 .000 .051 .321 .000 .038 .190 .000 .017 .397 .000
  • 152.
    Correlation Matrixa Q9Borrowings_ And_Savings Q9Transparenc y Sig. (1-tailed) Q9Social_Attachment Q9Confidentially Q9Valued_Customer_Recognition Q9Honest_Relationship Q9Being_Accountable Q9legal_Obligations Q9Combating_Bribery Q9Giving_Back_To_Community Q9Financial_literacy Q9Environmentally_branches Q10 Q11 Q12Financial_Stability Q12Withdraw_Money Q12Treated AQ12Advice_Quality Q12Personal_Information_Safe Q12Fees Q12Interest_Rates_Accounts Q12Interest_Rates_Loan Q12Open_Or_Close_Branches Q13 Q14 Q16 Q17 Q18 .000.000 .011 .000 .000 .000 .000 .000 .000 .000 .000 .000 .000 .000 .000 .000 .000 .000 .000 .000 .000 .000 .000 .020 .000 .000 .142 .000 .001 .029 .000 .000 .000 .000 .000 .000 .000 .000 .000 .000 .000 .000 .000 .000 .000 .000 .000 .000 .000 .000 .000 .000 .000 .000 .000 .000 .000 .000 .000 .000 .000 .000 .000 .000 .000 .000 .000 .000 .000 .138 .187 .010 .000 .000 .000 .009 .005 .018
  • 153.
    Correlation Matrixa Q9Financial_St atements Q9Offers Sig.(1-tailed) Q9Social_Attachment Q9Confidentially Q9Valued_Customer_Recognition Q9Honest_Relationship Q9Being_Accountable Q9legal_Obligations Q9Combating_Bribery Q9Giving_Back_To_Community Q9Financial_literacy Q9Environmentally_branches Q10 Q11 Q12Financial_Stability Q12Withdraw_Money Q12Treated AQ12Advice_Quality Q12Personal_Information_Safe Q12Fees Q12Interest_Rates_Accounts Q12Interest_Rates_Loan Q12Open_Or_Close_Branches Q13 Q14 Q16 Q17 Q18 .011 .001 .000 .000 .000 .000 .000 .000 .000 .000 .000 .000 .000 .000 .000 .000 .000 .000 .000 .002 .000 .020 .001 .000 .142 .027 .000 .029 .054 .000 .000 .000 .000 .000 .000 .000 .000 .000 .000 .000 .002 .001 .000 .000 .000 .000 .000 .000 .000 .006 .000 .000 .000 .000 .000 .000 .000 .000 .004 .000 .000 .000 .000 .000 .000 .000 .000 .000 .000 .010 .237 .019 .000 .000 .000 .018 .048 .051
  • 154.
    Correlation Matrixa Q9Executive_R emuneration Q9Financial_In clusion_SMEba nking Sig. (1-tailed) Q9Social_Attachment Q9Confidentially Q9Valued_Customer_Recognition Q9Honest_Relationship Q9Being_Accountable Q9legal_Obligations Q9Combating_Bribery Q9Giving_Back_To_Community Q9Financial_literacy Q9Environmentally_branches Q10 Q11 Q12Financial_Stability Q12Withdraw_Money Q12Treated AQ12Advice_Quality Q12Personal_Information_Safe Q12Fees Q12Interest_Rates_Accounts Q12Interest_Rates_Loan Q12Open_Or_Close_Branches Q13 Q14 Q16 Q17 Q18 .000.000 .000 .000 .000 .000 .000 .000 .000 .000 .000 .000 .000 .000 .000 .000 .000 .000 .000 .001 .000 .000 .000 .000 .000 .000 .000 .000 .000 .000 .000 .000 .000 .000 .000 .000 .000 .000 .000 .001 .000 .000 .000 .000 .000 .000 .000 .000 .000 .002 .000 .000 .000 .000 .000 .000 .000 .000 .000 .000 .000 .000 .000 .000 .000 .000 .000 .000 .000 .019 .321 .190 .000 .000 .000 .051 .038 .017
  • 155.
    Correlation Matrixa Q9MeetCustom ers_Needs Q9Social_Attac hment Sig. (1-tailed) Q9Social_Attachment Q9Confidentially Q9Valued_Customer_Recognition Q9Honest_Relationship Q9Being_Accountable Q9legal_Obligations Q9Combating_Bribery Q9Giving_Back_To_Community Q9Financial_literacy Q9Environmentally_branches Q10 Q11 Q12Financial_Stability Q12Withdraw_Money Q12Treated AQ12Advice_Quality Q12Personal_Information_Safe Q12Fees Q12Interest_Rates_Accounts Q12Interest_Rates_Loan Q12Open_Or_Close_Branches Q13 Q14 Q16 Q17 Q18 .000.014 .000 .014 .000 .000 .000 .000 .000 .000 .000 .000 .000 .000 .000 .000 .000 .000 .000 .000 .000 .000 .000 .000 .002 .000 .000 .000 .000 .000 .000 .000 .000 .000 .000 .000 .000 .000 .001 .000 .000 .000 .000 .000 .000 .000 .000 .006 .000 .000 .000 .000 .000 .000 .000 .000 .000 .000 .000 .000 .000 .000 .000 .000 .000 .000 .000 .190 .397 .039 .000 .000 .000 .017 .090 .007
  • 156.
    Correlation Matrixa Q9Confidentiall y Q9Valued_Cust omer_Recogniti on Sig. (1-tailed) Q9Social_Attachment Q9Confidentially Q9Valued_Customer_Recognition Q9Honest_Relationship Q9Being_Accountable Q9legal_Obligations Q9Combating_Bribery Q9Giving_Back_To_Community Q9Financial_literacy Q9Environmentally_branches Q10 Q11 Q12Financial_Stability Q12Withdraw_Money Q12Treated AQ12Advice_Quality Q12Personal_Information_Safe Q12Fees Q12Interest_Rates_Accounts Q12Interest_Rates_Loan Q12Open_Or_Close_Branches Q13 Q14 Q16 Q17 Q18 .014.000 .000 .000 .000 .000 .000 .000 .000 .000 .000 .000 .000 .000 .000 .000 .000 .000 .000 .000 .000 .002 .000 .000 .000 .000 .000 .000 .000 .000 .000 .000 .000 .000 .000 .000 .000 .000 .000 .000 .000 .000 .000 .000 .000 .000 .000 .000 .000 .000 .000 .000 .000 .000 .000 .000 .000 .000 .000 .000 .000 .000 .000 .000 .000 .000 .039 .297 .345 .000 .000 .000 .007 .038 .015
  • 157.
    Correlation Matrixa Q9Honest_Rela tionship Q9Being_Acco untable Sig. (1-tailed) Q9Social_Attachment Q9Confidentially Q9Valued_Customer_Recognition Q9Honest_Relationship Q9Being_Accountable Q9legal_Obligations Q9Combating_Bribery Q9Giving_Back_To_Community Q9Financial_literacy Q9Environmentally_branches Q10 Q11 Q12Financial_Stability Q12Withdraw_Money Q12Treated AQ12Advice_Quality Q12Personal_Information_Safe Q12Fees Q12Interest_Rates_Accounts Q12Interest_Rates_Loan Q12Open_Or_Close_Branches Q13 Q14 Q16 Q17 Q18 .000.000 .000 .000 .000 .000 .000 .000 .000 .000 .000 .000 .000 .000 .000 .000 .000 .000 .000 .000 .000 .000 .000 .001 .000 .000 .001 .000 .000 .000 .000 .000 .000 .000 .000 .000 .000 .000 .000 .000 .000 .000 .000 .000 .000 .000 .000 .000 .000 .000 .000 .000 .000 .000 .000 .000 .000 .000 .000 .000 .000 .000 .000 .000 .000 .000 .345 .239 .128 .000 .000 .000 .015 .033 .046
  • 158.
    Correlation Matrixa Q9legal_Obliga tions Q9Combating_ Bribery Sig. (1-tailed) Q9Social_Attachment Q9Confidentially Q9Valued_Customer_Recognition Q9Honest_Relationship Q9Being_Accountable Q9legal_Obligations Q9Combating_Bribery Q9Giving_Back_To_Community Q9Financial_literacy Q9Environmentally_branches Q10 Q11 Q12Financial_Stability Q12Withdraw_Money Q12Treated AQ12Advice_Quality Q12Personal_Information_Safe Q12Fees Q12Interest_Rates_Accounts Q12Interest_Rates_Loan Q12Open_Or_Close_Branches Q13 Q14 Q16 Q17 Q18 .000.000 .000 .000 .000 .000 .000 .000 .000 .000 .000 .000 .000 .000 .000 .000 .000 .000 .000 .000 .000 .001 .001 .000 .001 .000 .000 .000 .000 .000 .000 .001 .000 .000 .000 .000 .000 .000 .000 .000 .000 .000 .000 .000 .000 .000 .000 .001 .000 .001 .000 .000 .000 .000 .000 .000 .000 .000 .004 .000 .000 .000 .000 .000 .000 .000 .128 .246 .242 .000 .000 .000 .046 .023 .010
  • 159.
    Correlation Matrixa Q9Giving_Back _To_Communit y Q9Financial_lit eracy Sig. (1-tailed) Q9Social_Attachment Q9Confidentially Q9Valued_Customer_Recognition Q9Honest_Relationship Q9Being_Accountable Q9legal_Obligations Q9Combating_Bribery Q9Giving_Back_To_Community Q9Financial_literacy Q9Environmentally_branches Q10 Q11 Q12Financial_Stability Q12Withdraw_Money Q12Treated AQ12Advice_Quality Q12Personal_Information_Safe Q12Fees Q12Interest_Rates_Accounts Q12Interest_Rates_Loan Q12Open_Or_Close_Branches Q13 Q14 Q16 Q17 Q18 .000.000 .000 .000 .002 .000 .000 .000 .000 .000 .000 .000 .000 .000 .000 .000 .001 .001 .000 .001 .000 .000 .000 .000 .000 .000 .000 .000 .000 .000 .000 .000 .000 .000 .000 .000 .000 .000 .000 .000 .000 .000 .000 .000 .000 .001 .012 .000 .000 .000 .000 .000 .001 .000 .000 .001 .000 .000 .003 .000 .000 .000 .000 .000 .000 .001 .242 .183 .123 .000 .000 .000 .010 .084 .033
  • 160.
    Correlation Matrixa Q9Environment ally_branches Q10Q11 Sig. (1-tailed) Q9Social_Attachment Q9Confidentially Q9Valued_Customer_Recognition Q9Honest_Relationship Q9Being_Accountable Q9legal_Obligations Q9Combating_Bribery Q9Giving_Back_To_Community Q9Financial_literacy Q9Environmentally_branches Q10 Q11 Q12Financial_Stability Q12Withdraw_Money Q12Treated AQ12Advice_Quality Q12Personal_Information_Safe Q12Fees Q12Interest_Rates_Accounts Q12Interest_Rates_Loan Q12Open_Or_Close_Branches Q13 Q14 Q16 Q17 Q18 .000 .000 .000 .000 .000 .000 .000 .000 .000 .000 .000 .000 .000 .000 .000 .000 .000 .000 .000 .000 .001 .000 .000 .000 .000 .000 .001 .000 .000 .000 .000 .000 .000 .000 .000 .000 .000 .000 .000 .000 .000 .000 .000 .000 .000 .000 .000 .000 .000 .000 .000 .000 .000 .000 .000 .000 .000 .000 .000 .000 .000 .000 .000 .000 .000 .000 .000 .000 .000 .000 .000 .000 .000 .000 .000 .000 .000 .000 .000 .000 .000 .000 .000 .000 .001 .000 .000 .000 .123 .160 .219 .045 .000 .000 .000 .000 .033 .007 .092 .002
  • 161.
    Correlation Matrixa Q12Financial_S tability Q12Withdraw_ Money Sig. (1-tailed) Q9Social_Attachment Q9Confidentially Q9Valued_Customer_Recognition Q9Honest_Relationship Q9Being_Accountable Q9legal_Obligations Q9Combating_Bribery Q9Giving_Back_To_Community Q9Financial_literacy Q9Environmentally_branches Q10 Q11 Q12Financial_Stability Q12Withdraw_Money Q12Treated AQ12Advice_Quality Q12Personal_Information_Safe Q12Fees Q12Interest_Rates_Accounts Q12Interest_Rates_Loan Q12Open_Or_Close_Branches Q13 Q14 Q16 Q17 Q18 .000.001 .000 .000 .000 .000 .000 .000 .000 .000 .000 .000 .000 .000 .000 .000 .000 .000 .000 .000 .000 .000 .000 .000 .000 .000 .000 .000 .000 .000 .000 .000 .000 .000 .000 .000 .000 .000 .000 .000 .000 .000 .000 .000 .000 .000 .000 .000 .000 .000 .000 .000 .000 .000 .000 .000 .000 .000 .000 .000 .000 .000 .000 .000 .000 .000 .045 .002 .077 .000 .002 .000 .002 .025 .002
  • 162.
    Correlation Matrixa Q12Treated AQ12Advice_Q uality Sig. (1-tailed) Q9Social_Attachment Q9Confidentially Q9Valued_Customer_Recognition Q9Honest_Relationship Q9Being_Accountable Q9legal_Obligations Q9Combating_Bribery Q9Giving_Back_To_Community Q9Financial_literacy Q9Environmentally_branches Q10 Q11 Q12Financial_Stability Q12Withdraw_Money Q12Treated AQ12Advice_Quality Q12Personal_Information_Safe Q12Fees Q12Interest_Rates_Accounts Q12Interest_Rates_Loan Q12Open_Or_Close_Branches Q13 Q14 Q16 Q17 Q18 .000.000 .006 .000 .000 .000 .000 .000 .000 .000 .000 .000 .000 .000 .000 .000 .000 .000 .000 .000 .000 .000 .000 .001 .000 .000 .012 .000 .000 .000 .000 .000 .000 .000 .000 .000 .000 .000 .000 .000 .000 .000 .000 .000 .000 .000 .000 .000 .000 .000 .000 .000 .000 .000 .000 .000 .000 .000 .000 .000 .000 .000 .002 .000 .000 .001 .077 .131 .152 .000 .000 .009 .002 .005 .051
  • 163.
    Correlation Matrixa Q12Personal_I nformation_Saf e Q12Fees Sig.(1-tailed) Q9Social_Attachment Q9Confidentially Q9Valued_Customer_Recognition Q9Honest_Relationship Q9Being_Accountable Q9legal_Obligations Q9Combating_Bribery Q9Giving_Back_To_Community Q9Financial_literacy Q9Environmentally_branches Q10 Q11 Q12Financial_Stability Q12Withdraw_Money Q12Treated AQ12Advice_Quality Q12Personal_Information_Safe Q12Fees Q12Interest_Rates_Accounts Q12Interest_Rates_Loan Q12Open_Or_Close_Branches Q13 Q14 Q16 Q17 Q18 .006 .000 .000 .000 .000 .000 .000 .000 .000 .000 .000 .000 .000 .000 .000 .000 .000 .000 .000 .001 .000 .001 .000 .000 .012 .000 .001 .000 .000 .000 .000 .000 .000 .000 .000 .000 .000 .000 .000 .000 .000 .000 .000 .000 .000 .000 .000 .000 .000 .000 .000 .000 .000 .000 .000 .000 .000 .000 .000 .000 .002 .000 .000 .001 .000 .000 .152 .026 .117 .009 .000 .000 .051 .093 .115
  • 164.
    Correlation Matrixa Q12Interest_Ra tes_Accounts Q12Interest_Ra tes_Loan Sig. (1-tailed) Q9Social_Attachment Q9Confidentially Q9Valued_Customer_Recognition Q9Honest_Relationship Q9Being_Accountable Q9legal_Obligations Q9Combating_Bribery Q9Giving_Back_To_Community Q9Financial_literacy Q9Environmentally_branches Q10 Q11 Q12Financial_Stability Q12Withdraw_Money Q12Treated AQ12Advice_Quality Q12Personal_Information_Safe Q12Fees Q12Interest_Rates_Accounts Q12Interest_Rates_Loan Q12Open_Or_Close_Branches Q13 Q14 Q16 Q17 Q18 .000.000 .000 .000 .000 .000 .000 .000 .000 .000 .000 .000 .000 .000 .000 .000 .000 .000 .000 .000 .004 .000 .000 .000 .001 .001 .003 .000 .000 .000 .000 .000 .000 .000 .000 .000 .000 .000 .000 .000 .000 .000 .000 .000 .000 .000 .000 .000 .000 .000 .000 .000 .000 .000 .000 .000 .000 .000 .000 .000 .000 .000 .000 .000 .000 .000 .117 .088 .072 .000 .001 .000 .115 .086 .370
  • 165.
    Correlation Matrixa Q12Open_Or_ Close_Branche s Q13Q14 Sig. (1-tailed) Q9Social_Attachment Q9Confidentially Q9Valued_Customer_Recognition Q9Honest_Relationship Q9Being_Accountable Q9legal_Obligations Q9Combating_Bribery Q9Giving_Back_To_Community Q9Financial_literacy Q9Environmentally_branches Q10 Q11 Q12Financial_Stability Q12Withdraw_Money Q12Treated AQ12Advice_Quality Q12Personal_Information_Safe Q12Fees Q12Interest_Rates_Accounts Q12Interest_Rates_Loan Q12Open_Or_Close_Branches Q13 Q14 Q16 Q17 Q18 .000 .000 .000 .397 .000 .000 .000 .039 .000 .000 .000 .297 .000 .000 .000 .345 .000 .000 .000 .239 .000 .000 .000 .128 .004 .000 .000 .246 .000 .000 .000 .242 .003 .000 .000 .183 .000 .000 .001 .123 .000 .000 .000 .160 .000 .000 .000 .219 .000 .000 .000 .045 .000 .000 .000 .002 .000 .000 .000 .077 .000 .000 .000 .131 .000 .002 .001 .152 .000 .000 .000 .026 .000 .000 .000 .117 .000 .000 .000 .088 .000 .000 .072 .000 .000 .195 .000 .000 .462 .072 .195 .462 .000 .000 .000 .031 .370 .147 .066 .007
  • 166.
    Correlation Matrixa Q16 Q17Q18 Sig. (1-tailed) Q9Social_Attachment Q9Confidentially Q9Valued_Customer_Recognition Q9Honest_Relationship Q9Being_Accountable Q9legal_Obligations Q9Combating_Bribery Q9Giving_Back_To_Community Q9Financial_literacy Q9Environmentally_branches Q10 Q11 Q12Financial_Stability Q12Withdraw_Money Q12Treated AQ12Advice_Quality Q12Personal_Information_Safe Q12Fees Q12Interest_Rates_Accounts Q12Interest_Rates_Loan Q12Open_Or_Close_Branches Q13 Q14 Q16 Q17 Q18 .397 .000 .090 .039 .000 .007 .297 .000 .038 .345 .000 .015 .239 .000 .033 .128 .000 .046 .246 .000 .023 .242 .000 .010 .183 .000 .084 .123 .000 .033 .160 .000 .007 .219 .000 .092 .045 .000 .002 .002 .002 .025 .077 .000 .002 .131 .000 .005 .152 .009 .051 .026 .000 .093 .117 .000 .115 .088 .001 .086 .072 .000 .370 .195 .000 .147 .462 .000 .066 .031 .007 .031 .000 .007 .000 Determinant = 1.62E-013a. KMO and Bartlett's Test Kaiser-Meyer-Olkin Measure of Sampling Adequacy. Bartlett's Test of Sphericity Approx. Chi-Square df Sig. .896 2331.783 528 .000
  • 167.
    Communalities Initial Extraction Q9Borrowings_And_Savings Q9Transparency Q9Financial_Statements Q9Offers Q9Executive_Remuneration Q9Financial_Inclusion_SMEbanking Q9MeetCustomers_Needs Q9Social_Attachment Q9Confidentially Q9Valued_Customer_Recognition Q9Honest_Relationship Q9Being_Accountable Q9legal_Obligations Q9Combating_Bribery Q9Giving_Back_To_Community Q9Financial_literacy Q9Environmentally_branches Q10 Q11 Q12Financial_Stability Q12Withdraw_Money Q12Treated AQ12Advice_Quality Q12Personal_Information_Safe Q12Fees Q12Interest_Rates_Accounts Q12Interest_Rates_Loan Q12Open_Or_Close_Branches Q13 Q14 Q16 Q17 Q18 1.000 .695 1.000.681 1.000 .693 1.000 .598 1.000 .704 1.000 .541 1.000 .701 1.000 .774 1.000 .653 1.000 .776 1.000 .742 1.000 .727 1.000 .690 1.000 .641 1.000 .705 1.000 .693 1.000 .701 1.000 .739 1.000 .762 1.000 .631 1.000 .634 1.000 .843 1.000 .728 1.000 .533 1.000 .848 1.000 .723 1.000 .755 1.000 .661 1.000 .690 1.000 .554 1.000 .717 1.000 .672 1.000 .583 Extraction Method: Principal Component Analysis.
  • 168.
    Total Variance Explained Component InitialEigenvalues Extraction Sums of Squared Loadings Total % of Variance Cumulative % Total % of Variance Cumulative % 1 2 3 4 5 6 7 8 9 10 11 12 13 14 15 16 17 18 19 20 21 22 23 24 25 26 27 28 29 30 31 32 33 15.465 46.863 46.863 15.465 46.863 46.863 2.022 6.127 52.990 2.022 6.127 52.990 1.610 4.877 57.867 1.610 4.877 57.867 1.371 4.154 62.021 1.371 4.154 62.021 1.194 3.618 65.640 1.194 3.618 65.640 1.124 3.407 69.047 1.124 3.407 69.047 .911 2.759 71.806 .792 2.400 74.206 .774 2.346 76.552 .708 2.145 78.697 .683 2.070 80.767 .665 2.016 82.783 .629 1.905 84.689 .539 1.634 86.322 .531 1.610 87.932 .485 1.471 89.403 .441 1.336 90.739 .436 1.322 92.061 .338 1.024 93.085 .317 .962 94.047 .297 .899 94.946 .234 .708 95.655 .223 .677 96.331 .198 .599 96.931 .170 .516 97.447 .158 .478 97.925 .144 .436 98.360 .125 .378 98.738 .110 .333 99.071 .088 .267 99.338 .084 .253 99.591 .073 .222 99.814 .061 .186 100.000 Extraction Method: Principal Component Analysis.
  • 169.
  • 170.
    Correlation Matrixa Q9Borrowings_ And_Savings Q9Transparenc y Q9Financial_St atements Q9Offers CorrelationQ9Borrowings_And_Saving s Q9Transparency Q9Financial_Statements Q9Offers Q9Executive_Remuneratio n Q9Financial_Inclusion_SM Ebanking Q9MeetCustomers_Needs Q9Social_Attachment Q9Confidentially Q9Valued_Customer_Reco gnition Q9Honest_Relationship Q9Being_Accountable Q9legal_Obligations Q9Combating_Bribery Q9Giving_Back_To_Comm unity Q9Financial_literacy Q9Environmentally_branch es 1.000 .559 .533 .495 .407 .559 1.000 .553 .518 .467 .533 .553 1.000 .428 .215 .495 .518 .428 1.000 .291 .407 .467 .215 .291 1.000 .512 .478 .365 .328 .566 .503 .503 .434 .490 .468 .579 .502 .240 .330 .537 .520 .390 .452 .371 .388 .413 .484 .363 .383 .457 .559 .605 .473 .414 .584 .570 .580 .421 .440 .600 .563 .489 .550 .440 .516 .446 .374 .376 .290 .471 .457 .455 .215 .333 .474 .410 .341 .113 .202 .538 .514 .329 .198 .169 .486 .633 .660 .450 .492 .572
  • 171.
    Correlation Matrixa Q9Executive_R emuneration Q9Financial_In clusion_SMEba nking Q9MeetCustom ers_Needs Correlation Q9Borrowings_And_Saving s Q9Transparency Q9Financial_Statements Q9Offers Q9Executive_Remuneratio n Q9Financial_Inclusion_SM Ebanking Q9MeetCustomers_Needs Q9Social_Attachment Q9Confidentially Q9Valued_Customer_Reco gnition Q9Honest_Relationship Q9Being_Accountable Q9legal_Obligations Q9Combating_Bribery Q9Giving_Back_To_Comm unity Q9Financial_literacy Q9Environmentally_branch es .407.512 .503 .579 .467 .478 .503 .502 .215 .365 .434 .240 .291 .328 .490 .330 1.000 .566 .468 .537 .566 1.000 .609 .557 .468 .609 1.000 .455 .537 .557 .455 1.000 .388 .415 .520 .230 .457 .385 .614 .396 .584 .504 .595 .345 .600 .398 .605 .463 .516 .341 .438 .344 .471 .319 .427 .384 .474 .382 .561 .588 .538 .448 .431 .645 .486 .385 .392 .529 .572 .584 .573 .575
  • 172.
    Correlation Matrixa Q9Social_Attac hment Q9Confidentiall y Q9Valued_Cust omer_Recogniti on Correlation Q9Borrowings_And_Saving s Q9Transparency Q9Financial_Statements Q9Offers Q9Executive_Remuneratio n Q9Financial_Inclusion_SM Ebanking Q9MeetCustomers_Needs Q9Social_Attachment Q9Confidentially Q9Valued_Customer_Reco gnition Q9Honest_Relationship Q9Being_Accountable Q9legal_Obligations Q9Combating_Bribery Q9Giving_Back_To_Comm unity Q9Financial_literacy Q9Environmentally_branch es .579.520 .413 .559 .502 .390 .484 .605 .240 .452 .363 .473 .330 .371 .383 .414 .537 .388 .457 .584 .557 .415 .385 .504 .455 .520 .614 .595 1.000 .230 .396 .345 .230 1.000 .506 .623 .396 .506 1.000 .700 .345 .623 .700 1.000 .463 .626 .624 .670 .344 .538 .494 .607 .384 .522 .510 .492 .588 .439 .629 .457 .645 .298 .489 .359 .529 .356 .402 .384 .575 .492 .410 .573
  • 173.
    Correlation Matrixa Q9Honest_Rela tionship Q9Being_Acco untable Q9legal_Obliga tions Correlation Q9Borrowings_And_Saving s Q9Transparency Q9Financial_Statements Q9Offers Q9Executive_Remuneratio n Q9Financial_Inclusion_SM Ebanking Q9MeetCustomers_Needs Q9Social_Attachment Q9Confidentially Q9Valued_Customer_Reco gnition Q9Honest_Relationship Q9Being_Accountable Q9legal_Obligations Q9Combating_Bribery Q9Giving_Back_To_Comm unity Q9Financial_literacy Q9Environmentally_branch es .559.570 .563 .446 .605 .580 .489 .374 .473 .421 .550 .376 .414 .440 .440 .290 .584 .600 .516 .471 .504 .398 .341 .319 .595 .605 .438 .427 .345 .463 .344 .384 .623 .626 .538 .522 .700 .624 .494 .510 1.000 .670 .607 .492 .670 1.000 .648 .596 .607 .648 1.000 .554 .492 .596 .554 1.000 .457 .627 .345 .542 .359 .459 .335 .332 .384 .504 .318 .379 .573 .595 .608 .398
  • 174.
    Correlation Matrixa Q9Combating_ Bribery Q9Giving_Back _To_Communit y Q9Financial_lit eracy Correlation Q9Borrowings_And_Saving s Q9Transparency Q9Financial_Statements Q9Offers Q9Executive_Remuneratio n Q9Financial_Inclusion_SM Ebanking Q9MeetCustomers_Needs Q9Social_Attachment Q9Confidentially Q9Valued_Customer_Reco gnition Q9Honest_Relationship Q9Being_Accountable Q9legal_Obligations Q9Combating_Bribery Q9Giving_Back_To_Comm unity Q9Financial_literacy Q9Environmentally_branch es .446.457 .410 .514 .374 .455 .341 .329 .376 .215 .113 .198 .290 .333 .202 .169 .471 .474 .538 .486 .319 .382 .448 .385 .427 .561 .431 .392 .384 .588 .645 .529 .522 .439 .298 .356 .510 .629 .489 .402 .492 .457 .359 .384 .596 .627 .459 .504 .554 .345 .335 .318 1.000 .542 .332 .379 .542 1.000 .590 .594 .332 .590 1.000 .441 .379 .594 .441 1.000 .398 .411 .479 .455
  • 175.
    Correlation Matrixa Q9Environment ally_branches I thinkthat my bank's actual social activities and ethical behaviour comply with what they committed to in the media and other channels since the Financial Crisis of 2007 I feel that I am getting an economic value in my dealings with my bank (Good quality products that efficiently satisfy my needs and requirements) Correlation Q9Borrowings_And_Saving s Q9Transparency Q9Financial_Statements Q9Offers Q9Executive_Remuneratio n Q9Financial_Inclusion_SM Ebanking Q9MeetCustomers_Needs Q9Social_Attachment Q9Confidentially Q9Valued_Customer_Reco gnition Q9Honest_Relationship Q9Being_Accountable Q9legal_Obligations Q9Combating_Bribery Q9Giving_Back_To_Comm unity Q9Financial_literacy Q9Environmentally_branch es .514 .633 .492 .592 .329 .660 .578 .539 .198 .450 .408 .528 .169 .492 .498 .395 .486 .572 .445 .489 .385 .584 .521 .442 .392 .573 .694 .592 .529 .575 .527 .450 .356 .492 .383 .587 .402 .410 .474 .427 .384 .573 .577 .531 .504 .595 .513 .600 .318 .608 .416 .505 .379 .398 .321 .385 .594 .411 .438 .492 .441 .479 .538 .452 1.000 .455 .343 .477 .455 1.000 .670 .657
  • 176.
    Correlation Matrixa Q12Financial_S tability Q12Withdraw_ Money Q12Treated CorrelationQ9Borrowings_And_Saving s Q9Transparency Q9Financial_Statements Q9Offers Q9Executive_Remuneratio n Q9Financial_Inclusion_SM Ebanking Q9MeetCustomers_Needs Q9Social_Attachment Q9Confidentially Q9Valued_Customer_Reco gnition Q9Honest_Relationship Q9Being_Accountable Q9legal_Obligations Q9Combating_Bribery Q9Giving_Back_To_Comm unity Q9Financial_literacy Q9Environmentally_branch es .592 .448 .474 .510 .539 .433 .616 .578 .528 .442 .455 .461 .395 .302 .453 .427 .489 .329 .398 .451 .442 .385 .434 .529 .592 .441 .679 .666 .450 .335 .406 .452 .587 .529 .559 .421 .427 .393 .675 .677 .531 .509 .646 .672 .600 .399 .599 .595 .505 .503 .497 .528 .385 .464 .472 .421 .492 .411 .493 .487 .452 .355 .462 .469 .477 .399 .465 .502 .657 .530 .647 .561
  • 177.
    Correlation Matrixa AQ12Advice_Q uality Q12Personal_I nformation_Saf e Q12Fees Q12Interest_Ra tes_Accounts CorrelationQ9Borrowings_And_Saving s Q9Transparency Q9Financial_Statements Q9Offers Q9Executive_Remuneratio n Q9Financial_Inclusion_SM Ebanking Q9MeetCustomers_Needs Q9Social_Attachment Q9Confidentially Q9Valued_Customer_Reco gnition Q9Honest_Relationship Q9Being_Accountable Q9legal_Obligations Q9Combating_Bribery Q9Giving_Back_To_Comm unity Q9Financial_literacy Q9Environmentally_branch es .510 .423 .523 .667 .513 .578 .338 .761 .583 .529 .461 .455 .519 .503 .450 .427 .260 .403 .392 .274 .451 .431 .442 .380 .378 .529 .293 .490 .413 .455 .666 .370 .568 .492 .524 .452 .259 .442 .430 .483 .421 .416 .385 .472 .390 .677 .375 .464 .462 .448 .672 .508 .575 .531 .470 .595 .348 .525 .488 .393 .528 .361 .426 .479 .423 .421 .395 .329 .409 .352 .487 .318 .445 .396 .435 .469 .235 .346 .326 .328 .502 .370 .377 .397 .501 .561 .380 .664 .591 .623
  • 178.
    Correlation Matrixa Q12Interest_Ra tes_Loan Q12Open_Or_ Close_Branche s I thinkthe overall approach of my bank's social responsibility activities is aligned with customers’ needs and demands in the post financial crisis of 2007 Correlation Q9Borrowings_And_Saving s Q9Transparency Q9Financial_Statements Q9Offers Q9Executive_Remuneratio n Q9Financial_Inclusion_SM Ebanking Q9MeetCustomers_Needs Q9Social_Attachment Q9Confidentially Q9Valued_Customer_Reco gnition Q9Honest_Relationship Q9Being_Accountable Q9legal_Obligations Q9Combating_Bribery Q9Giving_Back_To_Comm unity Q9Financial_literacy Q9Environmentally_branch es .513 .549 .482 .490 .529 .480 .595 .458 .450 .376 .415 .448 .274 .355 .357 .360 .378 .383 .566 .553 .455 .459 .598 .444 .524 .403 .518 .540 .483 .357 .607 .393 .390 .344 .368 .388 .448 .351 .534 .474 .470 .484 .562 .544 .393 .474 .533 .561 .423 .519 .519 .463 .352 .275 .423 .442 .435 .352 .528 .526 .328 .286 .557 .404 .501 .442 .400 .327 .623 .587 .701 .531
  • 179.
    Correlation Matrixa Overall, Ithink that no ethical problems have occurred at my bank in the years following the Financial Crisis of 2007 I think that banks in general are likely to have learned the lesson in terms of navigating a balance between the pursuit of profit and operating in a socially responsible manner Has your confidence towards the banking industry changed in the past seven years? Correlation Q9Borrowings_And_Saving s Q9Transparency Q9Financial_Statements Q9Offers Q9Executive_Remuneratio n Q9Financial_Inclusion_SM Ebanking Q9MeetCustomers_Needs Q9Social_Attachment Q9Confidentially Q9Valued_Customer_Reco gnition Q9Honest_Relationship Q9Being_Accountable Q9legal_Obligations Q9Combating_Bribery Q9Giving_Back_To_Comm unity Q9Financial_literacy Q9Environmentally_branch es .490 .492 .245 .458 .448 .266 .448 .472 .219 .360 .368 .174 .553 .411 .171 .444 .370 .186 .540 .412 .222 .393 .525 .141 .388 .364 .253 .474 .350 .185 .544 .452 .225 .561 .545 .193 .463 .360 .177 .442 .409 .208 .526 .421 .241 .404 .405 .145 .327 .472 .192 .531 .458 .255
  • 180.
    Correlation Matrixa Q9Borrowings_ And_Savings Q9Transparenc y Q9Financial_St atements Q9Offers Ithink that my bank's actual social activities and ethical behaviour comply with what they committed to in the media and other channels since the Financial Crisis of 2007 I feel that I am getting an economic value in my dealings with my bank (Good quality products that efficiently satisfy my needs and requirements) Q12Financial_Stability Q12Withdraw_Money Q12Treated AQ12Advice_Quality Q12Personal_Information_ Safe Q12Fees Q12Interest_Rates_Accoun ts Q12Interest_Rates_Loan Q12Open_Or_Close_Branc hes I think the overall approach of my bank's social responsibility activities is aligned with customers’ needs and demands in the post financial crisis of 2007 .633 .660 .450 .492 .572 .492 .578 .408 .498 .445 .592 .539 .528 .395 .489 .448 .433 .442 .302 .329 .474 .616 .455 .453 .398 .510 .578 .461 .427 .451 .423 .338 .455 .260 .431 .523 .761 .519 .403 .442 .667 .583 .503 .392 .380 .513 .529 .450 .274 .378 .549 .480 .376 .355 .383 .482 .595 .415 .357 .566 .490 .458 .448 .360 .553
  • 181.
    Correlation Matrixa Q9Executive_R emuneration Q9Financial_In clusion_SMEba nking Q9MeetCustom ers_Needs I thinkthat my bank's actual social activities and ethical behaviour comply with what they committed to in the media and other channels since the Financial Crisis of 2007 I feel that I am getting an economic value in my dealings with my bank (Good quality products that efficiently satisfy my needs and requirements) Q12Financial_Stability Q12Withdraw_Money Q12Treated AQ12Advice_Quality Q12Personal_Information_ Safe Q12Fees Q12Interest_Rates_Accoun ts Q12Interest_Rates_Loan Q12Open_Or_Close_Branc hes I think the overall approach of my bank's social responsibility activities is aligned with customers’ needs and demands in the post financial crisis of 2007 .572 .584 .573 .575 .445 .521 .694 .527 .489 .442 .592 .450 .329 .385 .441 .335 .398 .434 .679 .406 .451 .529 .666 .452 .431 .293 .370 .259 .442 .490 .568 .442 .380 .413 .492 .430 .378 .455 .524 .483 .383 .459 .403 .357 .566 .598 .518 .607 .553 .444 .540 .393
  • 182.
    Correlation Matrixa Q9Social_Attac hment Q9Confidentiall y Q9Valued_Cust omer_Recogniti on I thinkthat my bank's actual social activities and ethical behaviour comply with what they committed to in the media and other channels since the Financial Crisis of 2007 I feel that I am getting an economic value in my dealings with my bank (Good quality products that efficiently satisfy my needs and requirements) Q12Financial_Stability Q12Withdraw_Money Q12Treated AQ12Advice_Quality Q12Personal_Information_ Safe Q12Fees Q12Interest_Rates_Accoun ts Q12Interest_Rates_Loan Q12Open_Or_Close_Branc hes I think the overall approach of my bank's social responsibility activities is aligned with customers’ needs and demands in the post financial crisis of 2007 .575 .492 .410 .573 .527 .383 .474 .577 .450 .587 .427 .531 .335 .529 .393 .509 .406 .559 .675 .646 .452 .421 .677 .672 .259 .416 .375 .508 .442 .385 .464 .575 .430 .472 .462 .531 .483 .390 .448 .470 .357 .344 .351 .484 .607 .368 .534 .562 .393 .388 .474 .544
  • 183.
    Correlation Matrixa Q9Honest_Rela tionship Q9Being_Acco untable Q9legal_Obliga tions I thinkthat my bank's actual social activities and ethical behaviour comply with what they committed to in the media and other channels since the Financial Crisis of 2007 I feel that I am getting an economic value in my dealings with my bank (Good quality products that efficiently satisfy my needs and requirements) Q12Financial_Stability Q12Withdraw_Money Q12Treated AQ12Advice_Quality Q12Personal_Information_ Safe Q12Fees Q12Interest_Rates_Accoun ts Q12Interest_Rates_Loan Q12Open_Or_Close_Branc hes I think the overall approach of my bank's social responsibility activities is aligned with customers’ needs and demands in the post financial crisis of 2007 .573 .595 .608 .398 .577 .513 .416 .321 .531 .600 .505 .385 .509 .399 .503 .464 .646 .599 .497 .472 .672 .595 .528 .421 .508 .348 .361 .395 .575 .525 .426 .329 .531 .488 .479 .409 .470 .393 .423 .352 .484 .474 .519 .275 .562 .533 .519 .423 .544 .561 .463 .442
  • 184.
    Correlation Matrixa Q9Combating_ Bribery Q9Giving_Back _To_Communit y Q9Financial_lit eracy I thinkthat my bank's actual social activities and ethical behaviour comply with what they committed to in the media and other channels since the Financial Crisis of 2007 I feel that I am getting an economic value in my dealings with my bank (Good quality products that efficiently satisfy my needs and requirements) Q12Financial_Stability Q12Withdraw_Money Q12Treated AQ12Advice_Quality Q12Personal_Information_ Safe Q12Fees Q12Interest_Rates_Accoun ts Q12Interest_Rates_Loan Q12Open_Or_Close_Branc hes I think the overall approach of my bank's social responsibility activities is aligned with customers’ needs and demands in the post financial crisis of 2007 .398 .411 .479 .455 .321 .438 .538 .343 .385 .492 .452 .477 .464 .411 .355 .399 .472 .493 .462 .465 .421 .487 .469 .502 .395 .318 .235 .370 .329 .445 .346 .377 .409 .396 .326 .397 .352 .435 .328 .501 .275 .352 .286 .442 .423 .528 .557 .400 .442 .526 .404 .327
  • 185.
    Correlation Matrixa Q9Environment ally_branches I thinkthat my bank's actual social activities and ethical behaviour comply with what they committed to in the media and other channels since the Financial Crisis of 2007 I feel that I am getting an economic value in my dealings with my bank (Good quality products that efficiently satisfy my needs and requirements) I think that my bank's actual social activities and ethical behaviour comply with what they committed to in the media and other channels since the Financial Crisis of 2007 I feel that I am getting an economic value in my dealings with my bank (Good quality products that efficiently satisfy my needs and requirements) Q12Financial_Stability Q12Withdraw_Money Q12Treated AQ12Advice_Quality Q12Personal_Information_ Safe Q12Fees Q12Interest_Rates_Accoun ts Q12Interest_Rates_Loan Q12Open_Or_Close_Branc hes I think the overall approach of my bank's social responsibility activities is aligned with customers’ needs and demands in the post financial crisis of 2007 .455 1.000 .670 .657 .343 .670 1.000 .608 .477 .657 .608 1.000 .399 .530 .486 .546 .465 .647 .705 .567 .502 .561 .623 .498 .370 .380 .371 .549 .377 .664 .721 .625 .397 .591 .542 .561 .501 .623 .543 .546 .442 .587 .488 .494 .400 .701 .604 .548 .327 .531 .424 .492
  • 186.
    Correlation Matrixa Q12Financial_S tability Q12Withdraw_ Money Q12Treated Ithink that my bank's actual social activities and ethical behaviour comply with what they committed to in the media and other channels since the Financial Crisis of 2007 I feel that I am getting an economic value in my dealings with my bank (Good quality products that efficiently satisfy my needs and requirements) Q12Financial_Stability Q12Withdraw_Money Q12Treated AQ12Advice_Quality Q12Personal_Information_ Safe Q12Fees Q12Interest_Rates_Accoun ts Q12Interest_Rates_Loan Q12Open_Or_Close_Branc hes I think the overall approach of my bank's social responsibility activities is aligned with customers’ needs and demands in the post financial crisis of 2007 .657 .530 .647 .561 .608 .486 .705 .623 1.000 .546 .567 .498 .546 1.000 .681 .560 .567 .681 1.000 .777 .498 .560 .777 1.000 .549 .552 .432 .410 .625 .540 .706 .598 .561 .466 .599 .518 .546 .441 .598 .506 .494 .478 .528 .487 .548 .407 .559 .523 .492 .373 .478 .514
  • 187.
    Correlation Matrixa AQ12Advice_Q uality Q12Personal_I nformation_Saf e Q12Fees Q12Interest_Ra tes_Accounts Ithink that my bank's actual social activities and ethical behaviour comply with what they committed to in the media and other channels since the Financial Crisis of 2007 I feel that I am getting an economic value in my dealings with my bank (Good quality products that efficiently satisfy my needs and requirements) Q12Financial_Stability Q12Withdraw_Money Q12Treated AQ12Advice_Quality Q12Personal_Information_ Safe Q12Fees Q12Interest_Rates_Accoun ts Q12Interest_Rates_Loan Q12Open_Or_Close_Branc hes I think the overall approach of my bank's social responsibility activities is aligned with customers’ needs and demands in the post financial crisis of 2007 .561 .380 .664 .591 .623 .623 .371 .721 .542 .543 .498 .549 .625 .561 .546 .560 .552 .540 .466 .441 .777 .432 .706 .599 .598 1.000 .410 .598 .518 .506 .410 1.000 .491 .428 .450 .598 .491 1.000 .762 .735 .518 .428 .762 1.000 .792 .506 .450 .735 .792 1.000 .487 .365 .670 .627 .631 .523 .301 .562 .442 .540 .514 .334 .465 .460 .416
  • 188.
    Correlation Matrixa Q12Interest_Ra tes_Loan Q12Open_Or_ Close_Branche s I thinkthe overall approach of my bank's social responsibility activities is aligned with customers’ needs and demands in the post financial crisis of 2007 I think that my bank's actual social activities and ethical behaviour comply with what they committed to in the media and other channels since the Financial Crisis of 2007 I feel that I am getting an economic value in my dealings with my bank (Good quality products that efficiently satisfy my needs and requirements) Q12Financial_Stability Q12Withdraw_Money Q12Treated AQ12Advice_Quality Q12Personal_Information_ Safe Q12Fees Q12Interest_Rates_Accoun ts Q12Interest_Rates_Loan Q12Open_Or_Close_Branc hes I think the overall approach of my bank's social responsibility activities is aligned with customers’ needs and demands in the post financial crisis of 2007 .623 .587 .701 .531 .543 .488 .604 .424 .546 .494 .548 .492 .441 .478 .407 .373 .598 .528 .559 .478 .506 .487 .523 .514 .450 .365 .301 .334 .735 .670 .562 .465 .792 .627 .442 .460 1.000 .631 .540 .416 .631 1.000 .466 .473 .540 .466 1.000 .639 .416 .473 .639 1.000
  • 189.
    Correlation Matrixa Overall, Ithink that no ethical problems have occurred at my bank in the years following the Financial Crisis of 2007 I think that banks in general are likely to have learned the lesson in terms of navigating a balance between the pursuit of profit and operating in a socially responsible manner Has your confidence towards the banking industry changed in the past seven years? I think that my bank's actual social activities and ethical behaviour comply with what they committed to in the media and other channels since the Financial Crisis of 2007 I feel that I am getting an economic value in my dealings with my bank (Good quality products that efficiently satisfy my needs and requirements) Q12Financial_Stability Q12Withdraw_Money Q12Treated AQ12Advice_Quality Q12Personal_Information_ Safe Q12Fees Q12Interest_Rates_Accoun ts Q12Interest_Rates_Loan Q12Open_Or_Close_Branc hes I think the overall approach of my bank's social responsibility activities is aligned with customers’ needs and demands in the post financial crisis of 2007 .531 .458 .255 .424 .430 .140 .492 .471 .299 .373 .297 .205 .478 .509 .290 .514 .534 .264 .334 .248 .171 .465 .375 .139 .460 .388 .126 .416 .330 .144 .473 .357 .035 .639 .413 .110 1.000 .573 .158
  • 190.
    Correlation Matrixa Q9Borrowings_ And_Savings Q9Transparenc y Q9Financial_St atements Q9Offers Overall,I think that no ethical problems have occurred at my bank in the years following the Financial Crisis of 2007 I think that banks in general are likely to have learned the lesson in terms of navigating a balance between the pursuit of profit and operating in a socially responsible manner Has your confidence towards the banking industry changed in the past seven years? Sig. (1-tailed) Q9Borrowings_And_Saving s Q9Transparency Q9Financial_Statements Q9Offers Q9Executive_Remuneratio n Q9Financial_Inclusion_SM Ebanking Q9MeetCustomers_Needs Q9Social_Attachment Q9Confidentially Q9Valued_Customer_Reco gnition Q9Honest_Relationship .490 .458 .448 .360 .553 .492 .448 .472 .368 .411 .245 .266 .219 .174 .171 .000 .000 .000 .000 .000 .000 .000 .000 .000 .000 .000 .020 .000 .000 .000 .002 .000 .000 .020 .002 .000 .000 .000 .001 .000 .000 .000 .000 .000 .000 .000 .000 .011 .001 .000 .000 .000 .000 .000 .000 .000 .000 .000 .000 .000 .000 .000 .000 .000 .000 .000 .000 .000 .000
  • 191.
    Correlation Matrixa Q9Executive_R emuneration Q9Financial_In clusion_SMEba nking Q9MeetCustom ers_Needs Overall, Ithink that no ethical problems have occurred at my bank in the years following the Financial Crisis of 2007 I think that banks in general are likely to have learned the lesson in terms of navigating a balance between the pursuit of profit and operating in a socially responsible manner Has your confidence towards the banking industry changed in the past seven years? Sig. (1-tailed) Q9Borrowings_And_Saving s Q9Transparency Q9Financial_Statements Q9Offers Q9Executive_Remuneratio n Q9Financial_Inclusion_SM Ebanking Q9MeetCustomers_Needs Q9Social_Attachment Q9Confidentially Q9Valued_Customer_Reco gnition Q9Honest_Relationship .553 .444 .540 .393 .411 .370 .412 .525 .171 .186 .222 .141 .000 .000 .000 .000 .000 .000 .000 .000 .020 .000 .000 .011 .002 .001 .000 .001 .000 .000 .000 .000 .000 .000 .000 .000 .000 .000 .000 .000 .000 .000 .000 .014 .000 .000 .000 .000 .000 .000 .000 .000 .000 .000 .000 .000
  • 192.
    Correlation Matrixa Q9Social_Attac hment Q9Confidentiall y Q9Valued_Cust omer_Recogniti on Overall, Ithink that no ethical problems have occurred at my bank in the years following the Financial Crisis of 2007 I think that banks in general are likely to have learned the lesson in terms of navigating a balance between the pursuit of profit and operating in a socially responsible manner Has your confidence towards the banking industry changed in the past seven years? Sig. (1-tailed) Q9Borrowings_And_Saving s Q9Transparency Q9Financial_Statements Q9Offers Q9Executive_Remuneratio n Q9Financial_Inclusion_SM Ebanking Q9MeetCustomers_Needs Q9Social_Attachment Q9Confidentially Q9Valued_Customer_Reco gnition Q9Honest_Relationship .393 .388 .474 .544 .525 .364 .350 .452 .141 .253 .185 .225 .000 .000 .000 .000 .000 .000 .000 .000 .011 .000 .000 .000 .001 .000 .000 .000 .000 .000 .000 .000 .000 .000 .000 .000 .000 .000 .000 .000 .014 .000 .000 .014 .000 .000 .000 .000 .000 .000 .000 .000 .000 .000 .000 .000
  • 193.
    Correlation Matrixa Q9Honest_Rela tionship Q9Being_Acco untable Q9legal_Obliga tions Overall, Ithink that no ethical problems have occurred at my bank in the years following the Financial Crisis of 2007 I think that banks in general are likely to have learned the lesson in terms of navigating a balance between the pursuit of profit and operating in a socially responsible manner Has your confidence towards the banking industry changed in the past seven years? Sig. (1-tailed) Q9Borrowings_And_Saving s Q9Transparency Q9Financial_Statements Q9Offers Q9Executive_Remuneratio n Q9Financial_Inclusion_SM Ebanking Q9MeetCustomers_Needs Q9Social_Attachment Q9Confidentially Q9Valued_Customer_Reco gnition Q9Honest_Relationship .544 .561 .463 .442 .452 .545 .360 .409 .225 .193 .177 .208 .000 .000 .000 .000 .000 .000 .000 .000 .000 .000 .000 .000 .000 .000 .000 .002 .000 .000 .000 .000 .000 .000 .000 .001 .000 .000 .000 .000 .000 .000 .000 .000 .000 .000 .000 .000 .000 .000 .000 .000 .000 .000 .000 .000 .000 .000
  • 194.
    Correlation Matrixa Q9Combating_ Bribery Q9Giving_Back _To_Communit y Q9Financial_lit eracy Overall, Ithink that no ethical problems have occurred at my bank in the years following the Financial Crisis of 2007 I think that banks in general are likely to have learned the lesson in terms of navigating a balance between the pursuit of profit and operating in a socially responsible manner Has your confidence towards the banking industry changed in the past seven years? Sig. (1-tailed) Q9Borrowings_And_Saving s Q9Transparency Q9Financial_Statements Q9Offers Q9Executive_Remuneratio n Q9Financial_Inclusion_SM Ebanking Q9MeetCustomers_Needs Q9Social_Attachment Q9Confidentially Q9Valued_Customer_Reco gnition Q9Honest_Relationship .442 .526 .404 .327 .409 .421 .405 .472 .208 .241 .145 .192 .000 .000 .000 .000 .000 .000 .000 .001 .000 .020 .142 .029 .002 .001 .027 .054 .000 .000 .000 .000 .001 .000 .000 .000 .000 .000 .000 .000 .000 .000 .000 .000 .000 .000 .002 .000 .000 .000 .000 .000 .000 .000 .000 .000 .000 .000 .000 .000
  • 195.
    Correlation Matrixa Q9Environment ally_branches I thinkthat my bank's actual social activities and ethical behaviour comply with what they committed to in the media and other channels since the Financial Crisis of 2007 I feel that I am getting an economic value in my dealings with my bank (Good quality products that efficiently satisfy my needs and requirements) Overall, I think that no ethical problems have occurred at my bank in the years following the Financial Crisis of 2007 I think that banks in general are likely to have learned the lesson in terms of navigating a balance between the pursuit of profit and operating in a socially responsible manner Has your confidence towards the banking industry changed in the past seven years? Sig. (1-tailed) Q9Borrowings_And_Saving s Q9Transparency Q9Financial_Statements Q9Offers Q9Executive_Remuneratio n Q9Financial_Inclusion_SM Ebanking Q9MeetCustomers_Needs Q9Social_Attachment Q9Confidentially Q9Valued_Customer_Reco gnition Q9Honest_Relationship .327 .531 .424 .492 .472 .458 .430 .471 .192 .255 .140 .299 .000 .000 .000 .000 .001 .000 .000 .000 .029 .000 .000 .000 .054 .000 .000 .000 .000 .000 .000 .000 .000 .000 .000 .000 .000 .000 .000 .000 .000 .000 .000 .000 .000 .000 .000 .000 .000 .000 .000 .000 .000 .000 .000 .000 .000 .000 .000 .000
  • 196.
    Correlation Matrixa Q12Financial_S tability Q12Withdraw_ Money Q12Treated Overall,I think that no ethical problems have occurred at my bank in the years following the Financial Crisis of 2007 I think that banks in general are likely to have learned the lesson in terms of navigating a balance between the pursuit of profit and operating in a socially responsible manner Has your confidence towards the banking industry changed in the past seven years? Sig. (1-tailed) Q9Borrowings_And_Saving s Q9Transparency Q9Financial_Statements Q9Offers Q9Executive_Remuneratio n Q9Financial_Inclusion_SM Ebanking Q9MeetCustomers_Needs Q9Social_Attachment Q9Confidentially Q9Valued_Customer_Reco gnition Q9Honest_Relationship .492 .373 .478 .514 .471 .297 .509 .534 .299 .205 .290 .264 .000 .000 .000 .000 .000 .000 .000 .000 .000 .000 .000 .000 .000 .002 .000 .000 .000 .001 .000 .000 .000 .000 .000 .000 .000 .000 .000 .000 .000 .001 .000 .000 .000 .000 .000 .000 .000 .000 .000 .000 .000 .000 .000 .000 .000 .000 .000 .000
  • 197.
    Correlation Matrixa AQ12Advice_Q uality Q12Personal_I nformation_Saf e Q12Fees Q12Interest_Ra tes_Accounts Overall,I think that no ethical problems have occurred at my bank in the years following the Financial Crisis of 2007 I think that banks in general are likely to have learned the lesson in terms of navigating a balance between the pursuit of profit and operating in a socially responsible manner Has your confidence towards the banking industry changed in the past seven years? Sig. (1-tailed) Q9Borrowings_And_Saving s Q9Transparency Q9Financial_Statements Q9Offers Q9Executive_Remuneratio n Q9Financial_Inclusion_SM Ebanking Q9MeetCustomers_Needs Q9Social_Attachment Q9Confidentially Q9Valued_Customer_Reco gnition Q9Honest_Relationship .514 .334 .465 .460 .416 .534 .248 .375 .388 .330 .264 .171 .139 .126 .144 .000 .000 .000 .000 .000 .000 .000 .000 .000 .000 .000 .000 .000 .000 .000 .000 .006 .000 .000 .004 .000 .000 .000 .000 .000 .000 .002 .000 .000 .000 .000 .000 .000 .000 .000 .000 .006 .000 .000 .000 .000 .000 .000 .000 .000 .000 .000 .000 .000 .000 .000 .000 .000 .000 .000 .000 .000 .000 .000
  • 198.
    Correlation Matrixa Q12Interest_Ra tes_Loan Q12Open_Or_ Close_Branche s I thinkthe overall approach of my bank's social responsibility activities is aligned with customers’ needs and demands in the post financial crisis of 2007 Overall, I think that no ethical problems have occurred at my bank in the years following the Financial Crisis of 2007 I think that banks in general are likely to have learned the lesson in terms of navigating a balance between the pursuit of profit and operating in a socially responsible manner Has your confidence towards the banking industry changed in the past seven years? Sig. (1-tailed) Q9Borrowings_And_Saving s Q9Transparency Q9Financial_Statements Q9Offers Q9Executive_Remuneratio n Q9Financial_Inclusion_SM Ebanking Q9MeetCustomers_Needs Q9Social_Attachment Q9Confidentially Q9Valued_Customer_Reco gnition Q9Honest_Relationship .416 .473 .639 1.000 .330 .357 .413 .573 .144 .035 .110 .158 .000 .000 .000 .000 .000 .000 .000 .000 .000 .000 .000 .000 .004 .000 .000 .000 .000 .000 .000 .000 .000 .000 .000 .000 .000 .000 .000 .000 .000 .000 .000 .000 .000 .000 .000 .000 .000 .000 .000 .000 .000 .000 .000 .000 .000 .000 .000 .000
  • 199.
    Correlation Matrixa Overall, Ithink that no ethical problems have occurred at my bank in the years following the Financial Crisis of 2007 I think that banks in general are likely to have learned the lesson in terms of navigating a balance between the pursuit of profit and operating in a socially responsible manner Has your confidence towards the banking industry changed in the past seven years? Overall, I think that no ethical problems have occurred at my bank in the years following the Financial Crisis of 2007 I think that banks in general are likely to have learned the lesson in terms of navigating a balance between the pursuit of profit and operating in a socially responsible manner Has your confidence towards the banking industry changed in the past seven years? Sig. (1-tailed) Q9Borrowings_And_Saving s Q9Transparency Q9Financial_Statements Q9Offers Q9Executive_Remuneratio n Q9Financial_Inclusion_SM Ebanking Q9MeetCustomers_Needs Q9Social_Attachment Q9Confidentially Q9Valued_Customer_Reco gnition Q9Honest_Relationship 1.000 .573 .158 .573 1.000 .339 .158 .339 1.000 .000 .000 .009 .000 .000 .005 .000 .000 .018 .000 .000 .048 .000 .000 .051 .000 .000 .038 .000 .000 .017 .000 .000 .090 .000 .000 .007 .000 .000 .038 .000 .000 .015 .000 .000 .033 Page 66
  • 200.
    Correlation Matrixa Q9Borrowings_ And_Savings Q9Transparenc y Q9Financial_St atements Q9Offers Sig.(1-tailed) Q9Being_Accountable Q9legal_Obligations Q9Combating_Bribery Q9Giving_Back_To_Comm unity Q9Financial_literacy Q9Environmentally_branch es I think that my bank's actual social activities and ethical behaviour comply with what they committed to in the media and other channels since the Financial Crisis of 2007 I feel that I am getting an economic value in my dealings with my bank (Good quality products that efficiently satisfy my needs and requirements) Q12Financial_Stability Q12Withdraw_Money Q12Treated AQ12Advice_Quality Q12Personal_Information_ Safe Q12Fees Q12Interest_Rates_Accoun ts Q12Interest_Rates_Loan .000 .000 .000 .000 .000 .000 .000 .000 .000 .000 .000 .000 .000 .002 .000 .000 .000 .020 .001 .000 .000 .000 .142 .027 .000 .000 .001 .029 .054 .000 .000 .000 .000 .000 .000 .000 .000 .000 .000 .000 .000 .000 .000 .000 .000 .000 .000 .000 .002 .001 .000 .000 .000 .000 .000 .000 .000 .000 .000 .000 .000 .000 .000 .006 .000 .000 .000 .000 .000 .000 .000 .000 .000 .000 .000 .000 .000 .000 .004 .000 .000 .000 .000 .000 .000
  • 201.
    Correlation Matrixa Q9Executive_R emuneration Q9Financial_In clusion_SMEba nking Q9MeetCustom ers_Needs Sig. (1-tailed) Q9Being_Accountable Q9legal_Obligations Q9Combating_Bribery Q9Giving_Back_To_Comm unity Q9Financial_literacy Q9Environmentally_branch es Ithink that my bank's actual social activities and ethical behaviour comply with what they committed to in the media and other channels since the Financial Crisis of 2007 I feel that I am getting an economic value in my dealings with my bank (Good quality products that efficiently satisfy my needs and requirements) Q12Financial_Stability Q12Withdraw_Money Q12Treated AQ12Advice_Quality Q12Personal_Information_ Safe Q12Fees Q12Interest_Rates_Accoun ts Q12Interest_Rates_Loan .000 .000 .000 .000 .000 .000 .000 .000 .000 .001 .000 .000 .000 .000 .000 .000 .000 .000 .000 .000 .000 .000 .000 .000 .000 .000 .000 .000 .000 .000 .000 .000 .000 .000 .000 .000 .001 .000 .000 .001 .000 .000 .000 .000 .000 .000 .000 .000 .000 .002 .000 .006 .000 .000 .000 .000 .000 .000 .000 .000 .000 .000 .000 .000 .000 .000 .000 .000
  • 202.
    Correlation Matrixa Q9Social_Attac hment Q9Confidentiall y Q9Valued_Cust omer_Recogniti on Sig. (1-tailed) Q9Being_Accountable Q9legal_Obligations Q9Combating_Bribery Q9Giving_Back_To_Comm unity Q9Financial_literacy Q9Environmentally_branch es Ithink that my bank's actual social activities and ethical behaviour comply with what they committed to in the media and other channels since the Financial Crisis of 2007 I feel that I am getting an economic value in my dealings with my bank (Good quality products that efficiently satisfy my needs and requirements) Q12Financial_Stability Q12Withdraw_Money Q12Treated AQ12Advice_Quality Q12Personal_Information_ Safe Q12Fees Q12Interest_Rates_Accoun ts Q12Interest_Rates_Loan .000 .000 .000 .000 .000 .000 .000 .000 .000 .000 .000 .000 .000 .000 .000 .000 .000 .002 .000 .000 .000 .000 .000 .000 .000 .000 .000 .000 .000 .000 .000 .000 .000 .000 .000 .000 .001 .000 .000 .000 .000 .000 .000 .000 .000 .000 .000 .000 .006 .000 .000 .000 .000 .000 .000 .000 .000 .000 .000 .000 .000 .000 .000 .000 .000 .000 .000 .000
  • 203.
    Correlation Matrixa Q9Honest_Rela tionship Q9Being_Acco untable Q9legal_Obliga tions Sig. (1-tailed) Q9Being_Accountable Q9legal_Obligations Q9Combating_Bribery Q9Giving_Back_To_Comm unity Q9Financial_literacy Q9Environmentally_branch es Ithink that my bank's actual social activities and ethical behaviour comply with what they committed to in the media and other channels since the Financial Crisis of 2007 I feel that I am getting an economic value in my dealings with my bank (Good quality products that efficiently satisfy my needs and requirements) Q12Financial_Stability Q12Withdraw_Money Q12Treated AQ12Advice_Quality Q12Personal_Information_ Safe Q12Fees Q12Interest_Rates_Accoun ts Q12Interest_Rates_Loan .000 .000 .000 .000 .000 .000 .000 .000 .000 .000 .000 .000 .000 .000 .000 .001 .001 .000 .000 .001 .000 .000 .000 .000 .000 .000 .000 .000 .001 .000 .000 .000 .000 .000 .000 .000 .000 .000 .000 .000 .000 .000 .000 .000 .000 .000 .000 .000 .000 .000 .000 .000 .001 .000 .000 .000 .000 .000 .000 .000 .000 .000 .000 .000 .004
  • 204.
    Correlation Matrixa Q9Combating_ Bribery Q9Giving_Back _To_Communit y Q9Financial_lit eracy Sig. (1-tailed) Q9Being_Accountable Q9legal_Obligations Q9Combating_Bribery Q9Giving_Back_To_Comm unity Q9Financial_literacy Q9Environmentally_branch es Ithink that my bank's actual social activities and ethical behaviour comply with what they committed to in the media and other channels since the Financial Crisis of 2007 I feel that I am getting an economic value in my dealings with my bank (Good quality products that efficiently satisfy my needs and requirements) Q12Financial_Stability Q12Withdraw_Money Q12Treated AQ12Advice_Quality Q12Personal_Information_ Safe Q12Fees Q12Interest_Rates_Accoun ts Q12Interest_Rates_Loan .000 .000 .000 .000 .000 .000 .001 .001 .000 .001 .000 .000 .000 .000 .001 .000 .000 .000 .000 .000 .000 .000 .000 .000 .001 .000 .000 .000 .000 .000 .000 .000 .000 .000 .000 .000 .000 .000 .000 .000 .000 .000 .000 .000 .000 .001 .012 .000 .001 .000 .000 .000 .000 .000 .001 .000 .000 .000 .001 .000 .004 .000 .003 .000
  • 205.
    Correlation Matrixa Q9Environment ally_branches I thinkthat my bank's actual social activities and ethical behaviour comply with what they committed to in the media and other channels since the Financial Crisis of 2007 I feel that I am getting an economic value in my dealings with my bank (Good quality products that efficiently satisfy my needs and requirements) Sig. (1-tailed) Q9Being_Accountable Q9legal_Obligations Q9Combating_Bribery Q9Giving_Back_To_Comm unity Q9Financial_literacy Q9Environmentally_branch es I think that my bank's actual social activities and ethical behaviour comply with what they committed to in the media and other channels since the Financial Crisis of 2007 I feel that I am getting an economic value in my dealings with my bank (Good quality products that efficiently satisfy my needs and requirements) Q12Financial_Stability Q12Withdraw_Money Q12Treated AQ12Advice_Quality Q12Personal_Information_ Safe Q12Fees Q12Interest_Rates_Accoun ts Q12Interest_Rates_Loan .000 .000 .000 .000 .001 .000 .000 .000 .000 .000 .001 .000 .000 .000 .000 .000 .000 .000 .000 .000 .000 .000 .000 .000 .000 .000 .000 .000 .000 .000 .000 .000 .000 .000 .000 .000 .000 .000 .000 .000 .000 .000 .000 .000 .000 .000 .000 .000 .000 .000 .000 .000 .000 .000 .000 .000 .000 .000 .000 .000 .000 .000 .000 .000
  • 206.
    Correlation Matrixa Q12Financial_S tability Q12Withdraw_ Money Q12Treated Sig.(1-tailed) Q9Being_Accountable Q9legal_Obligations Q9Combating_Bribery Q9Giving_Back_To_Comm unity Q9Financial_literacy Q9Environmentally_branch es I think that my bank's actual social activities and ethical behaviour comply with what they committed to in the media and other channels since the Financial Crisis of 2007 I feel that I am getting an economic value in my dealings with my bank (Good quality products that efficiently satisfy my needs and requirements) Q12Financial_Stability Q12Withdraw_Money Q12Treated AQ12Advice_Quality Q12Personal_Information_ Safe Q12Fees Q12Interest_Rates_Accoun ts Q12Interest_Rates_Loan .000 .000 .000 .000 .000 .000 .000 .000 .000 .000 .000 .000 .000 .000 .000 .000 .000 .000 .000 .000 .000 .000 .000 .000 .000 .000 .000 .000 .000 .000 .000 .000 .000 .000 .000 .000 .000 .000 .000 .000 .000 .000 .000 .000 .000 .000 .000 .000 .000 .000 .000 .000 .000 .000 .000 .000 .000 .000 .000 .000 .000 .000 .000 .000
  • 207.
    Correlation Matrixa AQ12Advice_Q uality Q12Personal_I nformation_Saf e Q12Fees Q12Interest_Ra tes_Accounts Sig.(1-tailed) Q9Being_Accountable Q9legal_Obligations Q9Combating_Bribery Q9Giving_Back_To_Comm unity Q9Financial_literacy Q9Environmentally_branch es I think that my bank's actual social activities and ethical behaviour comply with what they committed to in the media and other channels since the Financial Crisis of 2007 I feel that I am getting an economic value in my dealings with my bank (Good quality products that efficiently satisfy my needs and requirements) Q12Financial_Stability Q12Withdraw_Money Q12Treated AQ12Advice_Quality Q12Personal_Information_ Safe Q12Fees Q12Interest_Rates_Accoun ts Q12Interest_Rates_Loan .000 .000 .000 .000 .000 .000 .000 .000 .000 .000 .000 .000 .001 .000 .000 .000 .001 .000 .000 .000 .000 .012 .000 .001 .001 .000 .000 .000 .000 .000 .000 .000 .000 .000 .000 .000 .000 .000 .000 .000 .000 .000 .000 .000 .000 .000 .000 .000 .000 .000 .000 .000 .000 .000 .000 .000 .000 .000 .000 .000 .000 .000 .000 .000 .000 .000 .000 .000 .000 .000 .000 .000 .000 .000 .000 .000 .000 .000 .000 .000
  • 208.
    Correlation Matrixa Q12Interest_Ra tes_Loan Q12Open_Or_ Close_Branche s I thinkthe overall approach of my bank's social responsibility activities is aligned with customers’ needs and demands in the post financial crisis of 2007 Sig. (1-tailed) Q9Being_Accountable Q9legal_Obligations Q9Combating_Bribery Q9Giving_Back_To_Comm unity Q9Financial_literacy Q9Environmentally_branch es I think that my bank's actual social activities and ethical behaviour comply with what they committed to in the media and other channels since the Financial Crisis of 2007 I feel that I am getting an economic value in my dealings with my bank (Good quality products that efficiently satisfy my needs and requirements) Q12Financial_Stability Q12Withdraw_Money Q12Treated AQ12Advice_Quality Q12Personal_Information_ Safe Q12Fees Q12Interest_Rates_Accoun ts Q12Interest_Rates_Loan .000 .000 .000 .000 .000 .000 .000 .000 .000 .004 .000 .000 .000 .000 .000 .000 .001 .003 .000 .000 .000 .000 .000 .001 .000 .000 .000 .000 .000 .000 .000 .000 .000 .000 .000 .000 .000 .000 .000 .000 .000 .000 .000 .000 .000 .000 .000 .000 .000 .000 .002 .001 .000 .000 .000 .000 .000 .000 .000 .000 .000 .000 .000 .000 .000 .000
  • 209.
    Correlation Matrixa Overall, Ithink that no ethical problems have occurred at my bank in the years following the Financial Crisis of 2007 I think that banks in general are likely to have learned the lesson in terms of navigating a balance between the pursuit of profit and operating in a socially responsible manner Has your confidence towards the banking industry changed in the past seven years? Sig. (1-tailed) Q9Being_Accountable Q9legal_Obligations Q9Combating_Bribery Q9Giving_Back_To_Comm unity Q9Financial_literacy Q9Environmentally_branch es I think that my bank's actual social activities and ethical behaviour comply with what they committed to in the media and other channels since the Financial Crisis of 2007 I feel that I am getting an economic value in my dealings with my bank (Good quality products that efficiently satisfy my needs and requirements) Q12Financial_Stability Q12Withdraw_Money Q12Treated AQ12Advice_Quality Q12Personal_Information_ Safe Q12Fees Q12Interest_Rates_Accoun ts Q12Interest_Rates_Loan .000 .000 .033 .000 .000 .046 .000 .000 .023 .000 .000 .010 .000 .000 .084 .001 .000 .033 .000 .000 .007 .000 .000 .092 .000 .000 .002 .000 .002 .025 .000 .000 .002 .000 .000 .005 .001 .009 .051 .000 .000 .093 .000 .000 .115 .000 .001 .086 .000 .000 .370
  • 210.
    Correlation Matrixa Q9Borrowings_ And_Savings Q9Transparenc y Q9Financial_St atements Q9Offers Q12Open_Or_Close_Branc hes Ithink the overall approach of my bank's social responsibility activities is aligned with customers’ needs and demands in the post financial crisis of 2007 Overall, I think that no ethical problems have occurred at my bank in the years following the Financial Crisis of 2007 I think that banks in general are likely to have learned the lesson in terms of navigating a balance between the pursuit of profit and operating in a socially responsible manner Has your confidence towards the banking industry changed in the past seven years? .000 .000 .000 .000 .000 .000 .000 .000 .000 .000 .000 .000 .000 .000 .000 .000 .000 .000 .000 .000 .009 .005 .018 .048 .051
  • 211.
    Correlation Matrixa Q9Executive_R emuneration Q9Financial_In clusion_SMEba nking Q9MeetCustom ers_Needs Q12Open_Or_Close_Branc hes I thinkthe overall approach of my bank's social responsibility activities is aligned with customers’ needs and demands in the post financial crisis of 2007 Overall, I think that no ethical problems have occurred at my bank in the years following the Financial Crisis of 2007 I think that banks in general are likely to have learned the lesson in terms of navigating a balance between the pursuit of profit and operating in a socially responsible manner Has your confidence towards the banking industry changed in the past seven years? .000 .000 .000 .000 .000 .000 .000 .000 .000 .000 .000 .000 .000 .000 .000 .000 .051 .038 .017 .090
  • 212.
    Correlation Matrixa Q9Social_Attac hment Q9Confidentiall y Q9Valued_Cust omer_Recogniti on Q12Open_Or_Close_Branc hes I thinkthe overall approach of my bank's social responsibility activities is aligned with customers’ needs and demands in the post financial crisis of 2007 Overall, I think that no ethical problems have occurred at my bank in the years following the Financial Crisis of 2007 I think that banks in general are likely to have learned the lesson in terms of navigating a balance between the pursuit of profit and operating in a socially responsible manner Has your confidence towards the banking industry changed in the past seven years? .000 .000 .000 .000 .000 .000 .000 .000 .000 .000 .000 .000 .000 .000 .000 .000 .090 .007 .038 .015
  • 213.
    Correlation Matrixa Q9Honest_Rela tionship Q9Being_Acco untable Q9legal_Obliga tions Q12Open_Or_Close_Branc hes I thinkthe overall approach of my bank's social responsibility activities is aligned with customers’ needs and demands in the post financial crisis of 2007 Overall, I think that no ethical problems have occurred at my bank in the years following the Financial Crisis of 2007 I think that banks in general are likely to have learned the lesson in terms of navigating a balance between the pursuit of profit and operating in a socially responsible manner Has your confidence towards the banking industry changed in the past seven years? .000 .000 .000 .004 .000 .000 .000 .000 .000 .000 .000 .000 .000 .000 .000 .000 .015 .033 .046 .023
  • 214.
    Correlation Matrixa Q9Combating_ Bribery Q9Giving_Back _To_Communit y Q9Financial_lit eracy Q12Open_Or_Close_Branc hes I thinkthe overall approach of my bank's social responsibility activities is aligned with customers’ needs and demands in the post financial crisis of 2007 Overall, I think that no ethical problems have occurred at my bank in the years following the Financial Crisis of 2007 I think that banks in general are likely to have learned the lesson in terms of navigating a balance between the pursuit of profit and operating in a socially responsible manner Has your confidence towards the banking industry changed in the past seven years? .004 .000 .003 .000 .000 .000 .000 .000 .000 .000 .000 .001 .000 .000 .000 .000 .023 .010 .084 .033
  • 215.
    Correlation Matrixa Q9Environment ally_branches I thinkthat my bank's actual social activities and ethical behaviour comply with what they committed to in the media and other channels since the Financial Crisis of 2007 I feel that I am getting an economic value in my dealings with my bank (Good quality products that efficiently satisfy my needs and requirements) Q12Open_Or_Close_Branc hes I think the overall approach of my bank's social responsibility activities is aligned with customers’ needs and demands in the post financial crisis of 2007 Overall, I think that no ethical problems have occurred at my bank in the years following the Financial Crisis of 2007 I think that banks in general are likely to have learned the lesson in terms of navigating a balance between the pursuit of profit and operating in a socially responsible manner Has your confidence towards the banking industry changed in the past seven years? .000 .000 .000 .000 .000 .000 .000 .000 .001 .000 .000 .000 .000 .000 .000 .000 .033 .007 .092 .002
  • 216.
    Correlation Matrixa Q12Financial_S tability Q12Withdraw_ Money Q12Treated Q12Open_Or_Close_Branc hes Ithink the overall approach of my bank's social responsibility activities is aligned with customers’ needs and demands in the post financial crisis of 2007 Overall, I think that no ethical problems have occurred at my bank in the years following the Financial Crisis of 2007 I think that banks in general are likely to have learned the lesson in terms of navigating a balance between the pursuit of profit and operating in a socially responsible manner Has your confidence towards the banking industry changed in the past seven years? .000 .000 .000 .000 .000 .000 .000 .000 .000 .000 .000 .000 .000 .002 .000 .000 .002 .025 .002 .005
  • 217.
    Correlation Matrixa AQ12Advice_Q uality Q12Personal_I nformation_Saf e Q12Fees Q12Interest_Ra tes_Accounts Q12Open_Or_Close_Branc hes Ithink the overall approach of my bank's social responsibility activities is aligned with customers’ needs and demands in the post financial crisis of 2007 Overall, I think that no ethical problems have occurred at my bank in the years following the Financial Crisis of 2007 I think that banks in general are likely to have learned the lesson in terms of navigating a balance between the pursuit of profit and operating in a socially responsible manner Has your confidence towards the banking industry changed in the past seven years? .000 .000 .000 .000 .000 .000 .002 .000 .000 .000 .000 .001 .000 .000 .000 .000 .009 .000 .000 .001 .005 .051 .093 .115 .086
  • 218.
    Correlation Matrixa Q12Interest_Ra tes_Loan Q12Open_Or_ Close_Branche s I thinkthe overall approach of my bank's social responsibility activities is aligned with customers’ needs and demands in the post financial crisis of 2007 Q12Open_Or_Close_Branc hes I think the overall approach of my bank's social responsibility activities is aligned with customers’ needs and demands in the post financial crisis of 2007 Overall, I think that no ethical problems have occurred at my bank in the years following the Financial Crisis of 2007 I think that banks in general are likely to have learned the lesson in terms of navigating a balance between the pursuit of profit and operating in a socially responsible manner Has your confidence towards the banking industry changed in the past seven years? .000 .000 .000 .000 .000 .000 .000 .000 .000 .001 .000 .000 .000 .086 .370 .147 .066
  • 219.
    Correlation Matrixa Overall, Ithink that no ethical problems have occurred at my bank in the years following the Financial Crisis of 2007 I think that banks in general are likely to have learned the lesson in terms of navigating a balance between the pursuit of profit and operating in a socially responsible manner Has your confidence towards the banking industry changed in the past seven years? Q12Open_Or_Close_Branc hes I think the overall approach of my bank's social responsibility activities is aligned with customers’ needs and demands in the post financial crisis of 2007 Overall, I think that no ethical problems have occurred at my bank in the years following the Financial Crisis of 2007 I think that banks in general are likely to have learned the lesson in terms of navigating a balance between the pursuit of profit and operating in a socially responsible manner Has your confidence towards the banking industry changed in the past seven years? .000 .000 .370 .000 .000 .147 .000 .066 .000 .000 .066 .000 Determinant = 3.25E-013a. KMO and Bartlett's Test Kaiser-Meyer-Olkin Measure of Sampling Adequacy. Bartlett's Test of Sphericity Approx. Chi-Square df Sig. .900 2285.941 496 .000
  • 220.
    Communalities Initial Extraction Q9Borrowings_And_Savings Q9Transparency Q9Financial_Statements Q9Offers Q9Executive_Remuneration Q9Financial_Inclusion_SMEbanking Q9MeetCustomers_Needs Q9Social_Attachment Q9Confidentially Q9Valued_Customer_Recognition Q9Honest_Relationship Q9Being_Accountable Q9legal_Obligations Q9Combating_Bribery Q9Giving_Back_To_Community Q9Financial_literacy Q9Environmentally_branches Q10 Q11 Q12Financial_Stability Q12Withdraw_Money Q12Treated AQ12Advice_Quality Q12Personal_Information_Safe Q12Fees Q12Interest_Rates_Accounts Q12Interest_Rates_Loan Q12Open_Or_Close_Branches Q13 Q14 Q17 Q18 1.000 .569 1.000.593 1.000 .572 1.000 .346 1.000 .576 1.000 .460 1.000 .586 1.000 .616 1.000 .445 1.000 .527 1.000 .624 1.000 .638 1.000 .501 1.000 .401 1.000 .652 1.000 .649 1.000 .465 1.000 .665 1.000 .578 1.000 .601 1.000 .486 1.000 .680 1.000 .616 1.000 .380 1.000 .719 1.000 .652 1.000 .567 1.000 .513 1.000 .599 1.000 .490 1.000 .429 1.000 .091 Extraction Method: Principal Component Analysis.
  • 221.
    Total Variance Explained Component InitialEigenvalues Extraction Sums of Squared Loadings Total % of Variance Cumulative % Total % of Variance Cumulative % 1 2 3 4 5 6 7 8 9 10 11 12 13 14 15 16 17 18 19 20 21 22 23 24 25 26 27 28 29 30 31 32 15.449 48.279 48.279 15.449 48.279 48.279 13.962 1.838 5.743 54.022 1.838 5.743 54.022 11.766 1.583 4.945 58.967 1.209 3.778 62.745 1.140 3.562 66.307 1.096 3.426 69.733 .897 2.804 72.537 .780 2.438 74.974 .708 2.214 77.188 .696 2.175 79.363 .683 2.134 81.498 .633 1.978 83.476 .623 1.948 85.423 .537 1.678 87.101 .496 1.549 88.650 .473 1.479 90.129 .441 1.377 91.506 .375 1.173 92.678 .324 1.012 93.690 .303 .946 94.637 .246 .767 95.404 .229 .717 96.121 .210 .655 96.776 .174 .543 97.319 .159 .498 97.817 .146 .455 98.272 .125 .392 98.664 .113 .352 99.015 .089 .278 99.294 .084 .262 99.556 .075 .236 99.792 .067 .208 100.000
  • 222.
    Total Variance Explained Component RotationSums of Squared Loadingsa Total 1 2 3 4 5 6 7 8 9 10 11 12 13 14 15 16 17 18 19 20 21 22 23 24 25 26 27 28 29 30 31 32 13.962 11.766 Extraction Method: Principal Component Analysis. When components are correlated, sums of squared loadings cannot be added to obtain a total variance.a.
  • 223.
    Pattern Matrixa Component 1 2 Q9Financial_Statements Q12Fees Q12Interest_Rates_Accounts Q12Interest_Rates_Loan Q12Open_Or_Close_Branches Q9Transparency Q12Treated Q12Withdraw_Money Q12Personal_Information_Safe Q12Financial_Stability Q9legal_Obligations Q10 Q9Honest_Relationship Q9Borrowings_And_Savings Q9Offers Q9Confidentially Q11 AQ12Advice_Quality Q9MeetCustomers_Needs Q9Financial_literacy Q9Giving_Back_To_Community Q9Social_Attachment Q9Executive_Remuneration Q9Environmentally_branches Q13 Q9Being_Accountable Q17 Q9Valued_Customer_Recognition Q9Financial_Inclusion_SMEbanking Q14 Q9Combating_Bribery Q18 .904 .883 .858 .740 .734 .687 .686 .684 .647 .627 .616 .613 .612 .589 .572 .568 .566 .520 .465 .915 .822 .806 .717 .638 .557 .527 .498 .498 .461 .452 .444 ExtractionMethod: Principal Component Analysis. Rotation Method: Oblimin with Kaiser Normalization.a Rotation converged in 10 iterations.a.
  • 224.
    Component Correlation Matrix Component1 2 1 2 1.000 .634 .634 1.000 Extraction Method: Principal Component Analysis. Rotation Method: Oblimin with Kaiser Normalization.
  • 225.
    Appendix G -Research Objective One - Factor and Reliability Analyses KMO and Bartlett's Test Kaiser-Meyer-Olkin Measure of Sampling Adequacy. Bartlett's Test of Sphericity Approx. Chi-Square df Sig. .896 2331.783 528 .000 Communalities Initial Extraction Q9Borrowings_And_Savings Q9Transparency Q9Financial_Statements Q9Offers Q9Executive_Remuneration Q9Financial_Inclusion_SMEbanking Q9MeetCustomers_Needs Q9Social_Attachment Q9Confidentially Q9Valued_Customer_Recognition Q9Honest_Relationship Q9Being_Accountable Q9legal_Obligations Q9Combating_Bribery Q9Giving_Back_To_Community Q9Financial_literacy Q9Environmentally_branches Q10 Q11 Q12Financial_Stability Q12Withdraw_Money Q12Treated AQ12Advice_Quality Q12Personal_Information_Safe Q12Fees Q12Interest_Rates_Accounts Q12Interest_Rates_Loan Q12Open_Or_Close_Branches Q13 1.000 .695 1.000 .681 1.000 .693 1.000 .598 1.000 .704 1.000 .541 1.000 .701 1.000 .774 1.000 .653 1.000 .776 1.000 .742 1.000 .727 1.000 .690 1.000 .641 1.000 .705 1.000 .693 1.000 .701 1.000 .739 1.000 .762 1.000 .631 1.000 .634 1.000 .843 1.000 .728 1.000 .533 1.000 .848 1.000 .723 1.000 .755 1.000 .661 1.000 .690 1.000 .554
  • 226.
    Communalities Initial Extraction Q14 Q16 Q17 Q18 1.000 .554 1.000.717 1.000 .672 1.000 .583 Extraction Method: Principal Component Analysis. Total Variance Explained Component Initial Eigenvalues Extraction Sums of Squared Loadings Total % of Variance Cumulative % Total % of Variance Cumulative % 1 2 3 4 5 6 7 8 9 10 11 12 13 14 15 16 17 18 19 20 21 22 23 24 25 26 27 28 29 15.465 46.863 46.863 15.465 46.863 46.863 2.022 6.127 52.990 2.022 6.127 52.990 1.610 4.877 57.867 1.610 4.877 57.867 1.371 4.154 62.021 1.371 4.154 62.021 1.194 3.618 65.640 1.194 3.618 65.640 1.124 3.407 69.047 1.124 3.407 69.047 .911 2.759 71.806 .792 2.400 74.206 .774 2.346 76.552 .708 2.145 78.697 .683 2.070 80.767 .665 2.016 82.783 .629 1.905 84.689 .539 1.634 86.322 .531 1.610 87.932 .485 1.471 89.403 .441 1.336 90.739 .436 1.322 92.061 .338 1.024 93.085 .317 .962 94.047 .297 .899 94.946 .234 .708 95.655 .223 .677 96.331 .198 .599 96.931 .170 .516 97.447 .158 .478 97.925 .144 .436 98.360 .125 .378 98.738 .110 .333 99.071 .088 .267 99.338
  • 227.
    Total Variance Explained Component InitialEigenvalues Extraction Sums of Squared Loadings Total % of Variance Cumulative % Total % of Variance Cumulative % 30 31 32 33 .088 .267 99.338 .084 .253 99.591 .073 .222 99.814 .061 .186 100.000 Extraction Method: Principal Component Analysis. Component Number 333231302928272625242322212019181716151413121110987654321 Eigenvalue 20 15 10 5 0 Scree Plot Appendix G - Research Objective One - Factor and Reliability Analyses
  • 228.
    Communalities Initial Extraction Q9Borrowings_And_Savings Q9Transparency Q9Financial_Statements Q9Offers Q9Executive_Remuneration Q9Financial_Inclusion_SMEbanking Q9MeetCustomers_Needs Q9Social_Attachment Q9Confidentially Q9Valued_Customer_Recognition Q9Honest_Relationship Q9Being_Accountable Q9legal_Obligations Q9Combating_Bribery Q9Giving_Back_To_Community Q9Financial_literacy Q9Environmentally_branches Q10 Q11 Q12Financial_Stability Q12Withdraw_Money Q12Treated AQ12Advice_Quality Q12Personal_Information_Safe Q12Fees Q12Interest_Rates_Accounts Q12Interest_Rates_Loan Q12Open_Or_Close_Branches Q13 Q14 Q15 Q16 Q17 Q18 1.000 .572 1.000.623 1.000 .569 1.000 .322 1.000 .630 1.000 .532 1.000 .585 1.000 .638 1.000 .620 1.000 .591 1.000 .642 1.000 .698 1.000 .524 1.000 .573 1.000 .633 1.000 .619 1.000 .419 1.000 .711 1.000 .643 1.000 .608 1.000 .550 1.000 .683 1.000 .621 1.000 .397 1.000 .816 1.000 .675 1.000 .634 1.000 .597 1.000 .693 1.000 .507 1.000 .676 1.000 .434 1.000 .431 1.000 .269 Extraction Method: Principal Component Analysis.
  • 229.
    Total Variance Explained Component InitialEigenvalues Extraction Sums of Squared Loadings Total % of Variance Cumulative % Total % of Variance Cumulative % 1 2 3 4 5 6 7 8 9 10 11 12 13 14 15 16 17 18 19 20 21 22 23 24 25 26 27 28 29 30 31 32 33 34 16.058 47.228 47.228 16.058 47.228 47.228 14.311 2.027 5.961 53.190 2.027 5.961 53.190 3.280 1.652 4.859 58.049 1.652 4.859 58.049 11.658 1.382 4.063 62.112 1.250 3.676 65.788 1.129 3.321 69.110 .914 2.688 71.798 .851 2.503 74.301 .774 2.277 76.578 .708 2.083 78.661 .684 2.010 80.671 .665 1.957 82.628 .629 1.849 84.477 .540 1.587 86.065 .534 1.572 87.637 .498 1.464 89.100 .459 1.351 90.451 .438 1.287 91.738 .338 .995 92.733 .320 .942 93.675 .298 .877 94.552 .246 .725 95.276 .228 .671 95.948 .201 .591 96.538 .195 .575 97.113 .170 .501 97.614 .156 .457 98.071 .135 .396 98.467 .115 .338 98.805 .109 .319 99.124 .087 .256 99.380 .080 .234 99.614 .071 .209 99.823 .060 .177 100.000
  • 230.
    Total Variance Explained Component RotationSums of Squared Loadingsa Total 1 2 3 4 5 6 7 8 9 10 11 12 13 14 15 16 17 18 19 20 21 22 23 24 25 26 27 28 29 30 31 32 33 34 14.311 3.280 11.658 Extraction Method: Principal Component Analysis. When components are correlated, sums of squared loadings cannot be added to obtain a total variance.a.
  • 231.
    Pattern Matrixa Component 1 23 Q12Fees Q12Open_Or_Close_Branches Q12Interest_Rates_Accounts Q12Interest_Rates_Loan Q10 Q11 Q9Transparency Q15 Q9Financial_Statements Q13 Q9Borrowings_And_Savings Q12Treated Q9Financial_Inclusion_SMEbanking Q12Financial_Stability Q9Offers AQ12Advice_Quality Q9MeetCustomers_Needs Q12Withdraw_Money Q14 Q12Personal_Information_Safe Q16 Q9Financial_literacy Q9Social_Attachment Q9Executive_Remuneration Q9Combating_Bribery Q9Confidentially Q9Being_Accountable Q9Giving_Back_To_Community Q9Valued_Customer_Recognition Q18 Q9Honest_Relationship Q17 Q9Environmentally_branches Q9legal_Obligations .997 .860 .859 .858 .756 .751 .743 .723 .605 .568 -.418 .566 .546 .542 .536 .461 .456 .403 .441 .431 .631 -.580 -.532 -.494 .402 .789 .708 .666 .659 .630 .568 .507 .474 .473 .454 Extraction Method: Principal Component Analysis. Rotation Method: Oblimin with Kaiser Normalization.a Rotation converged in 12 iterations.a.
  • 232.
    Component Correlation Matrix Component1 2 3 1 2 3 1.000 -.191 .615 -.191 1.000 -.117 .615 -.117 1.000 Extraction Method: Principal Component Analysis. Rotation Method: Oblimin with Kaiser Normalization. Appendix G - Research Objective One - Factor and Reliability Analyses Reliability Statistics Cronbach's Alpha Cronbach's Alpha Based on Standardized Items N of Items .532 .545 4 Inter-Item Correlation Matrix Q16 Q9Financial_lit eracy Q9Social_Attac hment Q9Executive_R emuneration Q16 Q9Financial_literacy Q9Social_Attachment Q9Executive_Remuneration 1.000 -.095 -.028 -.217 -.095 1.000 .645 .538 -.028 .645 1.000 .537 -.217 .538 .537 1.000 Item-Total Statistics Scale Mean if Item Deleted Scale Variance if Item Deleted Corrected Item- Total Correlation Squared Multiple Correlation Q16 Q9Financial_literacy Q9Social_Attachment Q9Executive_Remuneration 7.99 4.846 -.132 .059 .802 9.17 2.783 .566 .468 .232 9.13 2.598 .611 .473 .173 9.09 3.179 .418 .383 .376
  • 233.
    Item-Total Statistics Cronbach's Alpha ifItem Deleted Q16 Q9Financial_literacy Q9Social_Attachment Q9Executive_Remuneration .802 .232 .173 .376 Appendix G - Research Objective One - Factor and Reliability Analyses Communalities Initial Extraction Q9Borrowings_And_Savings Q9Transparency Q9Financial_Statements Q9Offers Q9Executive_Remuneration Q9Financial_Inclusion_SMEbanking Q9MeetCustomers_Needs Q9Social_Attachment Q9Confidentially Q9Valued_Customer_Recognition Q9Honest_Relationship Q9Being_Accountable Q9legal_Obligations Q9Combating_Bribery Q9Giving_Back_To_Community Q9Financial_literacy Q9Environmentally_branches Q10 Q11 Q12Financial_Stability Q12Withdraw_Money Q12Treated AQ12Advice_Quality Q12Personal_Information_Safe Q12Fees Q12Interest_Rates_Accounts Q12Interest_Rates_Loan 1.000 .570 1.000 .599 1.000 .576 1.000 .346 1.000 .578 1.000 .467 1.000 .584 1.000 .625 1.000 .438 1.000 .520 1.000 .622 1.000 .635 1.000 .503 1.000 .392 1.000 .642 1.000 .651 1.000 .453 1.000 .668 1.000 .580 1.000 .597 1.000 .481 1.000 .674 1.000 .616 1.000 .376 1.000 .721 1.000 .649 1.000 .560 1.000 .516
  • 234.
    Communalities Initial Extraction Q12Open_Or_Close_Branches Q13 Q14 Q15 Q17 Q18 1.000 .516 1.000.610 1.000 .501 1.000 .609 1.000 .431 1.000 .089 Extraction Method: Principal Component Analysis. Total Variance Explained Component Initial Eigenvalues Extraction Sums of Squared Loadings Total % of Variance Cumulative % Total % of Variance Cumulative % 1 2 3 4 5 6 7 8 9 10 11 12 13 14 15 16 17 18 19 20 21 22 23 24 25 16.042 48.613 48.613 16.042 48.613 48.613 14.534 1.838 5.570 54.183 1.838 5.570 54.183 12.143 1.625 4.924 59.107 1.296 3.926 63.033 1.141 3.456 66.489 1.111 3.367 69.856 .898 2.723 72.578 .804 2.437 75.016 .710 2.152 77.168 .699 2.118 79.286 .683 2.070 81.356 .633 1.919 83.275 .623 1.889 85.164 .537 1.628 86.792 .500 1.516 88.308 .475 1.440 89.748 .456 1.381 91.129 .392 1.189 92.318 .327 .991 93.310 .304 .920 94.229 .249 .753 94.983 .242 .734 95.717 .211 .638 96.355 .200 .606 96.961 .174 .526 97.487 .157 .476 97.963
  • 235.
    Total Variance Explained Component RotationSums of Squared Loadingsa Total 1 2 3 4 5 6 7 8 9 10 11 12 13 14 15 16 17 18 19 20 21 22 23 24 25 14.534 12.143
  • 236.
    Total Variance Explained Component InitialEigenvalues Extraction Sums of Squared Loadings Total % of Variance Cumulative % Total % of Variance Cumulative % 26 27 28 29 30 31 32 33 .157 .476 97.963 .140 .424 98.387 .115 .348 98.735 .112 .341 99.076 .089 .269 99.345 .081 .244 99.590 .071 .215 99.804 .065 .196 100.000 Total Variance Explained Component Rotation Sums of Squared Loadingsa Total 26 27 28 29 30 31 32 33 Extraction Method: Principal Component Analysis. When components are correlated, sums of squared loadings cannot be added to obtain a total variance.a.
  • 237.
    Pattern Matrixa Component 1 2 Q9Financial_Statements Q12Fees Q12Interest_Rates_Accounts Q12Interest_Rates_Loan Q12Open_Or_Close_Branches Q12Treated Q9Transparency Q12Withdraw_Money Q12Personal_Information_Safe Q12Financial_Stability Q9legal_Obligations Q9Honest_Relationship Q10 Q9Borrowings_And_Savings Q9Confidentially Q9Offers Q11 AQ12Advice_Quality Q15 Q9MeetCustomers_Needs Q9Financial_literacy Q9Giving_Back_To_Community Q9Social_Attachment Q9Executive_Remuneration Q9Environmentally_branches Q13 Q9Being_Accountable Q17 Q9Valued_Customer_Recognition Q9Financial_Inclusion_SMEbanking Q14 Q9Combating_Bribery Q18 .908 .884 .859 .739 .735 .691 .690 .689 .652 .632 .622 .619 .616 .593 .576 .574 .567 .526 .505 .470 .914 .812 .810 .714 .627 .561 .517 .495 .485 .464 .455 .429 ExtractionMethod: Principal Component Analysis. Rotation Method: Oblimin with Kaiser Normalization.a Rotation converged in 11 iterations.a.
  • 238.
    Component Correlation Matrix Component1 2 1 2 1.000 .635 .635 1.000 Extraction Method: Principal Component Analysis. Rotation Method: Oblimin with Kaiser Normalization.
  • 239.
    Apendix H- ResearchObjective One- Regression Analysis Descriptive Statistics Mean Std. Deviation N Q15 ECandLG PHandET 3.11 .883 92 .0000000 1.00000000 92 .0000000 1.00000000 92 Correlations Q15 ECandLG PHandET Pearson Correlation Q15 ECandLG PHandET Sig. (1-tailed) Q15 ECandLG PHandET N Q15 ECandLG PHandET 1.000 .712 .656 .712 1.000 .634 .656 .634 1.000 . .000 .000 .000 . .000 .000 .000 . 92 92 92 92 92 92 92 92 92 Variables Entered/Removeda Model Variables Entered Variables Removed Method 1 PH&ET, EC&LGb . Enter Dependent Variable: I think the overall approach of my bank's social responsibility efforts after the financial crisis of 2007 are satisfactory a. All requested variables entered.b. Model Summary Model R R Square Adjusted R Square Std. Error of the Estimate 1 .760a .577 .568 .580 Predictors: (Constant), PH&ET, EC&LGa.
  • 240.
    ANOVAa Model Sum of Squares dfMean Square F Sig. 1 Regression Residual Total 40.927 2 20.464 60.738 .000b 29.986 89 .337 70.913 91 Dependent Variable: I think the overall approach of my bank's social responsibility efforts after the financial crisis of 2007 are satisfactory a. Predictors: (Constant), PH&ET, EC&LGb. Coefficientsa Model Unstandardized Coefficients Standardized Coefficients t Sig. Collinearity Statistics B Std. Error Beta Tolerance 1 (Constant) EC&LG PH&ET 3.109 .061 51.370 .000 .438 .079 .496 5.564 .000 .598 1.672 .301 .079 .341 3.829 .000 .598 1.672 Coefficientsa Model Collinearity Statistics VIF 1 (Constant) EC&LG PH&ET 1.672 1.672 Dependent Variable: I think the overall approach of my bank's social responsibility efforts after the financial crisis of 2007 are satisfactory a.
  • 241.
    Appendix I -Research Objective Two - Factor and Reliability Analyses Descriptive Statistics Mean Std. Deviation Analysis N Q19Reasonable_Interest_Rates Q19Payments_Fees_Transparency Q19Account_Information_Confidentiality Q19CEO_Cuts Q19Financial_Inclusion Q19Projects_With_Adverse_Impacts Q19ValuedCustomer_Treating Q19Honest_Financial_Advice Q19CEO_dont_Misreport Q19Compliance_With_Law 4.20 .975 92 4.26 .850 92 4.27 .939 92 3.16 1.252 92 3.18 1.195 92 3.71 1.218 92 4.34 .842 92 4.29 .871 92 3.92 1.061 92 4.22 .936 92 Correlation Matrixa Q19Reasonabl e_Interest_Rate s Q19Payments_ Fees_Transpar ency Correlation Q19Reasonable_Interest_Rates Q19Payments_Fees_Transparency Q19Account_Information_Confidentiality Q19CEO_Cuts Q19Financial_Inclusion Q19Projects_With_Adverse_Impacts Q19ValuedCustomer_Treating Q19Honest_Financial_Advice Q19CEO_dont_Misreport Q19Compliance_With_Law Sig. (1-tailed) Q19Reasonable_Interest_Rates Q19Payments_Fees_Transparency Q19Account_Information_Confidentiality Q19CEO_Cuts Q19Financial_Inclusion Q19Projects_With_Adverse_Impacts Q19ValuedCustomer_Treating Q19Honest_Financial_Advice Q19CEO_dont_Misreport Q19Compliance_With_Law 1.000 .627 .458 .627 1.000 .626 .458 .626 1.000 .046 .156 .261 .138 .277 .200 .123 .351 .436 .575 .613 .745 .449 .623 .667 .216 .363 .506 .326 .481 .683 .000 .000 .000 .000 .000 .000 .333 .069 .006 .094 .004 .028 .122 .000 .000 .000 .000 .000 .000 .000 .000 .019 .000 .000 .001 .000 .000
  • 242.
    Correlation Matrixa Q19Account_In formation_Confi dentiality Q19CEO_Cuts CorrelationQ19Reasonable_Interest_Rates Q19Payments_Fees_Transparency Q19Account_Information_Confidentiality Q19CEO_Cuts Q19Financial_Inclusion Q19Projects_With_Adverse_Impacts Q19ValuedCustomer_Treating Q19Honest_Financial_Advice Q19CEO_dont_Misreport Q19Compliance_With_Law Sig. (1-tailed) Q19Reasonable_Interest_Rates Q19Payments_Fees_Transparency Q19Account_Information_Confidentiality Q19CEO_Cuts Q19Financial_Inclusion Q19Projects_With_Adverse_Impacts Q19ValuedCustomer_Treating Q19Honest_Financial_Advice Q19CEO_dont_Misreport Q19Compliance_With_Law .458 .046 .138 .626 .156 .277 1.000 .261 .200 .261 1.000 .501 .200 .501 1.000 .436 .406 .513 .745 .260 .309 .667 .167 .338 .506 .589 .471 .683 .317 .337 .000 .333 .094 .000 .069 .004 .006 .028 .006 .000 .028 .000 .000 .000 .000 .000 .006 .001 .000 .056 .000 .000 .000 .000 .000 .001 .001
  • 243.
    Correlation Matrixa Q19Financial_I nclusion Q19Projects_W ith_Adverse_Im pacts Correlation Q19Reasonable_Interest_Rates Q19Payments_Fees_Transparency Q19Account_Information_Confidentiality Q19CEO_Cuts Q19Financial_Inclusion Q19Projects_With_Adverse_Impacts Q19ValuedCustomer_Treating Q19Honest_Financial_Advice Q19CEO_dont_Misreport Q19Compliance_With_Law Sig.(1-tailed) Q19Reasonable_Interest_Rates Q19Payments_Fees_Transparency Q19Account_Information_Confidentiality Q19CEO_Cuts Q19Financial_Inclusion Q19Projects_With_Adverse_Impacts Q19ValuedCustomer_Treating Q19Honest_Financial_Advice Q19CEO_dont_Misreport Q19Compliance_With_Law .138 .123 .575 .277 .351 .613 .200 .436 .745 .501 .406 .260 1.000 .513 .309 .513 1.000 .462 .309 .462 1.000 .338 .569 .762 .471 .646 .595 .337 .577 .631 .094 .122 .000 .004 .000 .000 .028 .000 .000 .000 .000 .006 .000 .001 .000 .000 .001 .000 .000 .000 .000 .000 .000 .000 .001 .000 .000
  • 244.
    Correlation Matrixa Q19ValuedCust omer_Treating Q19Honest_Fin ancial_Advice Correlation Q19Reasonable_Interest_Rates Q19Payments_Fees_Transparency Q19Account_Information_Confidentiality Q19CEO_Cuts Q19Financial_Inclusion Q19Projects_With_Adverse_Impacts Q19ValuedCustomer_Treating Q19Honest_Financial_Advice Q19CEO_dont_Misreport Q19Compliance_With_Law Sig.(1-tailed) Q19Reasonable_Interest_Rates Q19Payments_Fees_Transparency Q19Account_Information_Confidentiality Q19CEO_Cuts Q19Financial_Inclusion Q19Projects_With_Adverse_Impacts Q19ValuedCustomer_Treating Q19Honest_Financial_Advice Q19CEO_dont_Misreport Q19Compliance_With_Law .575 .449 .216 .613 .623 .363 .745 .667 .506 .260 .167 .589 .309 .338 .471 .462 .569 .646 1.000 .762 .595 .762 1.000 .595 .595 .595 1.000 .631 .743 .637 .000 .000 .019 .000 .000 .000 .000 .000 .000 .006 .056 .000 .001 .000 .000 .000 .000 .000 .000 .000 .000 .000 .000 .000 .000 .000 .000
  • 245.
    Correlation Matrixa Q19CEO_dont_ Misreport Q19Complianc e_With_Law Correlation Q19Reasonable_Interest_Rates Q19Payments_Fees_Transparency Q19Account_Information_Confidentiality Q19CEO_Cuts Q19Financial_Inclusion Q19Projects_With_Adverse_Impacts Q19ValuedCustomer_Treating Q19Honest_Financial_Advice Q19CEO_dont_Misreport Q19Compliance_With_Law Sig.(1-tailed) Q19Reasonable_Interest_Rates Q19Payments_Fees_Transparency Q19Account_Information_Confidentiality Q19CEO_Cuts Q19Financial_Inclusion Q19Projects_With_Adverse_Impacts Q19ValuedCustomer_Treating Q19Honest_Financial_Advice Q19CEO_dont_Misreport Q19Compliance_With_Law .216 .326 .363 .481 .506 .683 .589 .317 .471 .337 .646 .577 .595 .631 .595 .743 1.000 .637 .637 1.000 .019 .001 .000 .000 .000 .000 .000 .001 .000 .001 .000 .000 .000 .000 .000 .000 .000 .000 Determinant = .002a. KMO and Bartlett's Test Kaiser-Meyer-Olkin Measure of Sampling Adequacy. Bartlett's Test of Sphericity Approx. Chi-Square df Sig. .850 556.572 45 .000
  • 246.
    Communalities Initial Extraction Q19Reasonable_Interest_Rates Q19Payments_Fees_Transparency Q19Account_Information_Confidentiality Q19CEO_Cuts Q19Financial_Inclusion Q19Projects_With_Adverse_Impacts Q19ValuedCustomer_Treating Q19Honest_Financial_Advice Q19CEO_dont_Misreport Q19Compliance_With_Law 1.000 .617 1.000.680 1.000 .717 1.000 .634 1.000 .558 1.000 .657 1.000 .788 1.000 .767 1.000 .758 1.000 .680 Extraction Method: Principal Component Analysis. Total Variance Explained Component Initial Eigenvalues Extraction Sums of Squared Loadings Total % of Variance Cumulative % Total % of Variance Cumulative % 1 2 3 4 5 6 7 8 9 10 5.229 52.290 52.290 5.229 52.290 52.290 4.528 1.627 16.275 68.564 1.627 16.275 68.564 3.516 .814 8.140 76.705 .619 6.193 82.897 .394 3.939 86.836 .368 3.683 90.520 .310 3.104 93.624 .288 2.878 96.502 .206 2.065 98.567 .143 1.433 100.000
  • 247.
    Total Variance Explained Component RotationSums of Squared Loadingsa Total 1 2 3 4 5 6 7 8 9 10 4.528 3.516 Extraction Method: Principal Component Analysis. When components are correlated, sums of squared loadings cannot be added to obtain a total variance.a.
  • 248.
  • 249.
    Component Matrixa Component 1 2 Q19Honest_Financial_Advi ce Q19ValuedCustomer_Treati ng Q19Compliance_With_Law Q19Account_Information_C onfidentiality Q19CEO_dont_Misreport Q19Payments_Fees_Trans parency Q19Projects_With_Adverse _Impacts Q19Financial_Inclusion Q19CEO_Cuts Q19Reasonable_Interest_R ates .857 .853 .824 .806 .784 .722 .709 .529.528 .470 .643 .548 -.563 Extraction Method: Principal Component Analysis. 2 components extracted.a. Pattern Matrixa Component 1 2 Q19Payments_Fees_Transparency Q19Reasonable_Interest_Rates Q19ValuedCustomer_Treating Q19Account_Information_Confidentiality Q19Honest_Financial_Advice Q19Compliance_With_Law Q19CEO_Cuts Q19Financial_Inclusion Q19CEO_dont_Misreport Q19Projects_With_Adverse_Impacts .838 .837 .816 .793 .770 .595 .401 .836 .753 .732 .710 Extraction Method: Principal Component Analysis. Rotation Method: Oblimin with Kaiser Normalization.a Rotation converged in 7 iterations.a.
  • 250.
    Structure Matrix Component 1 2 Q19ValuedCustomer_Treating Q19Honest_Financial_Advice Q19Account_Information_Confidentiality Q19Payments_Fees_Transparency Q19Reasonable_Interest_Rates Q19Compliance_With_Law Q19CEO_dont_Misreport Q19Projects_With_Adverse_Impacts Q19CEO_Cuts Q19Financial_Inclusion .874.450 .849 .495 .838 .404 .824 .740 .734 .607 .536 .829 .462 .785 .784 .747 Extraction Method: Principal Component Analysis. Rotation Method: Oblimin with Kaiser Normalization. Component Correlation Matrix Component 1 2 1 2 1.000 .346 .346 1.000 Extraction Method: Principal Component Analysis. Rotation Method: Oblimin with Kaiser Normalization.
  • 251.
    Component Score CoefficientMatrix Component 1 2 Q19Reasonable_Interest_R ates Q19Payments_Fees_Trans parency Q19Account_Information_C onfidentiality Q19CEO_Cuts Q19Financial_Inclusion Q19Projects_With_Adverse _Impacts Q19ValuedCustomer_Treati ng Q19Honest_Financial_Advi ce Q19CEO_dont_Misreport Q19Compliance_With_Law .247 -.163 .232 -.069 .209 .001 -.094 .338 -.052 .297 .015 .265 .213 .015 .196 .042 .032 .270 .138 .120 Extraction Method: Principal Component Analysis. Rotation Method: Oblimin with Kaiser Normalization. Component Scores. Component Score Covariance Matrix Component 1 2 1 2 1.119 .691 .691 1.119 Extraction Method: Principal Component Analysis. Rotation Method: Oblimin with Kaiser Normalization. Component Scores. Reliability Analysis for ECP&LGP
  • 252.
    Case Processing Summary N% Cases Valid Excludeda Total 92 100.0 0 .0 92 100.0 Listwise deletion based on all variables in the procedure.a. Reliability Statistics Cronbach's Alpha Cronbach's Alpha Based on Standardized Items N of Items .898 .900 6 Item Statistics Mean Std. Deviation N Q19Payments_Fees_Transparency Q19Reasonable_Interest_Rates Q19ValuedCustomer_Treating Q19Account_Information_Confident iality Q19Honest_Financial_Advice Q19Compliance_With_Law 4.26 .850 92 4.20 .975 92 4.34 .842 92 4.27 .939 92 4.29 .871 92 4.22 .936 92 Inter-Item Correlation Matrix Q19Payments_ Fees_Transpar ency Q19Reasonabl e_Interest_Rate s Q19ValuedCust omer_Treating Q19Account_In formation_Confi dentiality Q19Payments_Fees_Trans parency Q19Reasonable_Interest_R ates Q19ValuedCustomer_Treati ng Q19Account_Information_C onfidentiality Q19Honest_Financial_Advi ce Q19Compliance_With_Law 1.000 .627 .613 .626 .623 .627 1.000 .575 .458 .449 .613 .575 1.000 .745 .762 .626 .458 .745 1.000 .667 .623 .449 .762 .667 1.000 .481 .326 .631 .683 .743
  • 253.
    Inter-Item Correlation Matrix Q19Honest_Fin ancial_Advice Q19Complianc e_With_Law Q19Payments_Fees_Trans parency Q19Reasonable_Interest_R ates Q19ValuedCustomer_Treati ng Q19Account_Information_C onfidentiality Q19Honest_Financial_Advi ce Q19Compliance_With_Law .623.481 .449 .326 .762 .631 .667 .683 1.000 .743 .743 1.000 Item-Total Statistics Scale Mean if Item Deleted Scale Variance if Item Deleted Corrected Item- Total Correlation Squared Multiple Correlation Q19Payments_Fees_Trans parency Q19Reasonable_Interest_R ates Q19ValuedCustomer_Treati ng Q19Account_Information_C onfidentiality Q19Honest_Financial_Advi ce Q19Compliance_With_Law 21.32 14.108 .721 .581 .880 21.38 14.304 .567 .466 .905 21.24 13.613 .822 .718 .865 21.30 13.247 .776 .662 .871 21.28 13.568 .796 .719 .869 21.36 13.793 .686 .622 .885
  • 254.
    Item-Total Statistics Cronbach's Alpha ifItem Deleted Q19Payments_Fees_Trans parency Q19Reasonable_Interest_R ates Q19ValuedCustomer_Treati ng Q19Account_Information_C onfidentiality Q19Honest_Financial_Advi ce Q19Compliance_With_Law .880 .905 .865 .871 .869 .885 Scale Statistics Mean Variance Std. Deviation N of Items 25.58 19.434 4.408 6 Reliability Analysis for ETP&PHP Case Processing Summary N % Cases Valid Excludeda Total 92 100.0 0 .0 92 100.0 Listwise deletion based on all variables in the procedure.a. Reliability Statistics Cronbach's Alpha Cronbach's Alpha Based on Standardized Items N of Items .809 .813 4
  • 255.
    Item Statistics Mean Std.Deviation N Q19CEO_Cuts Q19Financial_Inclusion Q19CEO_dont_Misreport Q19Projects_With_Adverse _Impacts 3.16 1.252 92 3.18 1.195 92 3.92 1.061 92 3.71 1.218 92 Inter-Item Correlation Matrix Q19CEO_Cuts Q19Financial_I nclusion Q19CEO_dont_ Misreport Q19Projects_W ith_Adverse_Im pacts Q19CEO_Cuts Q19Financial_Inclusion Q19CEO_dont_Misreport Q19Projects_With_Adverse _Impacts 1.000 .501 .589 .406 .501 1.000 .471 .513 .589 .471 1.000 .646 .406 .513 .646 1.000 Item-Total Statistics Scale Mean if Item Deleted Scale Variance if Item Deleted Corrected Item- Total Correlation Squared Multiple Correlation Q19CEO_Cuts Q19Financial_Inclusion Q19CEO_dont_Misreport Q19Projects_With_Adverse _Impacts 10.82 8.394 .593 .413 .779 10.79 8.649 .596 .368 .776 10.05 8.711 .707 .545 .729 10.27 8.376 .624 .475 .762 Item-Total Statistics Cronbach's Alpha if Item Deleted Q19CEO_Cuts Q19Financial_Inclusion Q19CEO_dont_Misreport Q19Projects_With_Adverse _Impacts .779 .776 .729 .762 Scale Statistics Mean Variance Std. Deviation N of Items 13.98 14.263 3.777 4 Regression Analysis for Research Objective Two
  • 256.
    Variables Entered/Removeda Model Variables Entered Variables Removed Method 1REGR factor score 2 for analysis 1, REGR factor score 1 for analysis 1b . Enter Dependent Variable: I think that the more meaningful the social activities a bank engages in are, the more preference will be given to them a. All requested variables entered.b. Model Summaryb Model R R Square Adjusted R Square Std. Error of the Estimate 1 .556a .309 .294 .811 Predictors: (Constant), REGR factor score 2 for analysis 1, REGR factor score 1 for analysis 1a. Dependent Variable: I think that the more meaningful the social activities a bank engages in are, the more preference will be given to them b. ANOVAa Model Sum of Squares df Mean Square F Sig. 1 Regression Residual Total 26.238 2 13.119 19.929 .000b 58.588 89 .658 84.826 91 Dependent Variable: I think that the more meaningful the social activities a bank engages in are, the more preference will be given to them a. Predictors: (Constant), REGR factor score 2 for analysis 1, REGR factor score 1 for analysis 1b.
  • 257.
    Coefficientsa Model Unstandardized Coefficients Standardized Coefficients t Sig. 95.0% Confidence... B Std. Error Beta Lower Bound 1 (Constant) ECP&LGP ETP&PHP 3.543 .085 41.891 .000 3.375 3.712 .291 .091 .301 3.210 .002 .111 .471 .362 .091 .375 3.993 .000 .182 .542 Coefficientsa Model 95.0% Confidence ... Upper Bound 1 (Constant) ECP&LGP ETP&PHP 3.712 .471 .542 Dependent Variable: I think that the more meaningful the social activities a bank engages in are, the more preference will be given to them a. Residuals Statisticsa Minimum Maximum Mean Std. Deviation N Predicted Value Residual Std. Predicted Value Std. Residual 1.45 4.31 3.54 .537 92 -2.203 1.402 .000 .802 92 -3.900 1.435 .000 1.000 92 -2.716 1.728 .000 .989 92 Dependent Variable: I think that the more meaningful the social activities a bank engages in are, the more preference will be given to them a.
  • 258.
    Appendix J- ResearchObjective Three- Correlation Coefficient and Reliability analyses Descriptive Statistics Mean Std. Deviation N Q21CSR_strategy Q21Confidence Q21Reputable_Business Q21High_CSR_rating Q22 3.91 .847 92 4.00 .784 92 3.98 .784 92 3.98 .784 92 3.54 .965 92 Correlations Q21CSR_strate gy Q21Confidence Q21Reputable_ Business Q21CSR_strategy Pearson Correlation Sig. (2-tailed) N Q21Confidence Pearson Correlation Sig. (2-tailed) N Q21Reputable_Business Pearson Correlation Sig. (2-tailed) N Q21High_CSR_rating Pearson Correlation Sig. (2-tailed) N Q22 Pearson Correlation Sig. (2-tailed) N 1 .695** .543** .593** .000 .000 .000 92 92 92 92 .695** 1 .643** .679** .000 .000 .000 92 92 92 92 .543** .643** 1 .732** .000 .000 .000 92 92 92 92 .593** .679** .732** 1 .000 .000 .000 92 92 92 92 .327** .464** .495** .582** .001 .000 .000 .000 92 92 92 92
  • 259.
    Correlations Q21High_CSR _rating Q22 Q21CSR_strategy PearsonCorrelation Sig. (2-tailed) N Q21Confidence Pearson Correlation Sig. (2-tailed) N Q21Reputable_Business Pearson Correlation Sig. (2-tailed) N Q21High_CSR_rating Pearson Correlation Sig. (2-tailed) N Q22 Pearson Correlation Sig. (2-tailed) N .593** .327** .000 .001 92 92 .679** .464** .000 .000 92 92 .732** .495** .000 .000 92 92 1 .582** .000 92 92 .582** 1 .000 92 92 Correlation is significant at the 0.01 level (2-tailed).**. Correlations Q21CSR_strate gy Q21Confidence Q21Reputable_ Business Q21CSR_strategy Pearson Correlation Sig. (2-tailed) N Q21Confidence Pearson Correlation Sig. (2-tailed) N Q21Reputable_Business Pearson Correlation Sig. (2-tailed) N Q21High_CSR_rating Pearson Correlation Sig. (2-tailed) N 1 .695 ** .543 ** .593 ** .000 .000 .000 92 92 92 92 .695** 1 .643** .679** .000 .000 .000 92 92 92 92 .543** .643** 1 .732** .000 .000 .000 92 92 92 92 .593** .679** .732** 1 .000 .000 .000 92 92 92 92 .327** .464** .495 .582**
  • 260.
    Correlations Q21High_CSR _rating I think thatthe more meaningful the social activities a bank engages in are, the more preference will be given to them Q21CSR_strategy Pearson Correlation Sig. (2-tailed) N Q21Confidence Pearson Correlation Sig. (2-tailed) N Q21Reputable_Business Pearson Correlation Sig. (2-tailed) N Q21High_CSR_rating Pearson Correlation Sig. (2-tailed) N .593** .327** .000 .001 92 92 .679** .464** .000 .000 92 92 .732** .495** .000 .000 92 92 1 .582** .000 92 92 .582** 1Correlations Q21CSR_strate gy Q21Confidence Q21Reputable_ Business I think that the more meaningful the social activities a bank engages in are, the more preference will be given to them Pearson Correlation Sig. (2-tailed) N .327** .464** .495** .582** .001 .000 .000 .000 92 92 92 92
  • 261.
    Correlations Q21High_CSR _rating I think thatthe more meaningful the social activities a bank engages in are, the more preference will be given to them I think that the more meaningful the social activities a bank engages in are, the more preference will be given to them Pearson Correlation Sig. (2-tailed) N .582** 1 .000 92 92 Correlation is significant at the 0.01 level (2-tailed).**. Reliability Scale: ALL VARIABLES Case Processing Summary N % Cases Valid Excludeda Total 92 100.0 0 .0 92 100.0 Listwise deletion based on all variables in the procedure.a. Reliability Statistics Cronbach's Alpha Cronbach's Alpha Based on Standardized Items N of Items .781 .800 5
  • 262.
    Item Statistics Mean Std.Deviation N Q21CSR_strategy Q21Confidence Q21Reputable_Business Q21High_CSR_rating Would you recommend your bank based on its socially responsible behaviour ? 3.91 .847 92 4.00 .784 92 3.98 .784 92 3.98 .784 92 3.09 .957 92 Inter-Item Correlation Matrix Q21CSR_strate gy Q21Confidence Q21Reputable_ Business Q21High_CSR _rating Q23 Q21CSR_strategy Q21Confidence Q21Reputable_Business Q21High_CSR_rating Q23 1.000 .695 .543 .593 -.004 .695 1.000 .643 .679 .102 .543 .643 1.000 .732 .208 .593 .679 .732 1.000 .252 -.004 .102 .208 .252 1.000 Item-Total Statistics Scale Mean if Item Deleted Scale Variance if Item Deleted Corrected Item- Total Correlation Squared Multiple Correlation Q21CSR_strategy Q21Confidence Q21Reputable_Business Q21High_CSR_rating Would you recommend your bank based on its socially responsible behaviour ? 15.04 6.130 .578 .527 .733 14.96 5.954 .706 .614 .692 14.98 5.934 .713 .580 .690 14.98 5.758 .771 .637 .670 15.87 7.521 .159 .105 .879 Item-Total Statistics Cronbach's Alpha if Item Deleted Q21CSR_strategy Q21Confidence Q21Reputable_Business Q21High_CSR_rating Would you recommend your bank based on its socially responsible behaviour ? .733 .692 .690 .670 .879
  • 263.
    Reliability Scale: ALL VARIABLES ReliabilityStatistics Cronbach's Alpha Cronbach's Alpha Based on Standardized Items N of Items .879 .880 4 Item Statistics Mean Std. Deviation N Q21CSR_strategy Q21Confidence Q21Reputable_Business Q21High_CSR_rating 3.91 .847 92 4.00 .784 92 3.98 .784 92 3.98 .784 92 Inter-Item Correlation Matrix Q21CSR_strate gy Q21Confidence Q21Reputable_ Business Q21High_CSR _rating Q21CSR_strategy Q21Confidence Q21Reputable_Business Q21High_CSR_rating 1.000 .695 .543 .593 .695 1.000 .643 .679 .543 .643 1.000 .732 .593 .679 .732 1.000 Item-Total Statistics Scale Mean if Item Deleted Scale Variance if Item Deleted Corrected Item- Total Correlation Squared Multiple Correlation Q21CSR_strategy Q21Confidence Q21Reputable_Business Q21High_CSR_rating 11.96 4.372 .687 .512 .867 11.87 4.356 .779 .614 .829 11.89 4.494 .726 .577 .850 11.89 4.384 .768 .620 .833 Item-Total Statistics Cronbach's Alpha if Item Deleted Q21CSR_strategy Q21Confidence Q21Reputable_Business Q21High_CSR_rating .867 .829 .850 .833
  • 264.
    Appendix K- ResearchObjective Four - Hierarchical Regression Analysis Variables Entered/Removeda Model Variables Entered Variables Removed Method 1 2 SectionC_final1b . Enter Q22b . Enter Dependent Variable: Q20a. All requested variables entered.b. Model Summary Model R R Square Adjusted R Square Std. Error of the Estimate 1 2 .714a .510 .505 .784 .760b .577 .568 .732 Predictors: (Constant), REGR factor score 1 for analysis 1a. Predictors: (Constant), REGR factor score 1 for analysis 1, I think that the more meaningful the social activities a bank engages in are, the more preference will be given to them b. ANOVAa Model Sum of Squares df Mean Square F Sig. 1 Regression Residual Total 2 Regression Residual Total 57.604 1 57.604 93.733 .000b 55.309 90 .615 112.913 91 65.185 2 32.592 60.775 .000c 47.728 89 .536 112.913 91 Dependent Variable: I think that, when/if I switch banks, I will form my decision highly based on their social responsibly activities a. Predictors: (Constant), REGR factor score 1 for analysis 1b. Predictors: (Constant), REGR factor score 1 for analysis 1, I think that the more meaningful the social activities a bank engages in are, the more preference will be given to them c.
  • 265.
    Coefficientsa Model Unstandardized Coefficients Standardized Coefficients t Sig.BStd. Error Beta 1 (Constant) SectionC_final1 2 (Constant) SectionC_final1 Q22 3.109 .082 38.036 .000 .796 .082 .714 9.682 .000 1.841 .346 5.328 .000 .606 .092 .544 6.600 .000 .358 .095 .310 3.760 .000 Dependent Variable: Q20a. Excluded Variablesa Model Beta In t Sig. Partial Correlation Collinearity Statistics Tolerance 1 Q22 .310b 3.760 .000 .370 .699 Dependent Variable: Q20a. Predictors in the Model: (Constant), SectionC_final1b.