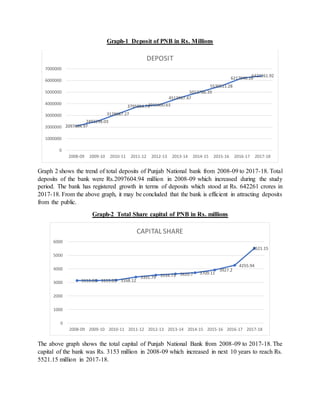
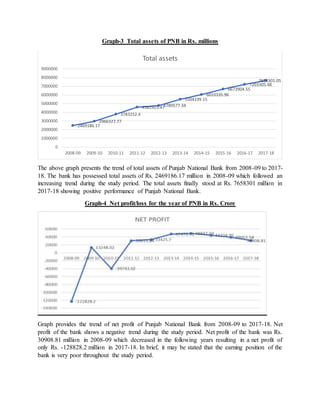
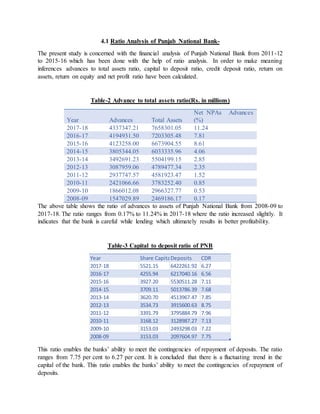
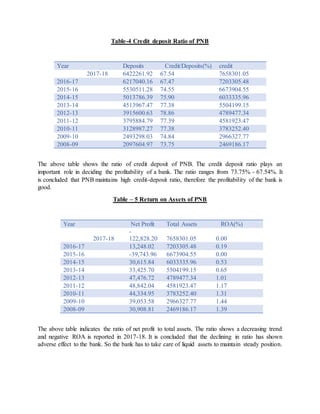
This document summarizes a study on the financial performance evaluation of Punjab National Bank from 2014-2018. It provides background on the bank, including its history dating back to 1894. The study aims to examine the business performance of PNB through analyzing financial ratios and conducting regression analysis to determine the impact of deposits and advances on net profit. The methodology section outlines the secondary data sources used and tools for statistical analysis. Preliminary results are presented on key financial indicators for PNB over the period studied.


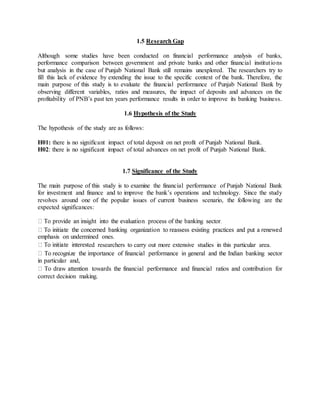
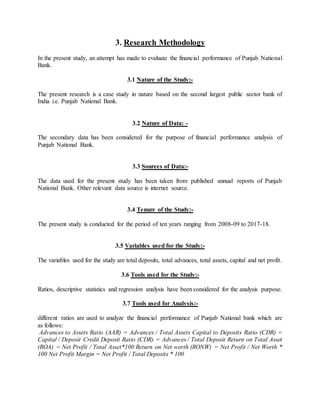
![2.3 Punjab National Bank Fraud Case, 2018
Punjab National Bank disclosed in February 2018 that it detected fraudulent transactions of up to
$1.77 billion at just one of its branches.[13]
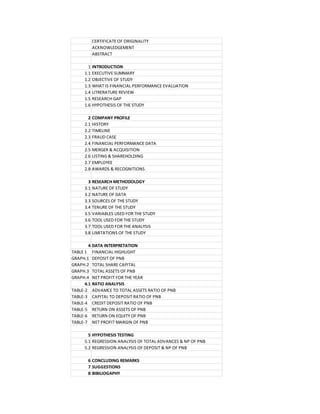
2.4 Financial performance data-
2.5 Mergers and acquisitions
Number
Acquisition
date
Company Location Price
Ref(s
).
1 1951
Bharat Bank
Ltd.
New Delhi, India —
2 1961
Universal Bank
of India
Dalmianagar, Bi
har, India
—
3 1962
Indo-
Commercial
Bank
India —
4 1986
Hindustan
Commercial
Bank
India —
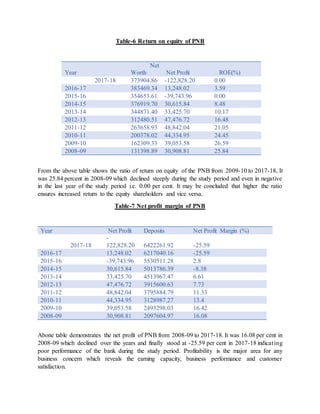
Financial performance Rupees. In millions
Mar2018 Mar2017 Mar2016 Mar2015 Mar2014 Mar2013 Mar2012 Mar2011 Mar2010 Mar2009
TotalAssets 7658301.05 7203305.48 6673904.55 6033335.96 5504199.15 4789477.34 4581923.47 3783252.40 2966327.77 2469186.17
OperatingProfitGrowth 0.00 20.02 0.00 0.00 0.00 0.00 0.00 0.00 6.50 0.00
ReportedNetProfit -125843.30 -125843.30 -125843.30 -125843.30 -125843.30 -125843.30 -125843.30 -125843.30 -125843.30 -125843.30
ROA(%) 0.00 0.19 0.00 0.53 0.65 1.01 1.17 1.31 1.44 1.39
GrossNPA 86620.05 55370.45 55818.33 25694.86 18880.06 13465.79 8719.62 4379.39 3214.41 2767.47
NetNPA 48684.29 32702.10 35422.56 15396.50 9916.99 7236.50 4454.23 2038.63 981.69 263.85](https://image.slidesharecdn.com/doonbusinessschoolpnb-200319131431/85/Doon-business-school-pnb-11-320.jpg)
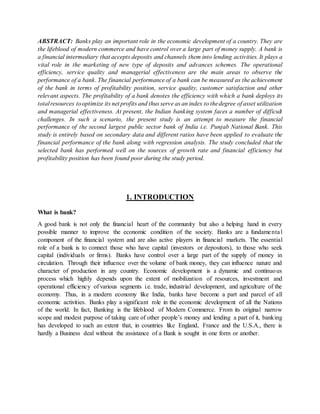
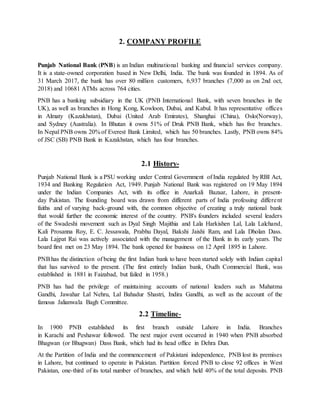
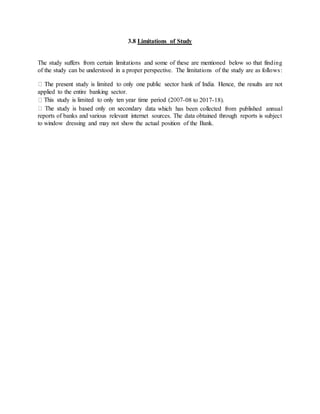
![Number
Acquisition
date
Company Location Price
Ref(s
).
5 1993
New Bank of
India
New Delhi, India —
6 2003
Nedungadi
Bank
Kozhikode, Kera
la, India
—
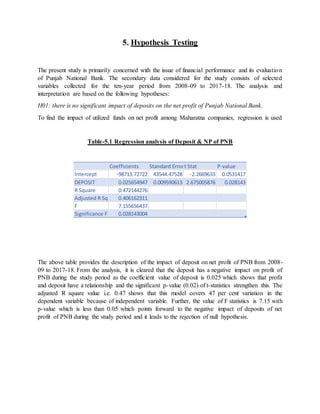
2.6 Listings and shareholding-
PNB's equity shares are listed on Bombay Stock Exchange and the National Stock Exchange of
India.[20][21] It is a constituent of the CNX Nifty at the NSE.
Shareholders (as on 31-Dec-2013) Shareholding
Promoter Group (Govt. of India) 58.87%
Foreign Institutional Investors (FII) 17.51%
Insurance Companies 15.46%
Individual shareholders 04.05%
Banks/Financial Institutions/Mutual Funds/UTI 03.02%
Others 01.09%
Total 100.0%
2.7 Employees-
PNB Head Office
As on 31 March 2015, the bank had 68,290 employees. As of 31 March 2013, it also had 919
employees with disabilities on the same date (1.45%). The average age of bank employees on the
same date was 46 years. The bank reported business of INR 11.65 crores per employee and net
profit of INR 8.06 lakhs per employee during the FY 2012-13. The company incurred INR 5,751
crores towards employee benefit expenses during the same financial year.](https://image.slidesharecdn.com/doonbusinessschoolpnb-200319131431/85/Doon-business-school-pnb-12-320.jpg)


![8.[77 92]effects and consequences of emphasizing sectoral recovery rate and s...](https://cdn.slidesharecdn.com/ss_thumbnails/8-77-92effectsandconsequencesofemphasizingsectoralrecoveryrateandsectoralproportioninloanportfolioonapprovingnewprojectloansofbangladeshshilpabank-111203185104-phpapp02-thumbnail.jpg?width=640&height=640&fit=bounds)


