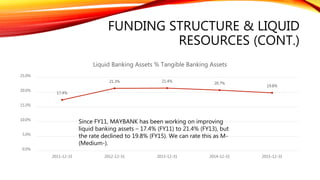
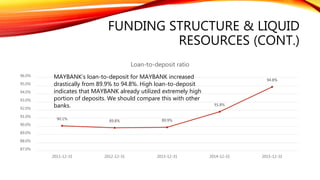
MAYBANK
FUNDAMENTAL ANALYSIS
Financial Year 2015 (31 December 2015)
14 April 2016
L. C. Chong (http://lcchong.wordpress.com and https://goo.gl/jjkq4P)
DISCLAIMER
I am NOT an investment advisor nor a financial advisor, and no information provided
here is to be interpreted as a suggestion to buy or sell securities.
Stock analysis in this presentation may not neutral because I have incorporated my
risk appetite and principles in the analysis.
All figures in MYR and in '000s, except per share data
2
DECLARATION OF INTEREST
• At the time of writing, I owned shares of MAYBANK.
SCOPE
• Figures and ratios are based on the figures reported in Annual Report or the latest
Q4 Quarterly Report (QR)
• Unless there is a need, this analysis will not include financial figures reported in Q1,
Q2 and Q3
• I will provide QR result highlights in my blog
• Valuation is not covered in this analysis
• I will provide valuation in my blog.
CHANGES
• 14 Apr 2016 – Annual Report 2015 and FY15 Q4 report
• 12 Nov 2015 – First write up of MAYBANK in PowerPoint format
REFERENCES
• Bank Industry (KLSE) - Peer Comparison
• BANKING – JAN 2016 BNM STATISTICS
• Malaysian Banks Quarterly Review - 8 Mar 2016
BUSINESS PROFILE
BUSINESS PROFILE
• The Bank is principally engaged in all aspects of commercial banking and related
financial services
• The Maybank Group has a global network of over 2,400 offices in 20 countries
including in all 10 ASEAN countries
• The Group operates from its three key “home markets” of Malaysia, Singapore and
Indonesia as well as across the key Asian countries and global financial centres
• It offers a range of financial services includes commercial banking, investment banking,
insurance and takaful, asset management, Islamic banking, offshore banking, stock
broking, venture capital financing and internet banking.
BUSINESS PROFILE (CONT.)
Key Overseas
Subsidiaries
PT Bank
Internasional
Indonesia Tbk
Maybank Philippines
Incorporated
Maybank
(Cambodia) Plc
Maybank (PNG) Ltd
Maybank
International (L) Ltd
Major Operating
Subsidiaries
Maybank Islamic
Berhad
Maybank Investment
Bank Berhad
Maybank Kim Eng
Holdings Limited
Etiqa Insurance
Berhad
OWNERSHIP SUMMARY
INSTITUTIONS
78%
PUBLIC AND OTHER
19%
CORPORATIONS (PRIVATE)
2%
STATE OWNED SHARES
1% INDIVIDUALS/INSIDERS
0%
Position Date: 5 Apr 2016
TOP 5 SHAREHOLDERS
Position Date: 5 Apr 2016
Holder Common Stock Held As At Date
% of Total Shares
Outstanding
PERMODALAN NASIONAL BERHAD 4,460,982,958 4-Apr-2016 45.7%
EMPLOYEES PROVIDENT FUND OF MALAYSIA 1,436,316,783 5-Apr-2016 14.7%
KUMPULAN WANG PERSARAAN 268,321,527 10-Feb-2016 2.7%
LEMBAGA KEMAJUAN TANAH PERSEKUTUAN 185,148,941 10-Feb-2016 1.9%
BLACKROCK, INC. 116,681,171 31-Mar-2016 1.2%
OWNERSHIP ANALYSIS
• Permodalan Nasional Berhad is a shareholder with significant influence on the Bank,
with direct shareholding of 5.37% and indirect shareholding of 38.46% via Amanah
Raya Trustee Berhad
• The Employees Provident Fund is the second-largest substantial shareholder with
around 14.7%.
ECONOMIC MOATS
ECONOMIC MOATS
• Cost Advantage (Narrow)
• MAYBANK enjoys high net profit margin and FCF/Sales
• On the other hand, the banking sector is facing Net Interest Margin (NIM) compression
• NIM compression will persist in the next few years
ECONOMIC MOATS (CONT.)
• Switching Costs (Wide)
• The first mover in the online banking in Malaysian financial sector
• Lead to develop valuable advantage to attract large number of subscribers
• Maybank's wide networks, both local and also global reach
• One stop financial centre
• Another important is inertia. Many people don't switch banks, even if they feel that
they're being nickeled and dimed by their current bank.
• The inertia is weaker nowadays. Consumers can have few bank accounts in different bank, and
change their preferred bank easily. Attractive refinancing offers provided by other banks.
ECONOMIC MOATS (CONT.)
• Network Effect (Wide)
• Strong brand and leadership position in the domestic market
• Expected to continue with ETP investment momentum
• Largest network domestically and emerging regional leader with presence in 10 ASEAN
countries
• MAYBANK2U, with market share of 36.6% (>50% ahead of the next competitor) in terms
of online banking, and an annualised growth of 22.9% of online users
• Avg. online transaction volume: 88mil per month (55% of total retail transactions via ATM and
branches)
• About 10% of these online transactions are now being monetized.
ECONOMIC MOATS (CONT.)
• Intangible Assets (Wide)
• The abundant of experience and strong workforce
• Strong financial resources coupled with GLC status
• Enjoys some advantage in term of government deposits and other credit portfolios
• MAYBANK2U, with market share of 36.6% (>50% ahead of the next competitor) in terms
of online banking, and an annualised growth of 22.9% of online users
• Widely known and well recognized by its unique brand name and a tiger head logo.
ECONOMIC MOATS (CONT.)
• Efficient Scale (Wide)
• Have characteristics of rational oligopolies
• Can decide to lower its prices, change its output, expand into a new market, offer new services,
or advertise. This will have powerful and consequential effects on the profitability of its
competitors
• Strong commitment of the Islamic banking services
• Strong financial resources coupled with GLC status
• Tap deposits from government and government related agencies
FINANCIAL PERFORMANCE
PROFITABILITY
0
2,000,000
4,000,000
6,000,000
8,000,000
10,000,000
12,000,000
2011-06-30 2012-12-31 2013-12-31 2014-12-31 2015-12-31
PRE-PROVISION OPERATING INCOME
PROFITABILITY (CONT.)
• From FY05 to FY14, CAGR of pre-provision operating income (PPOI) is 8.1%
• In FY09, there was a dip (-6.7%) in PPOI (FY08: 5,315mln; FY09: 4,960mln)
• Subprime
• Huge allowances for losses on loan,
advances and financing
• Huge impairment loss in goodwill
• Acquisition of subsidiaries in Indonesia
• In FY14, PPOI declined -2% (FY13: 9,610mln; FY14: 9,419mln)
• Increase in Personnel Costs and Administration & General Costs
• Lower provision in credit loss
• In FY15, PPOI increased 16.3% (FY15: 10,953mln; FY14: 9,419mln) due to higher
operating revenue.
PROFITABILITY (CONT.)
14.1%
13.6%
14.2%
12.7%
11.1%
0.0%
2.0%
4.0%
6.0%
8.0%
10.0%
12.0%
14.0%
16.0%
0.000%
0.200%
0.400%
0.600%
0.800%
1.000%
1.200%
1.400%
2011-06-30 2012-12-31 2013-12-31 2014-12-31 2015-12-31
ReturnonEquity
NetIncome%TangibleAssets
Net Income % Tangible Assets Return on Equity
PROFITABILITY (CONT.)
• “Net Income % Tangible Assets” of MAYBANK declined from 1.182% (FY13) to
0.975% (FY15)
• Using Moody’s rating system as benchmark, MAYBANK’s profitability is rated as M+
(Medium+) for FY14.
PROFITABILITY (CONT.)
0
5,000,000
10,000,000
15,000,000
20,000,000
25,000,000
30,000,000
31-Dec-11 31-Dec-12 31-Dec-13 31-Dec-14 31-Dec-15
OPERATING INCOME BY GEOGRAPHICAL LOCATION
Malaysia Singapore Indonesia Other Locations
PROFITABILITY (CONT.)
0
5,000,000
10,000,000
15,000,000
20,000,000
25,000,000
31-Dec-11 31-Dec-12 31-Dec-13 31-Dec-14 31-Dec-15
OPERATING INCOME BY SEGMENT
Community Financial Services Global Banking International Banking Insurance, Takaful and Asset Management
PROFITABILITY (CONT.)
0
5,000,000
10,000,000
15,000,000
20,000,000
25,000,000
30,000,000
2011-12-31 2012-12-31 2013-12-31 2014-12-31 2015-12-31
Revenue Stream
Interest Income Commissions and fees Investment Income Other Income
EFFICIENCY
49.6%
49.1%
48.2%
49.2%
48.4%
47.0%
47.5%
48.0%
48.5%
49.0%
49.5%
50.0%
2011-12-31 2012-12-31 2013-12-31 2014-12-31 12/31/2015
Cost to Income
In the past 5 financial years, MAYBANK maintained its cost-to-income in the range of 48%-50%.
Efficiency of MAYBANK can be graded as B.
ASSET RISK
3.3%
1.8%
1.5% 1.5%
1.9%
0.0%
0.5%
1.0%
1.5%
2.0%
2.5%
3.0%
3.5%
4.0%
2011-12-31 2012-12-31 2013-12-31 2014-12-31 2015-12-31
Problem loans % gross loans
MAYBANK’s asset risk downgraded to S (Strong) (FY14: Strong+).
CAPITAL ADEQUACY
0.0%
5.0%
10.0%
15.0%
20.0%
2011-12-31 2012-12-31 2013-12-31 2014-12-31 2015-12-31
Capital Adequacy
Tier 1 Ratio Tangible Common Equity % RWA
CAPITAL ADEQUACY (CONT.)
• PBBANK increased regulatory capital, from 11.1% (FY10) to 14.5% (FY15). This is way
above Bank Negara requirement
• “Tangible Common Equity % RWA” increased from 9.9% (FY10) to 15.1% (FY14). By
Moody’s benchmark, this is rated as S+ (Strong+).
FUNDING STRUCTURE & LIQUID
RESOURCES
12.2%
11.2%
12.7%
14.5%
12.8%
0.0%
2.0%
4.0%
6.0%
8.0%
10.0%
12.0%
14.0%
16.0%
2011-12-31 2012-12-31 2013-12-31 2014-12-31 2015-12-31
Market funds % Tangible Banking Assets
As of FY15, “market funds/tangible banking assets” of
MAYBANK is 12.8%, which is rated as S- (Strong-).
FUNDING STRUCTURE & LIQUID
RESOURCES (CONT.)
17.4%
21.3% 21.4%
20.7%
19.8%
0.0%
5.0%
10.0%
15.0%
20.0%
25.0%
2011-12-31 2012-12-31 2013-12-31 2014-12-31 2015-12-31
Liquid Banking Assets % Tangible Banking Assets
Since FY11, MAYBANK has been working on improving
liquid banking assets – 17.4% (FY11) to 21.4% (FY13), but
the rate declined to 19.8% (FY15). We can rate this as M-
(Medium-).
FUNDING STRUCTURE & LIQUID
RESOURCES (CONT.)
90.1%
89.8% 89.9%
91.8%
94.8%
87.0%
88.0%
89.0%
90.0%
91.0%
92.0%
93.0%
94.0%
95.0%
96.0%
2011-12-31 2012-12-31 2013-12-31 2014-12-31 2015-12-31
Loan-to-deposit ratio
MAYBANK’s loan-to-deposit for MAYBANK increased
drastically from 89.9% to 94.8%. High loan-to-deposit
indicates that MAYBANK already utilized extremely high
portion of deposits. We should compare this with other
banks.
MARKET RISK APPETITE
54.3%
23.1%
19.7%
29.6%
20.8%
0.0%
10.0%
20.0%
30.0%
40.0%
50.0%
60.0%
2011-12-31 2012-12-31 2013-12-31 2014-12-31 2015-12-31
Market Risk Appetite
Market Risk Appetite of MAYBANK is 20.8% (FY15) where this can be rated as B.
UNUSUAL ITEMS
• 23 Dec 2014 - Maybank has disposed of its entire ownership of Philippines-based
indirect subsidiary ATR Kim Eng Land Inc (ATRKE Land), which has total assets worth
RM83.7 million.
• 18 May 2015 - Malayan Banking Bhd (Maybank) is exiting from Papua New Guinea
(PNG) by hiving off its entire equity stake in Maybank (PNG) Ltd and Mayban
Property (PNG) Ltd (MPPL) to Kina Ventures for RM418 million.
GROWTH DRIVERS
GROWTH DRIVERS
• 9 Feb 2015 - The volatility in the market to be positive for the Group’s FX income
• 9 Feb 2015 - Should US interest rate rise due to Fed tightening, any increase in MGS
yield will be positive on the Group’s net income from insurance and takaful business
as this will lower its contract liabilities
• 9 Mar 2015 - Maybank Has ‘Strong Pipeline’ of Malaysia, Thailand Equity Deals
• 3 Aug 2015 - Maybank opens first branch in Myanmar.
GROWTH DRIVERS (CONT.)
• Expansion & growth in Thailand
• Regionalisation of Islamic banking
• Development of regional financial solutions
• The Asean Economic Community and growth in Intra-Asean trade
• 21 Jan 2016 - BNM announced the decrease in the Statutory Reserve Requirement
(SRR) Ratio from 4.00% to 3.50%, effective from 1 Feb 2016
• MAYBANK unlikely to reduce their loan-to-deposit much because their loan-to-deposit
was one of the highest in industry.
ISSUES/RISKS/CHALLENGES
• 7 Jan 2015 - the market was concerned about Maybank’s exposure to 1MDB as the
local press reported that 1MDB failed to pay a RM2 billion loan due on 31 Dec 14
• Maybank’s loan exposure to 1MDB could amount to RM5.5 billion.
• a 10% provisioning for this would trim Maybank’s FY15 net profit by 5.6%
• The risks would be reduced by the government’s guarantee and 1MDB’s listing plans
• 9 Feb 2015 - Direct loan exposure to the Oil & Gas sector represents 2.6% of loan
book. Oil & Gas exposure represents circa 2.6% of the Group’s loan book
• This is lower comparatively to some of its peers such as Ambank, CIMB and Affin which
have exposures of 3.5%, 3.5% and 4.0% to total loan book respectively.
ISSUES/RISKS/CHALLENGES (CONT.)
• MAYBANK's cost-to-income is more than 45% and expected to continue
approaching 50%
• Among all Malaysia banks, MAYBANK's loan-to-deposit ratio is the third highest.
Hence, it may not able to gear up and push its loan-to-deposit ratio a little further
to ensure NIM remains sustainable
• Competition for loans and deposits has not abated, and NIM compression will likely
continue into 2016
• DRP will drag ROE
• Increase in provisioning for loan impairments for some corporate loan customers
arise due to the difficult market conditions in Indonesia.
ISSUES/RISKS/CHALLENGES (CONT.)
• Tighter lending rules and slower loan growth - weaker-than-expected NIMs
• Slower than expected ETP projects rollouts
• Keener competitions and hence further margin squeeze
• Sharp turn in NPLs hence higher credit charge
• Potential asset quality pressure arising from changing macroeconomic environment
• Competitive landscape to put further pressure on loan pricing & funding costs
• Deterioration in asset quality
• Adverse foreign exchange movements
SHAREHOLDER RETURN
DIVIDEND PER SHARE
0.0000
0.1000
0.2000
0.3000
0.4000
0.5000
0.6000
0.7000
0.8000
2011-06-30 2012-12-31 2013-12-31 2014-12-31 2015-12-31
DPS
To maintain capital adequacy, in general, banks unlikely
to maintain high dividend payout.
DIVIDEND YIELD
EARNING YIELD
GOING FORWARD
GOING FORWARD
• The Group has set a lower ROE target of 11-12% as compared to FY15’s revised
guidance of 12-13% with a loan growth of 8-9% (Malaysia 6-7%, Singapore 3-4%,
Indonesia 11-13%) and deposit growth target of 10-11%
• NIM would likely edge lower on stiff deposit competition while credit costs are likely
to remain elevated at current levels (40-50bps)
• The banking sector will continue to be challenging in 2016, impacted by tightening
liquidity and unexciting capital markets
• Banking groups with exposure in Indonesia felt the continued impact of the poor
economic environment there.
GOING FORWARD
• The group’s dividend policy dictates a 40% to 60% dividend payout ratio based on
reported nett profit attributable to shareholders
• The payout has been above 70% because of the DRP
• Should management decide to change the DRP, dividend yields could disappoint, and
the stock would lose its appeal
• Due to its strong dividend yield, healthy liquidity and strong capital position, I will
continue to hold MAYBANK, and accumulate MAYBANK without increasing my
average price too much.

MAYBANK – Fundamental Analysis FY15

  • 1.
    MAYBANK FUNDAMENTAL ANALYSIS Financial Year2015 (31 December 2015) 14 April 2016 L. C. Chong (http://lcchong.wordpress.com and https://goo.gl/jjkq4P)
  • 2.
    DISCLAIMER I am NOTan investment advisor nor a financial advisor, and no information provided here is to be interpreted as a suggestion to buy or sell securities. Stock analysis in this presentation may not neutral because I have incorporated my risk appetite and principles in the analysis. All figures in MYR and in '000s, except per share data 2
  • 3.
    DECLARATION OF INTEREST •At the time of writing, I owned shares of MAYBANK.
  • 4.
    SCOPE • Figures andratios are based on the figures reported in Annual Report or the latest Q4 Quarterly Report (QR) • Unless there is a need, this analysis will not include financial figures reported in Q1, Q2 and Q3 • I will provide QR result highlights in my blog • Valuation is not covered in this analysis • I will provide valuation in my blog.
  • 5.
    CHANGES • 14 Apr2016 – Annual Report 2015 and FY15 Q4 report • 12 Nov 2015 – First write up of MAYBANK in PowerPoint format
  • 6.
    REFERENCES • Bank Industry(KLSE) - Peer Comparison • BANKING – JAN 2016 BNM STATISTICS • Malaysian Banks Quarterly Review - 8 Mar 2016
  • 7.
  • 8.
    BUSINESS PROFILE • TheBank is principally engaged in all aspects of commercial banking and related financial services • The Maybank Group has a global network of over 2,400 offices in 20 countries including in all 10 ASEAN countries • The Group operates from its three key “home markets” of Malaysia, Singapore and Indonesia as well as across the key Asian countries and global financial centres • It offers a range of financial services includes commercial banking, investment banking, insurance and takaful, asset management, Islamic banking, offshore banking, stock broking, venture capital financing and internet banking.
  • 9.
    BUSINESS PROFILE (CONT.) KeyOverseas Subsidiaries PT Bank Internasional Indonesia Tbk Maybank Philippines Incorporated Maybank (Cambodia) Plc Maybank (PNG) Ltd Maybank International (L) Ltd Major Operating Subsidiaries Maybank Islamic Berhad Maybank Investment Bank Berhad Maybank Kim Eng Holdings Limited Etiqa Insurance Berhad
  • 10.
    OWNERSHIP SUMMARY INSTITUTIONS 78% PUBLIC ANDOTHER 19% CORPORATIONS (PRIVATE) 2% STATE OWNED SHARES 1% INDIVIDUALS/INSIDERS 0% Position Date: 5 Apr 2016
  • 11.
    TOP 5 SHAREHOLDERS PositionDate: 5 Apr 2016 Holder Common Stock Held As At Date % of Total Shares Outstanding PERMODALAN NASIONAL BERHAD 4,460,982,958 4-Apr-2016 45.7% EMPLOYEES PROVIDENT FUND OF MALAYSIA 1,436,316,783 5-Apr-2016 14.7% KUMPULAN WANG PERSARAAN 268,321,527 10-Feb-2016 2.7% LEMBAGA KEMAJUAN TANAH PERSEKUTUAN 185,148,941 10-Feb-2016 1.9% BLACKROCK, INC. 116,681,171 31-Mar-2016 1.2%
  • 12.
    OWNERSHIP ANALYSIS • PermodalanNasional Berhad is a shareholder with significant influence on the Bank, with direct shareholding of 5.37% and indirect shareholding of 38.46% via Amanah Raya Trustee Berhad • The Employees Provident Fund is the second-largest substantial shareholder with around 14.7%.
  • 13.
  • 14.
    ECONOMIC MOATS • CostAdvantage (Narrow) • MAYBANK enjoys high net profit margin and FCF/Sales • On the other hand, the banking sector is facing Net Interest Margin (NIM) compression • NIM compression will persist in the next few years
  • 15.
    ECONOMIC MOATS (CONT.) •Switching Costs (Wide) • The first mover in the online banking in Malaysian financial sector • Lead to develop valuable advantage to attract large number of subscribers • Maybank's wide networks, both local and also global reach • One stop financial centre • Another important is inertia. Many people don't switch banks, even if they feel that they're being nickeled and dimed by their current bank. • The inertia is weaker nowadays. Consumers can have few bank accounts in different bank, and change their preferred bank easily. Attractive refinancing offers provided by other banks.
  • 16.
    ECONOMIC MOATS (CONT.) •Network Effect (Wide) • Strong brand and leadership position in the domestic market • Expected to continue with ETP investment momentum • Largest network domestically and emerging regional leader with presence in 10 ASEAN countries • MAYBANK2U, with market share of 36.6% (>50% ahead of the next competitor) in terms of online banking, and an annualised growth of 22.9% of online users • Avg. online transaction volume: 88mil per month (55% of total retail transactions via ATM and branches) • About 10% of these online transactions are now being monetized.
  • 17.
    ECONOMIC MOATS (CONT.) •Intangible Assets (Wide) • The abundant of experience and strong workforce • Strong financial resources coupled with GLC status • Enjoys some advantage in term of government deposits and other credit portfolios • MAYBANK2U, with market share of 36.6% (>50% ahead of the next competitor) in terms of online banking, and an annualised growth of 22.9% of online users • Widely known and well recognized by its unique brand name and a tiger head logo.
  • 18.
    ECONOMIC MOATS (CONT.) •Efficient Scale (Wide) • Have characteristics of rational oligopolies • Can decide to lower its prices, change its output, expand into a new market, offer new services, or advertise. This will have powerful and consequential effects on the profitability of its competitors • Strong commitment of the Islamic banking services • Strong financial resources coupled with GLC status • Tap deposits from government and government related agencies
  • 19.
  • 20.
  • 21.
    PROFITABILITY (CONT.) • FromFY05 to FY14, CAGR of pre-provision operating income (PPOI) is 8.1% • In FY09, there was a dip (-6.7%) in PPOI (FY08: 5,315mln; FY09: 4,960mln) • Subprime • Huge allowances for losses on loan, advances and financing • Huge impairment loss in goodwill • Acquisition of subsidiaries in Indonesia • In FY14, PPOI declined -2% (FY13: 9,610mln; FY14: 9,419mln) • Increase in Personnel Costs and Administration & General Costs • Lower provision in credit loss • In FY15, PPOI increased 16.3% (FY15: 10,953mln; FY14: 9,419mln) due to higher operating revenue.
  • 22.
    PROFITABILITY (CONT.) 14.1% 13.6% 14.2% 12.7% 11.1% 0.0% 2.0% 4.0% 6.0% 8.0% 10.0% 12.0% 14.0% 16.0% 0.000% 0.200% 0.400% 0.600% 0.800% 1.000% 1.200% 1.400% 2011-06-30 2012-12-312013-12-31 2014-12-31 2015-12-31 ReturnonEquity NetIncome%TangibleAssets Net Income % Tangible Assets Return on Equity
  • 23.
    PROFITABILITY (CONT.) • “NetIncome % Tangible Assets” of MAYBANK declined from 1.182% (FY13) to 0.975% (FY15) • Using Moody’s rating system as benchmark, MAYBANK’s profitability is rated as M+ (Medium+) for FY14.
  • 24.
    PROFITABILITY (CONT.) 0 5,000,000 10,000,000 15,000,000 20,000,000 25,000,000 30,000,000 31-Dec-11 31-Dec-1231-Dec-13 31-Dec-14 31-Dec-15 OPERATING INCOME BY GEOGRAPHICAL LOCATION Malaysia Singapore Indonesia Other Locations
  • 25.
    PROFITABILITY (CONT.) 0 5,000,000 10,000,000 15,000,000 20,000,000 25,000,000 31-Dec-11 31-Dec-1231-Dec-13 31-Dec-14 31-Dec-15 OPERATING INCOME BY SEGMENT Community Financial Services Global Banking International Banking Insurance, Takaful and Asset Management
  • 26.
    PROFITABILITY (CONT.) 0 5,000,000 10,000,000 15,000,000 20,000,000 25,000,000 30,000,000 2011-12-31 2012-12-312013-12-31 2014-12-31 2015-12-31 Revenue Stream Interest Income Commissions and fees Investment Income Other Income
  • 27.
    EFFICIENCY 49.6% 49.1% 48.2% 49.2% 48.4% 47.0% 47.5% 48.0% 48.5% 49.0% 49.5% 50.0% 2011-12-31 2012-12-31 2013-12-312014-12-31 12/31/2015 Cost to Income In the past 5 financial years, MAYBANK maintained its cost-to-income in the range of 48%-50%. Efficiency of MAYBANK can be graded as B.
  • 28.
    ASSET RISK 3.3% 1.8% 1.5% 1.5% 1.9% 0.0% 0.5% 1.0% 1.5% 2.0% 2.5% 3.0% 3.5% 4.0% 2011-12-312012-12-31 2013-12-31 2014-12-31 2015-12-31 Problem loans % gross loans MAYBANK’s asset risk downgraded to S (Strong) (FY14: Strong+).
  • 29.
    CAPITAL ADEQUACY 0.0% 5.0% 10.0% 15.0% 20.0% 2011-12-31 2012-12-312013-12-31 2014-12-31 2015-12-31 Capital Adequacy Tier 1 Ratio Tangible Common Equity % RWA
  • 30.
    CAPITAL ADEQUACY (CONT.) •PBBANK increased regulatory capital, from 11.1% (FY10) to 14.5% (FY15). This is way above Bank Negara requirement • “Tangible Common Equity % RWA” increased from 9.9% (FY10) to 15.1% (FY14). By Moody’s benchmark, this is rated as S+ (Strong+).
  • 31.
    FUNDING STRUCTURE &LIQUID RESOURCES 12.2% 11.2% 12.7% 14.5% 12.8% 0.0% 2.0% 4.0% 6.0% 8.0% 10.0% 12.0% 14.0% 16.0% 2011-12-31 2012-12-31 2013-12-31 2014-12-31 2015-12-31 Market funds % Tangible Banking Assets As of FY15, “market funds/tangible banking assets” of MAYBANK is 12.8%, which is rated as S- (Strong-).
  • 32.
    FUNDING STRUCTURE &LIQUID RESOURCES (CONT.) 17.4% 21.3% 21.4% 20.7% 19.8% 0.0% 5.0% 10.0% 15.0% 20.0% 25.0% 2011-12-31 2012-12-31 2013-12-31 2014-12-31 2015-12-31 Liquid Banking Assets % Tangible Banking Assets Since FY11, MAYBANK has been working on improving liquid banking assets – 17.4% (FY11) to 21.4% (FY13), but the rate declined to 19.8% (FY15). We can rate this as M- (Medium-).
  • 33.
    FUNDING STRUCTURE &LIQUID RESOURCES (CONT.) 90.1% 89.8% 89.9% 91.8% 94.8% 87.0% 88.0% 89.0% 90.0% 91.0% 92.0% 93.0% 94.0% 95.0% 96.0% 2011-12-31 2012-12-31 2013-12-31 2014-12-31 2015-12-31 Loan-to-deposit ratio MAYBANK’s loan-to-deposit for MAYBANK increased drastically from 89.9% to 94.8%. High loan-to-deposit indicates that MAYBANK already utilized extremely high portion of deposits. We should compare this with other banks.
  • 34.
    MARKET RISK APPETITE 54.3% 23.1% 19.7% 29.6% 20.8% 0.0% 10.0% 20.0% 30.0% 40.0% 50.0% 60.0% 2011-12-312012-12-31 2013-12-31 2014-12-31 2015-12-31 Market Risk Appetite Market Risk Appetite of MAYBANK is 20.8% (FY15) where this can be rated as B.
  • 35.
    UNUSUAL ITEMS • 23Dec 2014 - Maybank has disposed of its entire ownership of Philippines-based indirect subsidiary ATR Kim Eng Land Inc (ATRKE Land), which has total assets worth RM83.7 million. • 18 May 2015 - Malayan Banking Bhd (Maybank) is exiting from Papua New Guinea (PNG) by hiving off its entire equity stake in Maybank (PNG) Ltd and Mayban Property (PNG) Ltd (MPPL) to Kina Ventures for RM418 million.
  • 36.
  • 37.
    GROWTH DRIVERS • 9Feb 2015 - The volatility in the market to be positive for the Group’s FX income • 9 Feb 2015 - Should US interest rate rise due to Fed tightening, any increase in MGS yield will be positive on the Group’s net income from insurance and takaful business as this will lower its contract liabilities • 9 Mar 2015 - Maybank Has ‘Strong Pipeline’ of Malaysia, Thailand Equity Deals • 3 Aug 2015 - Maybank opens first branch in Myanmar.
  • 38.
    GROWTH DRIVERS (CONT.) •Expansion & growth in Thailand • Regionalisation of Islamic banking • Development of regional financial solutions • The Asean Economic Community and growth in Intra-Asean trade • 21 Jan 2016 - BNM announced the decrease in the Statutory Reserve Requirement (SRR) Ratio from 4.00% to 3.50%, effective from 1 Feb 2016 • MAYBANK unlikely to reduce their loan-to-deposit much because their loan-to-deposit was one of the highest in industry.
  • 39.
  • 40.
    ISSUES/RISKS/CHALLENGES • 7 Jan2015 - the market was concerned about Maybank’s exposure to 1MDB as the local press reported that 1MDB failed to pay a RM2 billion loan due on 31 Dec 14 • Maybank’s loan exposure to 1MDB could amount to RM5.5 billion. • a 10% provisioning for this would trim Maybank’s FY15 net profit by 5.6% • The risks would be reduced by the government’s guarantee and 1MDB’s listing plans • 9 Feb 2015 - Direct loan exposure to the Oil & Gas sector represents 2.6% of loan book. Oil & Gas exposure represents circa 2.6% of the Group’s loan book • This is lower comparatively to some of its peers such as Ambank, CIMB and Affin which have exposures of 3.5%, 3.5% and 4.0% to total loan book respectively.
  • 41.
    ISSUES/RISKS/CHALLENGES (CONT.) • MAYBANK'scost-to-income is more than 45% and expected to continue approaching 50% • Among all Malaysia banks, MAYBANK's loan-to-deposit ratio is the third highest. Hence, it may not able to gear up and push its loan-to-deposit ratio a little further to ensure NIM remains sustainable • Competition for loans and deposits has not abated, and NIM compression will likely continue into 2016 • DRP will drag ROE • Increase in provisioning for loan impairments for some corporate loan customers arise due to the difficult market conditions in Indonesia.
  • 42.
    ISSUES/RISKS/CHALLENGES (CONT.) • Tighterlending rules and slower loan growth - weaker-than-expected NIMs • Slower than expected ETP projects rollouts • Keener competitions and hence further margin squeeze • Sharp turn in NPLs hence higher credit charge • Potential asset quality pressure arising from changing macroeconomic environment • Competitive landscape to put further pressure on loan pricing & funding costs • Deterioration in asset quality • Adverse foreign exchange movements
  • 43.
  • 44.
    DIVIDEND PER SHARE 0.0000 0.1000 0.2000 0.3000 0.4000 0.5000 0.6000 0.7000 0.8000 2011-06-302012-12-31 2013-12-31 2014-12-31 2015-12-31 DPS To maintain capital adequacy, in general, banks unlikely to maintain high dividend payout.
  • 45.
  • 46.
  • 47.
  • 48.
    GOING FORWARD • TheGroup has set a lower ROE target of 11-12% as compared to FY15’s revised guidance of 12-13% with a loan growth of 8-9% (Malaysia 6-7%, Singapore 3-4%, Indonesia 11-13%) and deposit growth target of 10-11% • NIM would likely edge lower on stiff deposit competition while credit costs are likely to remain elevated at current levels (40-50bps) • The banking sector will continue to be challenging in 2016, impacted by tightening liquidity and unexciting capital markets • Banking groups with exposure in Indonesia felt the continued impact of the poor economic environment there.
  • 49.
    GOING FORWARD • Thegroup’s dividend policy dictates a 40% to 60% dividend payout ratio based on reported nett profit attributable to shareholders • The payout has been above 70% because of the DRP • Should management decide to change the DRP, dividend yields could disappoint, and the stock would lose its appeal • Due to its strong dividend yield, healthy liquidity and strong capital position, I will continue to hold MAYBANK, and accumulate MAYBANK without increasing my average price too much.

Editor's Notes

  • #28 To measure a bank’s efficiency and its ability to generate incremental profits with added revenue, I will use “Cost to Income” which is available in every bank’s financial report. The lower it is, the more profitable the bank will be.
  • #29 A bank’s asset risk is fundamental to its creditworthiness because its high leverage implies that a small deterioration in the value of its assets has a large effect on solvency. These risks are captured, to a considerable degree, by a single financial ratio, problem loans/gross loans (which we term the problem loan ratio). As loan quality deteriorates, the problem loan ratio rises, signaling potential problems, credit losses and consequent pressure on solvency that disadvantages bondholders by reducing the earnings and equity capital buffers that protect them.
  • #32 A bank’s funding structure has a strong bearing on its potential need for assistance because some sources of funds are less reliable than others. This implies that a bank making significant use of an unreliable funding source – perhaps short-term in nature, from particularly risk-sensitive counterparties – is more likely to suffer periodic difficulties in refinancing its debt. All other variables being equal, this puts it at greater risk of needing support. The primary ratio is “market funds/tangible banking assets”. This ratio expresses the proportion of the balance sheet that credit-sensitive investors and counterparties fund; as such, it measures liability-side volatility and the resultant liquidity risk.
  • #33 An assessment of the liability-side structure of a bank has to be seen in the context of its asset side. A bank can reasonably borrow from credit-sensitive investors if it has corresponding assets in the form of high-quality liquid instruments that it can sell or repo for cash in response to its funding counterparts’ changing behaviour. The primary ratio is “liquid assets / tangible banking assets”. This provides an offset to the “market funding / tangible banking assets” ratio above. Moody’s study shows that banks with relatively low levels of liquid assets had a higher tendency to require support.
  • #34 To measure whether a bank still has buffer to increase loans, the primary ratio is Loan-to-deposit ratio. This ratio is particularly useful to assess potential growth of a bank by measuring conversion rate of deposits to loans. If the ratio is too high, it means that banks might not have enough liquidity to cover any unforeseen fund requirements. If the ratio is too low, banks may not be earning as much as they could be. 75% to 90% can be considered as healthy range. Besides, we should also compare ratio of a bank with its peer.
  • #35 Market Risk Appetite aims at capturing the sensitivity of both the trading and non-trading books to major changes in key financial variables (including interest rates, FX, equity prices, credit spreads). In assessing a bank’s market risk appetite, our starting premise is that the fundamental relationship between risk and expected return indicates that the greater the risk, the higher the expected return. As expected return increases, the volatility of returns, and so the size of potential unexpected losses, increases. Conversely, as expected return decreases, the volatility of returns and so the size of potential unexpected losses decreases.