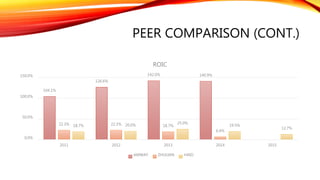
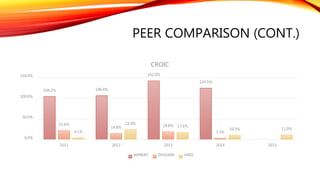
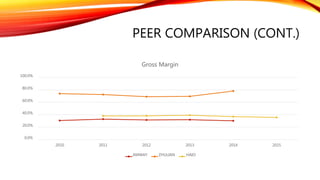
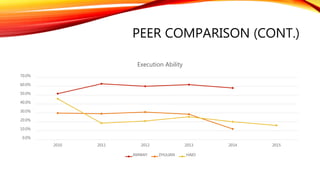
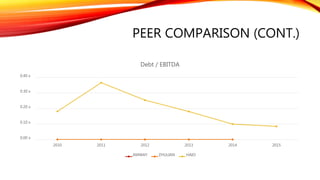
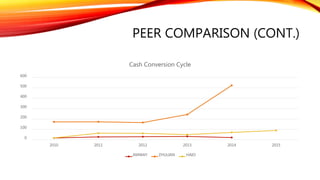
HAIO VS. AMWAY VS.
ZHULIAN
7 December 2015
L. C. Chong
DISCLAIMER
I am NOT an investment advisor nor a financial advisor, and no information provided
here is to be interpreted as a suggestion to buy or sell securities.
Stock analysis in this presentation may not neutral because I have incorporated my
risk appetite and principles in the analysis.
All figures in MYR and in '000s, except per share data
2
DECLARATION OF INTEREST
• At the time of writing, I owned shares of HAIO.
KEEP IN TOUCH
http://lcchong.wordpress.com
https://goo.gl/jjkq4P
SCOPE
• Figures and ratios are based on the figures reported in Annual Report or the latest
Q4 Quarterly Report (QR)
• Comparisons are made merely based on financial figures
• Growth drivers and risks/challenges are not covered here
• Valuation is not covered in this analysis.
CHANGES
• 7 Dec 2015 – First write up in PowerPoint format
PEER COMPARISON (CONT.)
104.1%
126.6%
142.0% 140.9%
22.3% 22.3% 18.7%
6.4%
18.7% 20.0%
25.0%
19.5%
12.7%
0.0%
50.0%
100.0%
150.0%
2011 2012 2013 2014 2015
ROIC
AMWAY ZHULIAN HAIO
PEER COMPARISON (CONT.)
104.2% 106.4%
142.0%
124.5%
21.6%
14.8% 18.8%
3.3%4.1%
23.9%
17.6%
10.5% 11.0%
0.0%
50.0%
100.0%
150.0%
2011 2012 2013 2014 2015
CROIC
AMWAY ZHULIAN HAIO
PEER COMPARISON (CONT.)
0.0%
20.0%
40.0%
60.0%
80.0%
100.0%
2010 2011 2012 2013 2014 2015
Gross Margin
AMWAY ZHULIAN HAIO
PEER COMPARISON (CONT.)
0.0%
10.0%
20.0%
30.0%
40.0%
50.0%
60.0%
70.0%
2010 2011 2012 2013 2014 2015
Execution Ability
AMWAY ZHULIAN HAIO
PEER COMPARISON (CONT.)
0.00 x
0.10 x
0.20 x
0.30 x
0.40 x
2010 2011 2012 2013 2014 2015
Debt / EBITDA
AMWAY ZHULIAN HAIO
PEER COMPARISON (CONT.)
0
100
200
300
400
500
600
2010 2011 2012 2013 2014 2015
Cash Conversion Cycle
AMWAY ZHULIAN HAIO
PEER COMPARISON (CONT.)
• Obviously, AMWAY performance is the best among three companies
• HAIO performance is better than ZHULIAN in recent years
• Cash Conversion Cycle of ZHULIAN is quite alerting because of extremely high level
of inventory.

HAIO vs. AMWAY vs. ZHULIAN