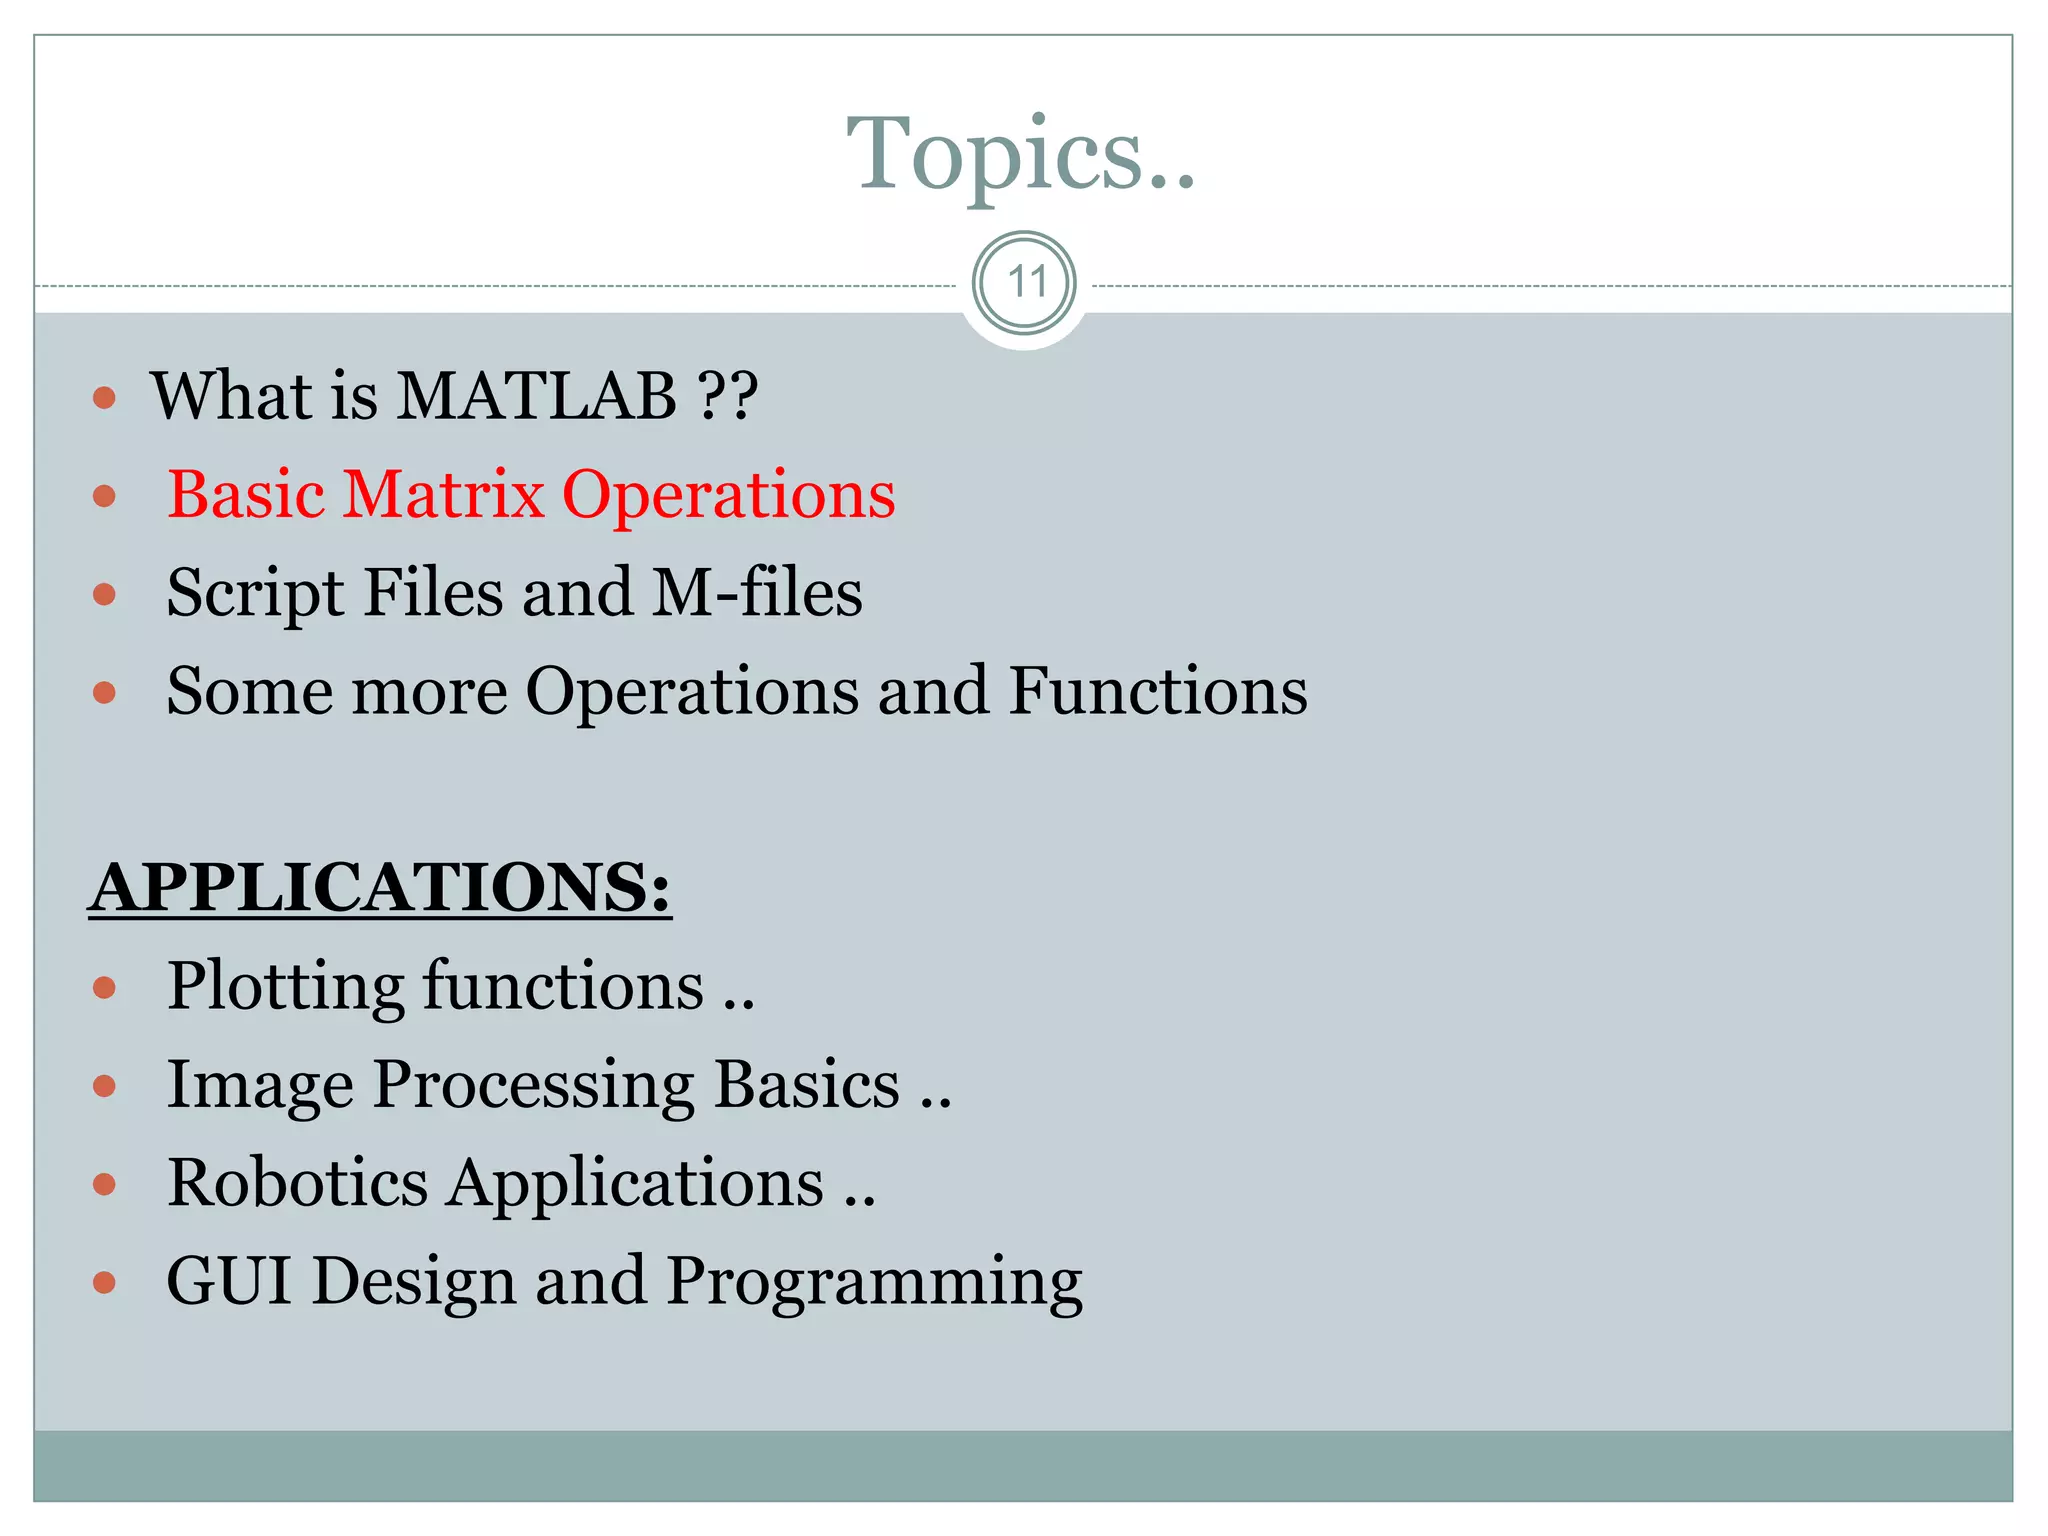
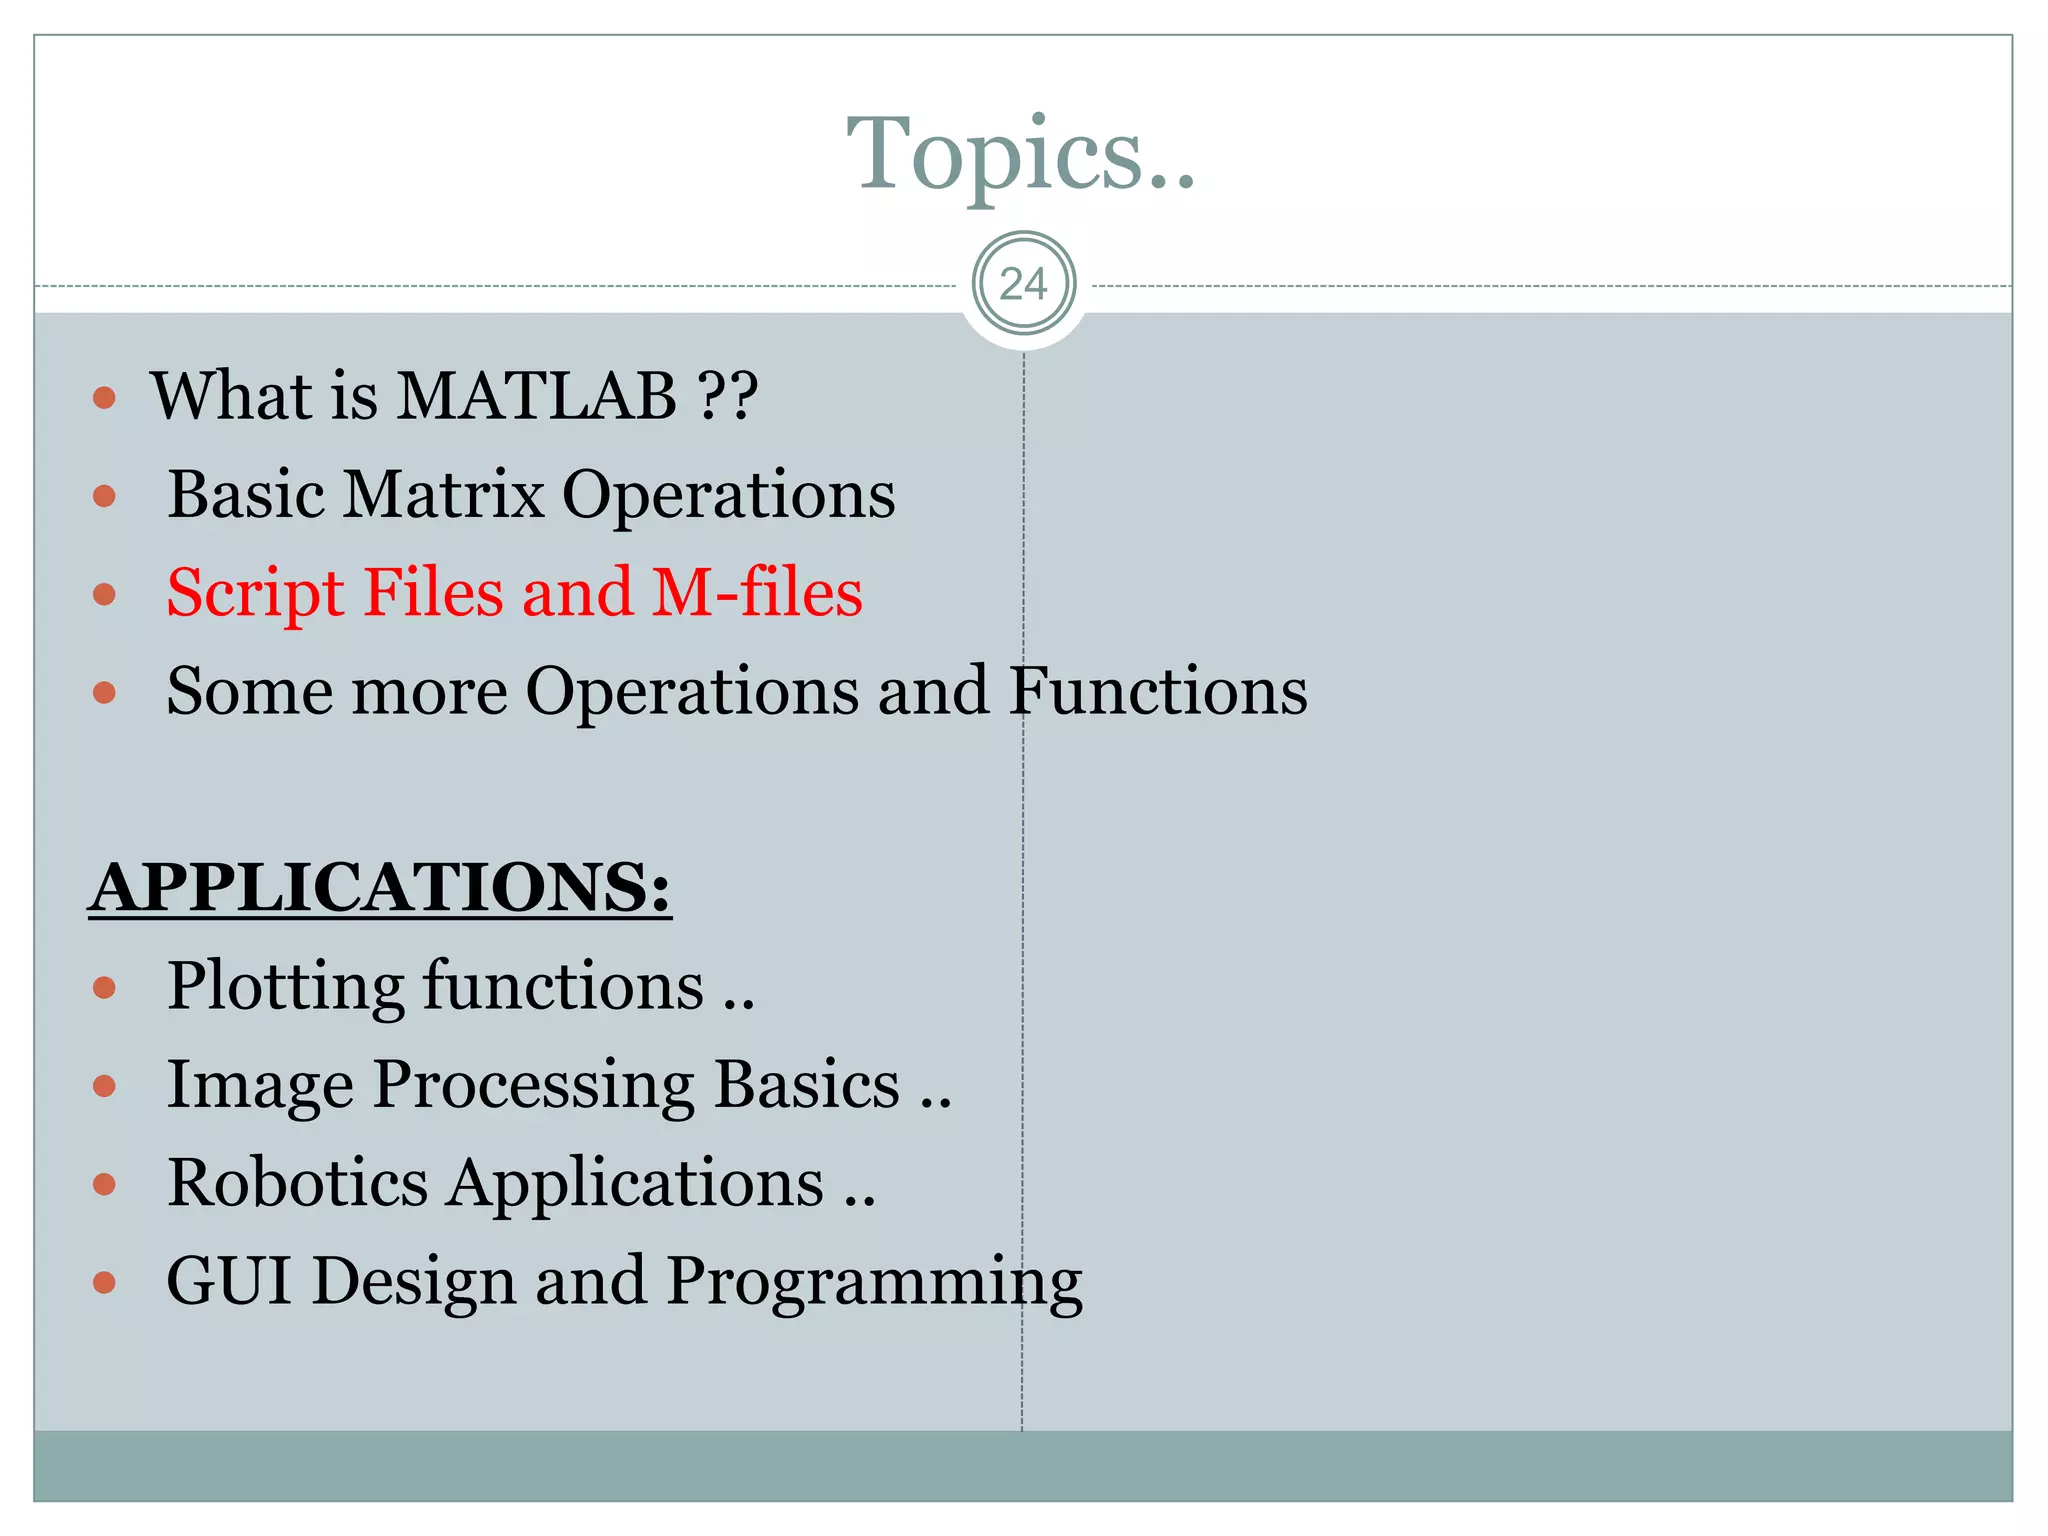
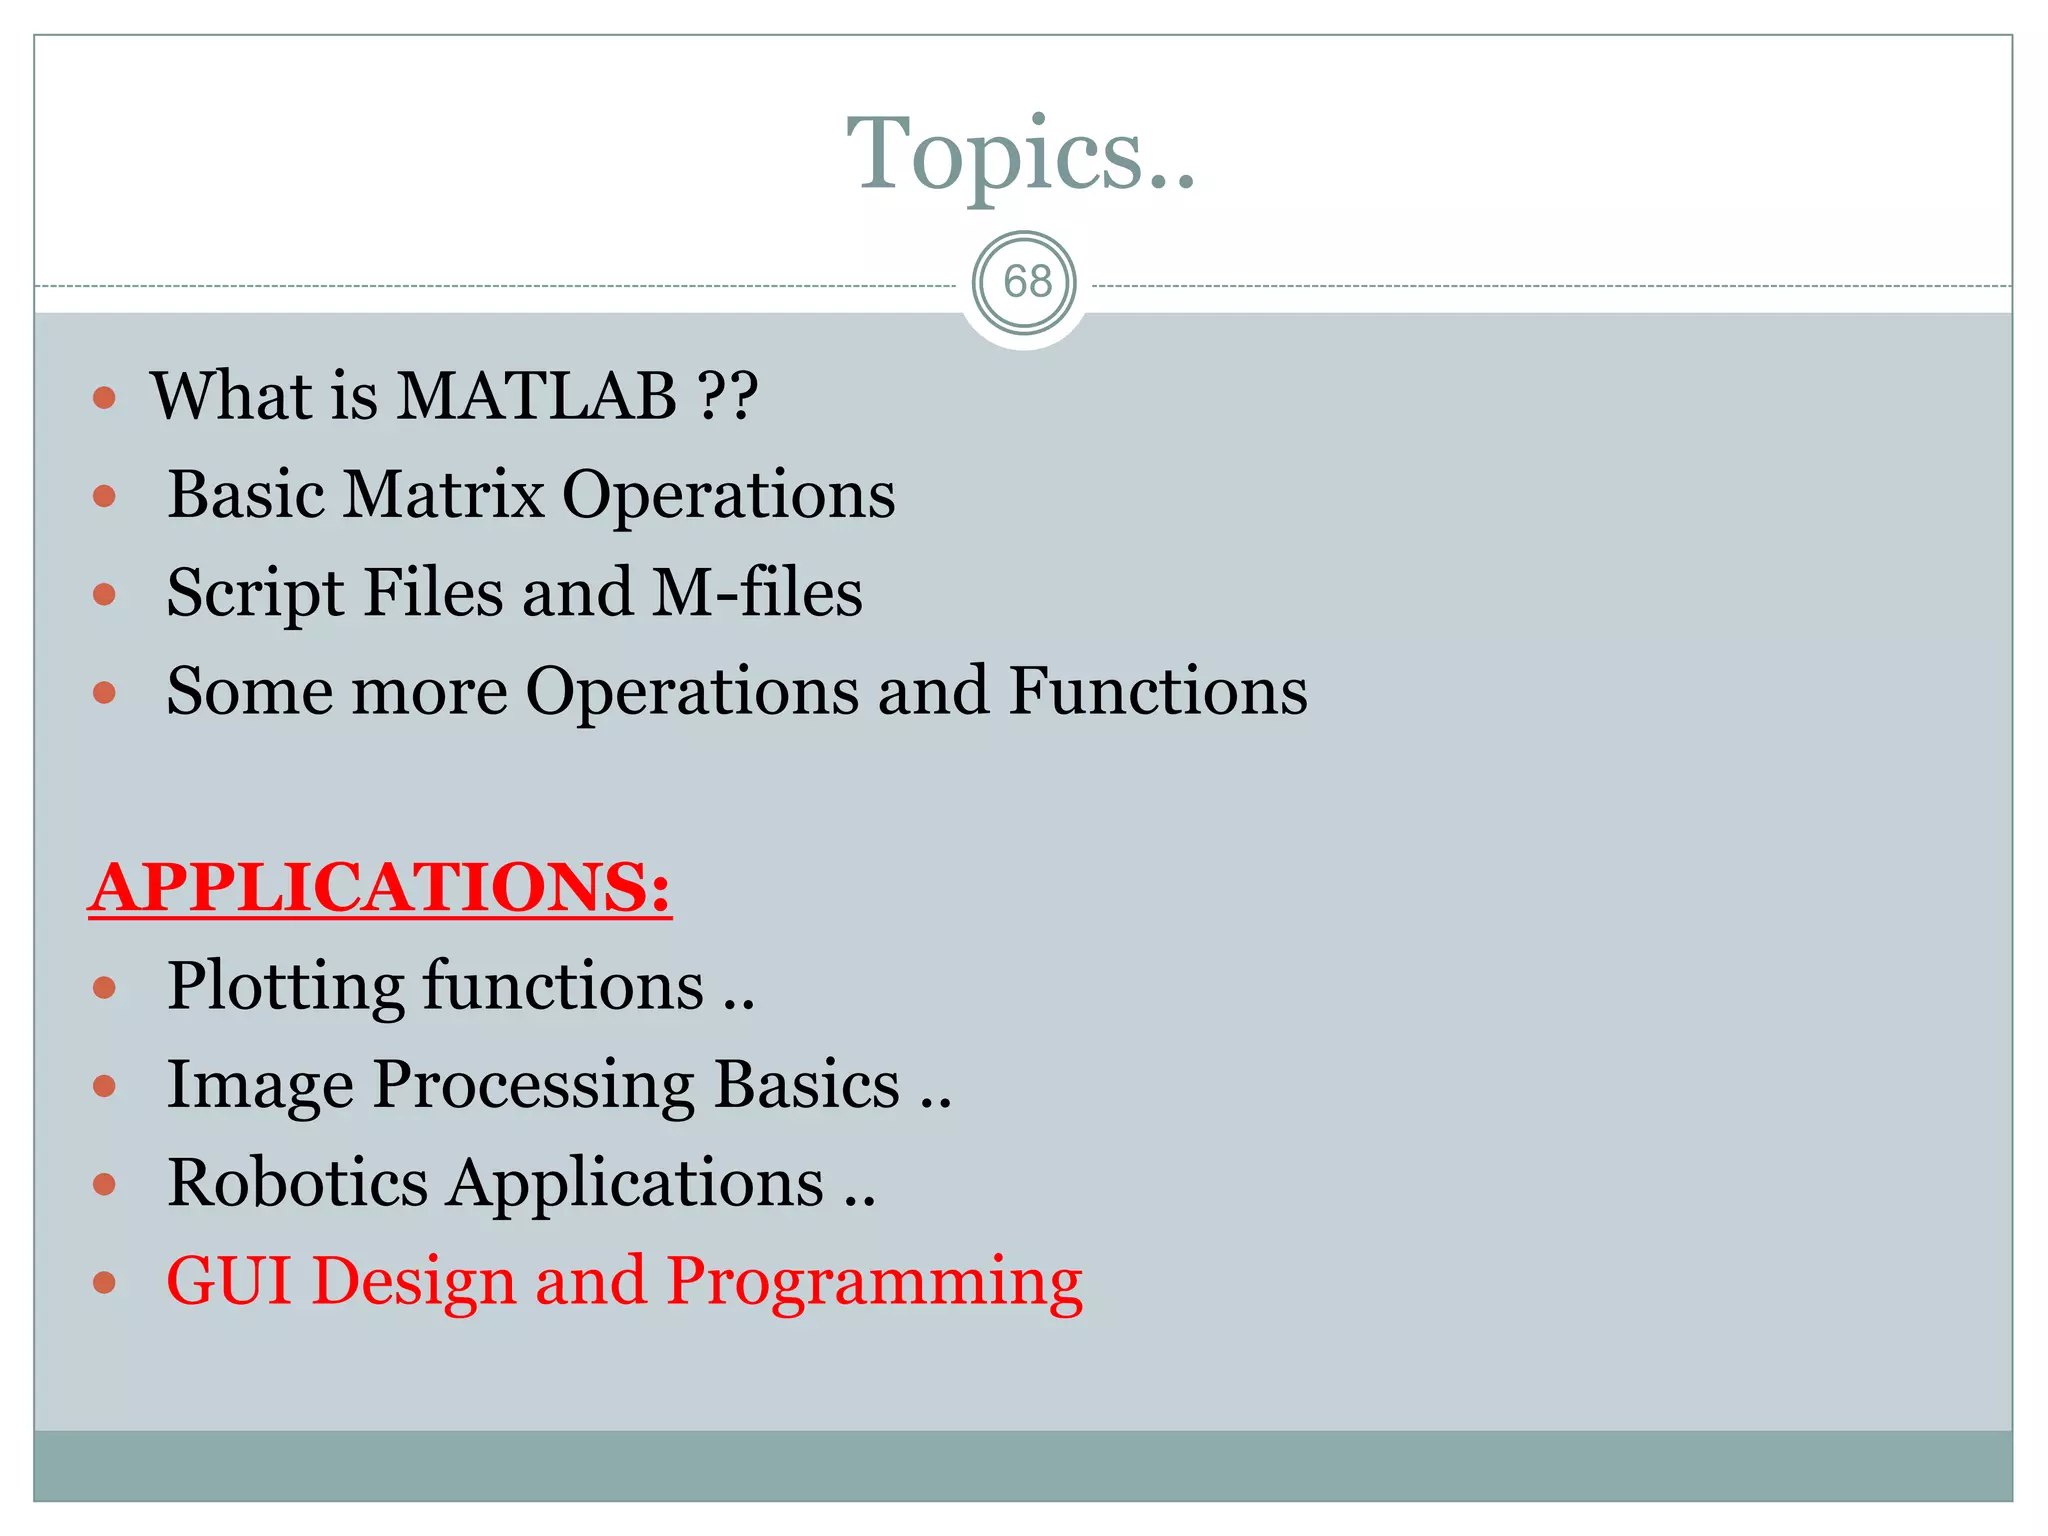
This document provides an introduction to MATLAB. It discusses what MATLAB is, how to perform basic matrix operations and use script files and M-files. It also covers some common MATLAB commands and functions. MATLAB can be used for applications like plotting, image processing, robotics and GUI design. Key topics covered include matrices, vectors, scalars, matrix operations, logical and relational operators, selection and repetition structures, and reading/writing data files. Plotting functions allow creating graphs and 3D surface plots. Image processing, robotics and GUI design are listed as potential application areas.
![18
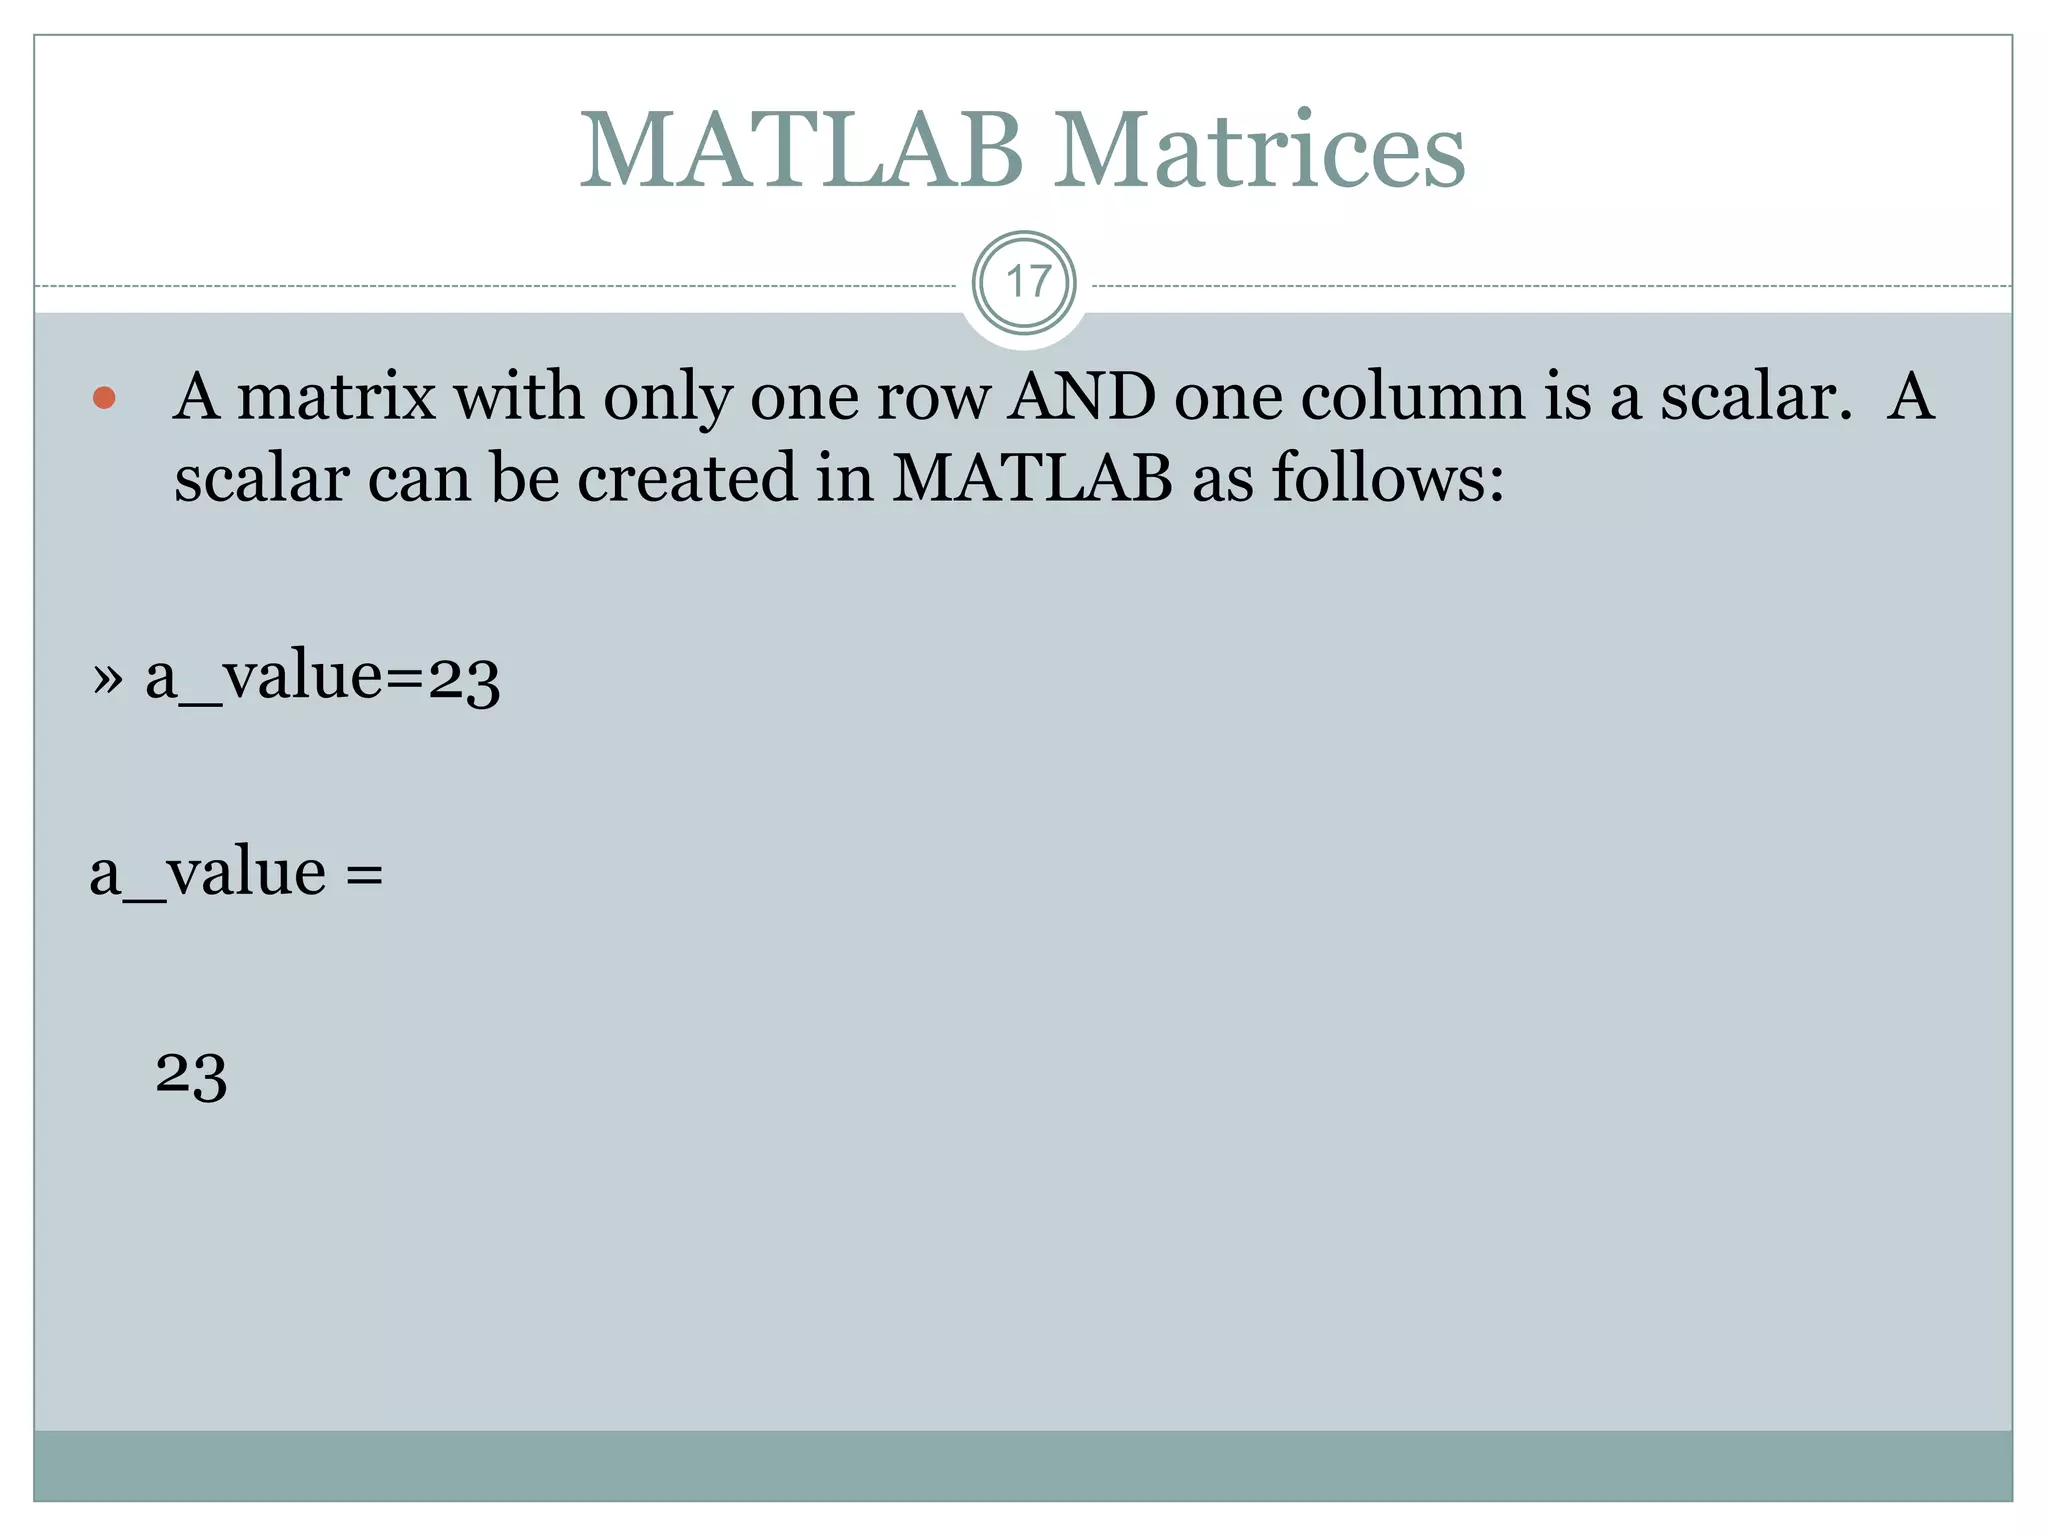
MATLAB Matrices
A matrix with only one row is called a row vector. A row
vector can be created in MATLAB as follows (note the
commas):
» rowvec = [12 , 14 , 63]
rowvec =
12 14 63](https://image.slidesharecdn.com/matlabanilkumar-220208152952/75/Matlab-anilkumar-18-2048.jpg)
![19
MATLAB Matrices
A matrix with only one column is called a column vector.
A column vector can be created in MATLAB as follows
(note the semicolons):
» colvec = [13 ; 45 ; -2]
colvec =
13
45
-2](https://image.slidesharecdn.com/matlabanilkumar-220208152952/75/Matlab-anilkumar-19-2048.jpg)
![20
MATLAB Matrices
A matrix can be created in MATLAB as follows (note the
commas AND semicolons):
» matrix = [1 , 2 , 3 ; 4 , 5 ,6 ; 7 , 8 , 9]
matrix =
1 2 3
4 5 6
7 8 9](https://image.slidesharecdn.com/matlabanilkumar-220208152952/75/Matlab-anilkumar-20-2048.jpg)
![22
MATLAB Matrices
A column vector can be
extracted from a matrix.
As an example we create a
matrix below:
» matrix=[1,2,3;4,5,6;7,8,9]
matrix =
1 2 3
4 5 6
7 8 9
Here we extract column 2
of the matrix and make a
column vector:
» col_two=matrix( : , 2)
col_two =
2
5
8](https://image.slidesharecdn.com/matlabanilkumar-220208152952/75/Matlab-anilkumar-22-2048.jpg)
![23
MATLAB Matrices
A row vector can be
extracted from a matrix.
As an example we create
a matrix below:
» matrix=[1,2,3;4,5,6;7,8,9]
matrix =
1 2 3
4 5 6
7 8 9
Here we extract row 2 of
the matrix and make a
row vector. Note that
the 2:2 specifies the
second row and the 1:3
specifies which columns
of the row.
» rowvec=matrix(2 : 2 , 1 :
3)
rowvec =
4 5 6](https://image.slidesharecdn.com/matlabanilkumar-220208152952/75/Matlab-anilkumar-23-2048.jpg)
![34
Scalar - Matrix Addition
» a=3;
» b=[1, 2, 3;4, 5, 6]
b =
1 2 3
4 5 6
» c= b+a % Add a to each element of b
c =
4 5 6
7 8 9](https://image.slidesharecdn.com/matlabanilkumar-220208152952/75/Matlab-anilkumar-34-2048.jpg)
![35
Scalar - Matrix Subtraction
» a=3;
» b=[1, 2, 3;4, 5, 6]
b =
1 2 3
4 5 6
» c = b - a %Subtract a from each element of b
c =
-2 -1 0
1 2 3](https://image.slidesharecdn.com/matlabanilkumar-220208152952/75/Matlab-anilkumar-35-2048.jpg)
![36
Scalar - Matrix Multiplication
» a=3;
» b=[1, 2, 3; 4, 5, 6]
b =
1 2 3
4 5 6
» c = a * b % Multiply each element of b by a
c =
3 6 9
12 15 18](https://image.slidesharecdn.com/matlabanilkumar-220208152952/75/Matlab-anilkumar-36-2048.jpg)
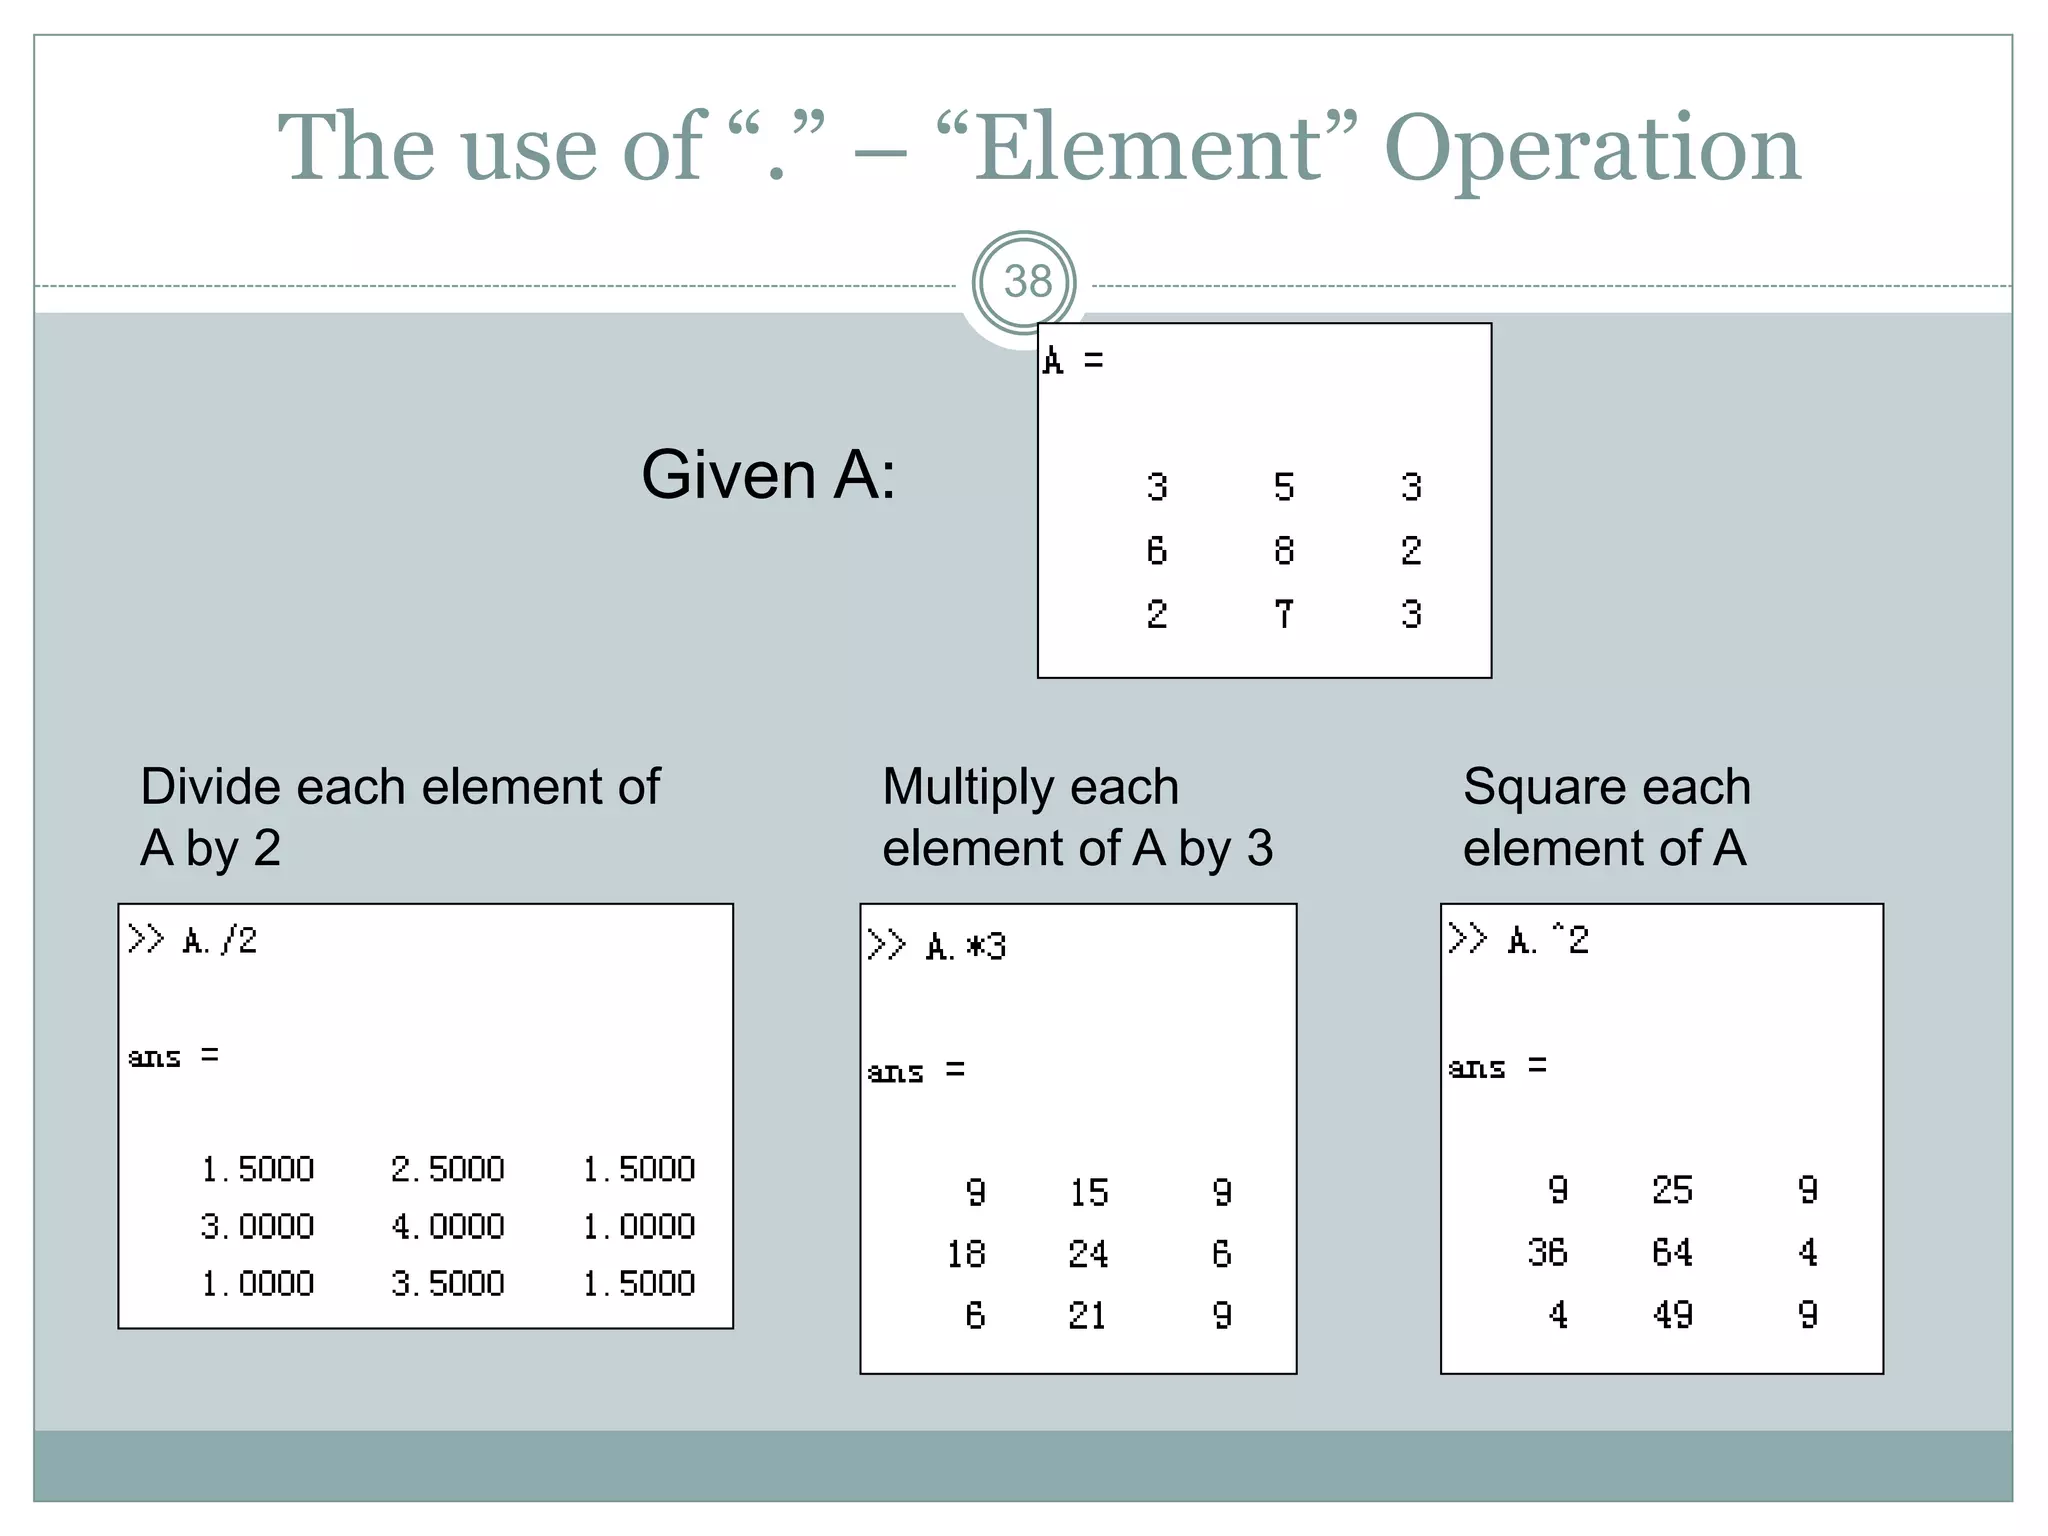
![37
Scalar - Matrix Division
» a=3;
» b=[1, 2, 3; 4, 5, 6]
b =
1 2 3
4 5 6
» c = b / a % Divide each element of b by a
c =
0.3333 0.6667 1.0000
1.3333 1.6667 2.0000](https://image.slidesharecdn.com/matlabanilkumar-220208152952/75/Matlab-anilkumar-37-2048.jpg)
![43
Plot
PLOT Linear plot.
PLOT(X,Y) plots vector Y
versus vector X
PLOT(Y) plots the columns of
Y versus their index
PLOT(X,Y,S) with plot
symbols and colors
See also SEMILOGX,
SEMILOGY, TITLE,
XLABEL, YLABEL, AXIS,
AXES, HOLD, COLORDEF,
LEGEND, SUBPLOT...
x = [-3 -2 -1 0 1 2 3];
y1 = (x.^2) -1;
plot(x, y1,'bo-.');
Example](https://image.slidesharecdn.com/matlabanilkumar-220208152952/75/Matlab-anilkumar-43-2048.jpg)
![46
Subplot
SUBPLOT Create axes in tiled
positions.
SUBPLOT(m,n,p), or
SUBPLOT(mnp), breaks the Figure
window into an m-by-n matrix of
small axes
x = [-3 -2 -1 0 1 2 3];
y1 = (x.^2) -1;
% Plot y1 on the top
subplot(2,1,1);
plot(x, y1,'bo-.');
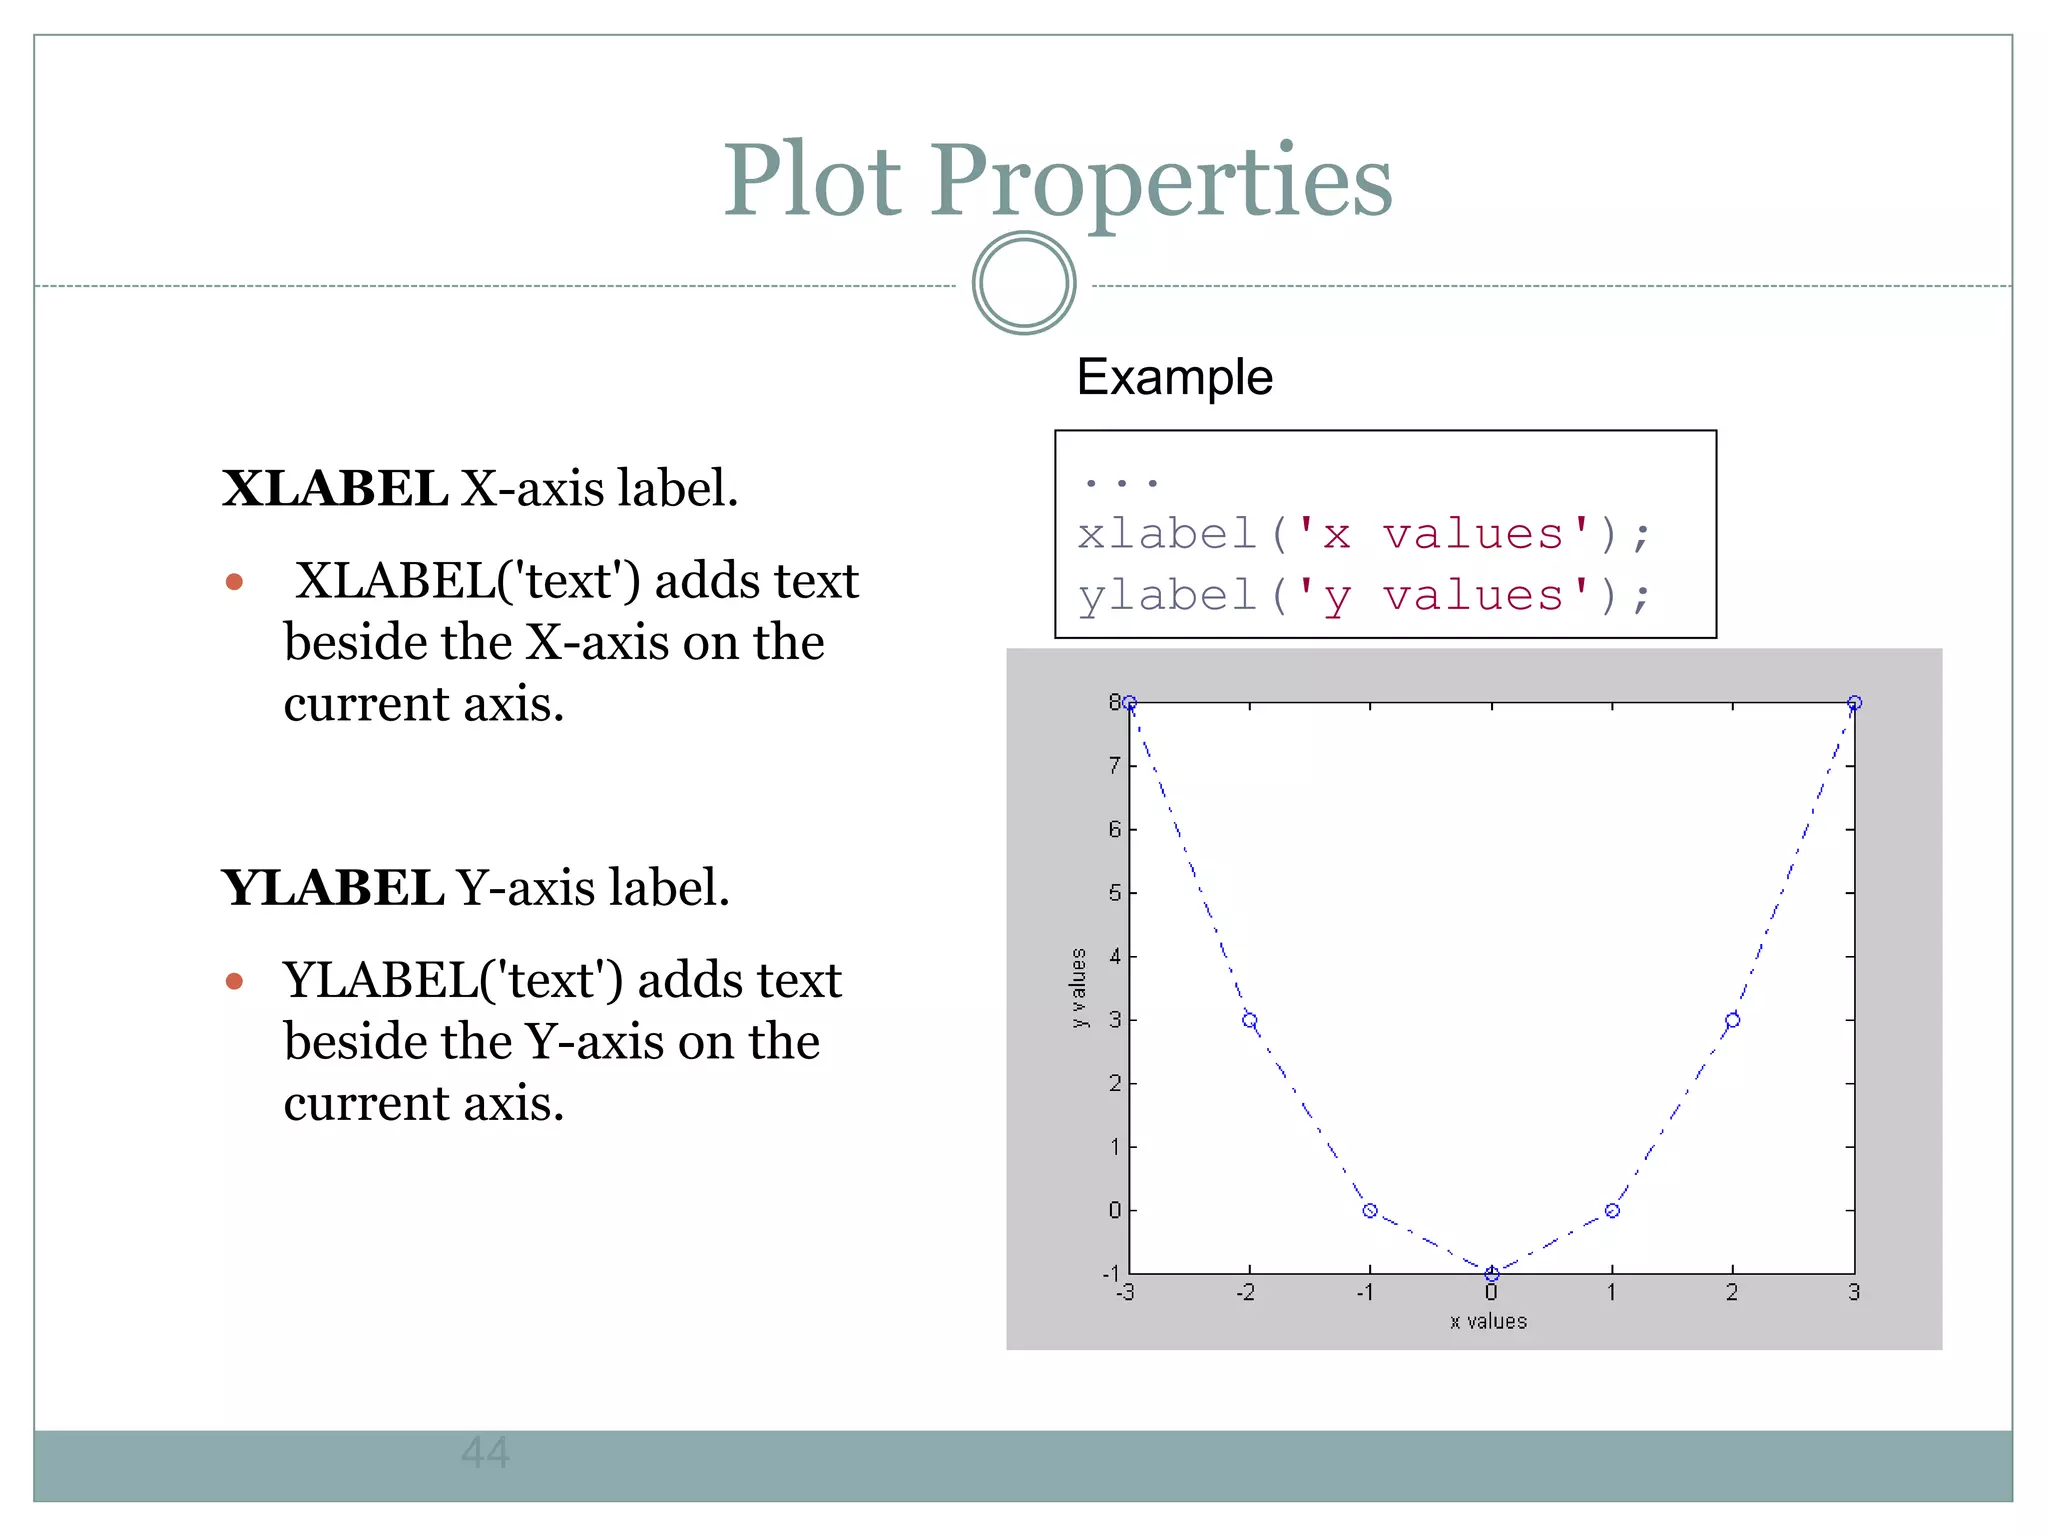
xlabel('x values');
ylabel('y values');
% Plot y2 on the bottom
subplot(2,1,2);
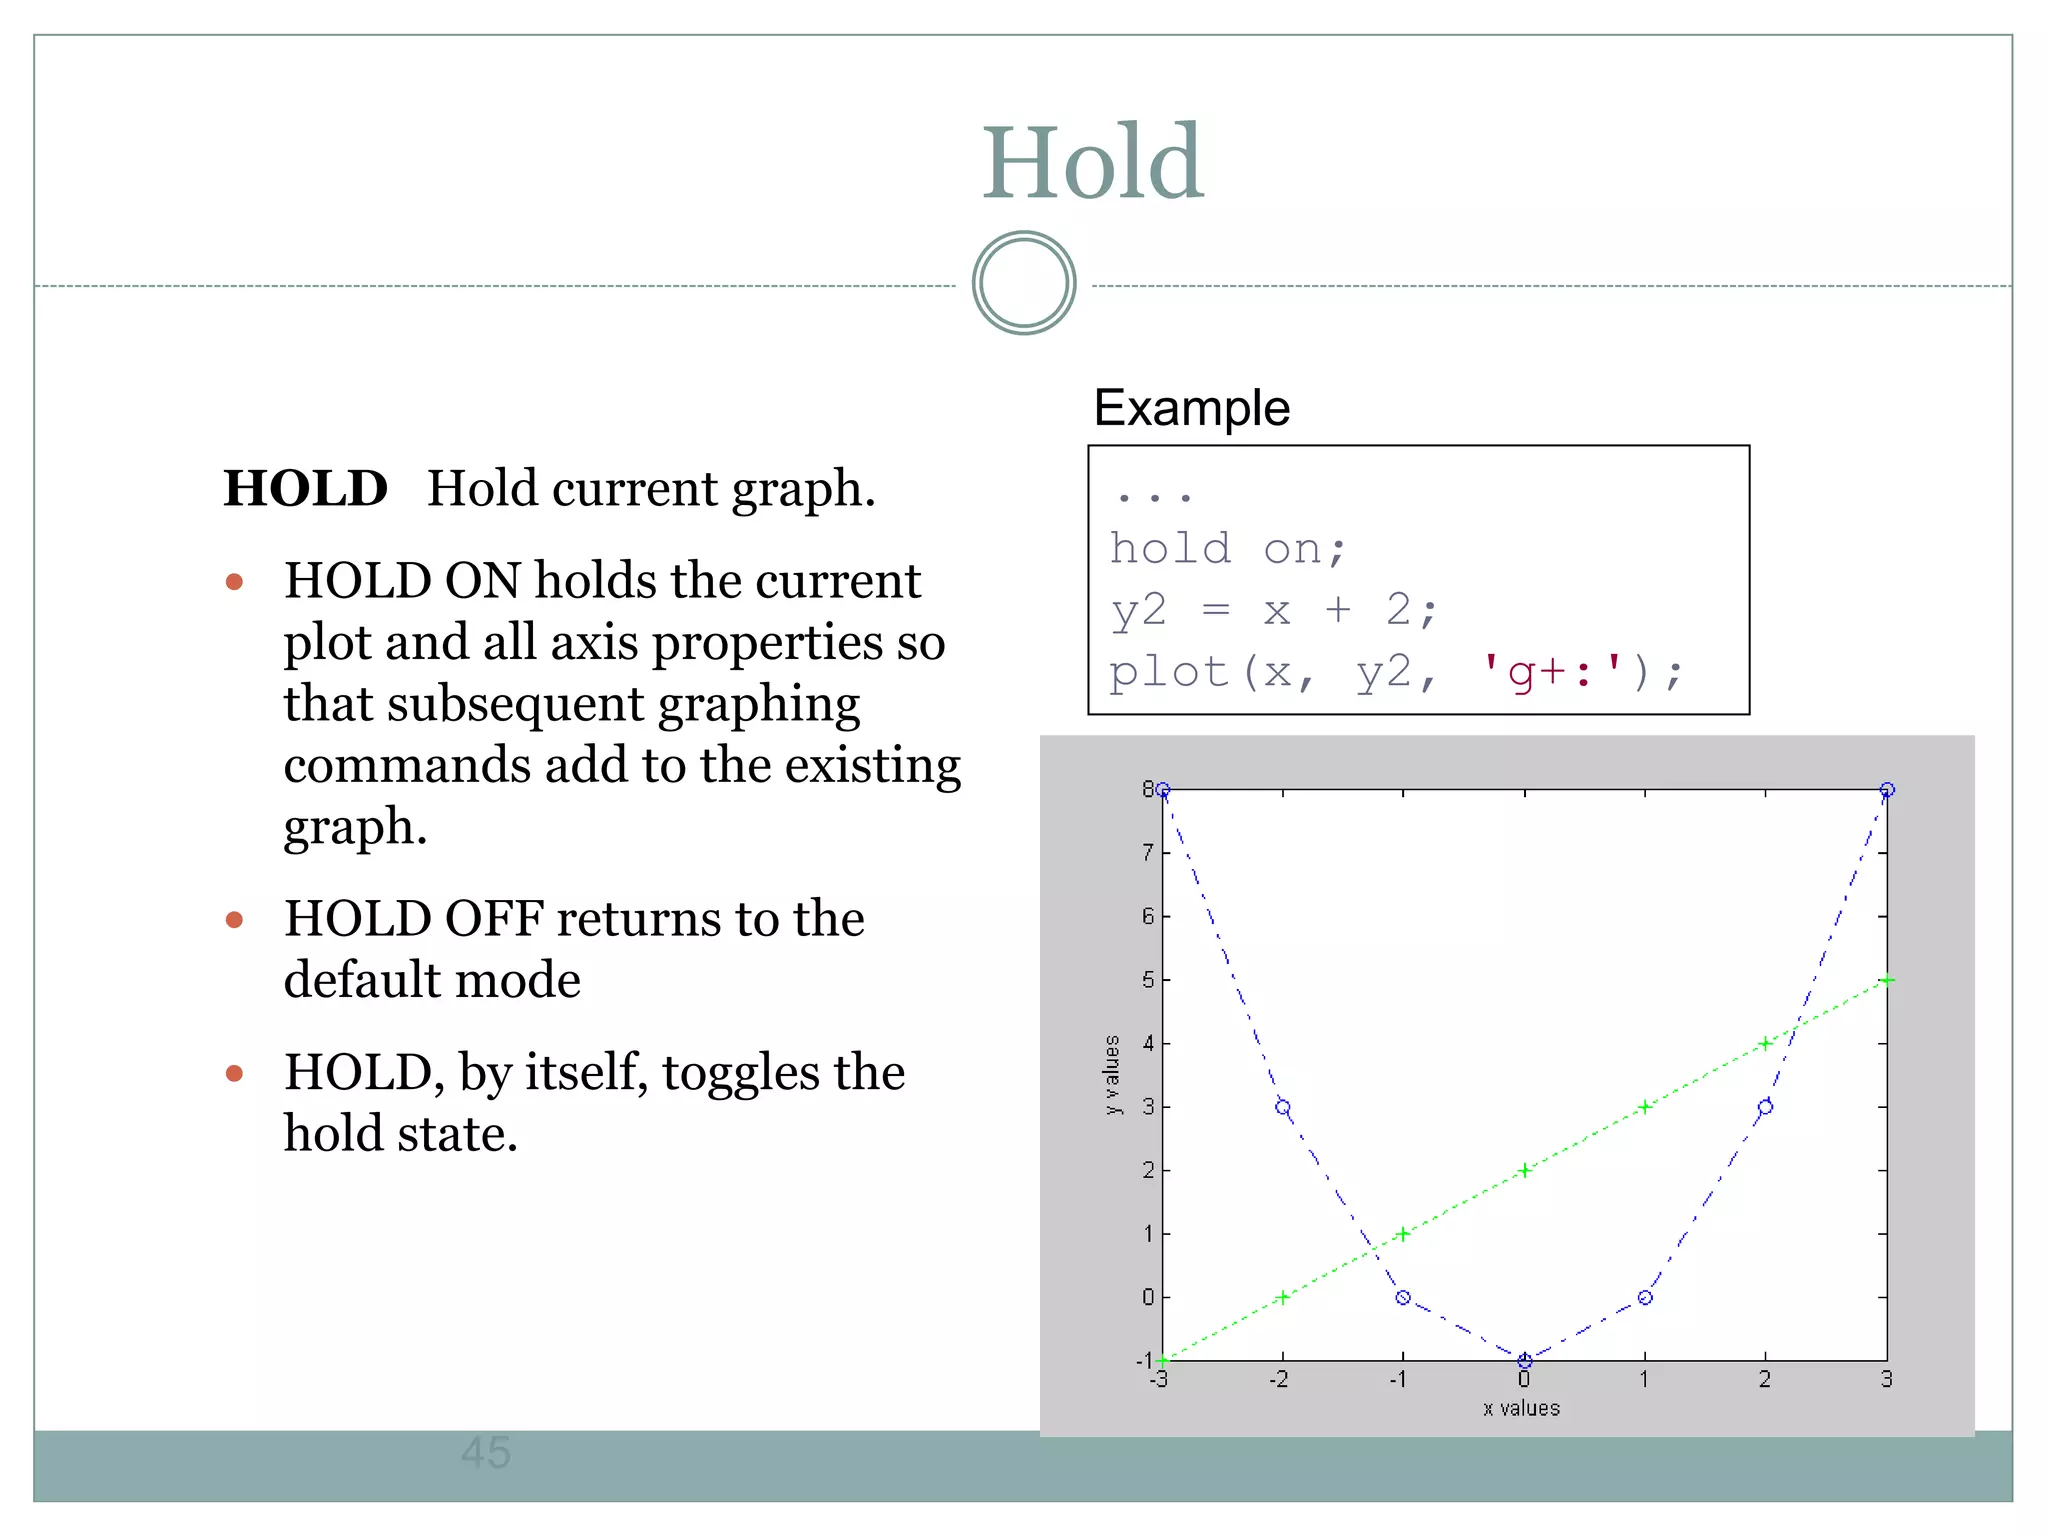
y2 = x + 2;
plot(x, y2, 'g+:');
Example](https://image.slidesharecdn.com/matlabanilkumar-220208152952/75/Matlab-anilkumar-46-2048.jpg)
![47
Figure
FIGURE Create figure window.
FIGURE, by itself, creates a
new figure window, and
returns its handle.
x = [-3 -2 -1 0 1 2 3];
y1 = (x.^2) -1;
% Plot y1 in the 1st Figure
plot(x, y1,'bo-.');
xlabel('x values');
ylabel('y values');
% Plot y2 in the 2nd Figure
figure
y2 = x + 2;
plot(x, y2, 'g+:');
Example](https://image.slidesharecdn.com/matlabanilkumar-220208152952/75/Matlab-anilkumar-47-2048.jpg)
![48
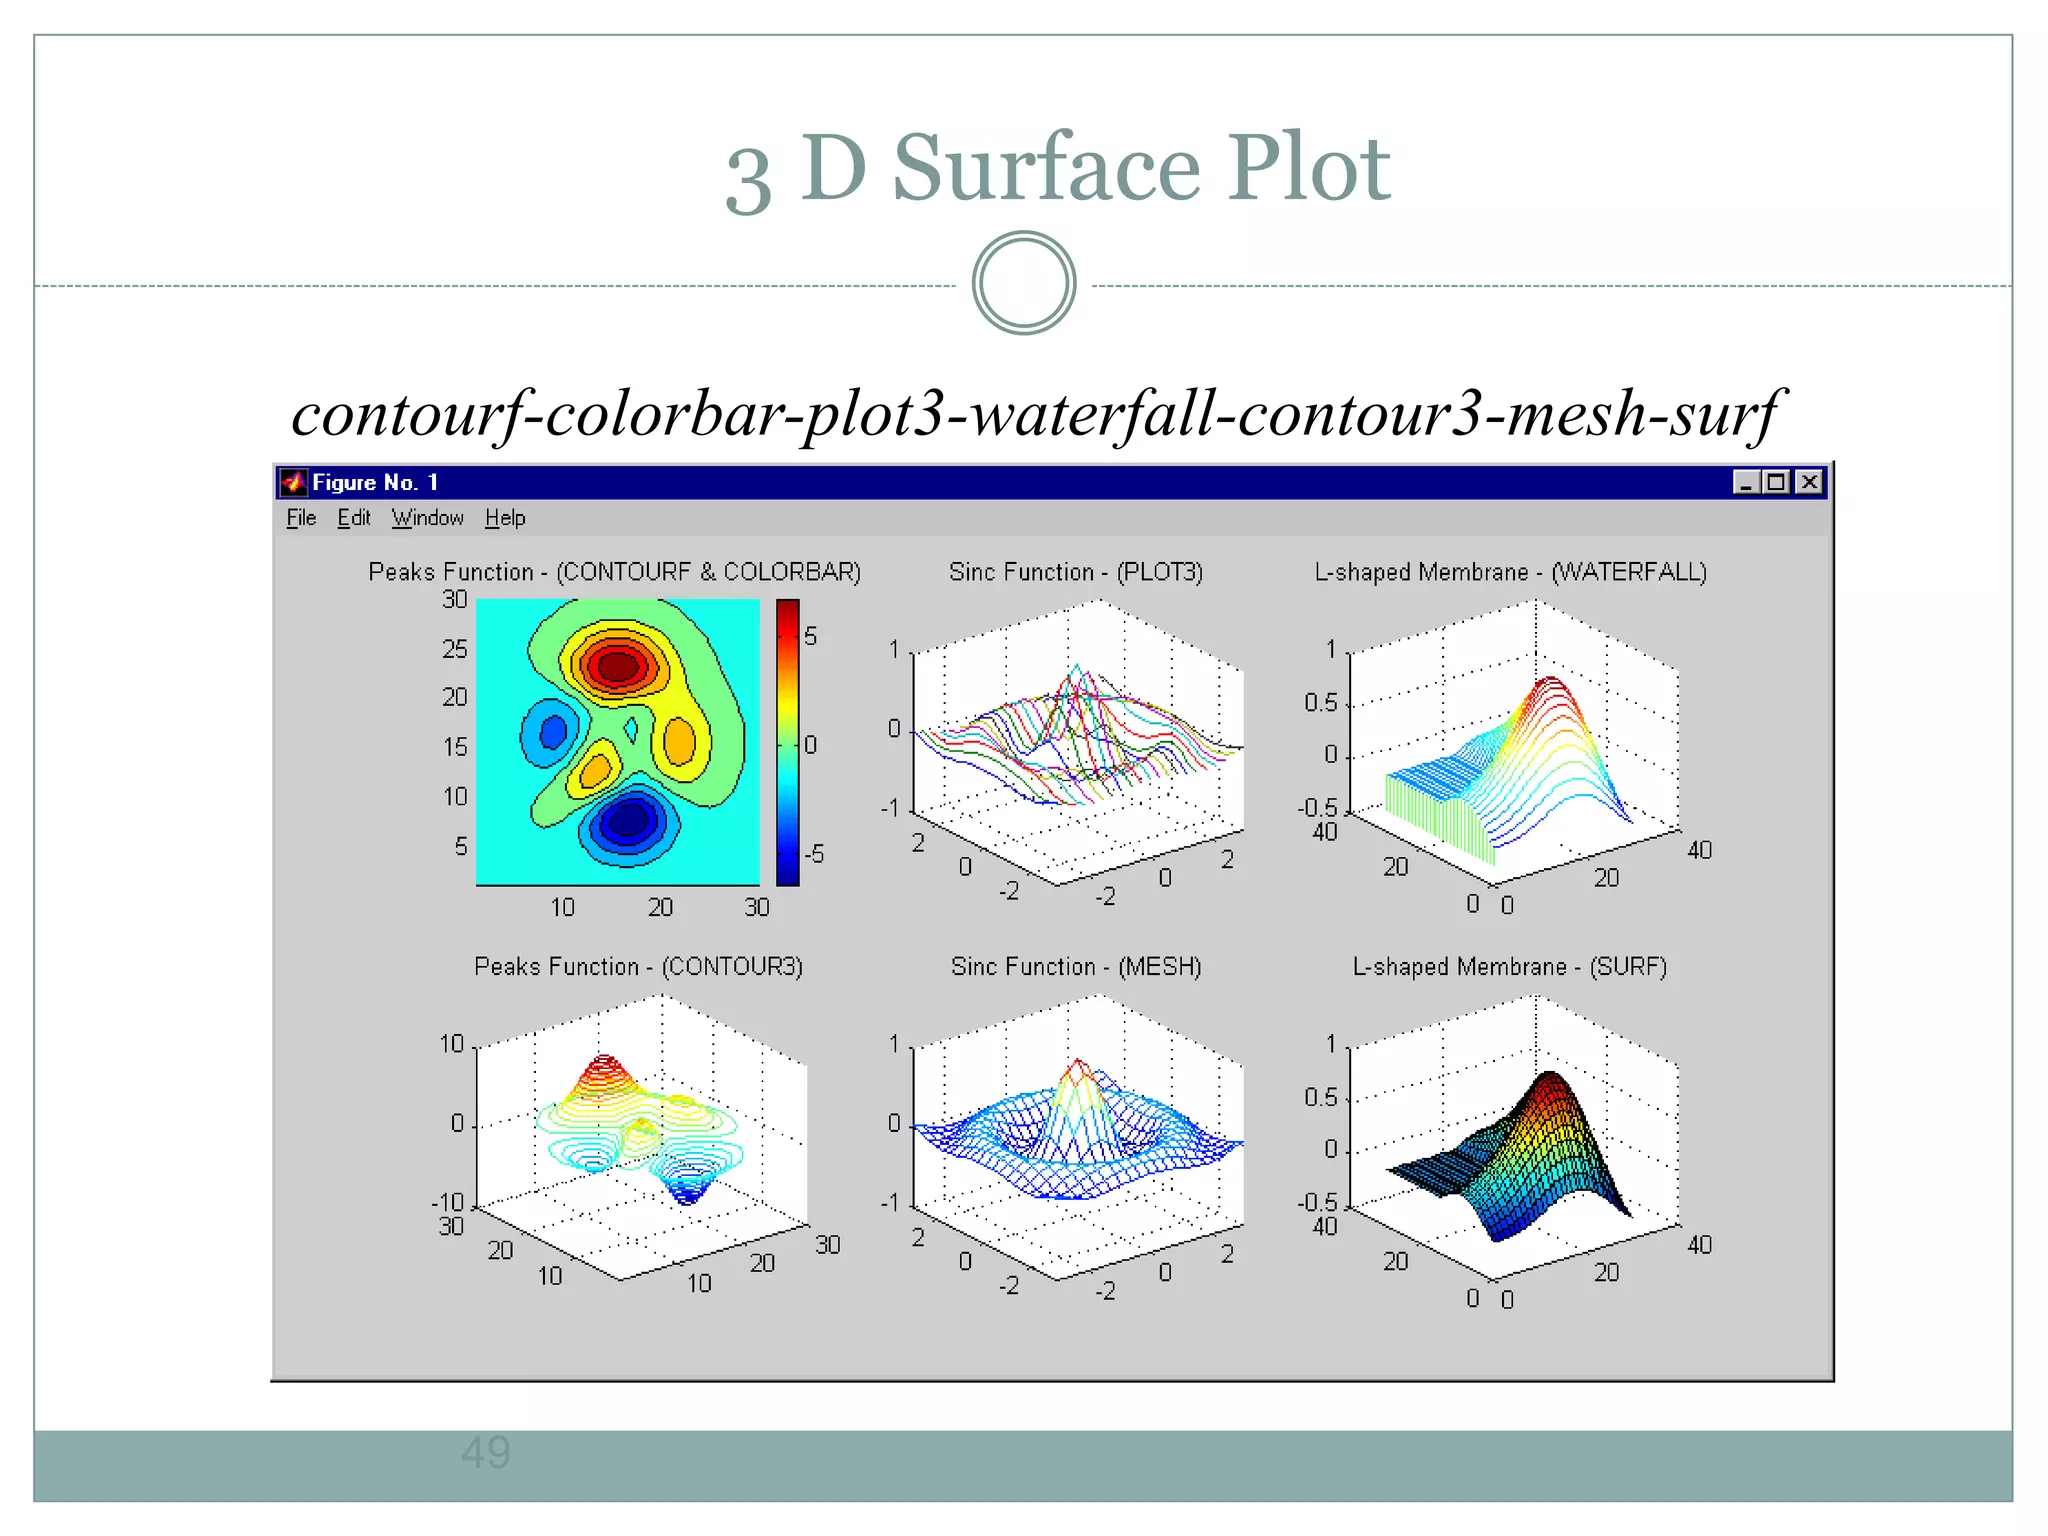
Surface Plot
x = 0:0.1:2;
y = 0:0.1:2;
[xx, yy] = meshgrid(x,y);
zz=sin(xx.^2+yy.^2);
surf(xx,yy,zz)
xlabel('X axes')
ylabel('Y axes')](https://image.slidesharecdn.com/matlabanilkumar-220208152952/75/Matlab-anilkumar-48-2048.jpg)
![50
Convolution
The behavior of a linear, continuous-time, time-invariant system with
input signal x(t) and output signal y(t) is described by the convolution
integral
- h(t), assumed known, the response of the system to a unit impulse
input
For example,
x = [1 1 1 1 1]; [1 1 1 1 1]
h = [0 1 2 3]; [3 2 1 0]
conv(x,h)
yields y = [0 1 3 6 6 6 5 3]
stem(y);
ylabel(‘Conv');
xlabel(‘sample number’);](https://image.slidesharecdn.com/matlabanilkumar-220208152952/75/Matlab-anilkumar-50-2048.jpg)
![53
53
MATLAB Image Types
Indexed images : m-by-3 color map
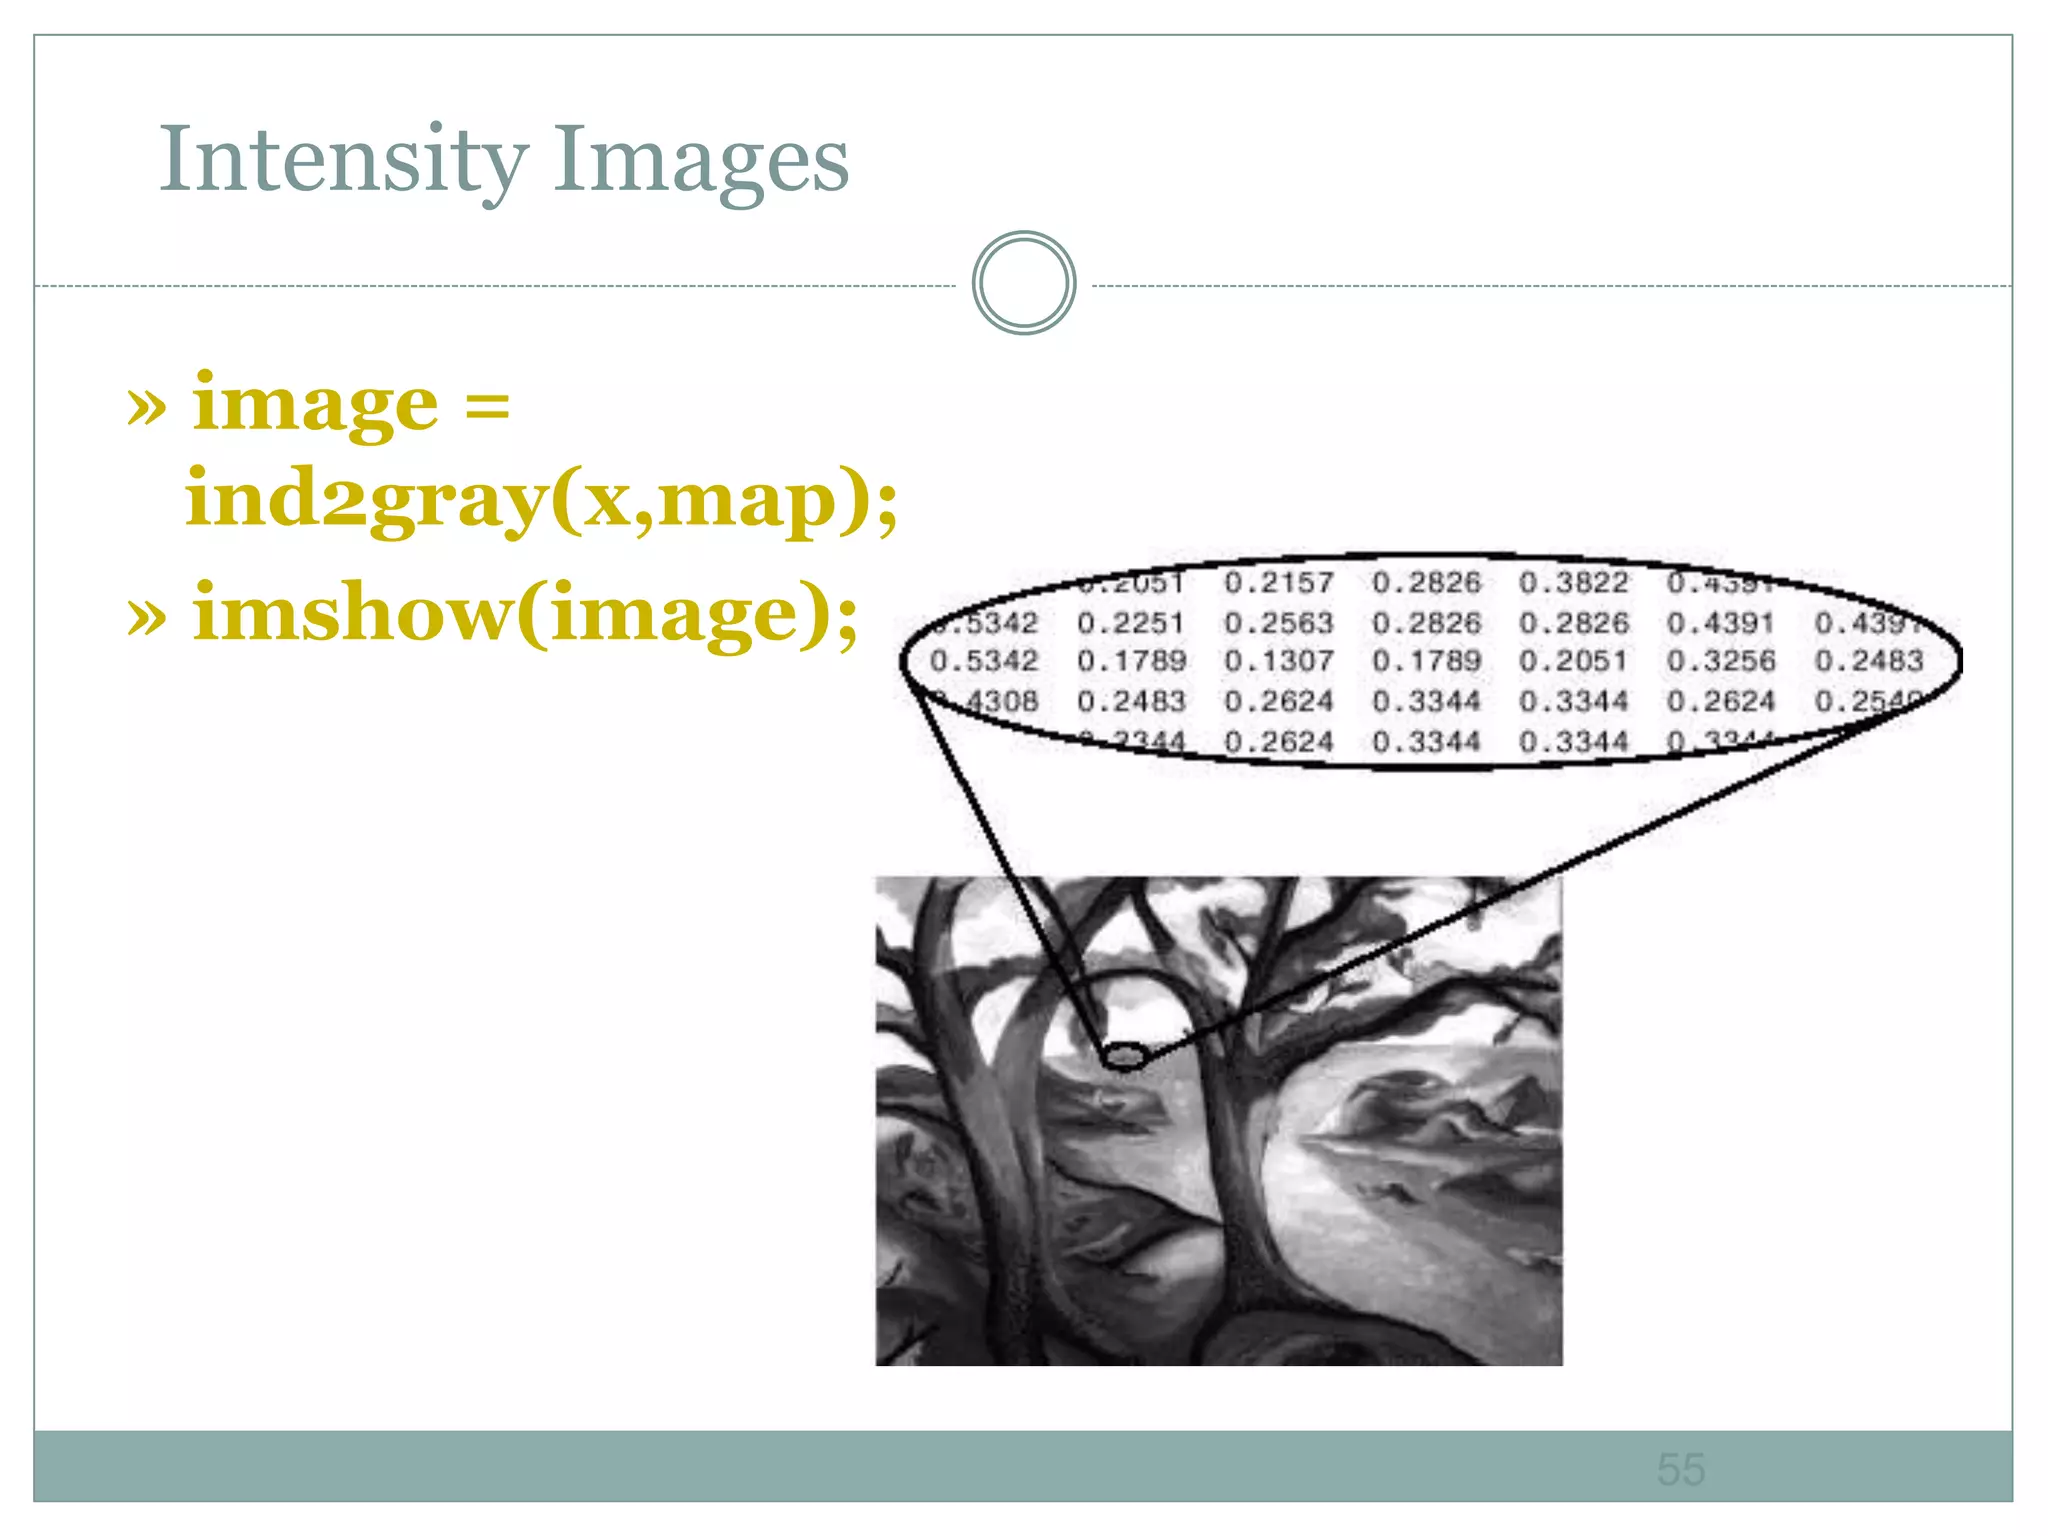
Intensity images : [0,1] or uint8
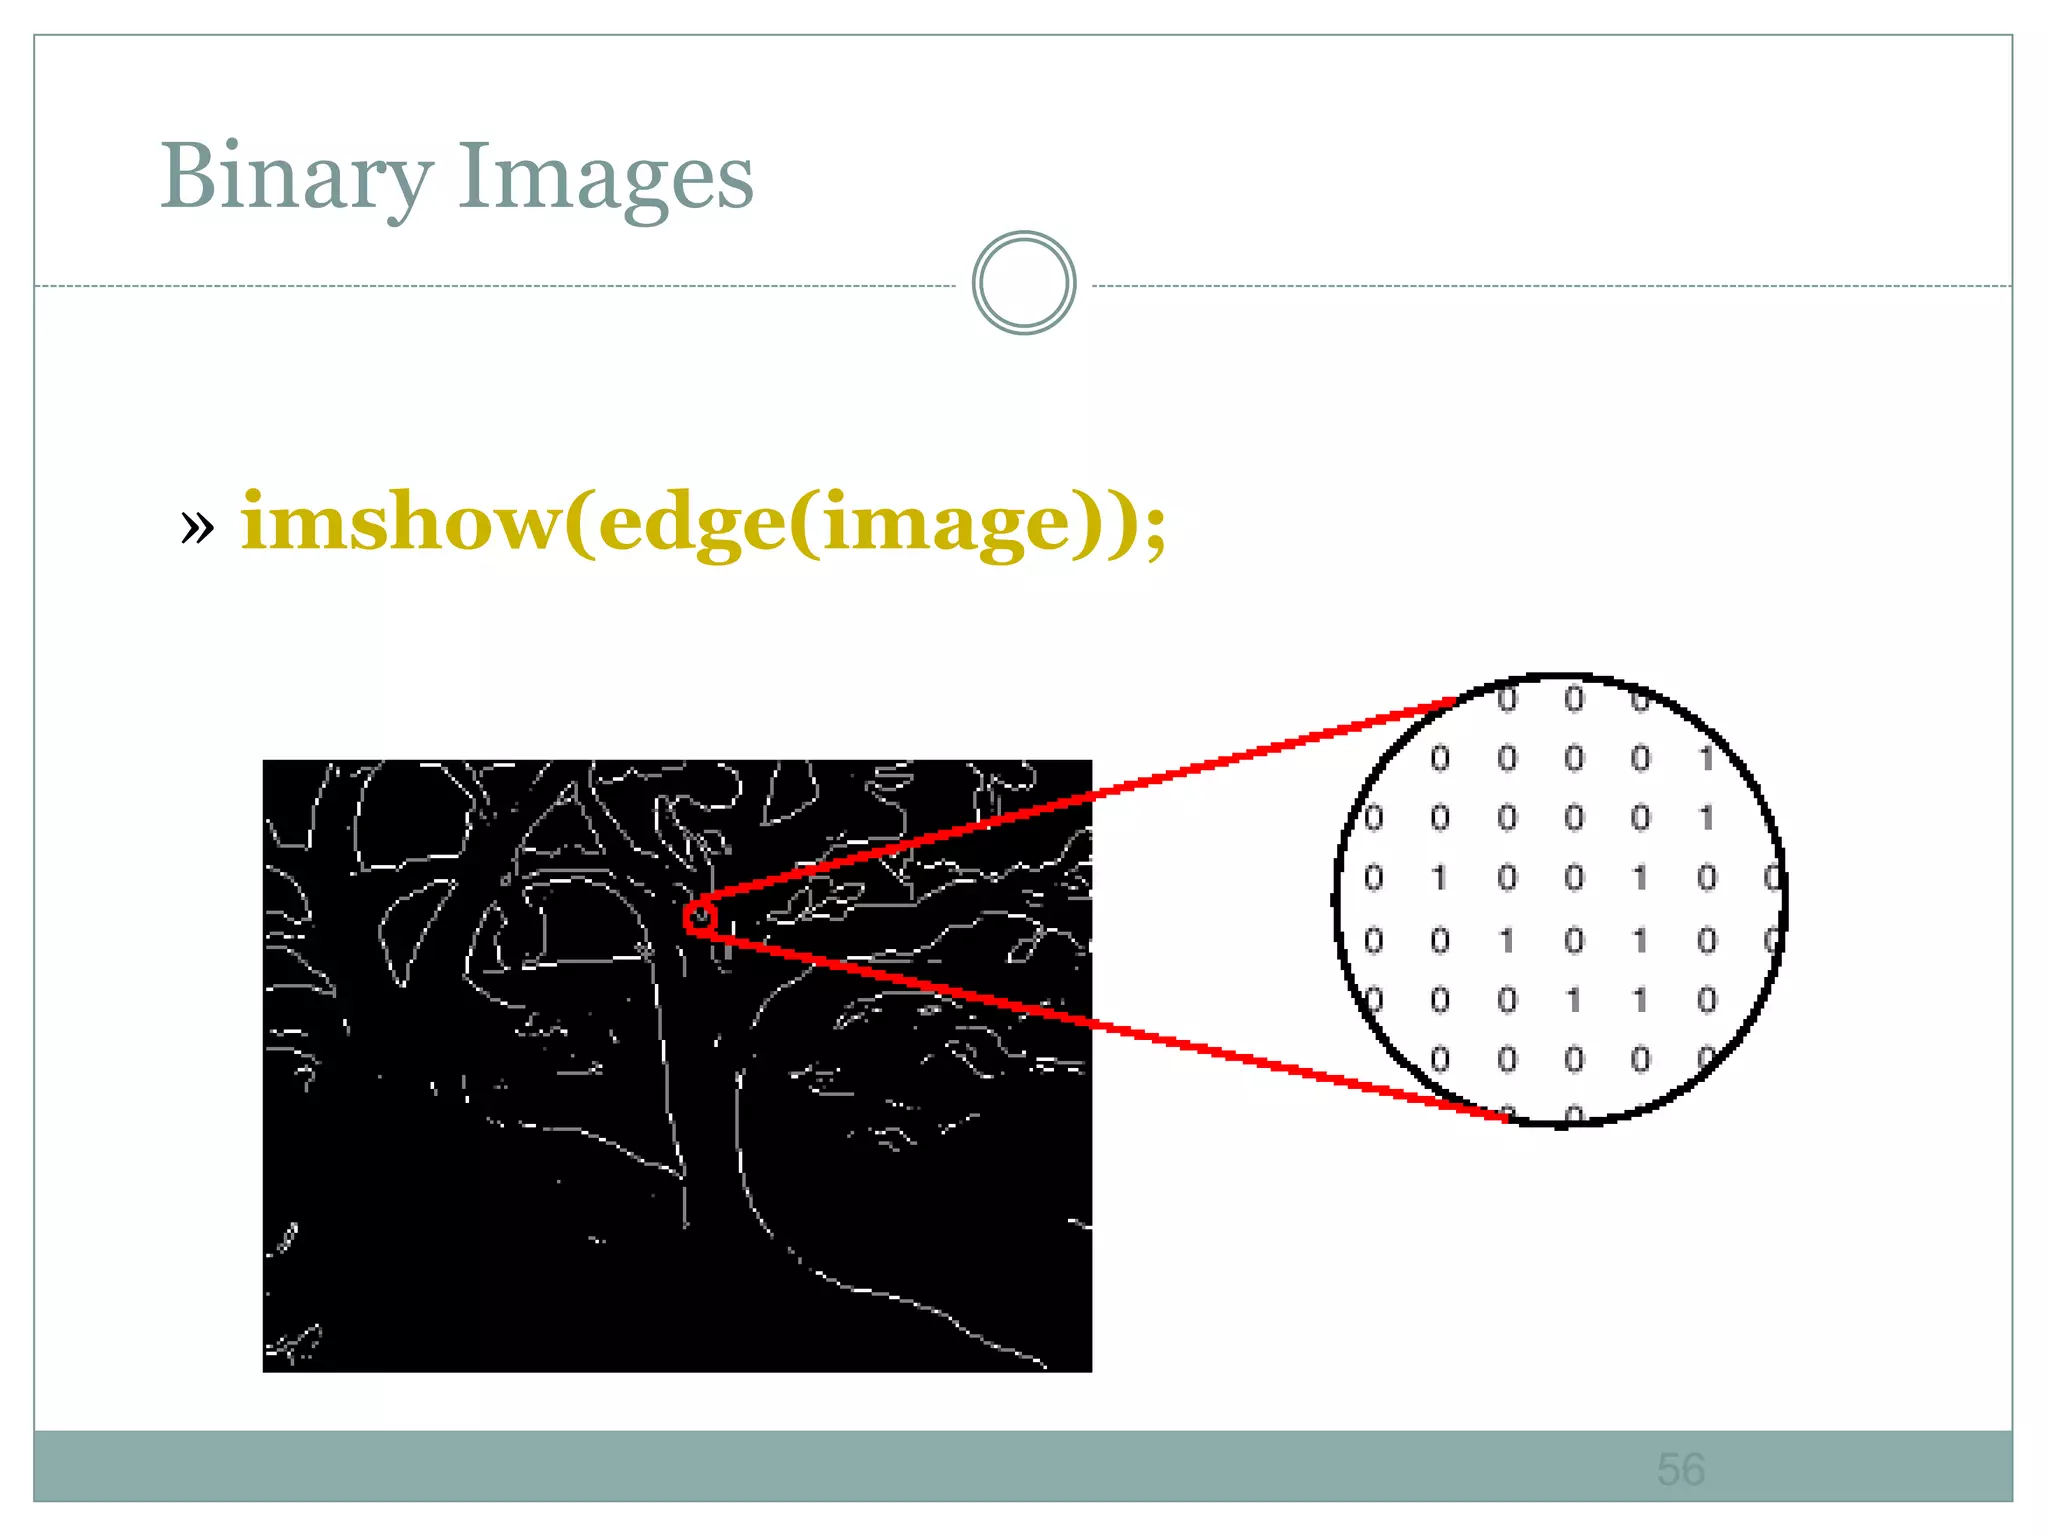
Binary images : {0,1}
RGB images : m-by-n-by-3](https://image.slidesharecdn.com/matlabanilkumar-220208152952/75/Matlab-anilkumar-53-2048.jpg)
![54
54
Indexed Images
» [x,map] =
imread('trees.tif');
» imshow(x,map);](https://image.slidesharecdn.com/matlabanilkumar-220208152952/75/Matlab-anilkumar-54-2048.jpg)

![66
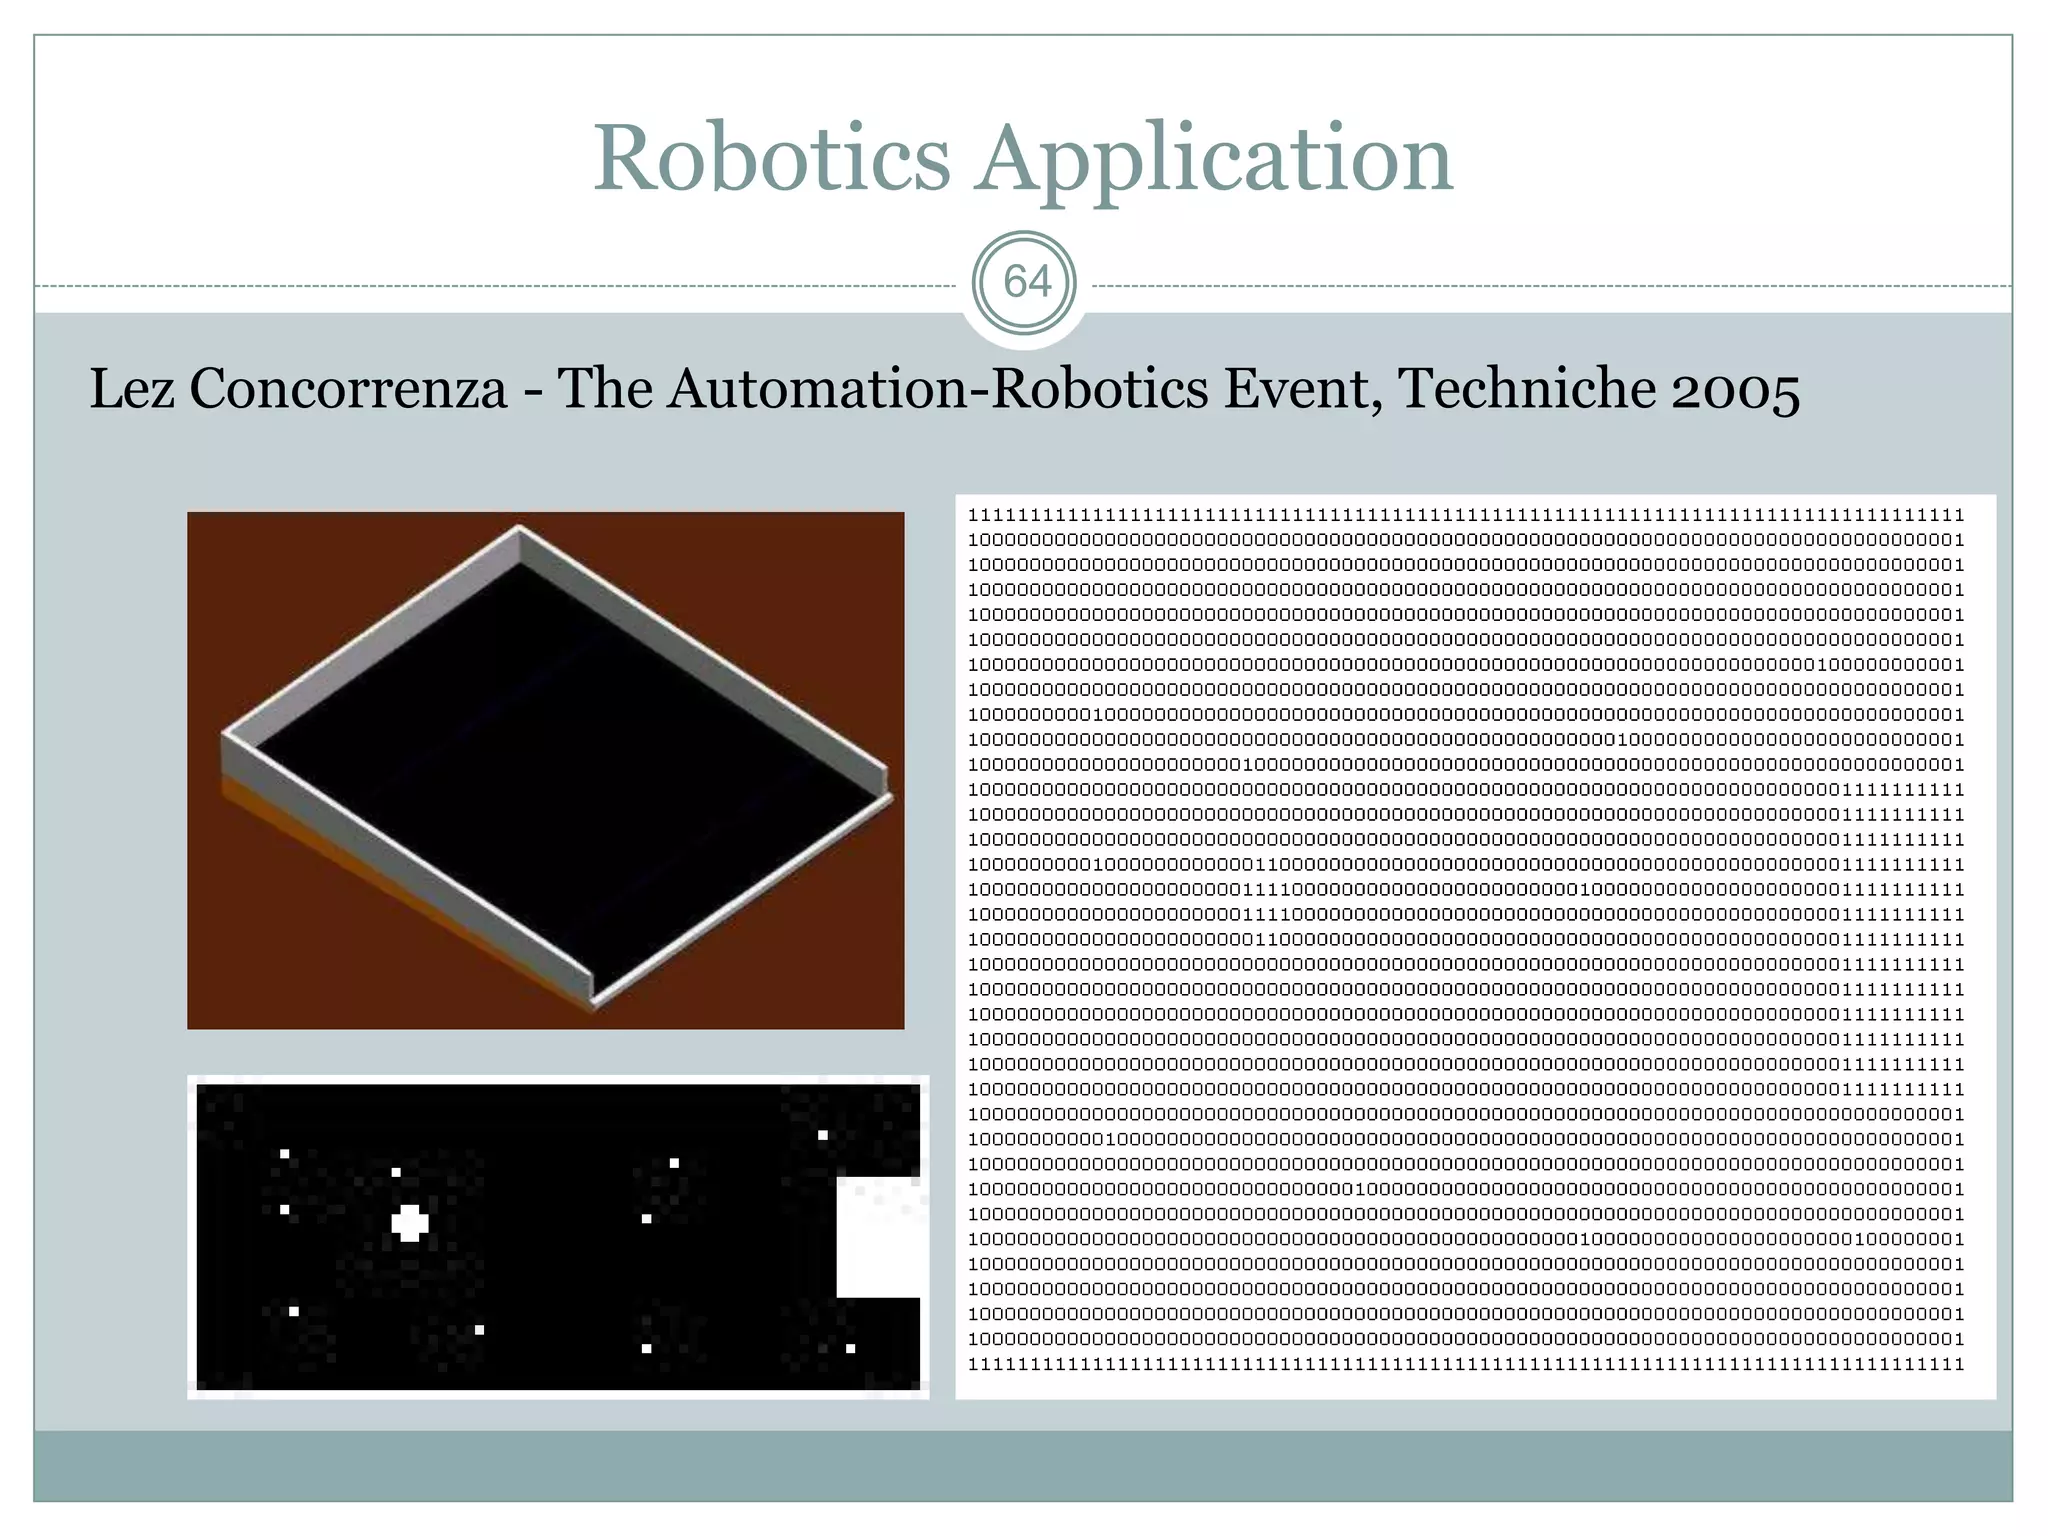
Robotics Application
MATLAB Code
parport=digitalio('parallel','LPT1');
addline(parport,0:7,'out');
ball_x_prev = 1;
ball_y_prev = 1;
while (1)
% code for acquiring image
filtered_image=medfilt2(bw,[3 3]); % filter the image
region_ball = filtered_image[20:460,10:575]; % ball region
region_bot = filtered_image[20:460,575:630]; % robot region
label = bwlabel(region_ball,4); %label the clusters in the region
data = regionprops(label,'basic'); % data ontains properties of clusters in the region
object = find([data.Area]==max([data.Area])) % object conatains the label of the cluster with max
area](https://image.slidesharecdn.com/matlabanilkumar-220208152952/75/Matlab-anilkumar-66-2048.jpg)
![67
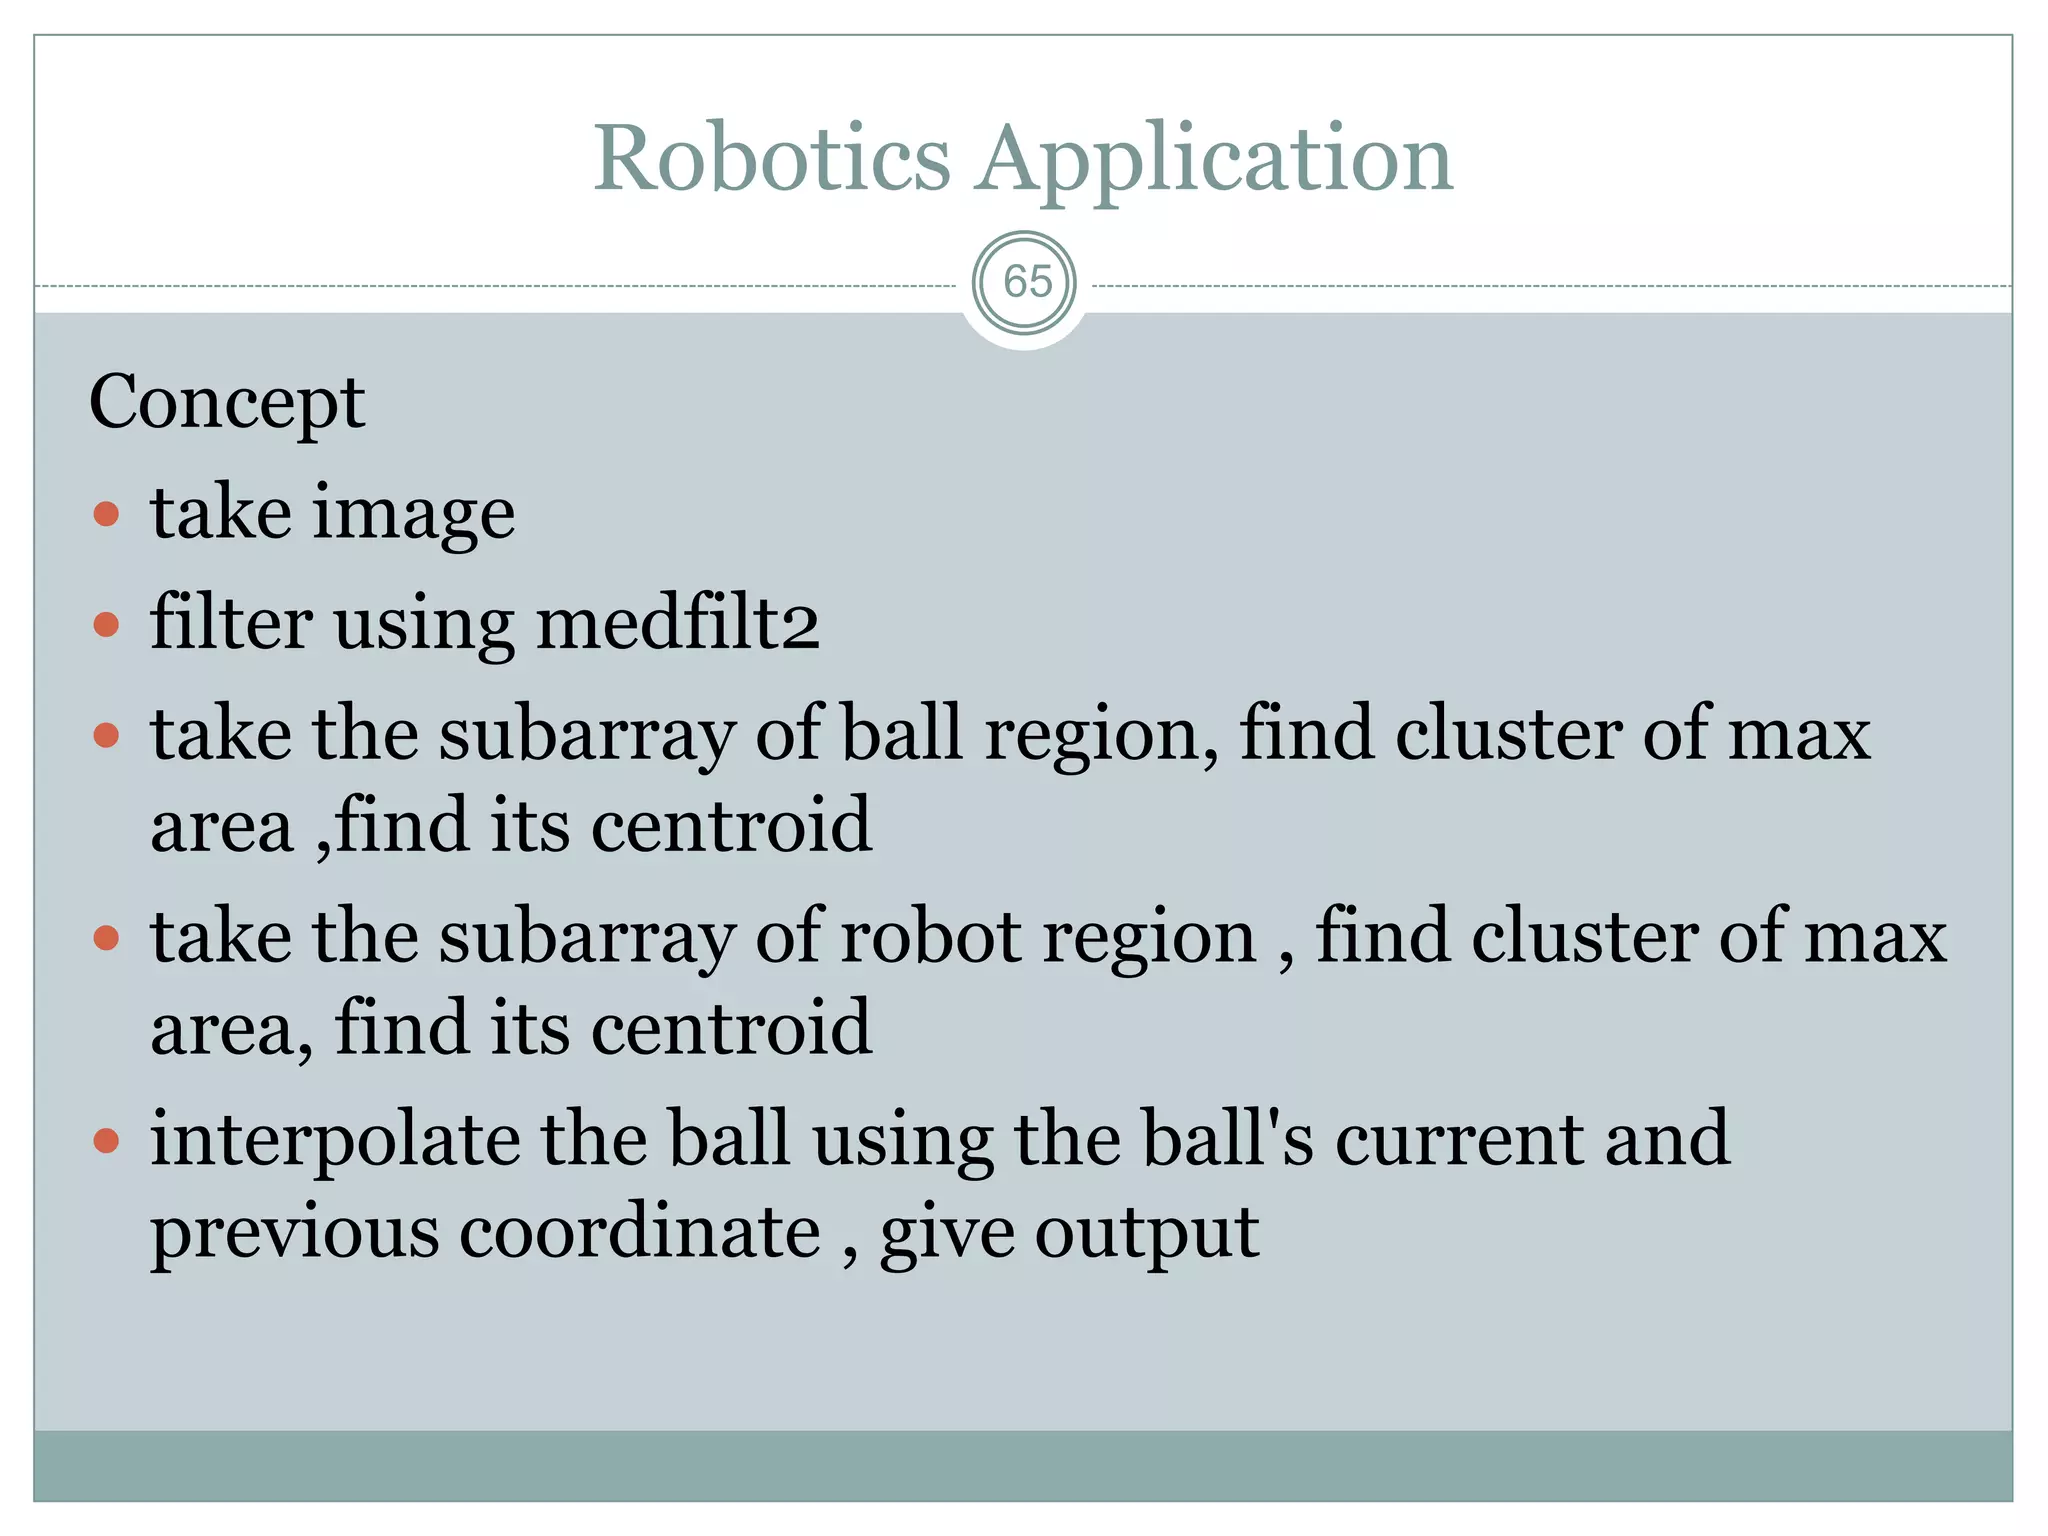
Robotics Application
ball_x = data(object).Centroid(1); %x coordinates of the ball
ball_y = data(object).Centroid(2);
label = bwlabel(region_bot,4); %label the clusters in the region
data = regionprops(label,'basic'); % data ontains properties of clusters in the region
object =find([data.Area]==max([data.Area])) % object conatains the label of the cluster with max
area
robot_x = data(object).Centroid(1); %x coordinates of the bot
robot_y = data(object).Centroid(2);
% Algorithm for movement of robot
if (ball_x > ball_x_prev) % the ball is returning to the bot
% Do something
if (robot_y > y_proj)
% Do something else
Etc.](https://image.slidesharecdn.com/matlabanilkumar-220208152952/75/Matlab-anilkumar-67-2048.jpg)


![Pollution.ppt [Autosaved].ppt yogesh kumbhar](https://cdn.slidesharecdn.com/ss_thumbnails/pollution-251205194856-d30cfee8-thumbnail.jpg?width=640&height=640&fit=bounds)


