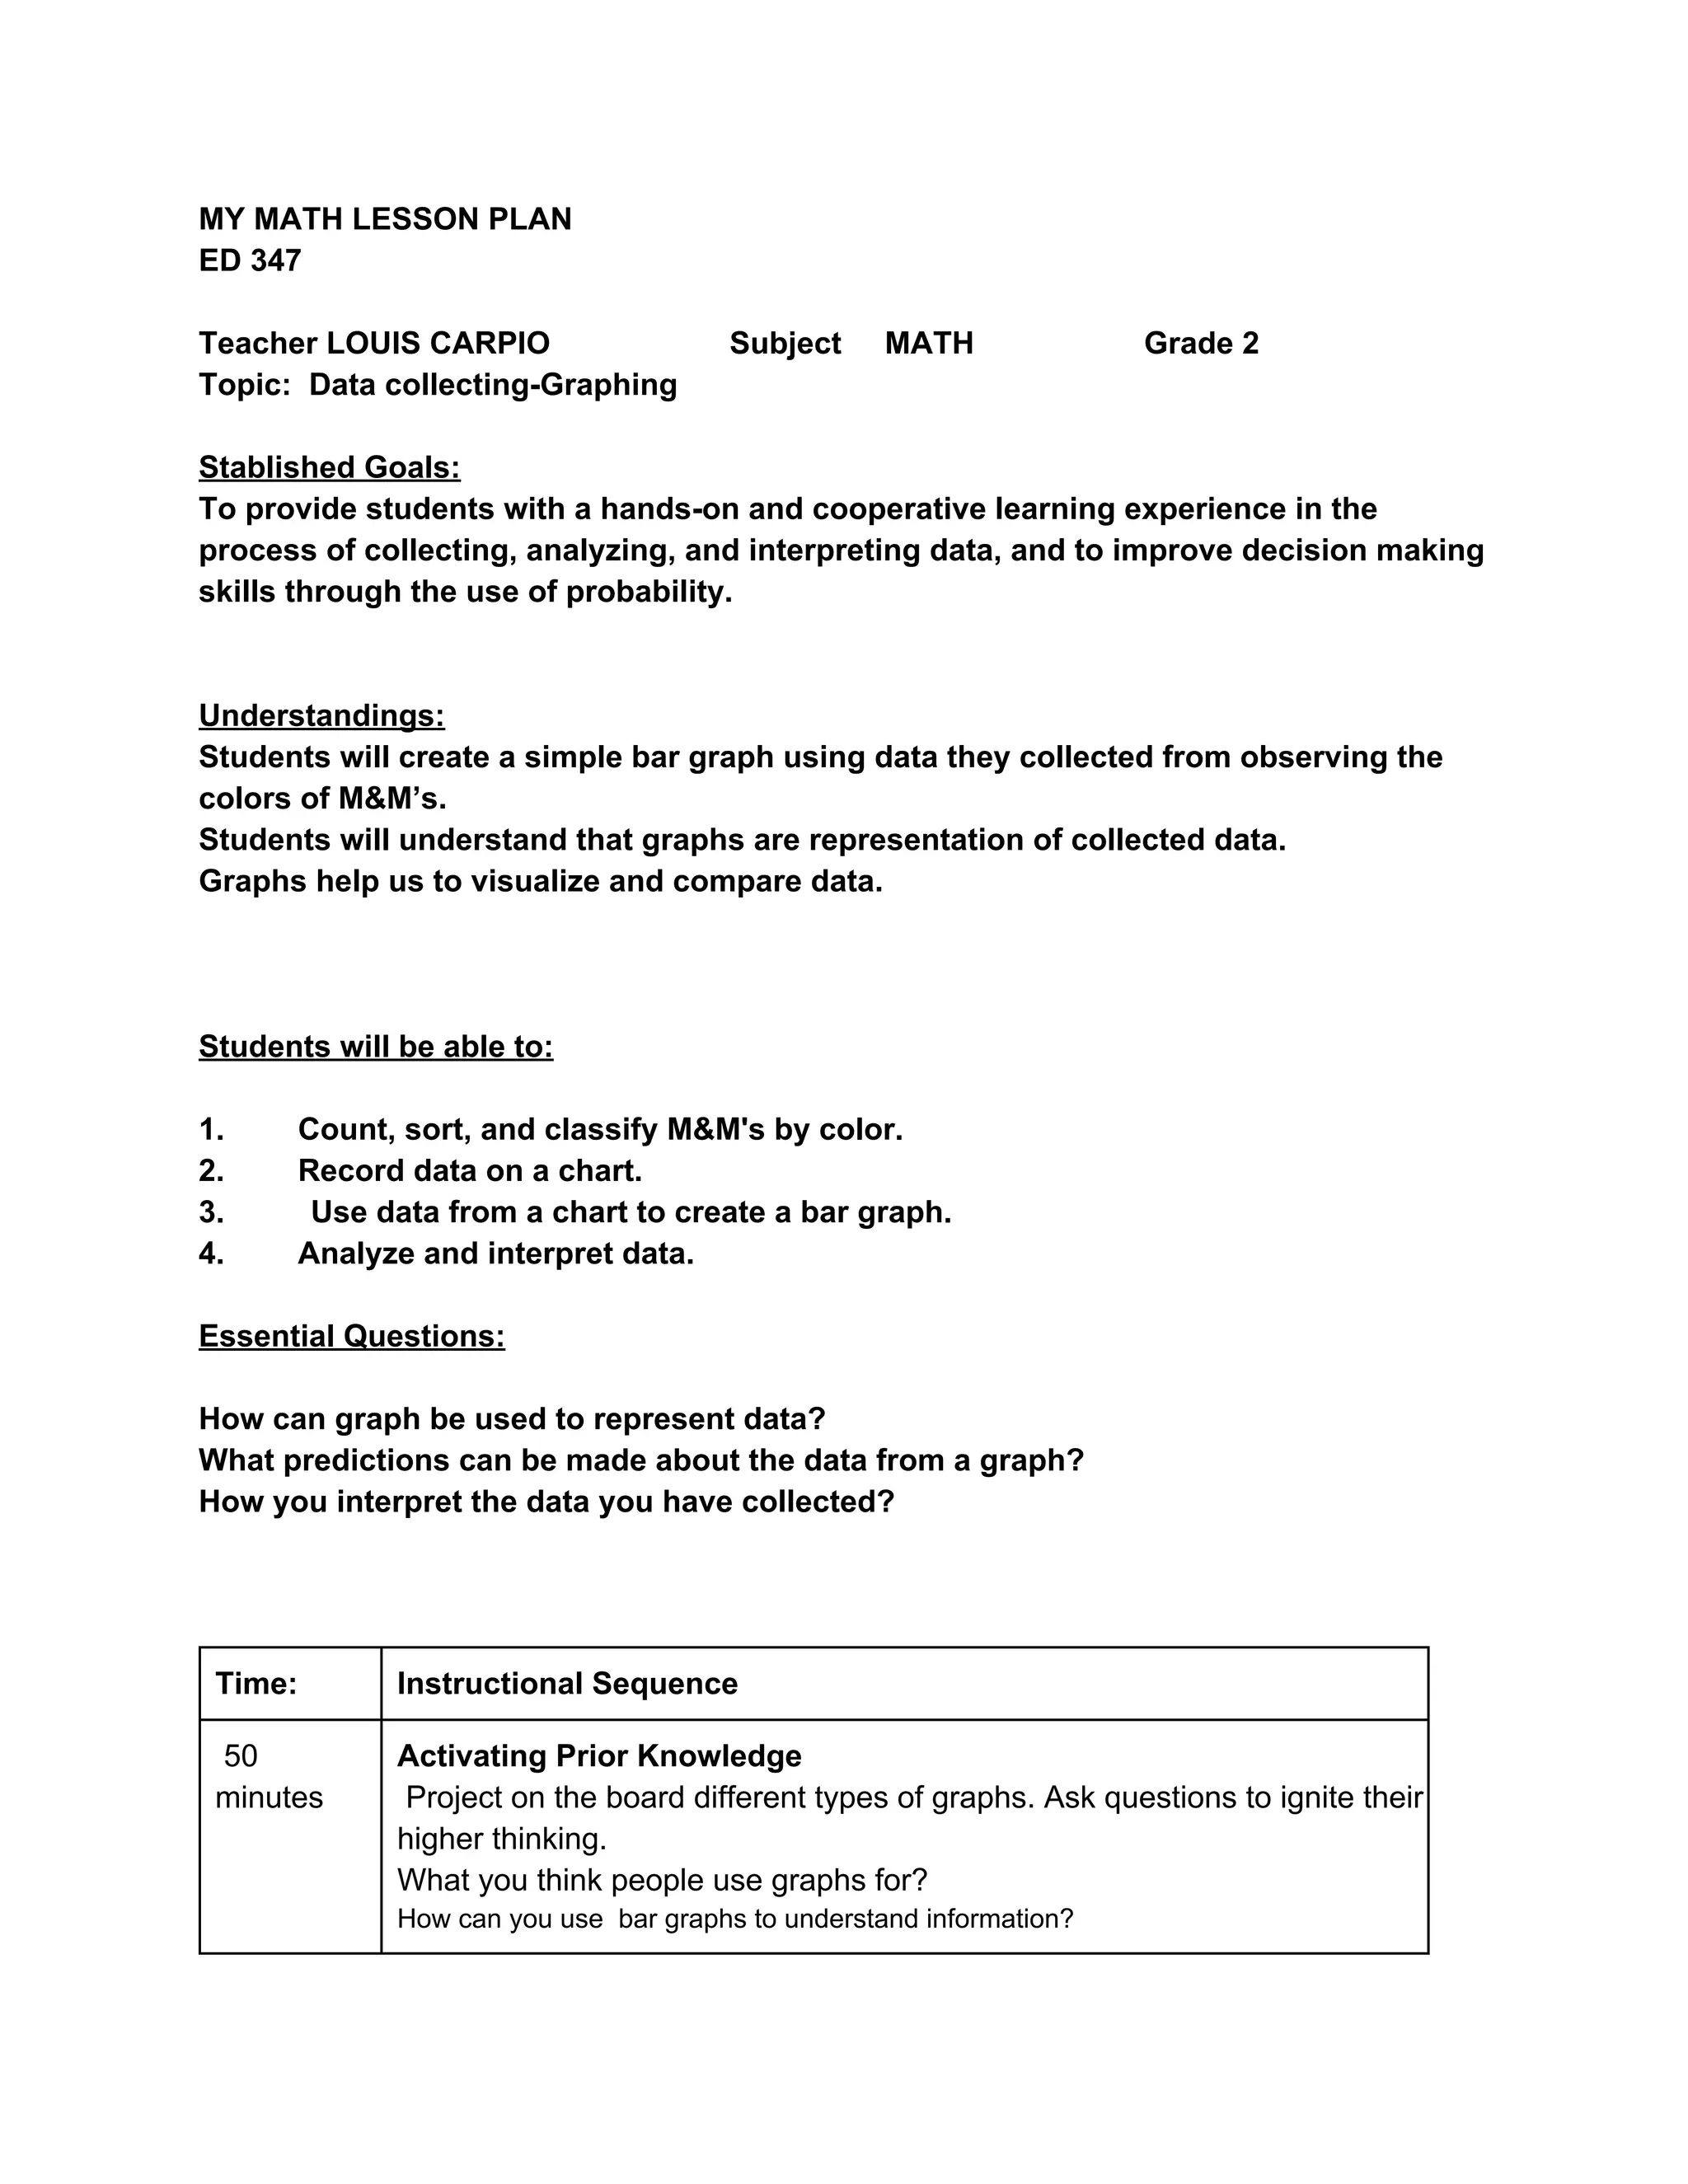
MY MATH LESSON PLAN 
ED 347 
     
Teacher LOUIS CARPIO      Subject     MATH        Grade 2 
Topic:  Data collecting­Graphing 
 
Stablished Goals: 
To provide students with a hands­on and cooperative learning experience in the 
process of collecting, analyzing, and interpreting data, and to improve decision making 
skills through the use of probability. 
 
 
Understandings: 
Students will create a simple bar graph using data they collected from observing the 
colors of M&M’s. 
Students will understand that graphs are representation of collected data. 
Graphs help us to visualize and compare data. 


Students will be able to: 
 
1. Count, sort, and classify M&M's by color. 
2. Record data on a chart. 
3.          Use data from a chart to create a bar graph. 
4. Analyze and interpret data. 
 
Essential Questions: 
 
How can graph be used to represent data? 
What predictions can be made about the data from a graph? 
How you interpret the data you have collected? 


Time:  Instructional Sequence 
 50 
minutes 
Activating Prior Knowledge 
 Project on the board different types of graphs. Ask questions to ignite their 
higher thinking. 
What you think people use graphs for?  
How can you use  bar graphs to understand information?  
BrainpopJr. video  
http://www.brainpopjr.com/math/data/tallychartsandbargraphs/ 


Communicating Learning Targets 
 
Describe the goal to students.  Write the goal of this lesson on the board and 
compare it with the activities to find a match.   


   Learning Experiences 
Teacher Tasks  Student Tasks 
 ACTIVITIES AND PROCEDURES: 
1. Give each student one 
small bag of M&M's. 
2. Ask students to estimate 
how many M&M’s they have in all 
and record their answer in the 
chart. 
3. Ask students to then count 
to see exact number of M&M’s they 
have and record in their answer in 
the chart. 
4. Ask students to estimate 
how many of each color M&M they 
have and record their answer in the 
chart. 
5. Ask students to open the 
bag, sort, and classify the M&M's 
according to color. 
 Students will discuss their results 
with their classmates.  
 
Draw,  compare and share 
information. 
 
Find a general conclusion based on 
the total results. 
 
 
6. Ask students to record the 
information from step 2 on a chart. 
7. After illustrating various 
pictographs, ask students to use 
their data to create their own 
pictograph. 
8. Compare graphs. Have 
students discuss the differences 
and the similarities of the graphs. 


Closure:  Students summary of activities done. Reasonable level of 
achievement.  Students were enthusiastic about graphs and were 
able to analyze the results and share their findings with the class. 


Assessment: 
Students will be assessed by checking their M&M graphs and listen to their sharing with 
other students.   
 
Management Issues: The class got a little out of control at the moment of getting the 
m&ms from me.   
Accommodations: 
Instructional Materials, Resources, and Technology – Materials:  
Projector, computer, document camera, papers, crayons, m&m bags ( a big party bag that 
I divided into little snack bags)   
Self Reflection of Teaching: 
Thinking about this lesson:   The lesson was a success,  children enjoyed working with 
something they know is delicious and learned in a fun way to make, read and interpret data on a 
graph. 
  
Thinking Ahead:  Next time I think I would change a couple things: 
1.  Instead of a printed graph template,  I will ask students to create their own.   
2.  Give a little more time for the activity to accommodate students with IEP and ELL. 
 
HERE IS A VIDEO:  http://www.youtube.com/watch?v=4fCbxRRcZi8&feature=youtu.be 
 
 
SELF EVALUATION: 
 
I included visuals of the artifacts using during the lesson. I followed instructions on the rubrics 
about APU format.  I met with my teacher to get his feedback.  For all that, I feel I earn an A. 
 

Mathlessonplan