Download to read offline
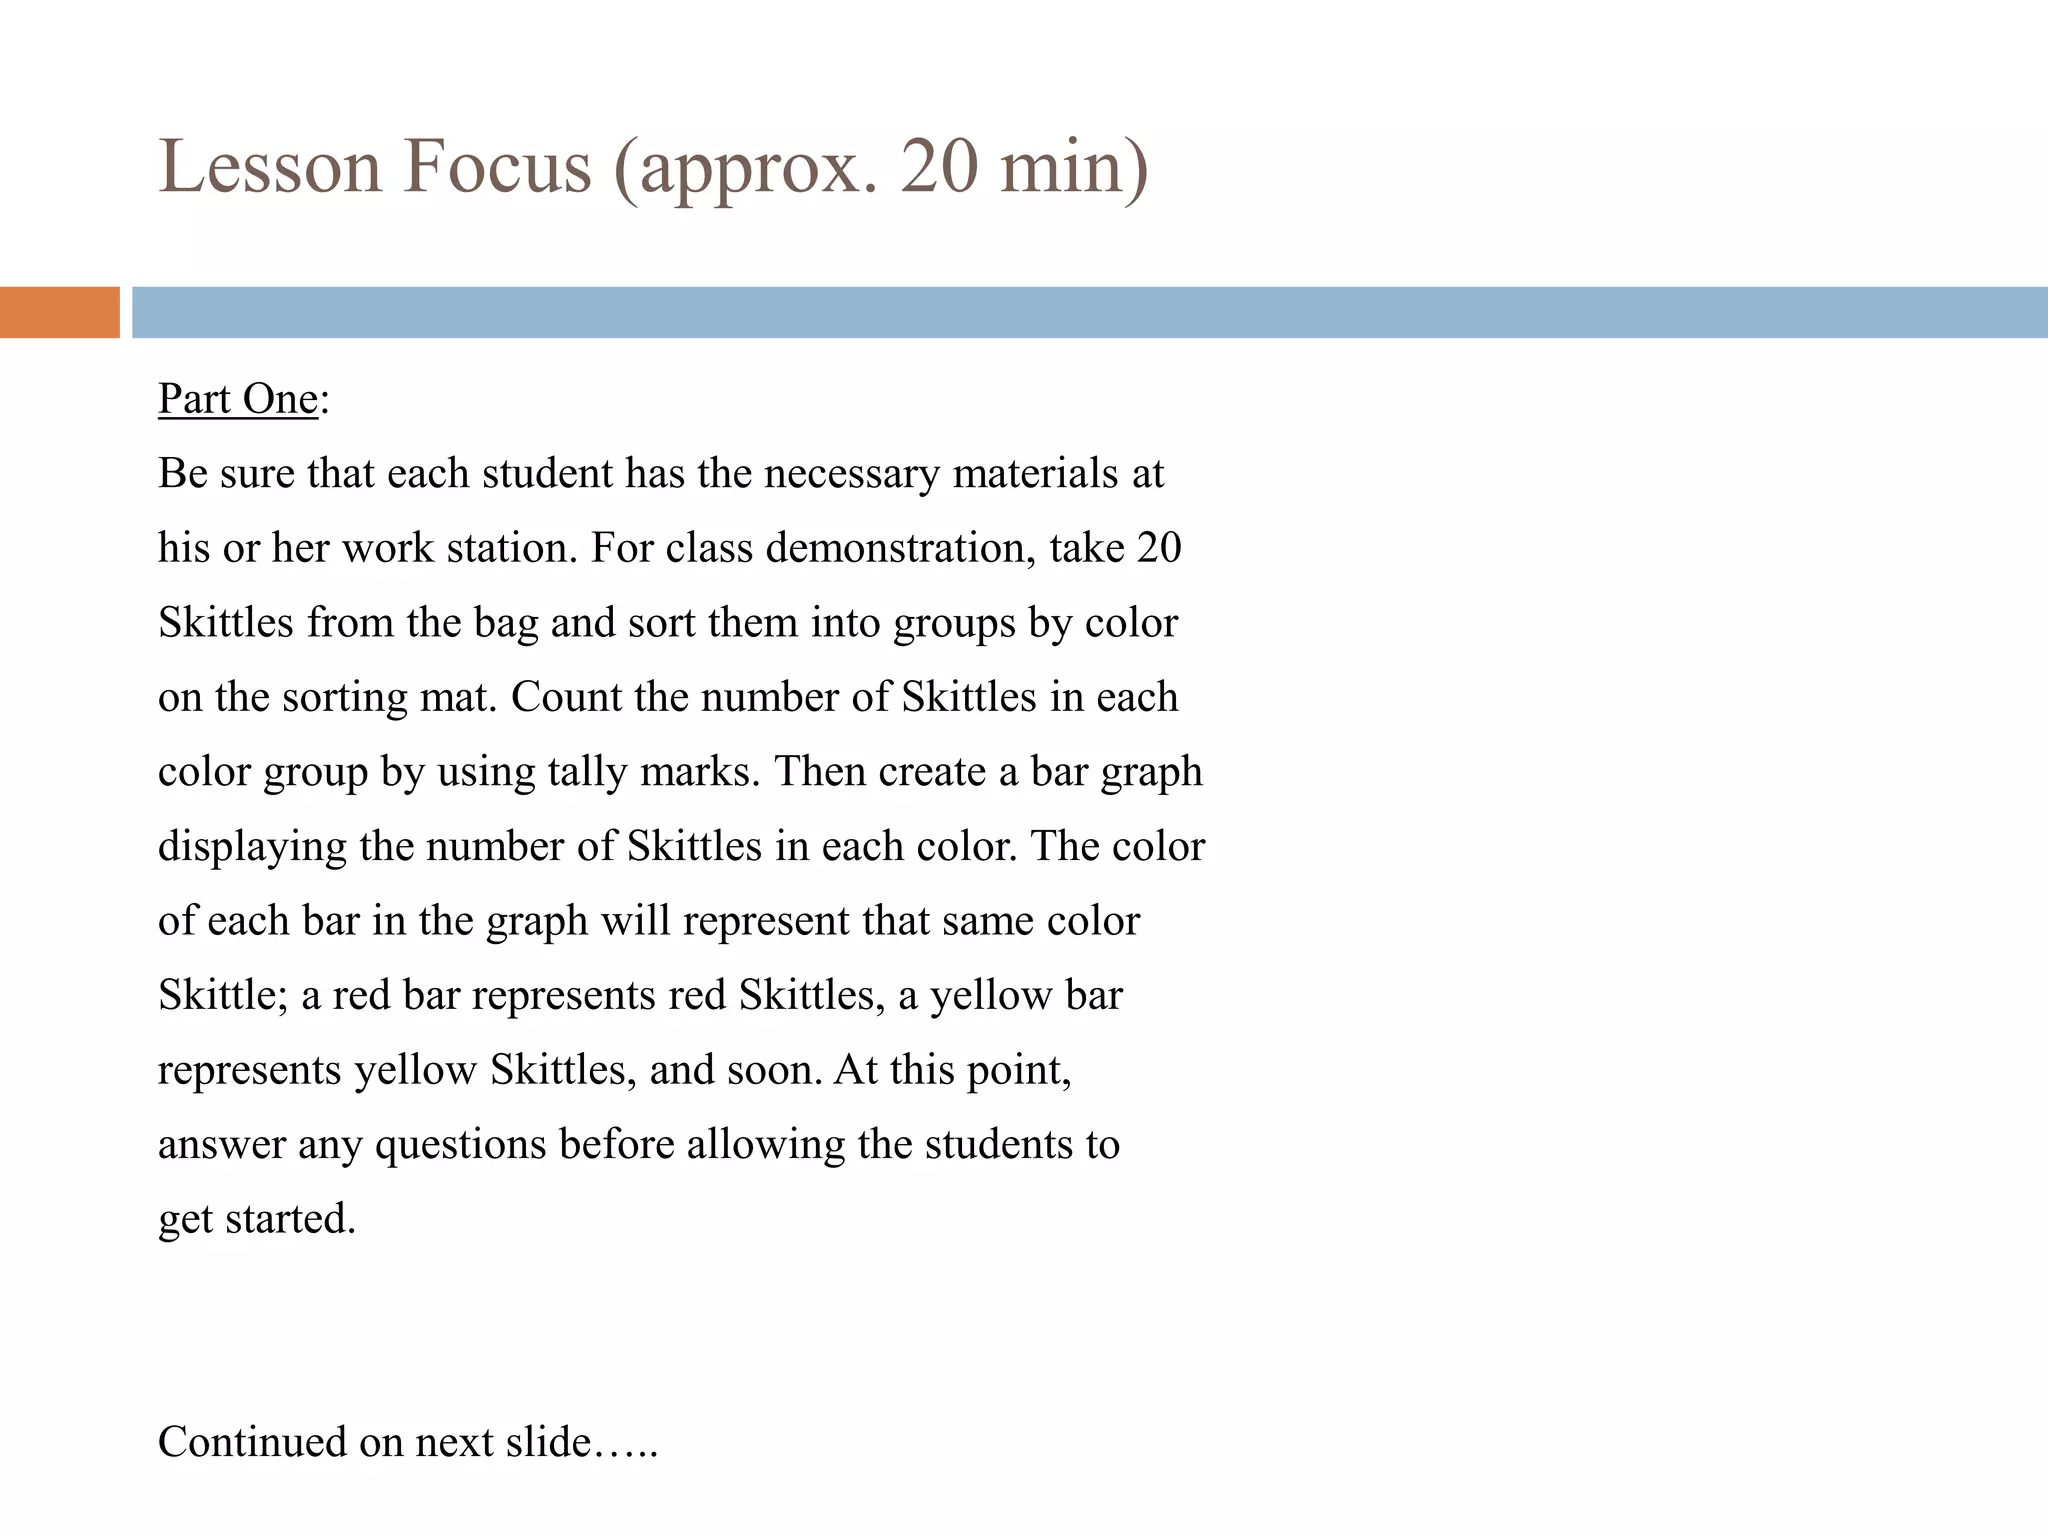
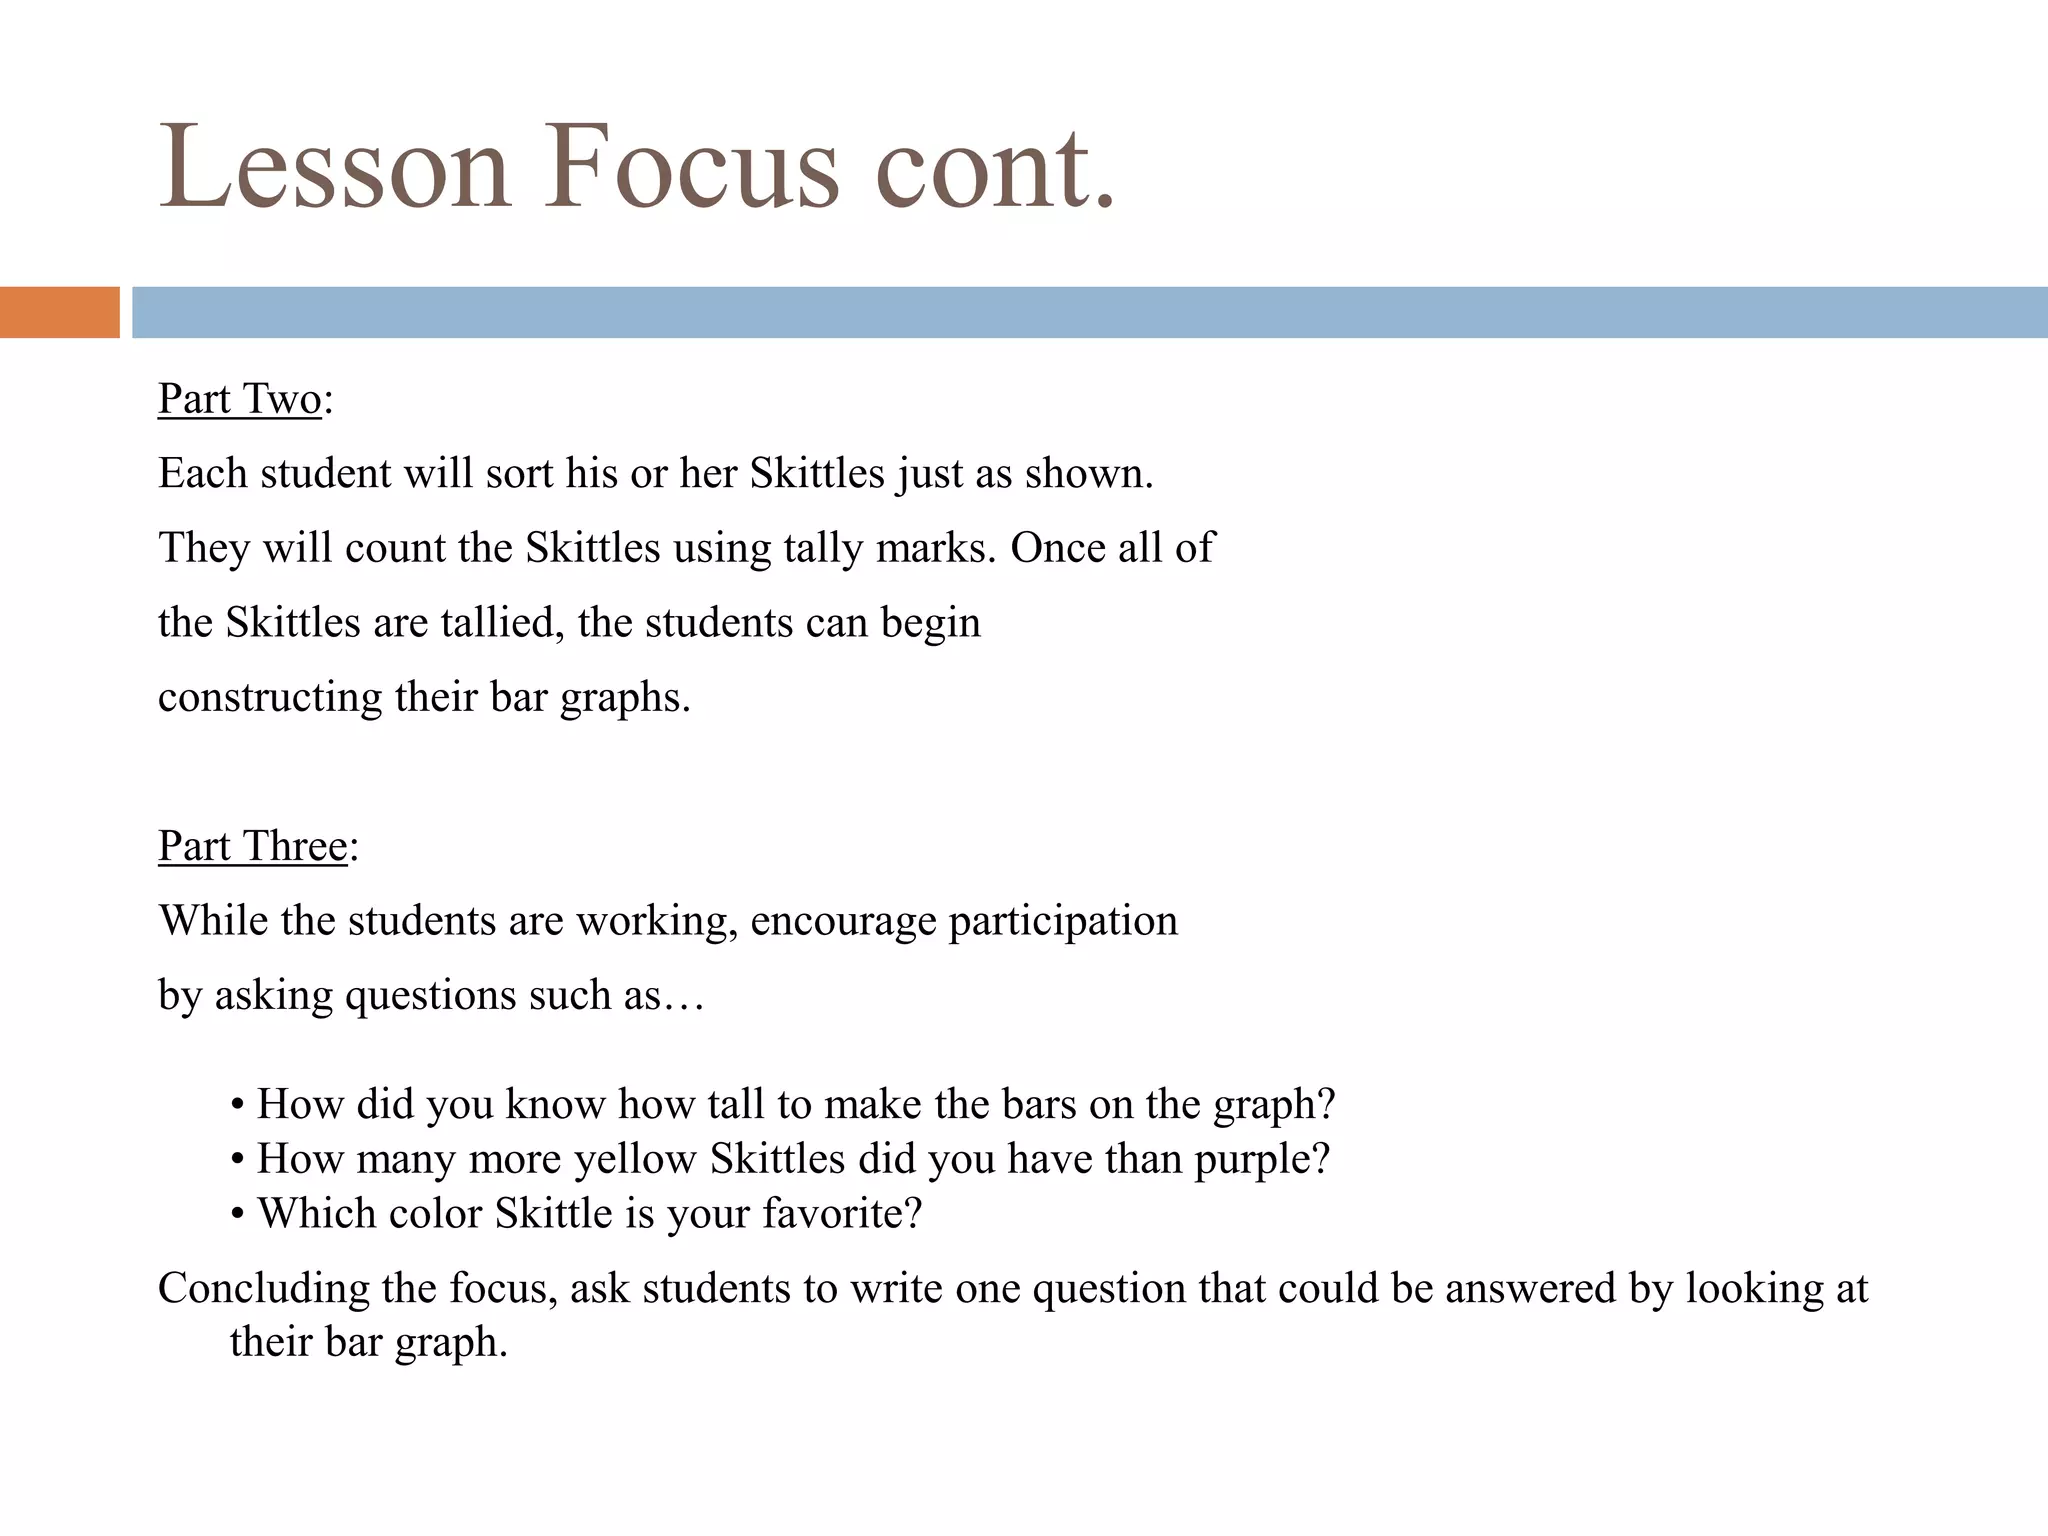
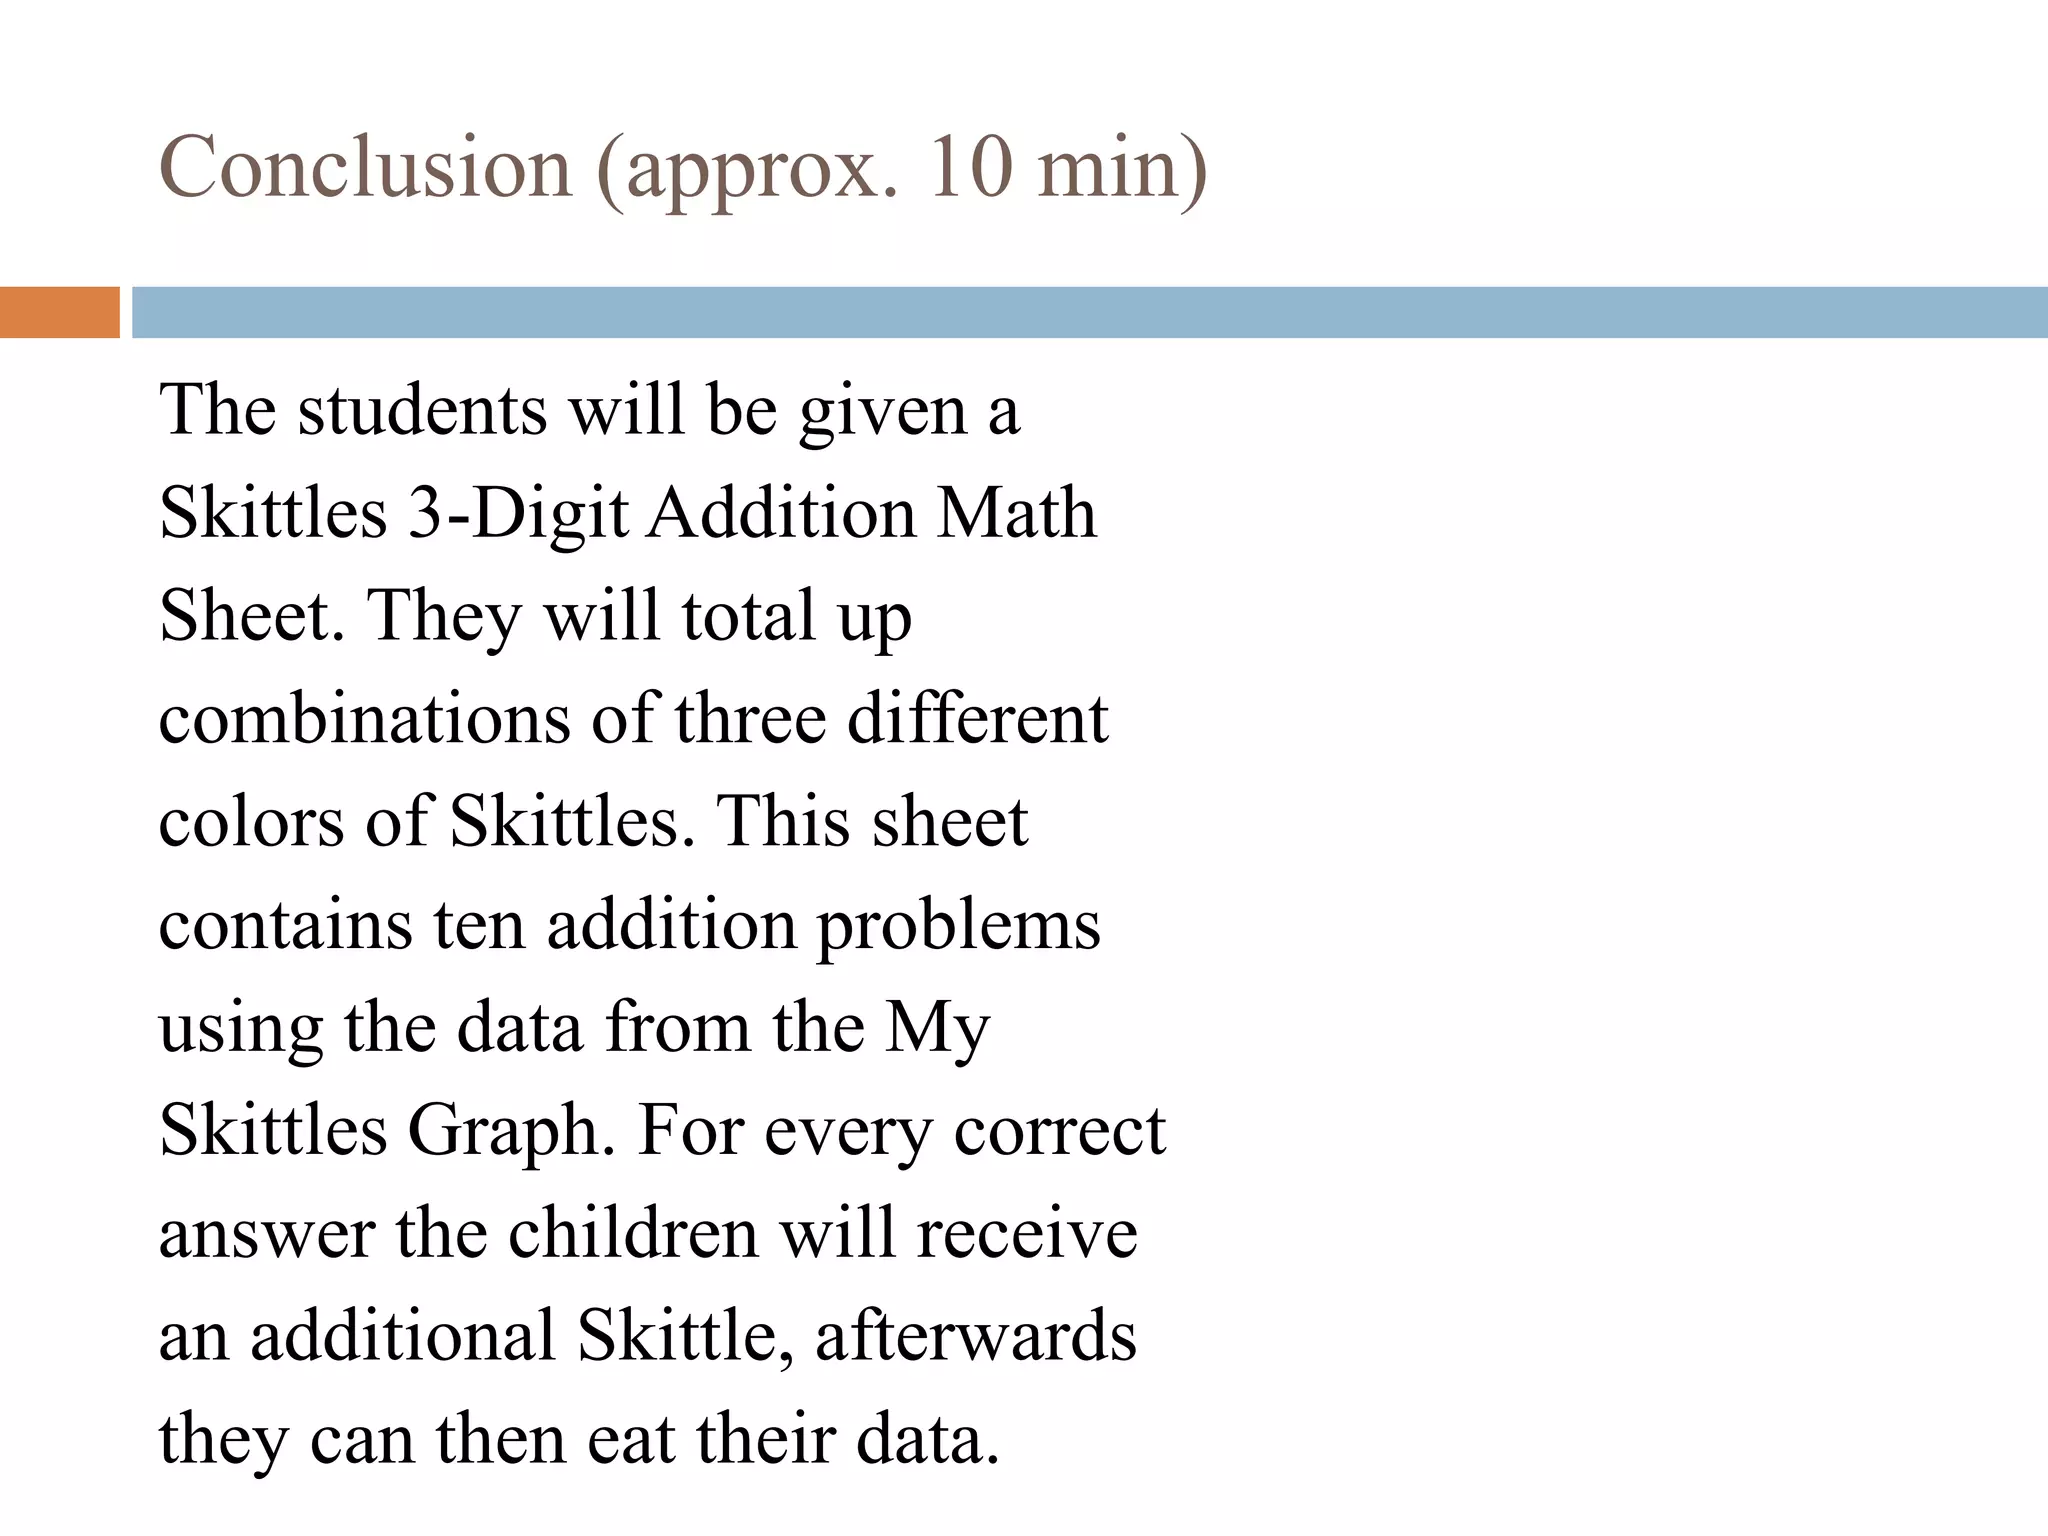

This lesson plan teaches students about graphing using Skittles candies. Students will sort Skittles by color, tally the amounts, and create bar graphs to display the data. They will then answer questions about their graphs and write their own questions. Finally, students complete an addition worksheet involving Skittles colors to reinforce the data from their graphs. The goal is for students to learn how to create and interpret simple graphs.