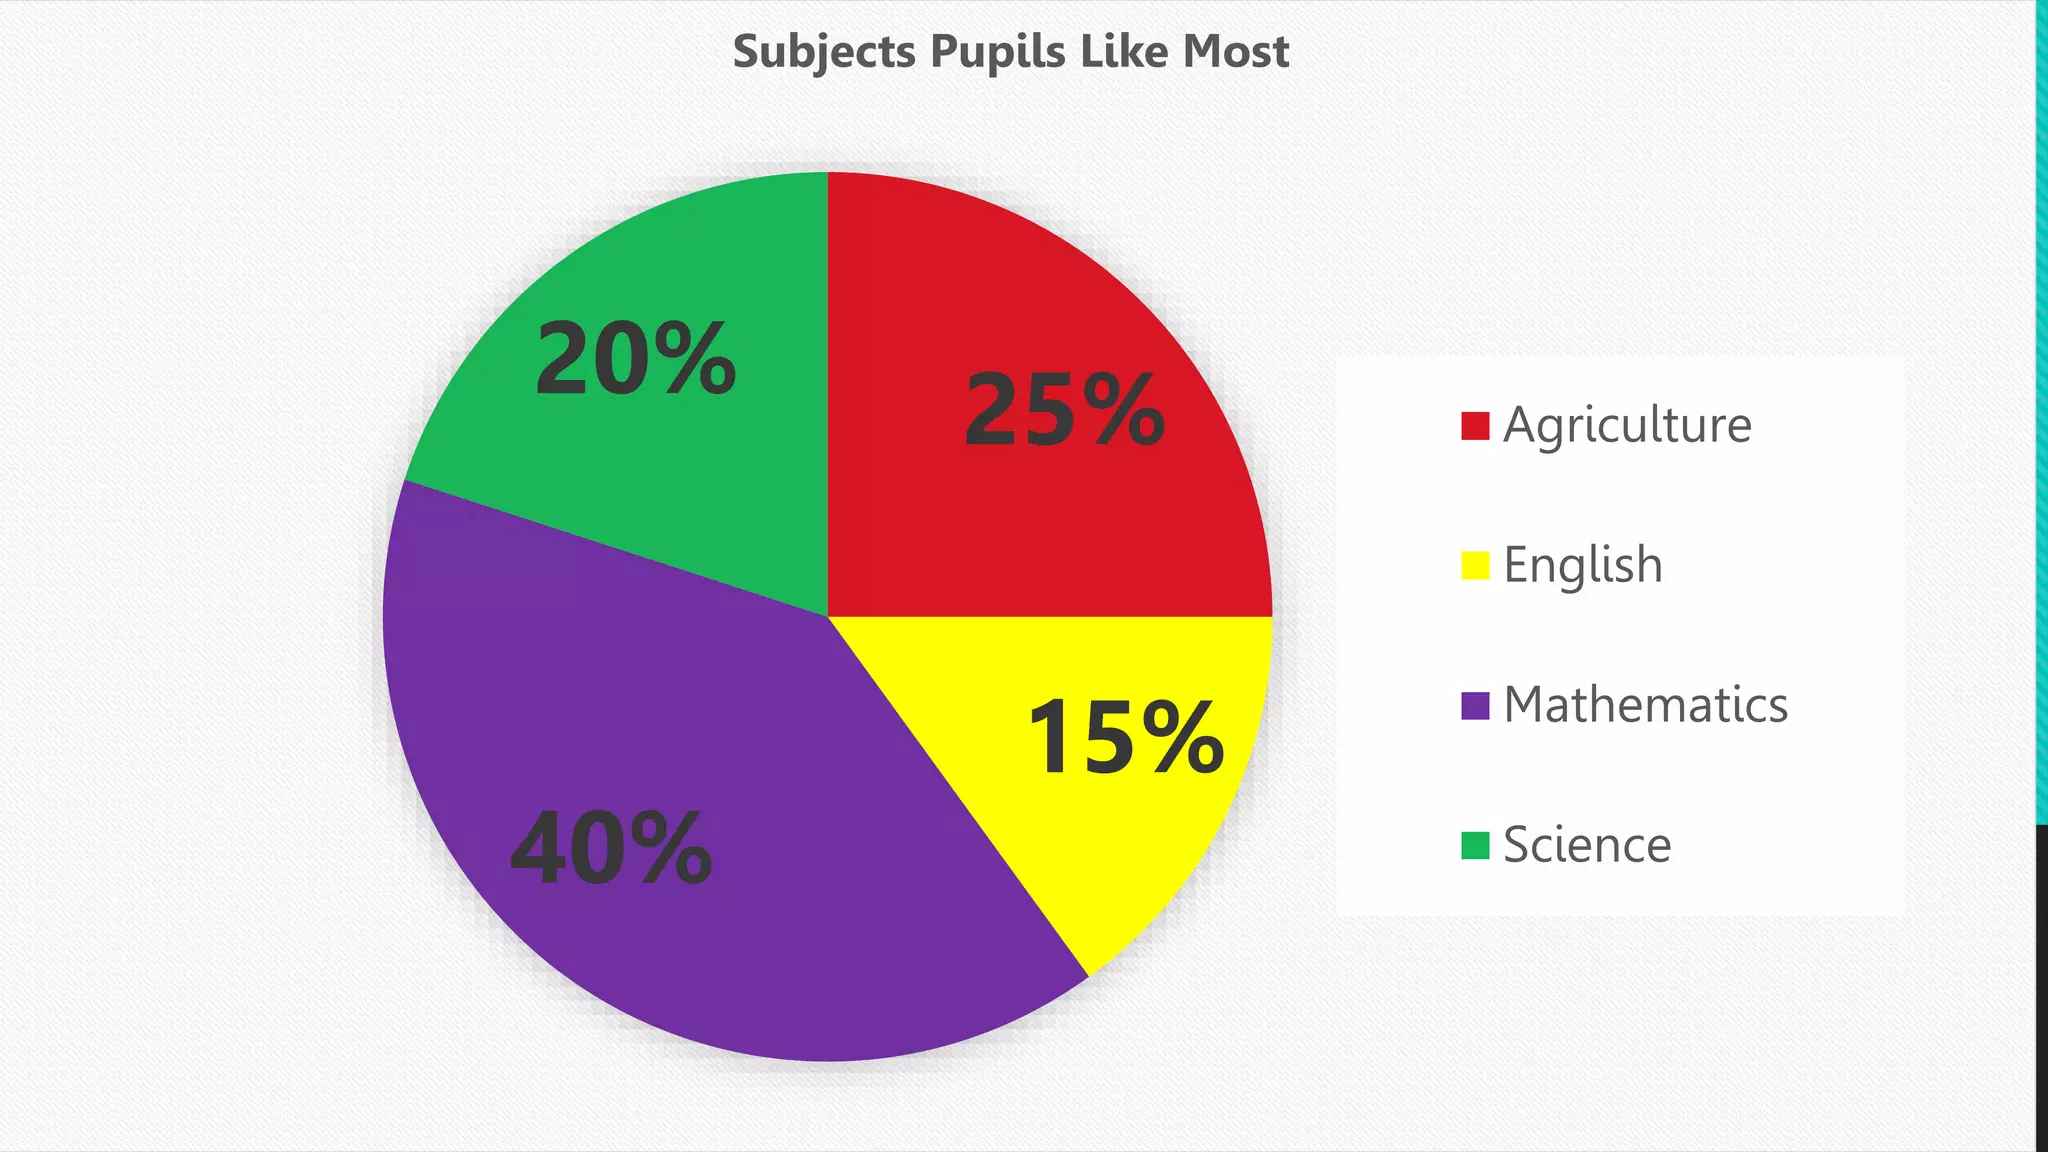
- A survey was conducted on subjects pupils like most in school, with 80 pupils participating. The pie graph shows 40% liked Mathematics, 25% liked Agriculture, 20% liked Science, and 15% liked English.
- The document provides an example problem solving the number of pupils that liked Science using the pie graph data. It gives the steps to identify facts, understand the question, plan the operation, solve using computations, and check the answer.
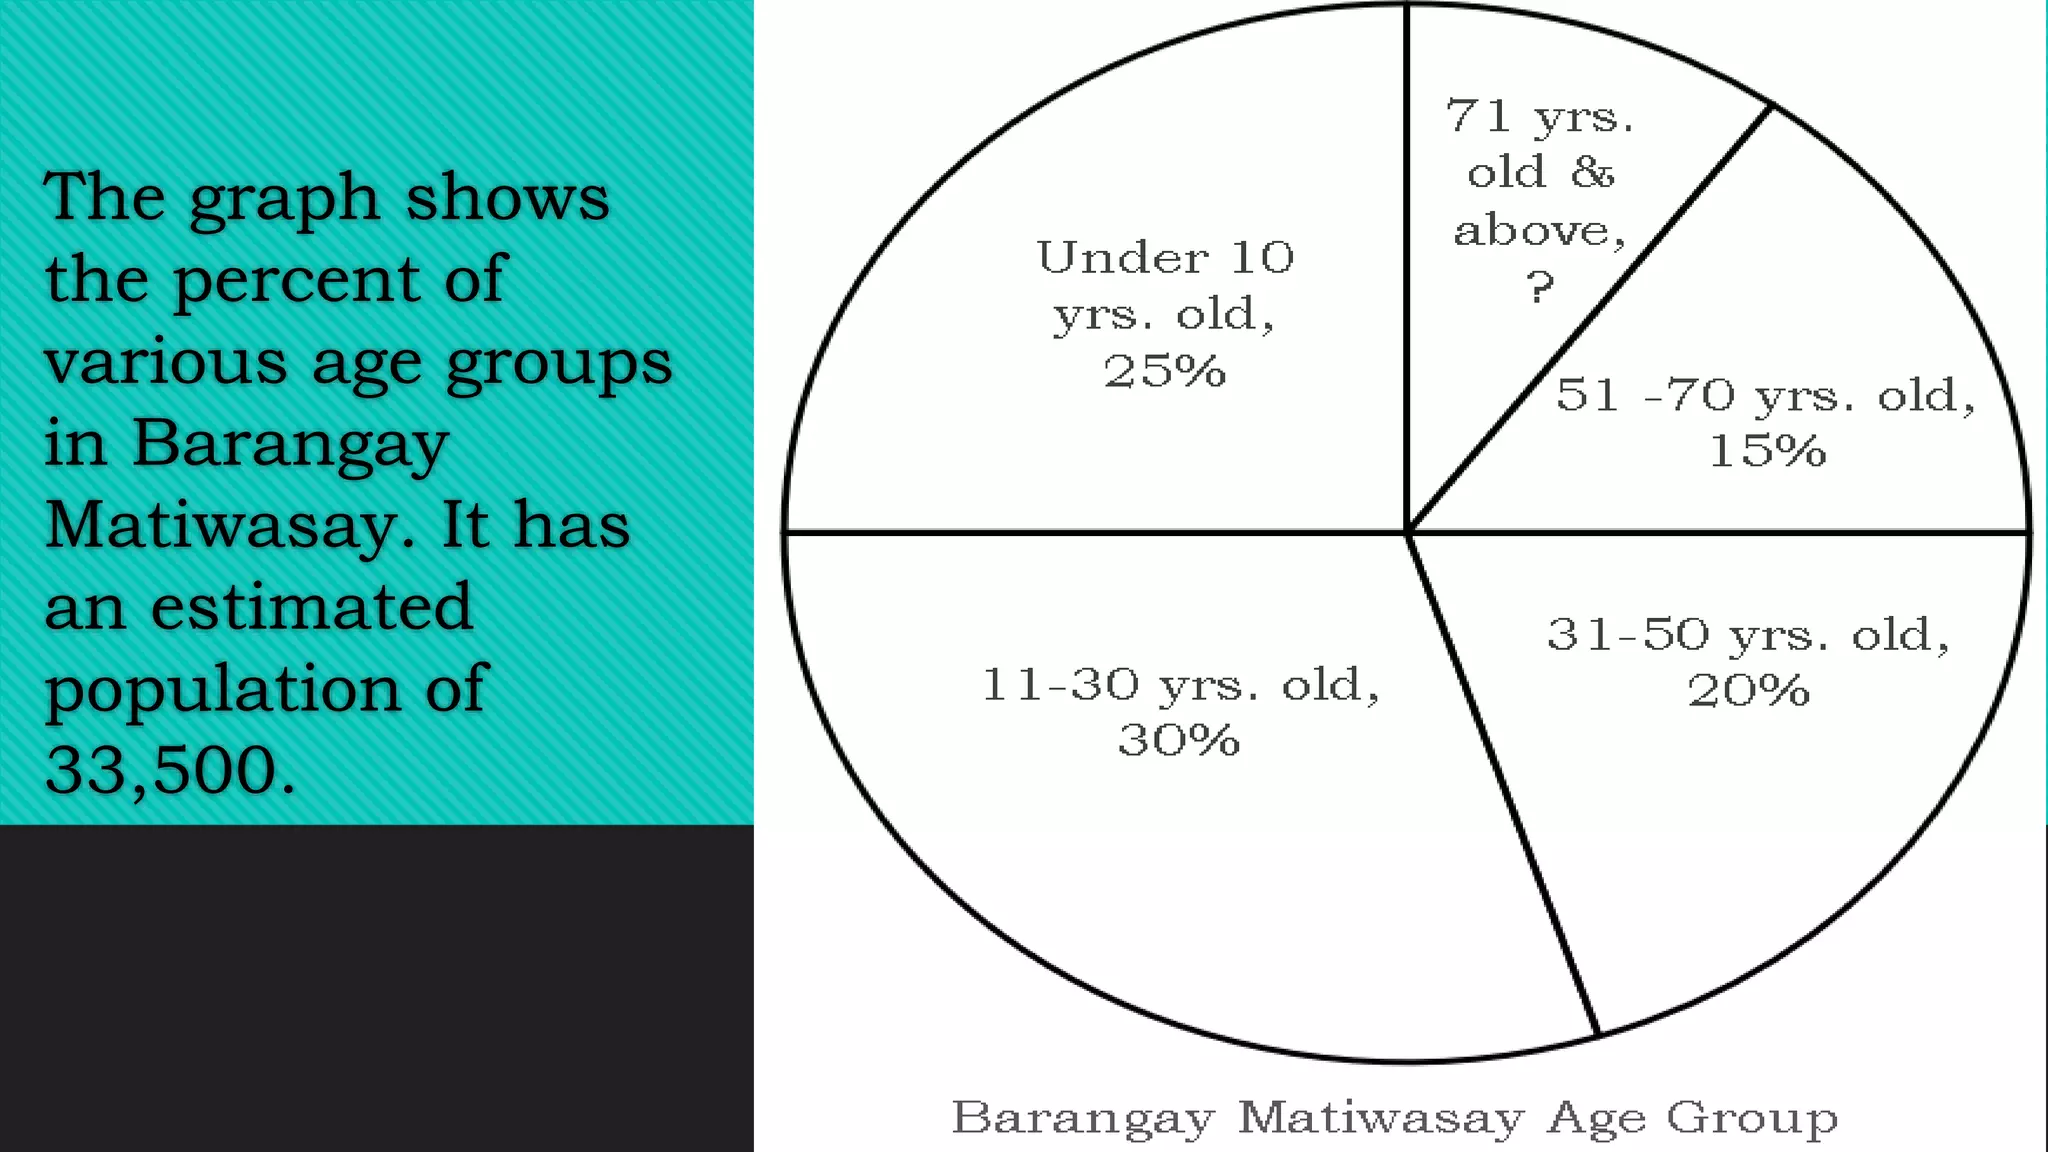
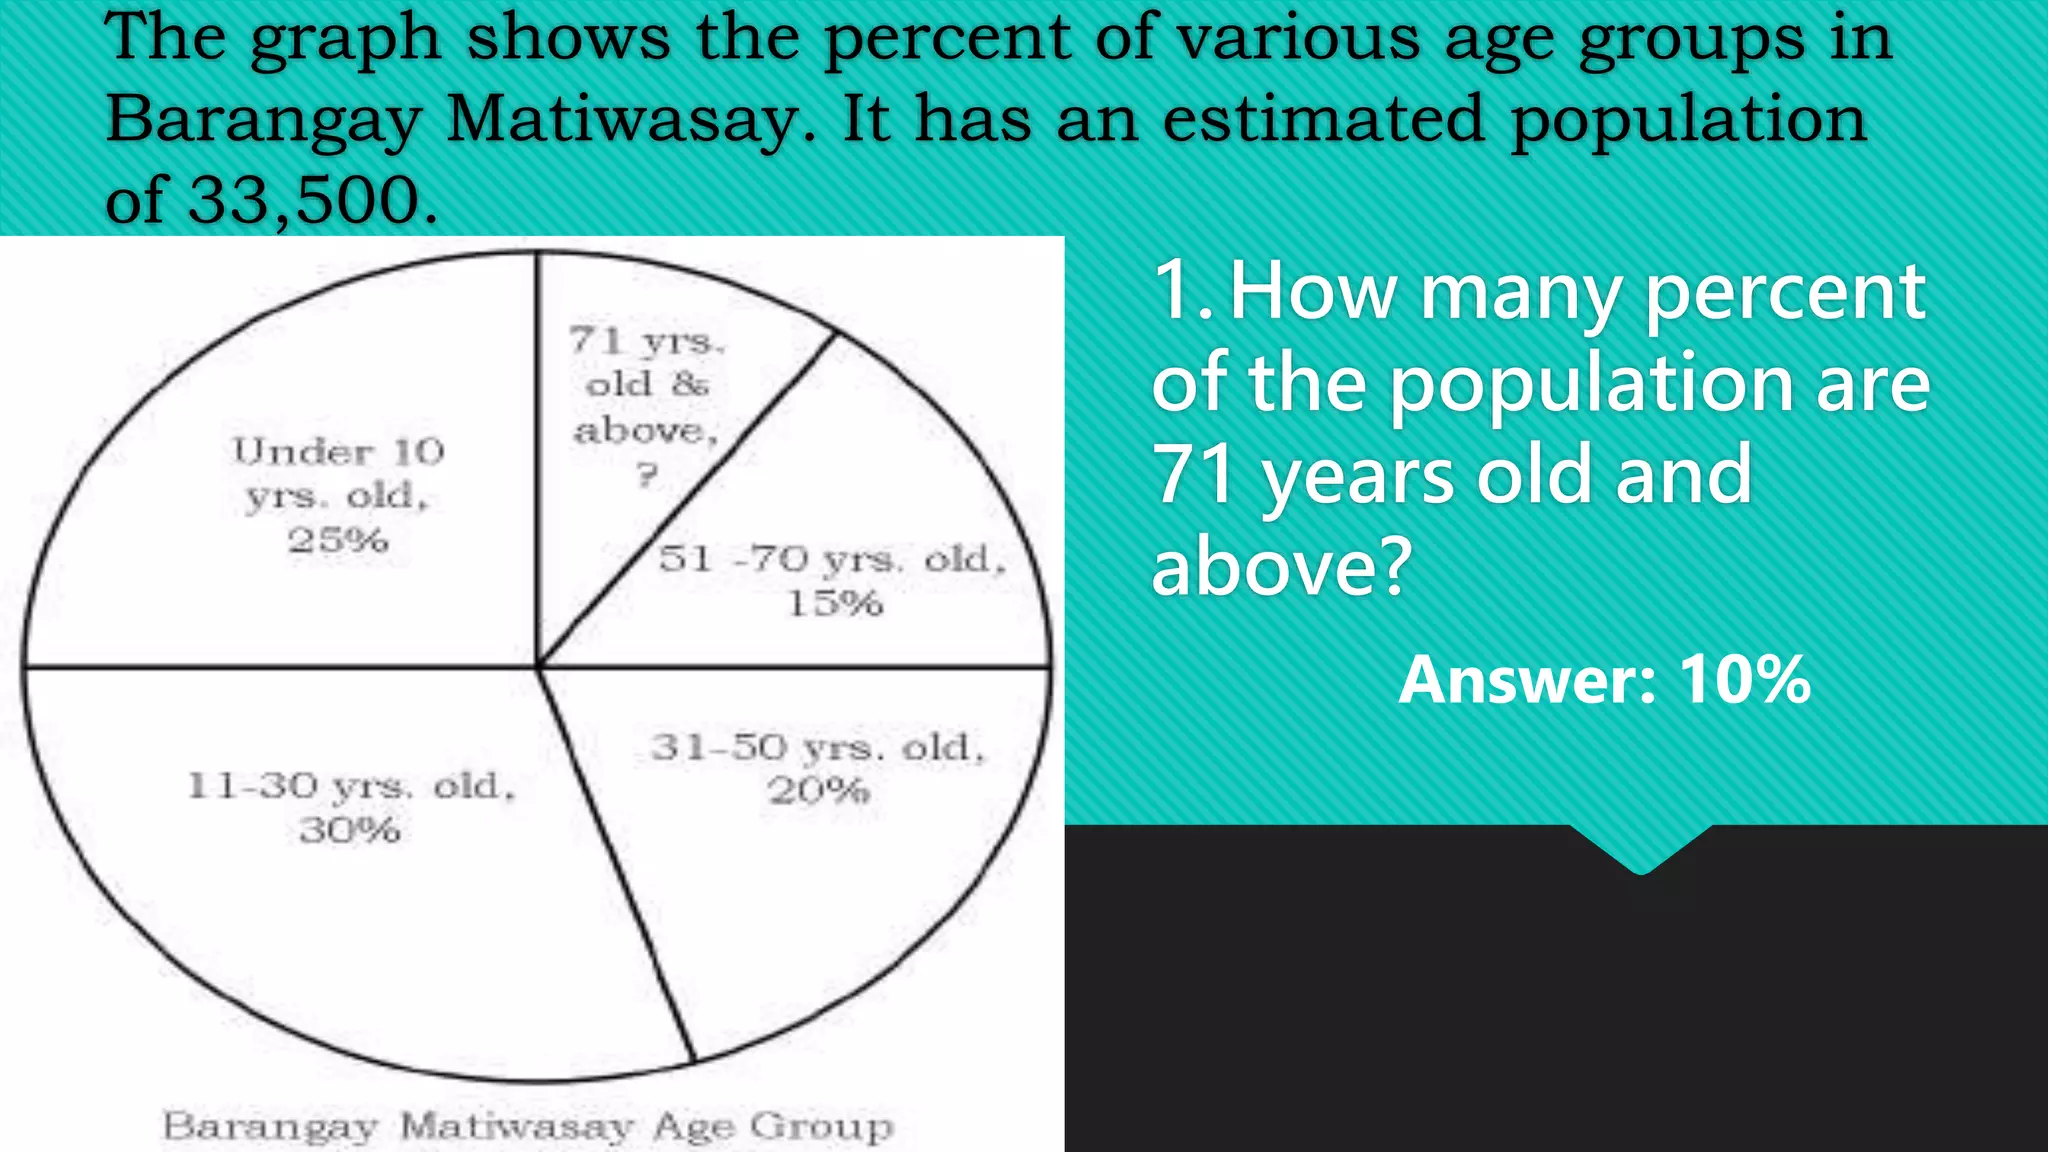
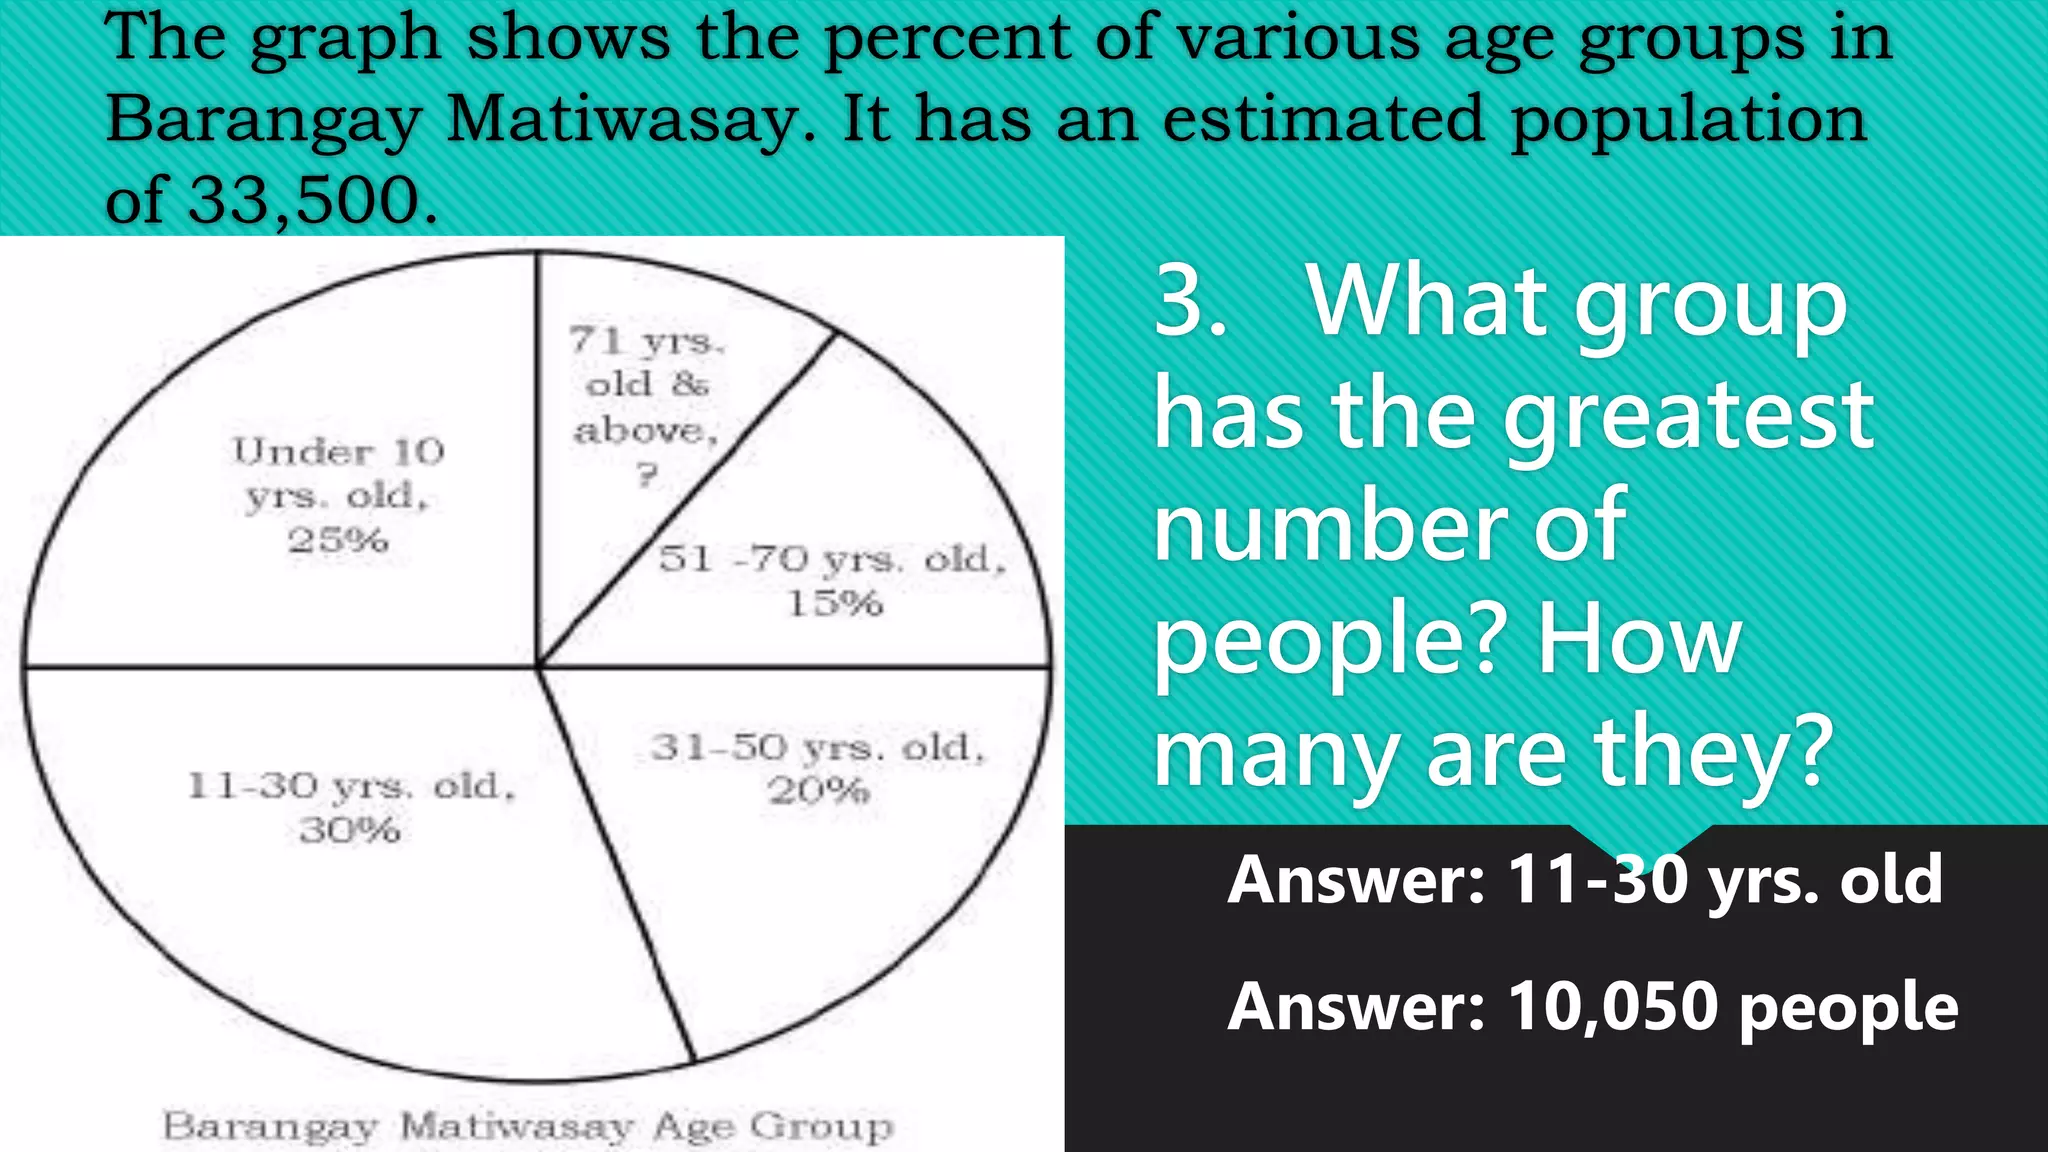
- The second part of the document asks multiple choice and short answer questions about a pie graph showing the population breakdown by age groups in a barangay with a total population of 33,500 people. It asks questions about specific age groups and calculates totals.