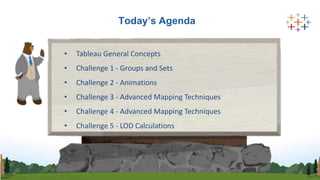
Salesforce Admin Group, Trichy
Master Tableau 20 in Data Science
by solving Real-Life Analytics
Problems
Kadhar Basha J
Salesforce Admin Group, Trichy
Trailblazer Community Group Leader
MST Solutions
Sundaravel J
Salesforce Admin Group, Trichy
Trailblazer Community Group Co-Leader
MST Solutions
Salesforce Admin Group, Trichy
Speaker
Nancy Jesurathinam
MST Solutions
Salesforce Admin Group, Trichy
• Meetup Success
• Public Interest
• Social Media promotions
• Leader contribution
• Previous meetups
• Achievement
• Admin path
Today’s Agenda
• Tableau General Concepts
• Challenge 1 - Groups and Sets
• Challenge 2 - Animations
• Challenge 3 - Advanced Mapping Techniques
• Challenge 4 - Advanced Mapping Techniques
• Challenge 5 - LOD Calculations
Why Tableau?
Logo
Different Products by tableau
Logo
Rw
Data Connections
Logo
 Relationship
 Joins
 Union
 Blend
Rw
Live Vs Extract
Logo
 Live allows you real-time data
 Extracts are kind of batch which needs to be refreshed from time
to time to get the updated data.
•Incremental Refresh
•Full Refresh (Default)
Rw
4 Roles of Data Fields
Logo
Rw
Data Types
Logo
Rw
Discrete Vs Continuous
Logo
Rw
Dimensions Vs Measures
Logo
Rw
Filters Order of Operation
Logo
Rw
Organizing and Simplifying Data Part
Logo
 Sort
 Hierarchies
 Groups
 Sets
 Parameter Control
Rw
Groups Vs Sets
Logo
Rw
Adding Interactivity
Logo
 Filter
 Highlight
 Go to URL
 Go to Sheet
 Change Parameter
 Change Set Values
Rw
Filetypes in Tableau
Logo
Launch
DEMO
Rw
Challenge 1 – Groups and Sets
Logo
You have been approached by a Venture Capital Fund. The Board of
Directors are currently viewing 1,000 potentially interesting startups
and deciding on which ones they are going to invest in.
The Criterion for selecting investments for this fund is a combination
of:
• High Revenue (2015)
• Low Expenses (2015)
• Top Growth (2015)
Our task is to assist the board in identifying which businesses
represent the best investment opportunities.
Rw
1. What are Groups used for?
Logo
a. Groups are used for cleaning up your workspace and
hiding unwanted fields
b. Groups are used to create bins that allow for the
visualization of distributions in Tableau
c. Groups are used to combine multiple categories of one
field into one category
d. Groups are used to create Pivots in Tableau
Rw
2. What is the difference between Static and Dynamic Sets?
Logo
a. Static sets are same as groups, Dynamic sets offer more
flexibility
b. Static Sets are hard coded, in contrast –Dynamic sets can be
changed as the data and analysis requirements change
c. No difference –Static sets are the same as Dynamic sets in
Tableau
d. Dynamic sets are hard-coded, in contrast –Static sets can be
changed as the data and analysis requirements change.
Rw
Challenge 2 – Animations
Logo
• You have been hired by the World Bank as a Tableau Developer
• Your first assignment is to deliver an animated dashboard showing
how populations of countries across the world have been developing
over the past 50 years.
• Specifically, the stakeholders of this assignment are interested to see
overall trends in fertility, life expectancy and population. In addition to
overall trends they would like to be able to drill into individual
countries.
Rw
1. Why would you ever need to edit blending relationships in
Tableau?
Logo
a. Editing blending relationships allow you to perform full outer joins of
two datasets in the connection manager window.
b. Editing blending relationships is always required when performing a
blend in tableau
c. Editing blending relationships may be required if tableau has picked
up the relationships incorrectly.
d. There is no need to edit blending relationships as Tableau always
automatically picks up the correct relationships.
Rw
2. What is the name of the shelf that facilitates the creation
animations in Tableau?
Logo
a. Filters
b. Marks
c. Pages
d. Measures
Rw
Challenge 3 – Advanced Mapping Techniques
Logo
1. Overcrowded Office:
• You have been hired by a law firm to assist with investigating a problem they are
having. This time it is not a legal matter, they require some assistance with
analyzing their meeting room usage patterns.
• Staff have been claiming there are never any meeting rooms available to book,
making it extremely difficult to meet with their clients.
• The firm’s partners are of the opinion that meeting rooms are not being utilized
properly, and suspect that rooms are often booked, but never used.
Rw
Cntd…
Logo
• An expansion to the office to have additional meeting rooms associated with
additional costs, and therefore the partners are reluctant to expand the office.
• You have been supplied with their existing floor plans for the two floors they are
occupying and require you to analyze the booked utilization vs. actual utilization of
all their meeting rooms. You need to use the floor plans as the base of your
visualization and use as a “map” to depict the meeting rooms.
• As there are two floors, the visualization needs to be able to move between the
two floors.
Rw
Challenge 4 – Advanced Mapping Techniques
Logo
Coffee Proximity
• The Megabucks Coffee Company have hired us to assist them in
analyzing the locations of their stores in Manhattan (NYC). They will be
opening new stores and need to prioritize locations based on their
latest vision.
• In their vision, they are aiming to ensure that their customers will never
be more than a ½ mile away from one of their stores. The priority will
therefore be to close the gaps between the existing stores, but they
need your help to identify the gaps.
Rw
Cntd…
Logo
• Using the supplied store data create maps for the following:
1) All current store locations – showing the monthly turnover and number
of months the store has been operating.
2) Calculate the distance between stores and highlight the stores which are
more than ½ mile from another branch.
• For this project, you need to use the client’s logo (provided as
separate file) as well as custom map backgrounds.
Rw
Challenge 5 – LOD Calculations
Logo
You have been approached by a retail chain operating in the U.S
They would like you to re-create this visualization, which is depicted
on the following page.
Notes:
• State colors represent the average profit across the cities of that
state
• Circle colors and sizes show the percent contribution of the profit
of the respective city towards the overall profit of the state
Rw
Cntd…
Logo
Rw
1. Which of the following statement is true when you add a new
dimension to your visualization?
Logo
a. Level of granularity increases, level of aggregation increases
b. Level of granularity decreases, level of aggregation decreases
c. Level of granularity increases, level of aggregation decreases
d. Level of granularity decreases, level of aggregation increases
Rw
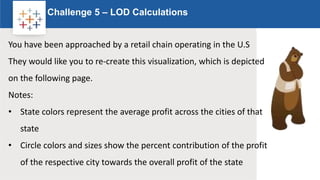
2. Which is the correct usage of the LOD INCLUDE?
Logo
a. {LOD INCLUDE: [GENDER] SUM([PROFIT])}
b. {INCLUDE [GENDER] : SUM([Profit])}
c. {INCLUDE SUM([Profit]): [Gender]}
d. {[Gender] INCLUDE :SUM([Profit])}
Any
Questions
so
far
Master tableau 20 in data science by solving real life analytics problems

Master tableau 20 in data science by solving real life analytics problems

  • 1.
    Salesforce Admin Group,Trichy Master Tableau 20 in Data Science by solving Real-Life Analytics Problems
  • 2.
    Kadhar Basha J SalesforceAdmin Group, Trichy Trailblazer Community Group Leader MST Solutions Sundaravel J Salesforce Admin Group, Trichy Trailblazer Community Group Co-Leader MST Solutions Salesforce Admin Group, Trichy
  • 3.
    Salesforce Admin Group,Trichy Speaker Nancy Jesurathinam MST Solutions
  • 4.
    Salesforce Admin Group,Trichy • Meetup Success • Public Interest • Social Media promotions • Leader contribution • Previous meetups • Achievement • Admin path
  • 5.
    Today’s Agenda • TableauGeneral Concepts • Challenge 1 - Groups and Sets • Challenge 2 - Animations • Challenge 3 - Advanced Mapping Techniques • Challenge 4 - Advanced Mapping Techniques • Challenge 5 - LOD Calculations
  • 6.
  • 7.
  • 8.
  • 9.
    Rw Live Vs Extract Logo Live allows you real-time data  Extracts are kind of batch which needs to be refreshed from time to time to get the updated data. •Incremental Refresh •Full Refresh (Default)
  • 10.
    Rw 4 Roles ofData Fields Logo
  • 11.
  • 12.
  • 13.
  • 14.
    Rw Filters Order ofOperation Logo
  • 15.
    Rw Organizing and SimplifyingData Part Logo  Sort  Hierarchies  Groups  Sets  Parameter Control
  • 16.
  • 17.
    Rw Adding Interactivity Logo  Filter Highlight  Go to URL  Go to Sheet  Change Parameter  Change Set Values
  • 18.
  • 19.
  • 20.
    Rw Challenge 1 –Groups and Sets Logo You have been approached by a Venture Capital Fund. The Board of Directors are currently viewing 1,000 potentially interesting startups and deciding on which ones they are going to invest in. The Criterion for selecting investments for this fund is a combination of: • High Revenue (2015) • Low Expenses (2015) • Top Growth (2015) Our task is to assist the board in identifying which businesses represent the best investment opportunities.
  • 21.
    Rw 1. What areGroups used for? Logo a. Groups are used for cleaning up your workspace and hiding unwanted fields b. Groups are used to create bins that allow for the visualization of distributions in Tableau c. Groups are used to combine multiple categories of one field into one category d. Groups are used to create Pivots in Tableau
  • 22.
    Rw 2. What isthe difference between Static and Dynamic Sets? Logo a. Static sets are same as groups, Dynamic sets offer more flexibility b. Static Sets are hard coded, in contrast –Dynamic sets can be changed as the data and analysis requirements change c. No difference –Static sets are the same as Dynamic sets in Tableau d. Dynamic sets are hard-coded, in contrast –Static sets can be changed as the data and analysis requirements change.
  • 23.
    Rw Challenge 2 –Animations Logo • You have been hired by the World Bank as a Tableau Developer • Your first assignment is to deliver an animated dashboard showing how populations of countries across the world have been developing over the past 50 years. • Specifically, the stakeholders of this assignment are interested to see overall trends in fertility, life expectancy and population. In addition to overall trends they would like to be able to drill into individual countries.
  • 24.
    Rw 1. Why wouldyou ever need to edit blending relationships in Tableau? Logo a. Editing blending relationships allow you to perform full outer joins of two datasets in the connection manager window. b. Editing blending relationships is always required when performing a blend in tableau c. Editing blending relationships may be required if tableau has picked up the relationships incorrectly. d. There is no need to edit blending relationships as Tableau always automatically picks up the correct relationships.
  • 25.
    Rw 2. What isthe name of the shelf that facilitates the creation animations in Tableau? Logo a. Filters b. Marks c. Pages d. Measures
  • 26.
    Rw Challenge 3 –Advanced Mapping Techniques Logo 1. Overcrowded Office: • You have been hired by a law firm to assist with investigating a problem they are having. This time it is not a legal matter, they require some assistance with analyzing their meeting room usage patterns. • Staff have been claiming there are never any meeting rooms available to book, making it extremely difficult to meet with their clients. • The firm’s partners are of the opinion that meeting rooms are not being utilized properly, and suspect that rooms are often booked, but never used.
  • 27.
    Rw Cntd… Logo • An expansionto the office to have additional meeting rooms associated with additional costs, and therefore the partners are reluctant to expand the office. • You have been supplied with their existing floor plans for the two floors they are occupying and require you to analyze the booked utilization vs. actual utilization of all their meeting rooms. You need to use the floor plans as the base of your visualization and use as a “map” to depict the meeting rooms. • As there are two floors, the visualization needs to be able to move between the two floors.
  • 28.
    Rw Challenge 4 –Advanced Mapping Techniques Logo Coffee Proximity • The Megabucks Coffee Company have hired us to assist them in analyzing the locations of their stores in Manhattan (NYC). They will be opening new stores and need to prioritize locations based on their latest vision. • In their vision, they are aiming to ensure that their customers will never be more than a ½ mile away from one of their stores. The priority will therefore be to close the gaps between the existing stores, but they need your help to identify the gaps.
  • 29.
    Rw Cntd… Logo • Using thesupplied store data create maps for the following: 1) All current store locations – showing the monthly turnover and number of months the store has been operating. 2) Calculate the distance between stores and highlight the stores which are more than ½ mile from another branch. • For this project, you need to use the client’s logo (provided as separate file) as well as custom map backgrounds.
  • 30.
    Rw Challenge 5 –LOD Calculations Logo You have been approached by a retail chain operating in the U.S They would like you to re-create this visualization, which is depicted on the following page. Notes: • State colors represent the average profit across the cities of that state • Circle colors and sizes show the percent contribution of the profit of the respective city towards the overall profit of the state
  • 31.
  • 32.
    Rw 1. Which ofthe following statement is true when you add a new dimension to your visualization? Logo a. Level of granularity increases, level of aggregation increases b. Level of granularity decreases, level of aggregation decreases c. Level of granularity increases, level of aggregation decreases d. Level of granularity decreases, level of aggregation increases
  • 33.
    Rw 2. Which isthe correct usage of the LOD INCLUDE? Logo a. {LOD INCLUDE: [GENDER] SUM([PROFIT])} b. {INCLUDE [GENDER] : SUM([Profit])} c. {INCLUDE SUM([Profit]): [Gender]} d. {[Gender] INCLUDE :SUM([Profit])}
  • 34.