Download to read offline


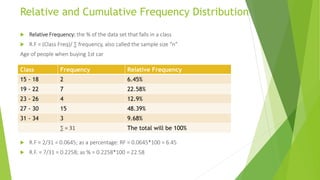
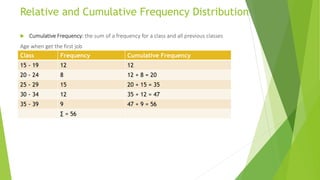
The document discusses relative and cumulative frequency distributions. Relative frequency is calculated as the class frequency divided by the total frequency and expresses the percentage of the data that falls into each class. Cumulative frequency is the sum of a class frequency and all previous class frequencies and represents the running total. An example of calculating relative and cumulative frequencies is provided for age data on when people bought their first car and got their first job.