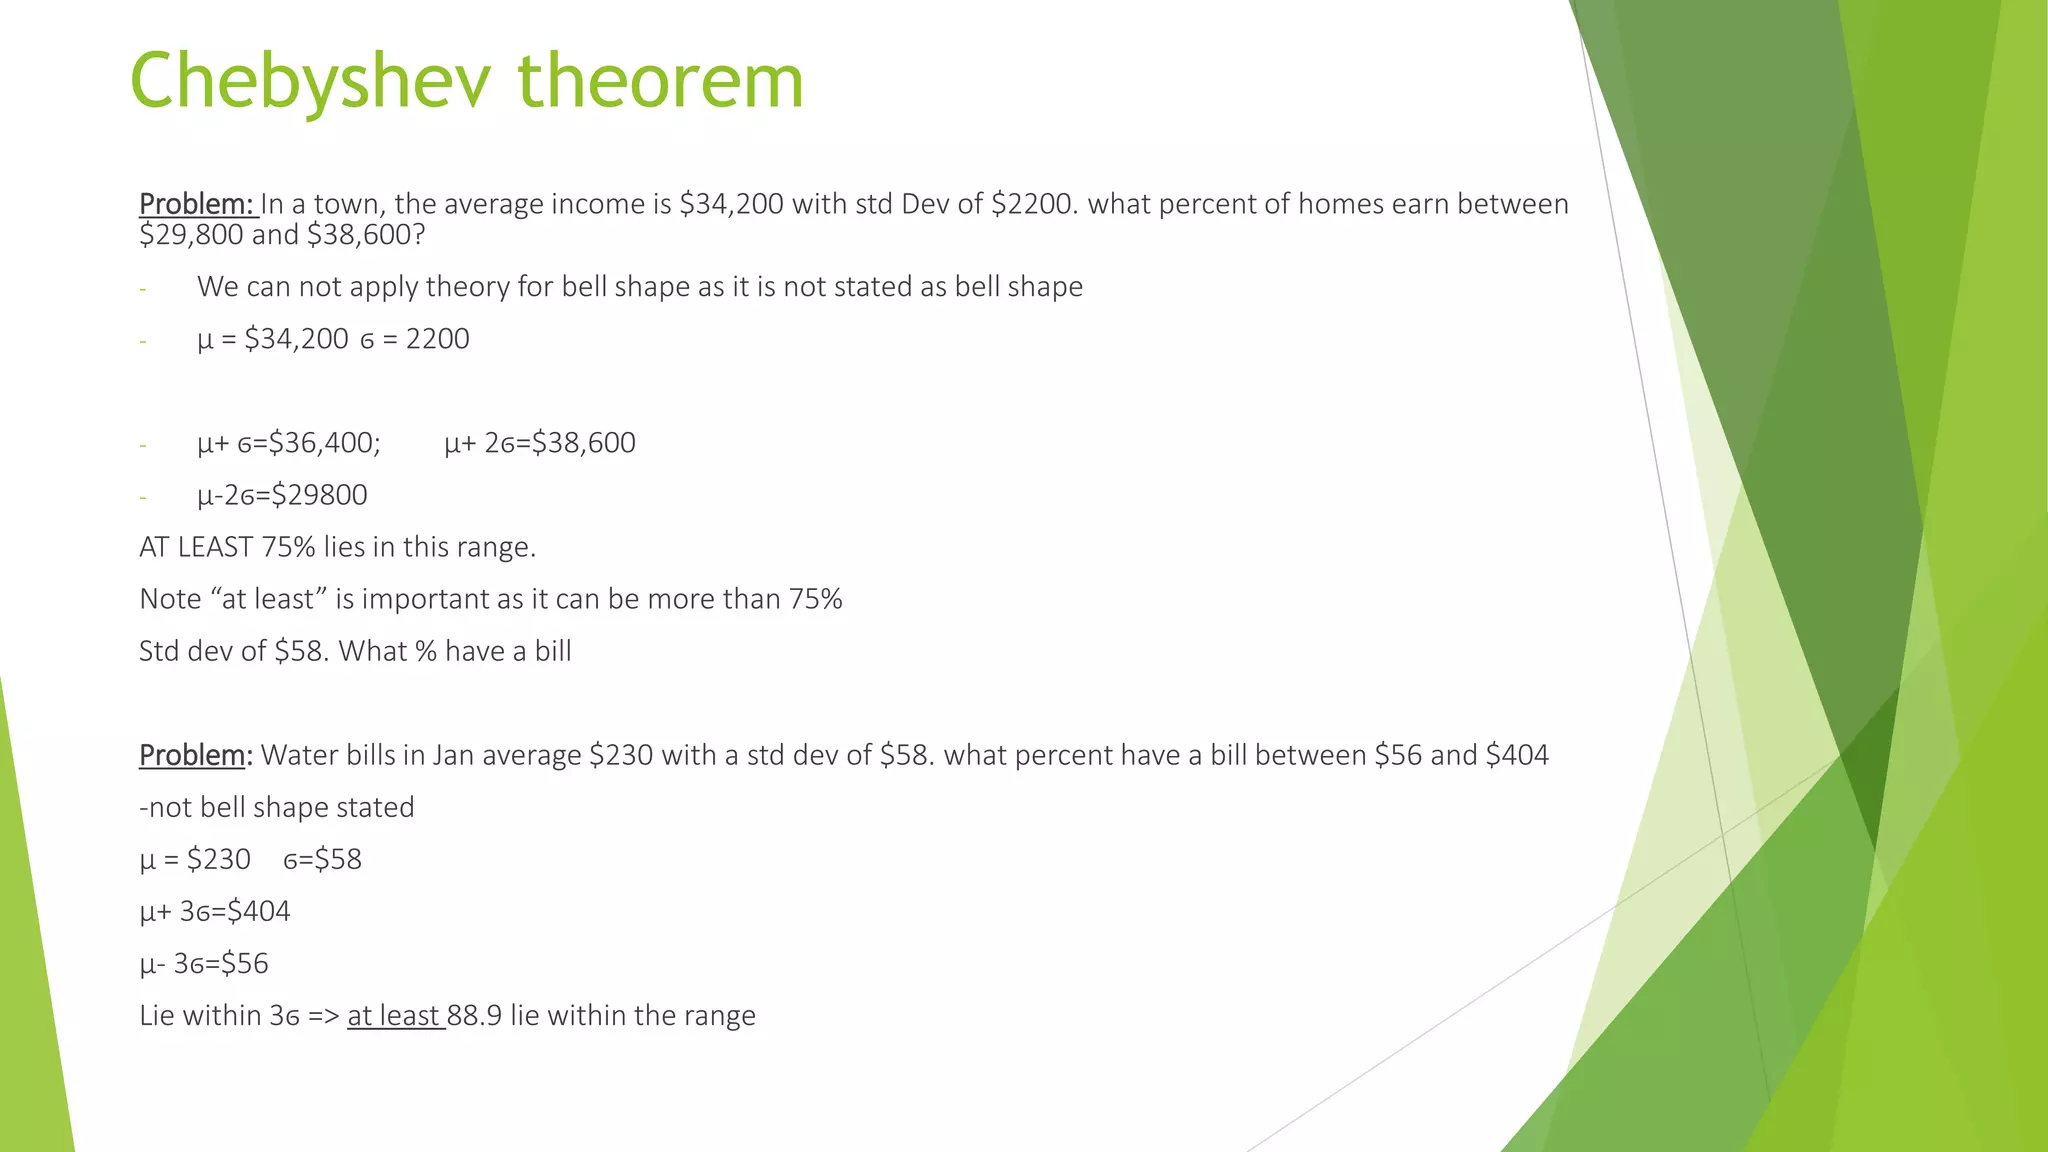
The Chebyshev theorem provides a lower bound for the percentage of data that lies within a certain number of standard deviations from the mean, even if the data is not normally distributed. It states that at least 75% of data lies within 2 standard deviations of the mean, and at least 88.9% lies within 3 standard deviations of the mean. The document provides examples of applying the Chebyshev theorem to calculate the minimum percentage of homes with incomes and water bills within given ranges.
2. Chebyshev theorem
- Main purpose of Chebyshev theorem is to address non bell shape
distributions.
- it is a rule of thumb for non bell shape. It is not exact as depend of
the shape.
- Only give us a minimum that apply. It give us a lower value: “at least
x% will fall within …”
Chebyshev Theorem: the % of the data that lies within “k” standard
deviation is AT LEAST 1-
𝟏
𝒌 𝟐 for k>1
For k=2: 1-
1
22 = 3/4 => 75% lie within 2ϭ of the mean
For k=3: 1-
1
32 = 8/9 => 88.9% lie within 3ϭ of the mean
Note: Does not apply for 1ϭ
3. Chebyshev theorem
Problem: In a town, the average income is $34,200 with std Dev of $2200. what percent of homes earn between
$29,800 and $38,600?
- We can not apply theory for bell shape as it is not stated as bell shape
- µ = $34,200 ϭ = 2200
- µ+ ϭ=$36,400; µ+ 2ϭ=$38,600
- µ-2ϭ=$29800
AT LEAST 75% lies in this range.
Note “at least” is important as it can be more than 75%
Std dev of $58. What % have a bill
Problem: Water bills in Jan average $230 with a std dev of $58. what percent have a bill between $56 and $404
-not bell shape stated
µ = $230 ϭ=$58
µ+ 3ϭ=$404
µ- 3ϭ=$56
Lie within 3ϭ => at least 88.9 lie within the range