Downloaded 375 times


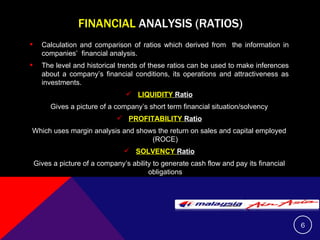
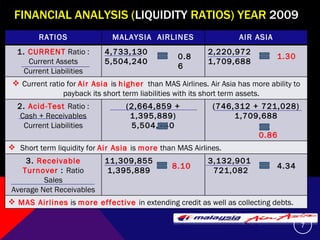
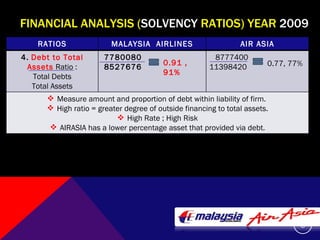
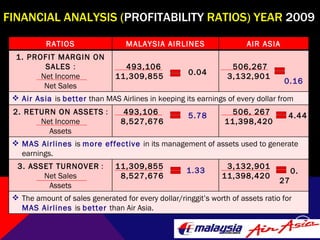
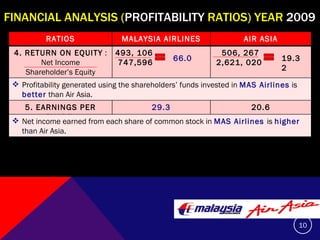
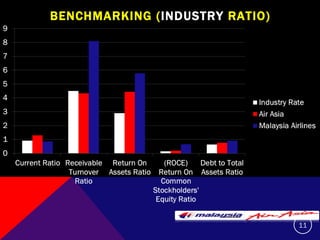
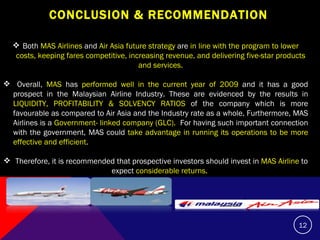


This document summarizes and compares the financial performance of Malaysia Airlines (MAS) and Air Asia based on an analysis of their financial ratios from 2009. The analysis finds that MAS had stronger liquidity, profitability, and solvency ratios compared to Air Asia in 2009. Specifically, MAS had higher current, acid-test, receivable turnover, return on assets, asset turnover, return on equity, and earnings per share ratios. Based on this analysis, the document recommends that prospective investors invest in MAS as it is expected to provide more favorable returns.


![[Traffic x Yield >< Output x Unit Cost] Air Asia](https://cdn.slidesharecdn.com/ss_thumbnails/airasiaslide-191127113729-thumbnail.jpg?width=640&height=640&fit=bounds)


