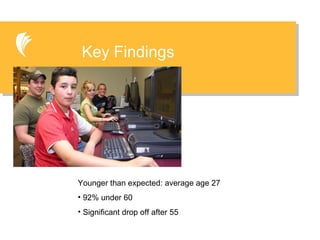
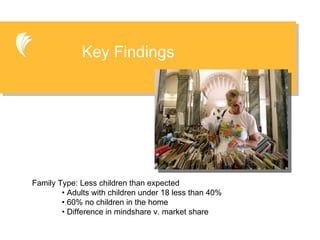
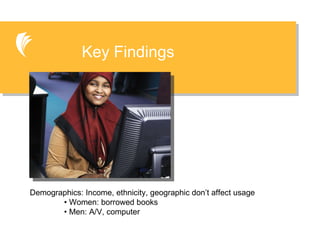
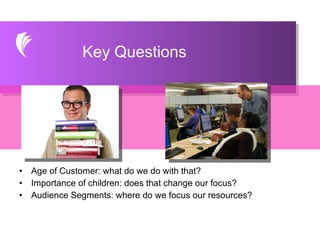
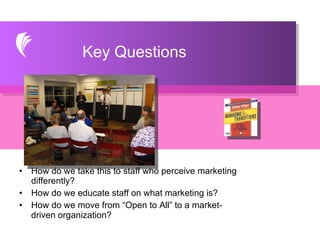
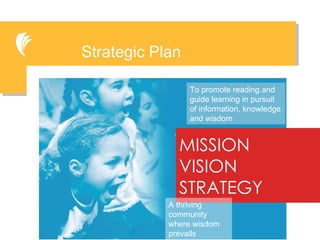
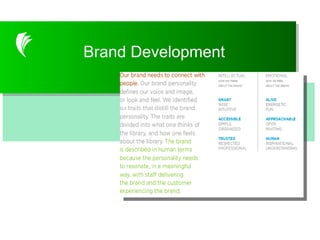
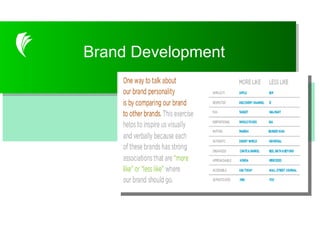
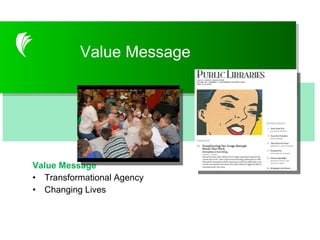
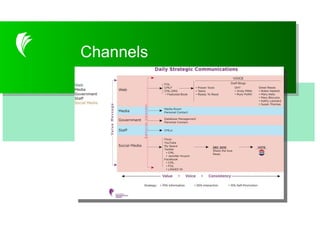
COLUMBUS METROPOLITAN  LIBRARY Marketing:  The Medium and the Message Alison Circle
 
You can do it.  We can help.   TM
Branding
Branding
Branding
Marketing:  process to meet needs of your customers Advertising:  Brings product to the attention of customers Promotion : Keeps product in mind of customer  Public Relations:  Ongoing activities to build a strong public image Publicity:  Mention in the media Market Research:  Understanding our customers Common Terms
OCLC Study Worldwide prefer speed to accuracy What is a library’s key differenator in the age of Google What is our Value Add?
Was this for stats on library Marketing Plan 1. Research 2. Key Messages 3. Identity 4. Build a Brand Culture 5. Visibility Campaign 6. Become Profession Leading
Was this for stats on library Marketing Plan Begins with research to understand how customer  behaves .
20,745 residents live within a 1-mile radius of the branch 7,396 cardholders live within a 1-mile radius of the branch Branch has a market penetration rate of 36% Penetration rates varied from 20% to 53% Cardholder Database
Studied behavior of customers in our branches: Where do they go; how long do they stay; what do they do? Customer Observation Study
Customer Intercept Survey Surveyed customers in 16 of 21 branches 25 different shifts 500 surveys in 11 days Customer Intercept Survey
1300 surveys completed Online Customer Survey
Same data points as customer surveys Gap analysis Online survey and direct interviews Staff Analysis
Standard-setting target marketing   since 1973 Lifestyle and behavior precision segmentation Combines demographic, consumer behavior, geographic information to target customers Claritas PRIZM Clusters
Rock On! Age Range: 18-35 Gender: skewed male Ethnicity: varies by geographic region Media Hounds
Hang out at the library  Age Range: 12-25 Gender: male/female, but skewed male in urban areas Ethnicity: varies by geographic region Socialites
Bookworms Check out lots of stuff! Age Range: 35-55 Gender: skewed heavily female
Key Findings Younger than expected: average age 27 92% under 60 Significant drop off after 55
Key Findings Family Type: Less children than expected •  Adults with children under 18 less than 40% •  60% no children in the home •  Difference in mindshare v. market share
Key Findings Demographics: Income, ethnicity, geographic don’t affect usage  •  Women: borrowed books  •  Men: A/V, computer
PSM Matrix
Age of Customer: what do we do with that? Importance of children: does that change our focus? Audience Segments: where do we focus our resources? Key Questions
Looking at customers by behavior not demographics: will our staff be willing to make this change? Key Questions
How do we take this to staff who perceive marketing differently? How do we educate staff on what marketing is? How do we move from “Open to All” to a market-driven organization? Key Questions
Who died and left marketing in charge?  Key Questions
Strategic Plan MISSION VISION STRATEGY To promote reading and guide learning in pursuit of information, knowledge and wisdom A thriving community where wisdom prevails
Strategic Plan
Young Minds Pre-School   (0-K) After School Hours Summer Break  Storytimes  Bookmobiles  Summer Reading Club  Homework  Help Centers  Teen  Centers  Volunteens  Ready to Read
Connected communities and individuals Virtual Users Over 2.2 million people will sign up  to use our computers this year.
Power Users
Customer Intercept Survey Brand Development
Customer Intercept Survey Key Differentiator Faces of our Staff Brand Development
Customer Intercept Survey Value Message Homework Help Centers Job Help Centers Ready to Read Brand Development
Customer Intercept Survey Value Message Transformational Agency Changing Lives Value Message
Customer Intercept Survey Channels
Success Story Ready to Read Corps Nearly $1 Million Raised Significant Media and Community Attention
The End

Marketing: The Medium and the Message

  • 1.
    COLUMBUS METROPOLITAN LIBRARY Marketing: The Medium and the Message Alison Circle
  • 2.
  • 3.
    You can doit. We can help. TM
  • 4.
  • 5.
  • 6.
  • 7.
    Marketing: processto meet needs of your customers Advertising: Brings product to the attention of customers Promotion : Keeps product in mind of customer Public Relations: Ongoing activities to build a strong public image Publicity: Mention in the media Market Research: Understanding our customers Common Terms
  • 8.
    OCLC Study Worldwideprefer speed to accuracy What is a library’s key differenator in the age of Google What is our Value Add?
  • 9.
    Was this forstats on library Marketing Plan 1. Research 2. Key Messages 3. Identity 4. Build a Brand Culture 5. Visibility Campaign 6. Become Profession Leading
  • 10.
    Was this forstats on library Marketing Plan Begins with research to understand how customer behaves .
  • 11.
    20,745 residents livewithin a 1-mile radius of the branch 7,396 cardholders live within a 1-mile radius of the branch Branch has a market penetration rate of 36% Penetration rates varied from 20% to 53% Cardholder Database
  • 12.
    Studied behavior ofcustomers in our branches: Where do they go; how long do they stay; what do they do? Customer Observation Study
  • 13.
    Customer Intercept SurveySurveyed customers in 16 of 21 branches 25 different shifts 500 surveys in 11 days Customer Intercept Survey
  • 14.
    1300 surveys completedOnline Customer Survey
  • 15.
    Same data pointsas customer surveys Gap analysis Online survey and direct interviews Staff Analysis
  • 16.
    Standard-setting target marketing since 1973 Lifestyle and behavior precision segmentation Combines demographic, consumer behavior, geographic information to target customers Claritas PRIZM Clusters
  • 17.
    Rock On! AgeRange: 18-35 Gender: skewed male Ethnicity: varies by geographic region Media Hounds
  • 18.
    Hang out atthe library Age Range: 12-25 Gender: male/female, but skewed male in urban areas Ethnicity: varies by geographic region Socialites
  • 19.
    Bookworms Check outlots of stuff! Age Range: 35-55 Gender: skewed heavily female
  • 20.
    Key Findings Youngerthan expected: average age 27 92% under 60 Significant drop off after 55
  • 21.
    Key Findings FamilyType: Less children than expected • Adults with children under 18 less than 40% • 60% no children in the home • Difference in mindshare v. market share
  • 22.
    Key Findings Demographics:Income, ethnicity, geographic don’t affect usage • Women: borrowed books • Men: A/V, computer
  • 23.
  • 24.
    Age of Customer:what do we do with that? Importance of children: does that change our focus? Audience Segments: where do we focus our resources? Key Questions
  • 25.
    Looking at customersby behavior not demographics: will our staff be willing to make this change? Key Questions
  • 26.
    How do wetake this to staff who perceive marketing differently? How do we educate staff on what marketing is? How do we move from “Open to All” to a market-driven organization? Key Questions
  • 27.
    Who died andleft marketing in charge? Key Questions
  • 28.
    Strategic Plan MISSIONVISION STRATEGY To promote reading and guide learning in pursuit of information, knowledge and wisdom A thriving community where wisdom prevails
  • 29.
  • 30.
    Young Minds Pre-School (0-K) After School Hours Summer Break Storytimes Bookmobiles Summer Reading Club Homework Help Centers Teen Centers Volunteens Ready to Read
  • 31.
    Connected communities andindividuals Virtual Users Over 2.2 million people will sign up to use our computers this year.
  • 32.
  • 33.
    Customer Intercept SurveyBrand Development
  • 34.
    Customer Intercept SurveyBrand Development
  • 35.
    Customer Intercept SurveyBrand Development
  • 36.
    Customer Intercept SurveyKey Differentiator Faces of our Staff Brand Development
  • 37.
    Customer Intercept SurveyValue Message Homework Help Centers Job Help Centers Ready to Read Brand Development
  • 38.
    Customer Intercept SurveyValue Message Transformational Agency Changing Lives Value Message
  • 39.
  • 40.
  • 41.
  • 42.
    Success Story Readyto Read Corps Nearly $1 Million Raised Significant Media and Community Attention
  • 43.

Editor's Notes

  • #2 Our job is: To help raise awareness of the library, its programs and services, its brand To help build advocacy in the form of grants, donations, volunteer support and community support. And to help assure that we meet the community’s needs in a way that allows us to be efficient and act as good stewards of our stakehloders’ investment. Just over 100 years ago, the crowning touch was etched over the front doors of Main Library in Columbus, Ohio. Funded through a substantial grant from Andrew Carnegie, this library was one of the few endowed by Carnegie that served a center city population. “Open to All” was permanently chiseled in an old-fashioned gothic font. For generations that concept has been the driving principle behind Columbus Metropolitan Library’s (CML) decisions and strategies. However, trying to be all things to all people is getting harder and harder when resources are diminishing. How do we balance and focus our resources, yet stay true to the fundamental tenant of universal access? The answer for us has been to build our strategy on marketing research.
  • #3 Think back one hundred years to Sears, Roebuck and their, at the time, state-of-the-art catalog. It contained something for everyone: tools, furniture, clothing, even pre-fabricated houses. The only attempt they made to segment their audience was to ensure that men’s and women’s clothing were in separate sections of the catalog. This was the pinnacle of mass marketing. But what happened to that catalog? What happened to mass marketing? As a society, we have progressively moved further and further from a mass market, broadcasting approach to a narrowcasting approach. Marketing now focuses on how customers behave and segments those behaviors into like clusters. And as customer, all of us appreciate it when we are treated with personal respect.
  • #4 Look at Home Depot. They target customers who want to fix things and who exhibit behaviors of pride of ownership, protection of investment, family security. They don’t necessarily focus on ethnicity, gender or age. They focus on behavior. In the world of Web 2.0, this trend is only growing narrower, as groups are developing micro-clusters of like-interest and attitudes. And with technology moving quickly, we are only beginning to understand how it might affect our library brand.
  • #5 You might wonder, why bother? Isn’t marketing what libraries do when they put up posters, produce newsletters, and issue press releases? From a professional marketing perspective, those are all tactics, and are subsets of marketing. In most cases they are disconnected from marketing fundamentals. Let’s start with some common understandings: Marketing is the wide range of activities involved in making sure that you continue to meet the needs of your customers, and that they get value in return. It starts with market research to find out what groups of potential customers exist, what their needs are, which of those needs you can meet, and how you should meet them. Marketing also includes analyzing the competition, positioning yourself in the mind of the customer, and promoting through continued advertising, promotions, public relations, and publicity. Advertising brings a product to the attention of potential and current customers. Advertising is typically done with signs, brochures, commercials, direct mailings, e-mail, etc. Promotion keeps the product in the mind of the customer and stimulates demand for the product. Promotion involves ongoing advertising and publicity. Public relations is ongoing activities and events to ensure a company has a strong public image. Public relations activities include helping the public to understand the company and its products. Publicity is mention in the media. Organizations usually have little control over the message in the media, at least not as they do in advertising. Reporters and writers decide what will be said.
  • #6 You might wonder, why bother? Isn’t marketing what libraries do when they put up posters, produce newsletters, and issue press releases? From a professional marketing perspective, those are all tactics, and are subsets of marketing. In most cases they are disconnected from marketing fundamentals. Let’s start with some common understandings: Marketing is the wide range of activities involved in making sure that you continue to meet the needs of your customers, and that they get value in return. It starts with market research to find out what groups of potential customers exist, what their needs are, which of those needs you can meet, and how you should meet them. Marketing also includes analyzing the competition, positioning yourself in the mind of the customer, and promoting through continued advertising, promotions, public relations, and publicity. Advertising brings a product to the attention of potential and current customers. Advertising is typically done with signs, brochures, commercials, direct mailings, e-mail, etc. Promotion keeps the product in the mind of the customer and stimulates demand for the product. Promotion involves ongoing advertising and publicity. Public relations is ongoing activities and events to ensure a company has a strong public image. Public relations activities include helping the public to understand the company and its products. Publicity is mention in the media. Organizations usually have little control over the message in the media, at least not as they do in advertising. Reporters and writers decide what will be said.
  • #7 You might wonder, why bother? Isn’t marketing what libraries do when they put up posters, produce newsletters, and issue press releases? From a professional marketing perspective, those are all tactics, and are subsets of marketing. In most cases they are disconnected from marketing fundamentals. Let’s start with some common understandings: Marketing is the wide range of activities involved in making sure that you continue to meet the needs of your customers, and that they get value in return. It starts with market research to find out what groups of potential customers exist, what their needs are, which of those needs you can meet, and how you should meet them. Marketing also includes analyzing the competition, positioning yourself in the mind of the customer, and promoting through continued advertising, promotions, public relations, and publicity. Advertising brings a product to the attention of potential and current customers. Advertising is typically done with signs, brochures, commercials, direct mailings, e-mail, etc. Promotion keeps the product in the mind of the customer and stimulates demand for the product. Promotion involves ongoing advertising and publicity. Public relations is ongoing activities and events to ensure a company has a strong public image. Public relations activities include helping the public to understand the company and its products. Publicity is mention in the media. Organizations usually have little control over the message in the media, at least not as they do in advertising. Reporters and writers decide what will be said.
  • #8 You might wonder, why bother? Isn’t marketing what libraries do when they put up posters, produce newsletters, and issue press releases? From a professional marketing perspective, those are all tactics, and are subsets of marketing. In most cases they are disconnected from marketing fundamentals. Let’s start with some common understandings: Marketing is the wide range of activities involved in making sure that you continue to meet the needs of your customers, and that they get value in return. It starts with market research to find out what groups of potential customers exist, what their needs are, which of those needs you can meet, and how you should meet them. Marketing also includes analyzing the competition, positioning yourself in the mind of the customer, and promoting through continued advertising, promotions, public relations, and publicity. Advertising brings a product to the attention of potential and current customers. Advertising is typically done with signs, brochures, commercials, direct mailings, e-mail, etc. Promotion keeps the product in the mind of the customer and stimulates demand for the product. Promotion involves ongoing advertising and publicity. Public relations is ongoing activities and events to ensure a company has a strong public image. Public relations activities include helping the public to understand the company and its products. Publicity is mention in the media. Organizations usually have little control over the message in the media, at least not as they do in advertising. Reporters and writers decide what will be said.
  • #9 Let’s come back to Columbus Metropolitan Library and that “Open to All” sign. While still thriving as a community resource, CML is facing nearly ten years of flat funding, 100 less staff, Main Library plus 20 branches, a deeply diverse customer base, and a new world where the world’s information is accessible at the kitchen table. How can we remain “Open to All” and market ourselves in a way that demonstrates our relevance to our customers and our community in a world that has taught our customers to expect niche marketing?
  • #10 To answer these questions, CML began a rigorous, professionally led Marketing Plan, directed by an internal team of new hires, who came to the organization with extensive marketing experience. The critical first step of the plan was to conduct extensive research into our customers. All marketing begins with knowing your customer. Not just demographic profiles, but how they behave. CML had conducted some general customer feedback in the past, but it centered on assessment of service. It provided little information about the customers themselves. We put together a cross-departmental internal team to provide us with front-line perspectives and studied our customers and staff five ways. Because finding non-cardholders is very expensive, and because we were just starting out, we focused on current library users and not non-users.
  • #11 To answer these questions, CML began a rigorous, professionally led Marketing Plan, directed by an internal team of new hires, who came to the organization with extensive marketing experience. The critical first step of the plan was to conduct extensive research into our customers. All marketing begins with knowing your customer. Not just demographic profiles, but how they behave. CML had conducted some general customer feedback in the past, but it centered on assessment of service. It provided little information about the customers themselves. We put together a cross-departmental internal team to provide us with front-line perspectives and studied our customers and staff five ways. Because finding non-cardholders is very expensive, and because we were just starting out, we focused on current library users and not non-users.
  • #12 Cardholder database analysis – we plotted gender, age, addresses and zip codes against our service districts and created specific profiles for each branch. This information included growth projections, racial/ethnicity breakdown, household income levels and projected change over the next five years, education levels, and penetration levels. A penetration level is the percentage of cardholders within a specific radius of a branch. In marketing terms it is considered market share. For example: • Our Driving Park branch has 20,745 residents within its one-mile service area • 7,369 cardholders live within that one-mile radius • The penetration rate is 36% We established penetration rates as a baseline for each of our branches, and the rates varied from 20% to 53%. Helpful tips: Export cardholder addresses into a simple GIS mapping software program and compare to population trends in your service area. What are the gaps? Where are the opportunities? One inexpensive solution includes Microsoft’s MapPoint software with simple import wizards to simplify the process. Other options include assistance from your local county auditor or municipal planners. Census data is now more than six years old. Refresh your population numbers at www.census.gov to get updated population estimates and projections. Is your community growing? Which age groups are increasing or declining? How do these trends impact your library?
  • #13 Customer observation study – We observed our customers in our branches and studied how they behave. Where do they go when they walk in the door, how long do they stay, what do they do? Helpful tip: Conduct your own observation study to determine the dominant customer behaviors at your library. Create a game plan to capture data, be unobtrusive and compile the results. What consistencies do you see across your branches? Are there unique behaviors based on time of day or location?
  • #14 Customer intercept survey – Next we talked to our customers on site. Clipboards in hand, we surveyed customers in 16 of our 21 branches over 25 different shifts to capture a representative sample. We collected more than 500 surveys over 11 days. Helpful tip: You can create your own intercept survey using paper-based surveys, hand-held devices, or computer stations. College students, your local Friends group or other volunteers can serve as your data collection specialists. Paper-based surveys proved to be the most user-friendly, but required labor-intensive, manual results tabulation. Be sure to test your survey prior to collecting responses to ensure questions are clear and logical .
  • #15 Online customer survey – An online survey contained the same questions as the customer intercept survey, plus questions about online services. More than 1,300 surveys were completed. Helpful tip: Online tools such as SurveyMonkey are easy and affordable. An effective way to secure better response rates is to notify cardholders about the survey through e-mail rather than postcard. The survey can be posted on your library web site – either on the home page or at another location.
  • #16 Staff analysis – We asked our staff their perception of our customers, using the same data points as the customer surveys. We wanted to uncover any gaps between staff and the realities we were uncovering. And, yes, there were a few. The staff analysis was conducted in two parts: an online survey to all staff members and direct interviews with key staff members, board members, and Friends of the Library.
  • #17 Using these multiple research instruments–web survey, intercept surveys, observation studies–CML began to change how it traditionally looked at customers, moving from a demographic to a behavioral viewpoint Using the Claritas PRIZM clusters analysis, we segmented our customers into eight behavior clusters. PRIZM combines demographic, consumer behavior, and geographic data to help marketers identify, understand, and target customers. (PRIZM traditionally names the clusters with clever or deliberately attention-getting names in order to help define the groups and to remember them.) With this customer segmentation, we committed to the idea of treating each customer type appropriately, not equally. Some of the eight segments include:
  • #19 22 Locations 800 + Staff $54 million budget 3 million circulation annually 8 million visitors annually 3rd most visited website in Franklin County
  • #20 Other segments: Power Users Drive Throughs Virtual Users Young Minds Light weights See article for greater profile
  • #21 Key Findings Evaluating all the research as a whole we synthesized all the information into key findings. Some findings were not surprising and fell in line with OCLC’s Perceptions of Libraries and Information Resources1 and the Americans for Libraries Council/Bill & Melinda Gates Foundation study. Other findings were quite unexpected, and worthy of note: Age: Visitors and cardholders were much younger than anticipated. Dominant customer age groups were 25-34 and 35-44, and mirrored the demographics of the metropolitan area. Ninety-two percent of all cardholders were under 60, and the significant drop-off point for cardholding and usage was 55.
  • #22 Family Type: While many staff saw our core users as families with children, adults with children under the age of 18 accounted for less than 40 percent of all patrons and regular library users. Sixty percent, therefore, do not have children or the children are no longer at home. This finding also was consistent with family types throughout the metropolitan area. It was an interesting case of mindshare vs. actual market share.
  • #23 Demographic Factors: Surprisingly, neither income, ethnicity nor geography affected difference in usage. There were slight differences based on age, primarily among 18-21 year olds who listed their main usage as “using the computer/Internet.” Gender also yielded minor variation in responses. Women were more likely to list “browse/borrow books and other printed materials for adults,” while men tended more toward “browse/borrow AV materials” or “use the computer/Internet.” Behavioral Patterns: While there was not a significant usage pattern based on demographics, behavior was another matter. Customers who checked out books and other materials tended to check out a high number of materials at one time. Browsers were more likely to select few or no items for checkout. On the other hand, computer users showed a strong likelihood of devoting large blocks of time to this pursuit and typically don’t frequent other parts of the library.
  • #24 The team completed the PSM Matrix and the answers were combined to form an aggregate-consensus matrix of the team. Each business group was discussed in detail based on the cluster rankings, agreed upon, and tactical considerations were presented for further development. After careful study, the leadership team selected Young Minds as the top cluster, followed by Power Users, and Virtual Users. Clearly these groups are our most important customer base and the ones we whose needs and values most closely reflect the charter of the library.
  • #25 Staff analysis – We asked our staff their perception of our customers, using the same data points as the customer surveys. We wanted to uncover any gaps between staff and the realities we were uncovering. And, yes, there were a few. The staff analysis was conducted in two parts: an online survey to all staff members and direct interviews with key staff members, board members, and Friends of the Library.
  • #26 Staff analysis – We asked our staff their perception of our customers, using the same data points as the customer surveys. We wanted to uncover any gaps between staff and the realities we were uncovering. And, yes, there were a few. The staff analysis was conducted in two parts: an online survey to all staff members and direct interviews with key staff members, board members, and Friends of the Library.
  • #27 Staff analysis – We asked our staff their perception of our customers, using the same data points as the customer surveys. We wanted to uncover any gaps between staff and the realities we were uncovering. And, yes, there were a few. The staff analysis was conducted in two parts: an online survey to all staff members and direct interviews with key staff members, board members, and Friends of the Library.
  • #28 Staff analysis – We asked our staff their perception of our customers, using the same data points as the customer surveys. We wanted to uncover any gaps between staff and the realities we were uncovering. And, yes, there were a few. The staff analysis was conducted in two parts: an online survey to all staff members and direct interviews with key staff members, board members, and Friends of the Library.
  • #29 Next we sought to make this commitment come alive in our strategic and tactical plans. In prior years our strategic plan focused on ourselves and our delivery to customers. In 2006, for example, we stated: 1) We provide excellent service to all. 2) We understand and respond to the hopes, aspirations, and needs of our community. 3) We market, promote and merchandise the library’s value to the community. Today the cornerstone of our strategic plan is our customer, not ourselves:
  • #30 For each of these strategies we have built out 5-to-10 year strategic goals, some of which are inspirationally aspirational. For example: In a state where kindergarten readiness is only 60%, our long term goal is to help drive that to 90%. And in true CML fashion, we are not done yet. Each year we build out a tactical plan, identifying new opportunities to pursue within a year. In 2008, the entire tactical plan was built upon these customer segments. Only those initiatives that tie to these segments received funding. All libraries are presented with opportunities every day–a recycle day, a history day, an inventors day….you name it. Now, using our strategic filter, staff understand how decisions get made and how priorities are determined. A sample of ideas that made it to our tactical plan this year include: implement three new Homework Help Centers (Young Minds); create online interactive galleries (Virtual Users); self-check out upgrades that include Spanish (Power Users). A critical step in ensuring the success of this new approach at CML is securing staff buy-in. CML spent considerable effort engaging our staff in this new approach. As the segmentation has gained momentum, it has become the framework for everything we do.
  • #31 10% of cardholders
  • #32 Our strategy is to make technology open to all with an outcome of connected individuals and communities. Over 2.2 million people have signed up to use our computers so far this year. *The Loft will be used to provide free, web-based training for our public, as well as an opportunity for groups and businesses to provide their own training. * 20 new computers that can be used by the public when not reserved. In this digital age, it is necessary for people to have access to technology in order to function in society. Our staff is on hand to help our patrons communicate with family members on the other side of the globe, open e-mail accounts and apply for jobs online. At Northern Lights, demand exceeds capacity. 2008 ASK Trailer at Northern Lights?
  • #33 22 Locations 800 + Staff $54 million budget 3 million circulation annually 8 million visitors annually 3rd most visited website in Franklin County
  • #34 Customer intercept survey – Next we talked to our customers on site. Clipboards in hand, we surveyed customers in 16 of our 21 branches over 25 different shifts to capture a representative sample. We collected more than 500 surveys over 11 days. Helpful tip: You can create your own intercept survey using paper-based surveys, hand-held devices, or computer stations. College students, your local Friends group or other volunteers can serve as your data collection specialists. Paper-based surveys proved to be the most user-friendly, but required labor-intensive, manual results tabulation. Be sure to test your survey prior to collecting responses to ensure questions are clear and logical .
  • #35 Customer intercept survey – Next we talked to our customers on site. Clipboards in hand, we surveyed customers in 16 of our 21 branches over 25 different shifts to capture a representative sample. We collected more than 500 surveys over 11 days. Helpful tip: You can create your own intercept survey using paper-based surveys, hand-held devices, or computer stations. College students, your local Friends group or other volunteers can serve as your data collection specialists. Paper-based surveys proved to be the most user-friendly, but required labor-intensive, manual results tabulation. Be sure to test your survey prior to collecting responses to ensure questions are clear and logical .
  • #36 Customer intercept survey – Next we talked to our customers on site. Clipboards in hand, we surveyed customers in 16 of our 21 branches over 25 different shifts to capture a representative sample. We collected more than 500 surveys over 11 days. Helpful tip: You can create your own intercept survey using paper-based surveys, hand-held devices, or computer stations. College students, your local Friends group or other volunteers can serve as your data collection specialists. Paper-based surveys proved to be the most user-friendly, but required labor-intensive, manual results tabulation. Be sure to test your survey prior to collecting responses to ensure questions are clear and logical .
  • #37 Customer intercept survey – Next we talked to our customers on site. Clipboards in hand, we surveyed customers in 16 of our 21 branches over 25 different shifts to capture a representative sample. We collected more than 500 surveys over 11 days. Helpful tip: You can create your own intercept survey using paper-based surveys, hand-held devices, or computer stations. College students, your local Friends group or other volunteers can serve as your data collection specialists. Paper-based surveys proved to be the most user-friendly, but required labor-intensive, manual results tabulation. Be sure to test your survey prior to collecting responses to ensure questions are clear and logical .
  • #38 Customer intercept survey – Next we talked to our customers on site. Clipboards in hand, we surveyed customers in 16 of our 21 branches over 25 different shifts to capture a representative sample. We collected more than 500 surveys over 11 days. Helpful tip: You can create your own intercept survey using paper-based surveys, hand-held devices, or computer stations. College students, your local Friends group or other volunteers can serve as your data collection specialists. Paper-based surveys proved to be the most user-friendly, but required labor-intensive, manual results tabulation. Be sure to test your survey prior to collecting responses to ensure questions are clear and logical .
  • #39 Customer intercept survey – Next we talked to our customers on site. Clipboards in hand, we surveyed customers in 16 of our 21 branches over 25 different shifts to capture a representative sample. We collected more than 500 surveys over 11 days. Helpful tip: You can create your own intercept survey using paper-based surveys, hand-held devices, or computer stations. College students, your local Friends group or other volunteers can serve as your data collection specialists. Paper-based surveys proved to be the most user-friendly, but required labor-intensive, manual results tabulation. Be sure to test your survey prior to collecting responses to ensure questions are clear and logical .
  • #40 Customer intercept survey – Next we talked to our customers on site. Clipboards in hand, we surveyed customers in 16 of our 21 branches over 25 different shifts to capture a representative sample. We collected more than 500 surveys over 11 days. Helpful tip: You can create your own intercept survey using paper-based surveys, hand-held devices, or computer stations. College students, your local Friends group or other volunteers can serve as your data collection specialists. Paper-based surveys proved to be the most user-friendly, but required labor-intensive, manual results tabulation. Be sure to test your survey prior to collecting responses to ensure questions are clear and logical .
  • #41 Customer intercept survey – Next we talked to our customers on site. Clipboards in hand, we surveyed customers in 16 of our 21 branches over 25 different shifts to capture a representative sample. We collected more than 500 surveys over 11 days. Helpful tip: You can create your own intercept survey using paper-based surveys, hand-held devices, or computer stations. College students, your local Friends group or other volunteers can serve as your data collection specialists. Paper-based surveys proved to be the most user-friendly, but required labor-intensive, manual results tabulation. Be sure to test your survey prior to collecting responses to ensure questions are clear and logical .
  • #42 Customer intercept survey – Next we talked to our customers on site. Clipboards in hand, we surveyed customers in 16 of our 21 branches over 25 different shifts to capture a representative sample. We collected more than 500 surveys over 11 days. Helpful tip: You can create your own intercept survey using paper-based surveys, hand-held devices, or computer stations. College students, your local Friends group or other volunteers can serve as your data collection specialists. Paper-based surveys proved to be the most user-friendly, but required labor-intensive, manual results tabulation. Be sure to test your survey prior to collecting responses to ensure questions are clear and logical .
  • #43 22 Locations 800 + Staff $54 million budget 3 million circulation annually 8 million visitors annually 3rd most visited website in Franklin County