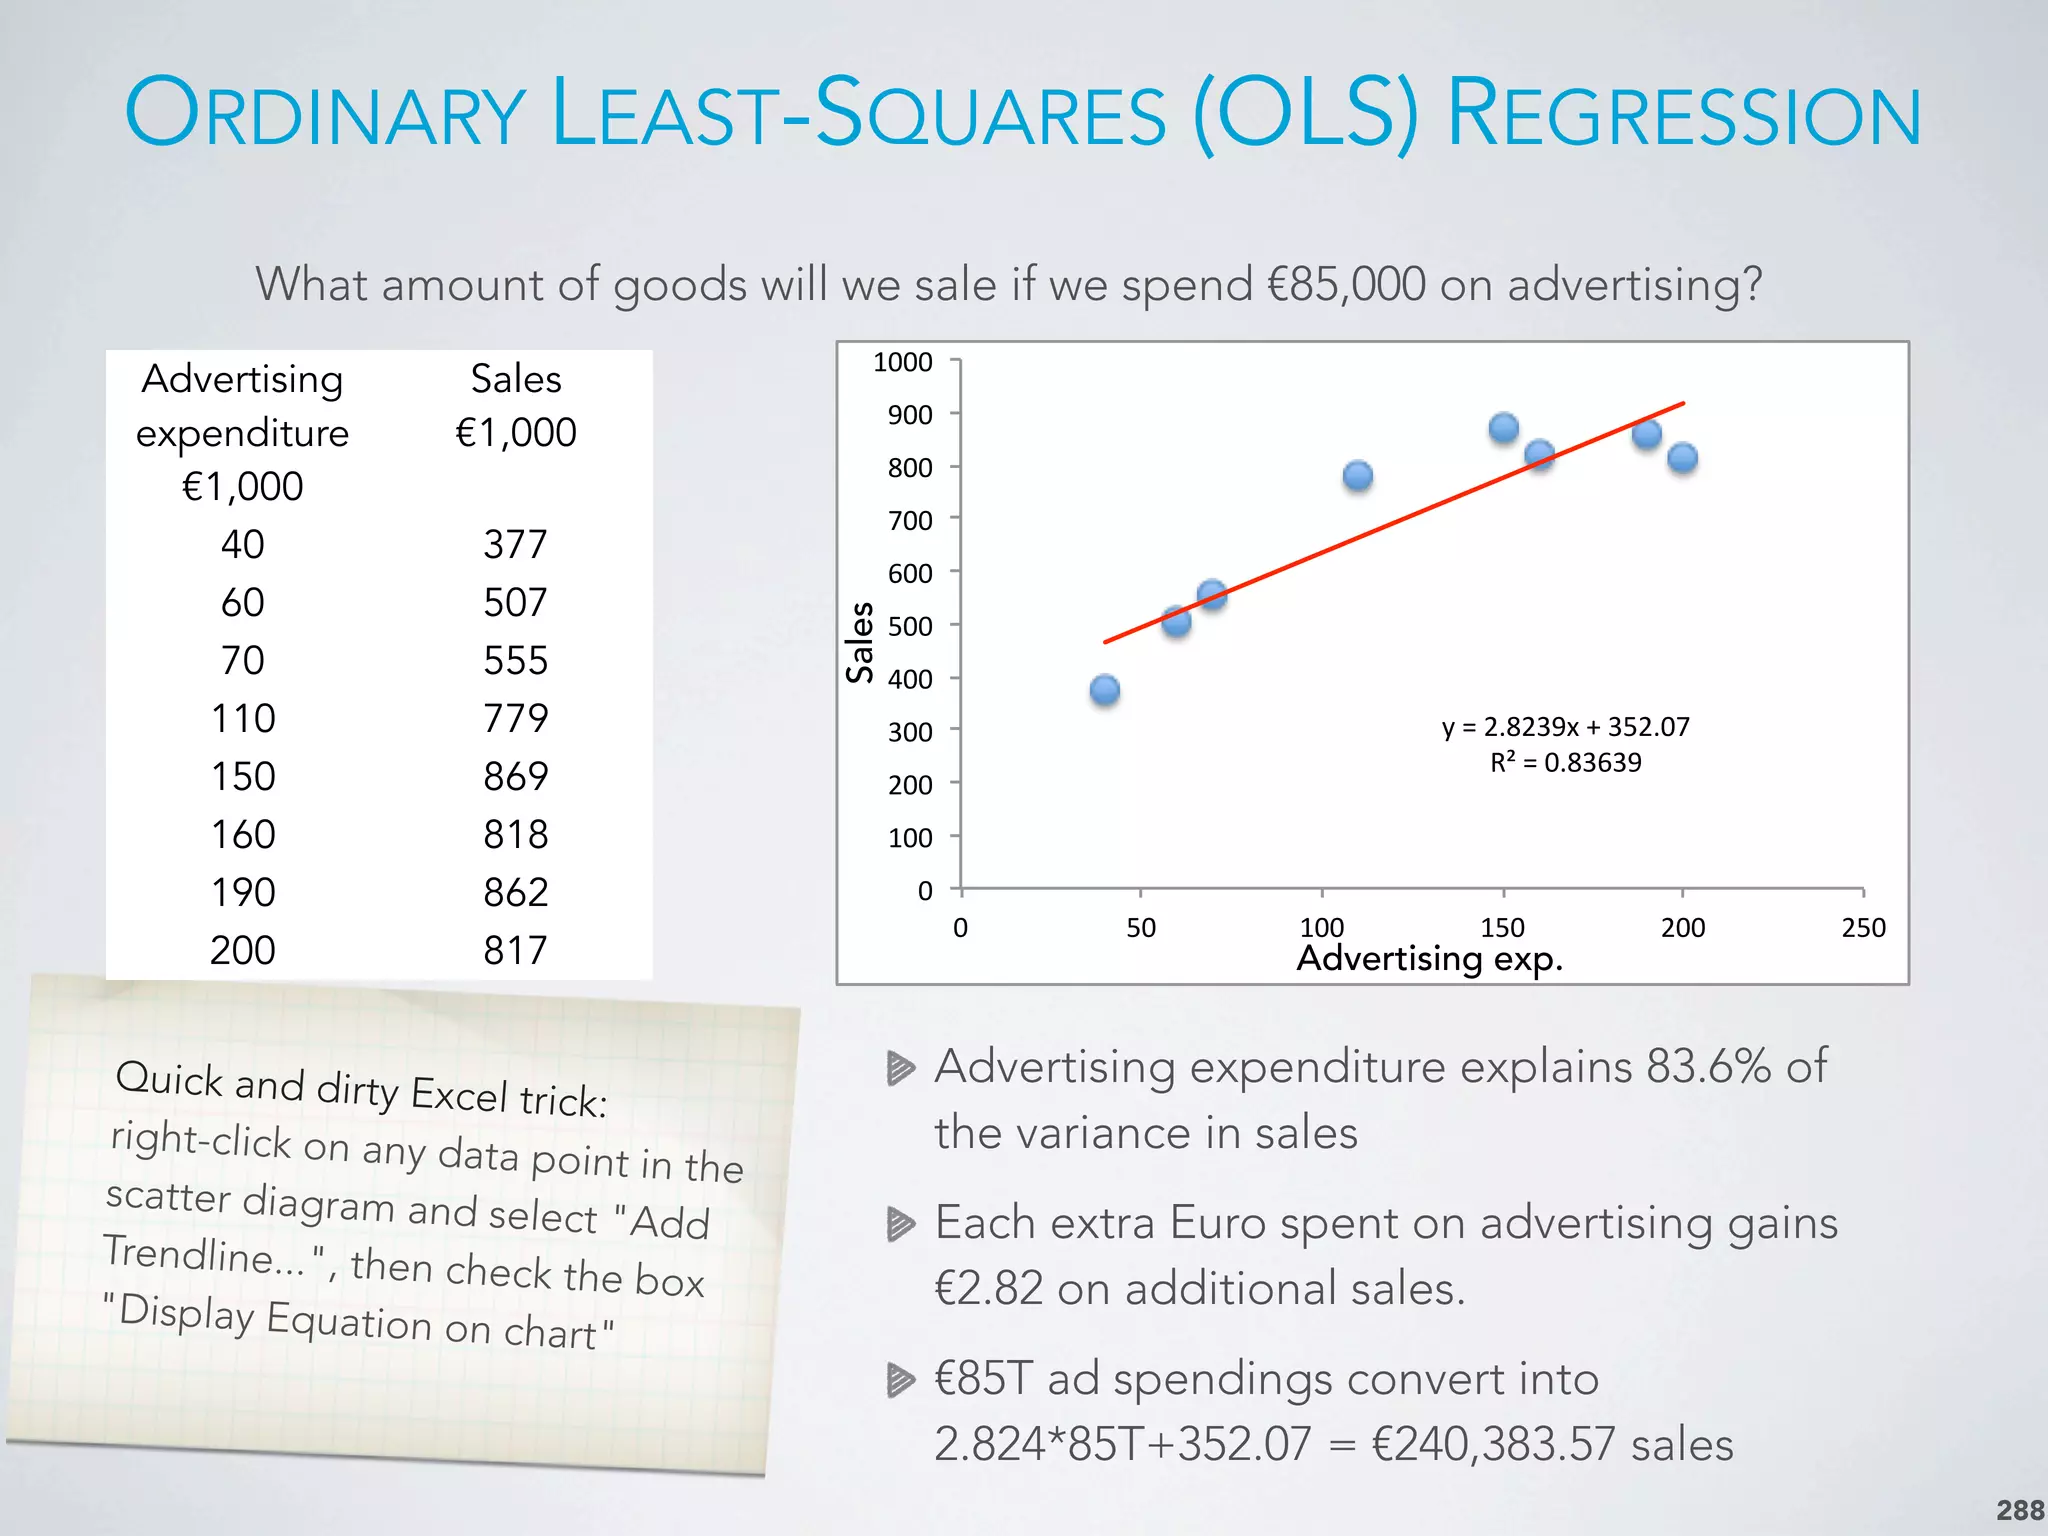
Download as PDF, PPTX


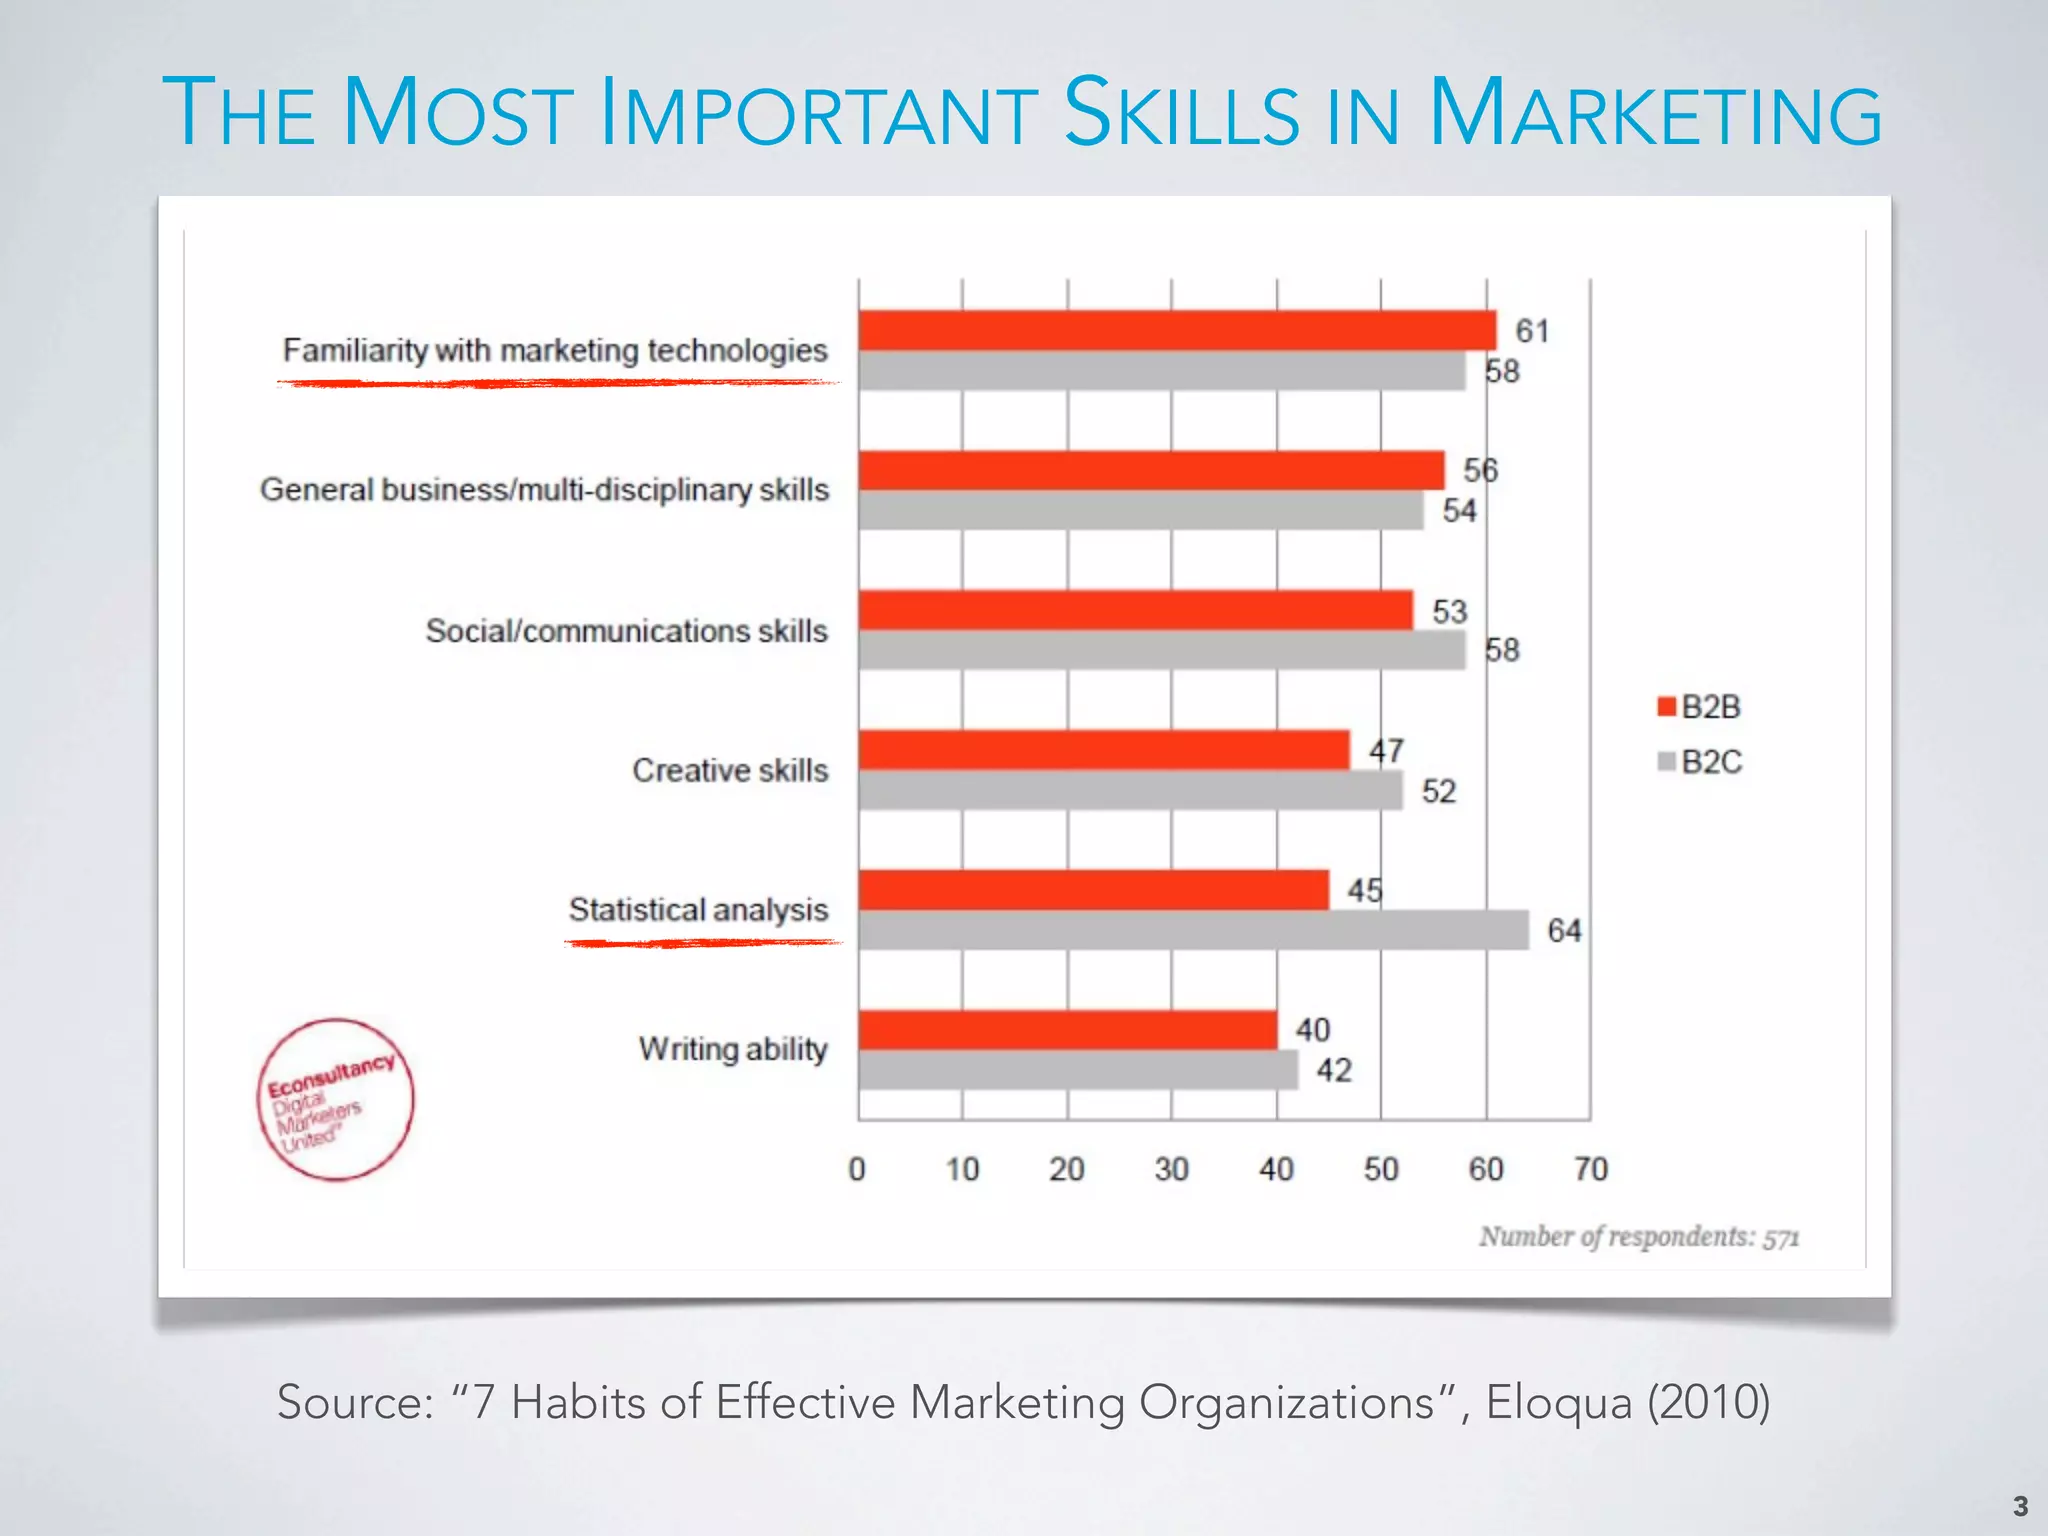


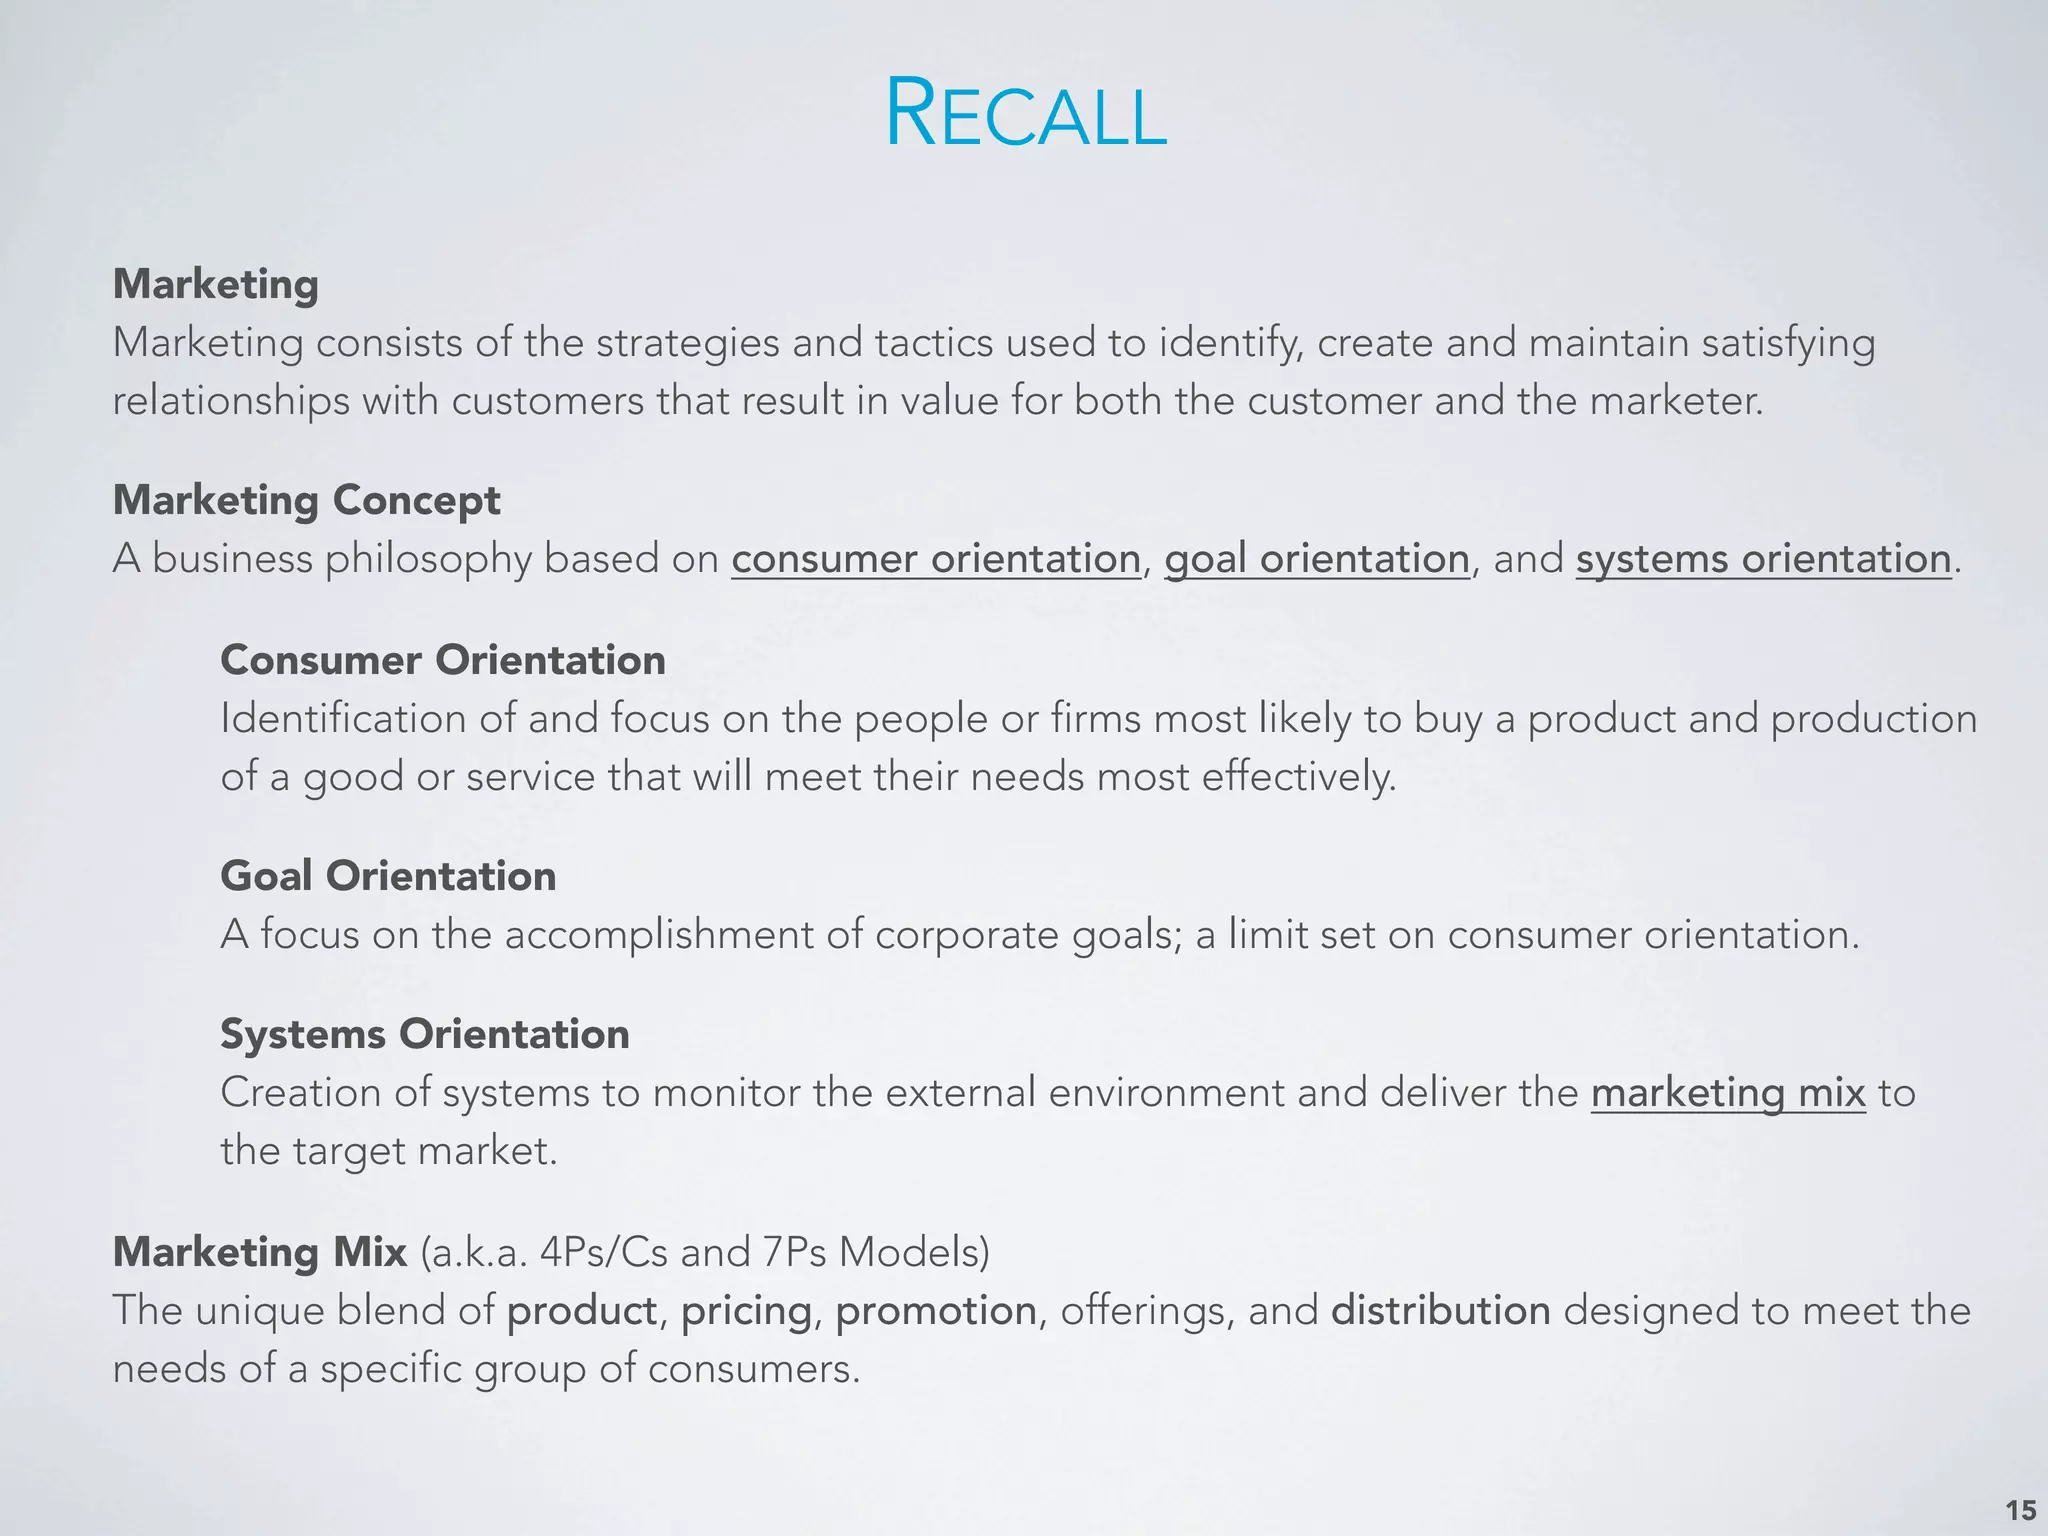

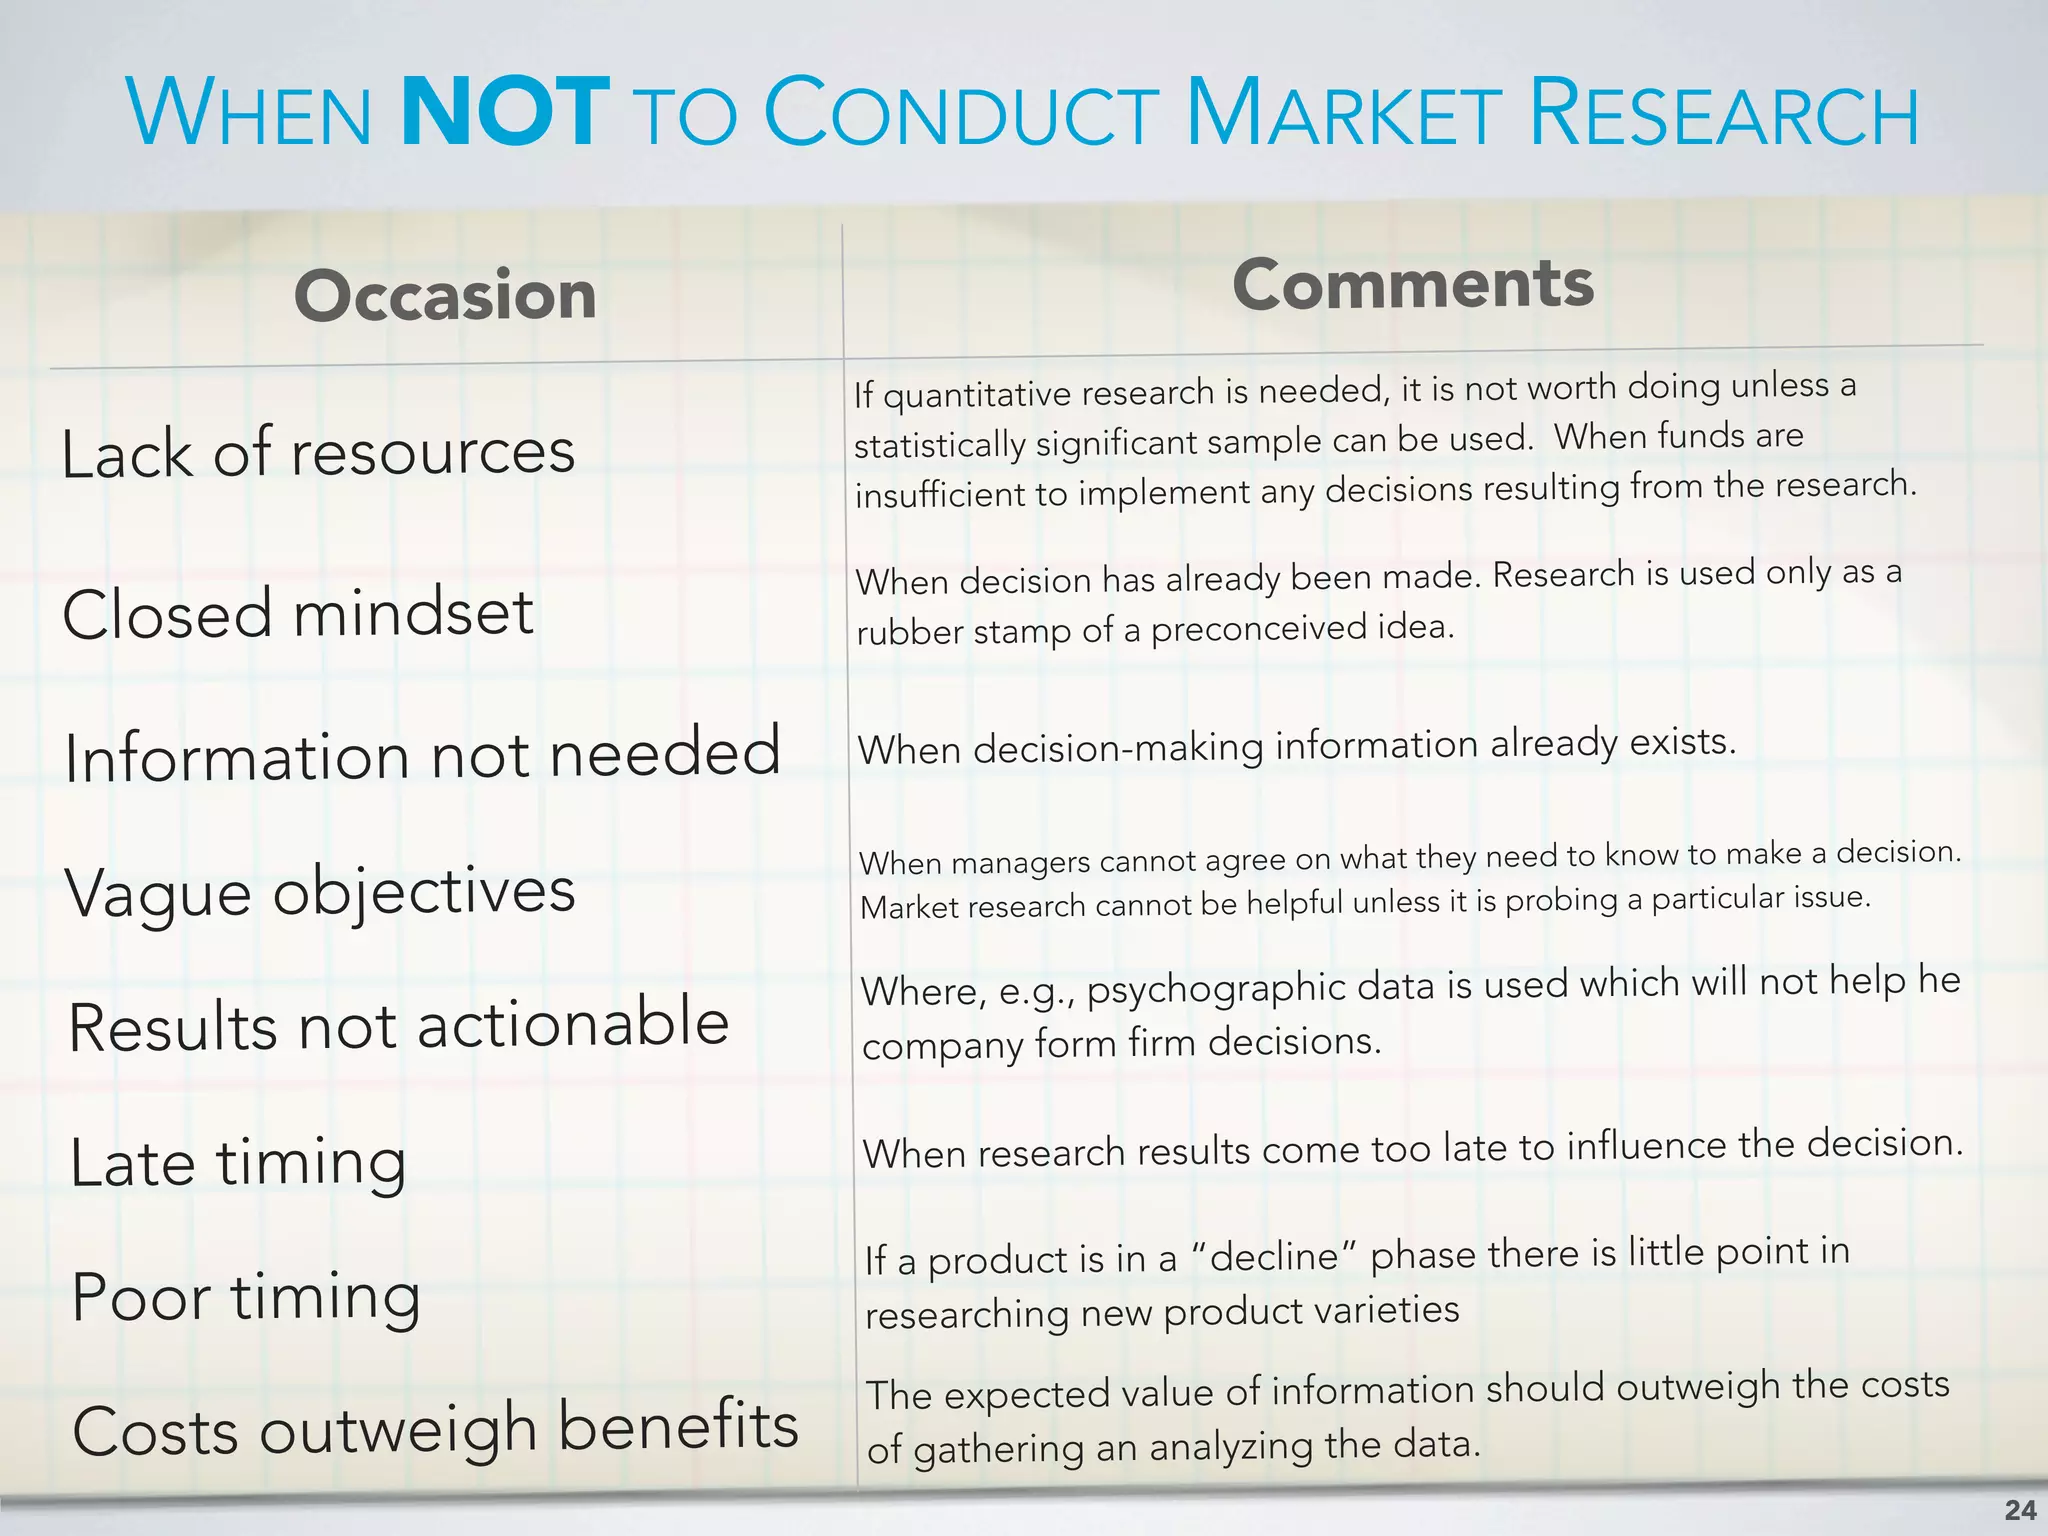
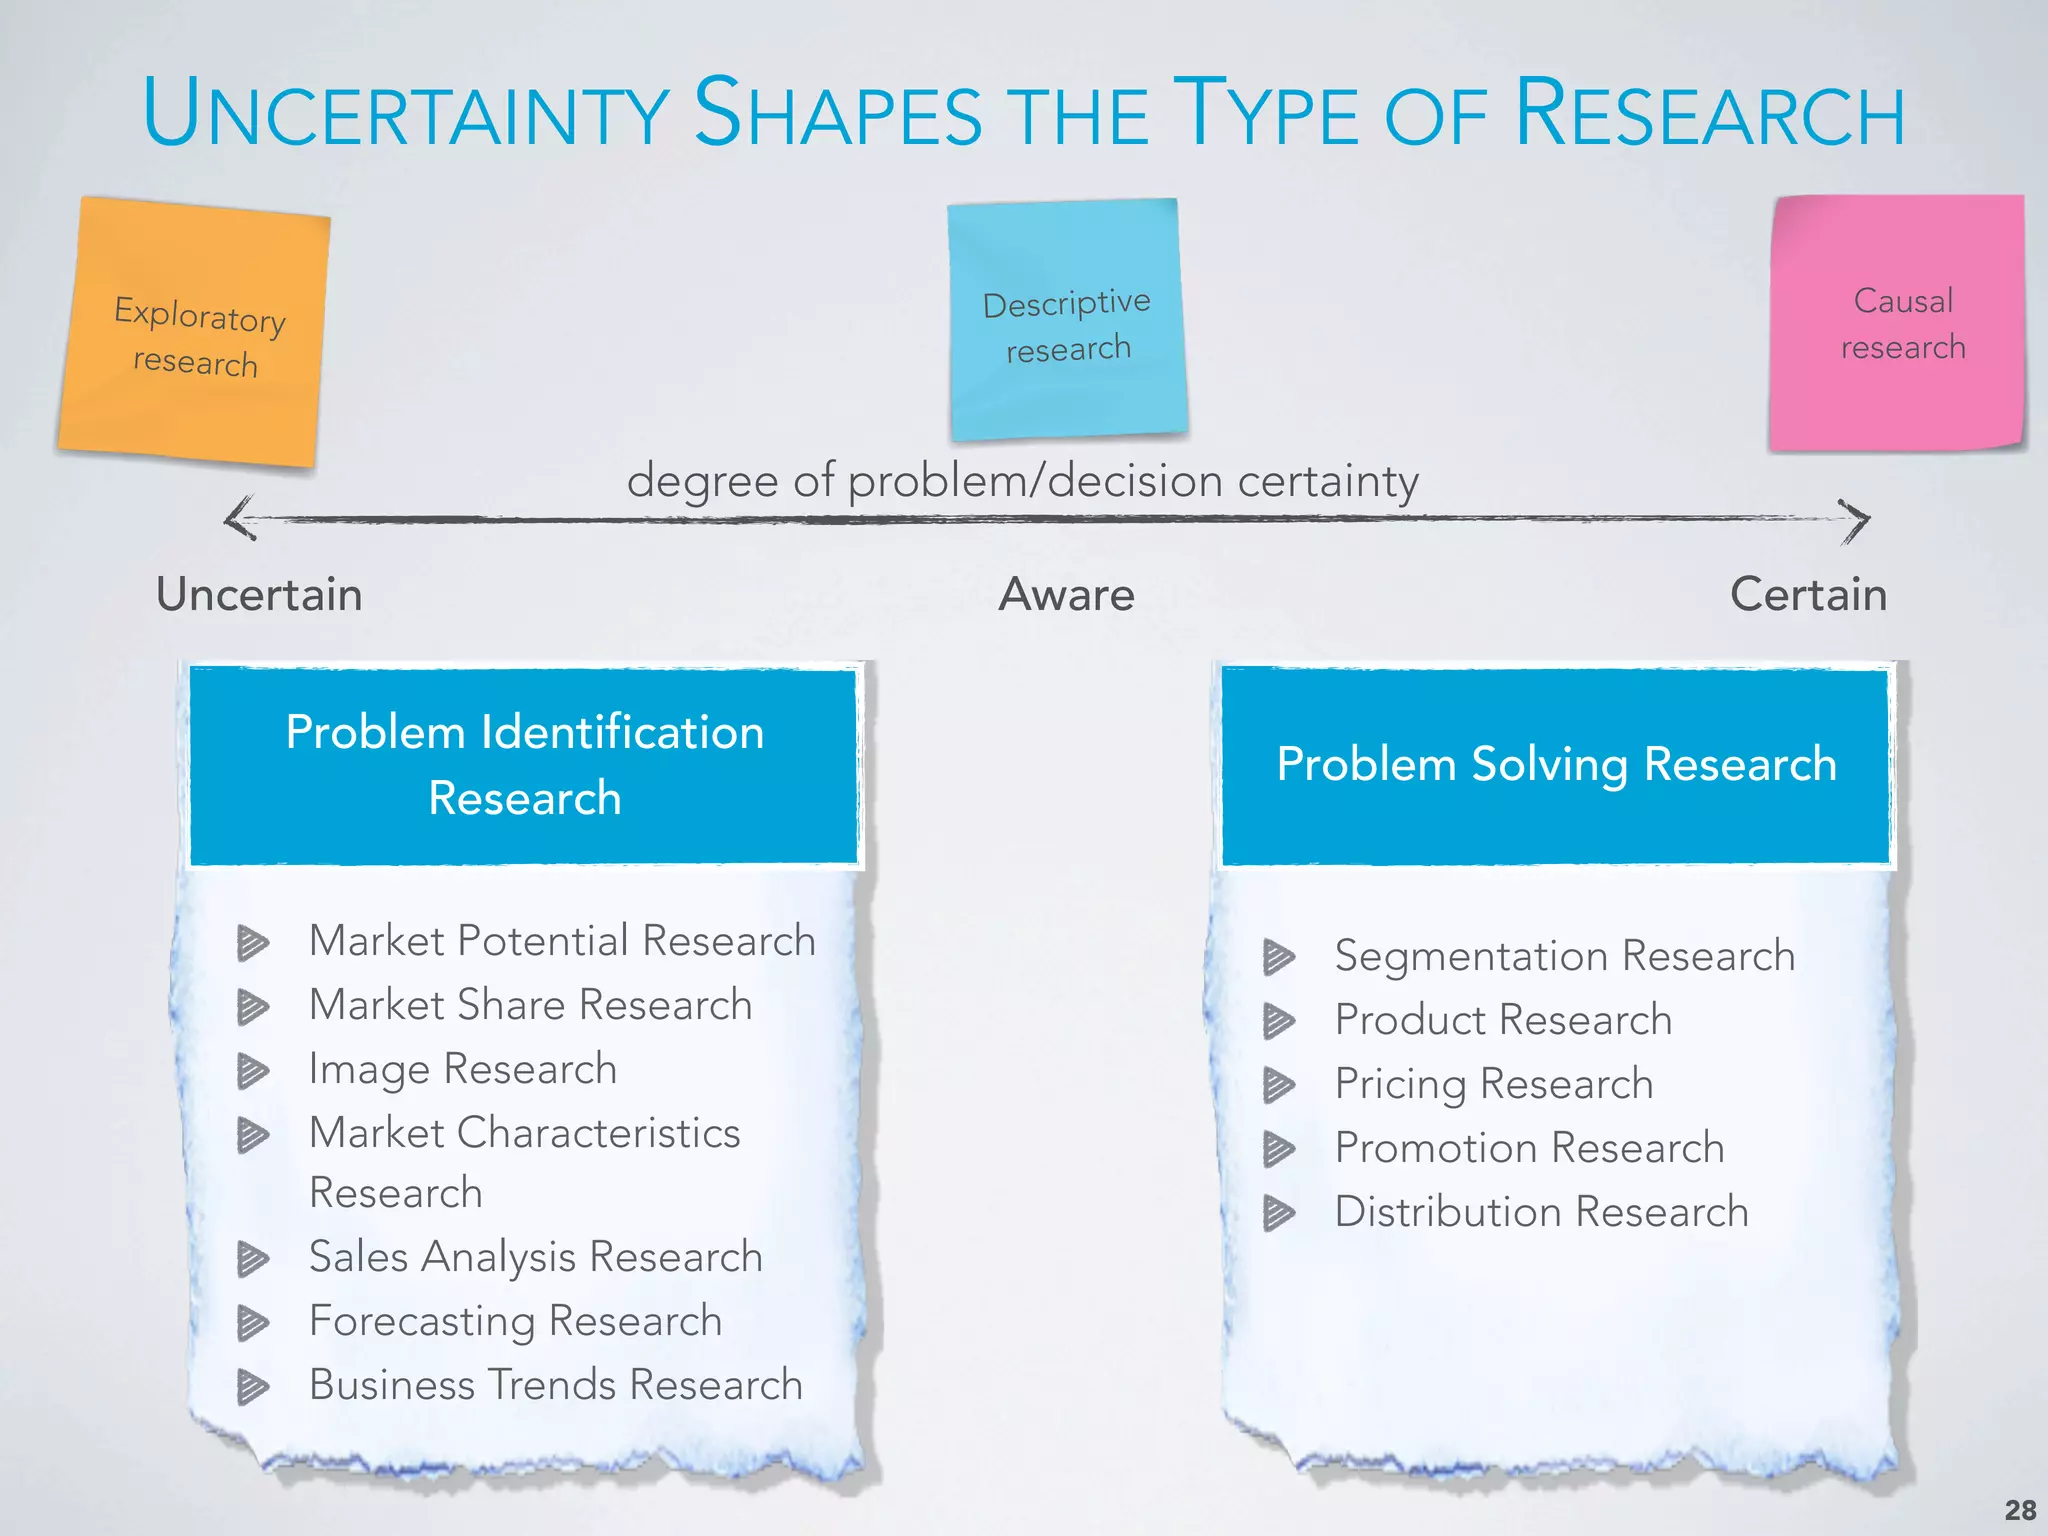
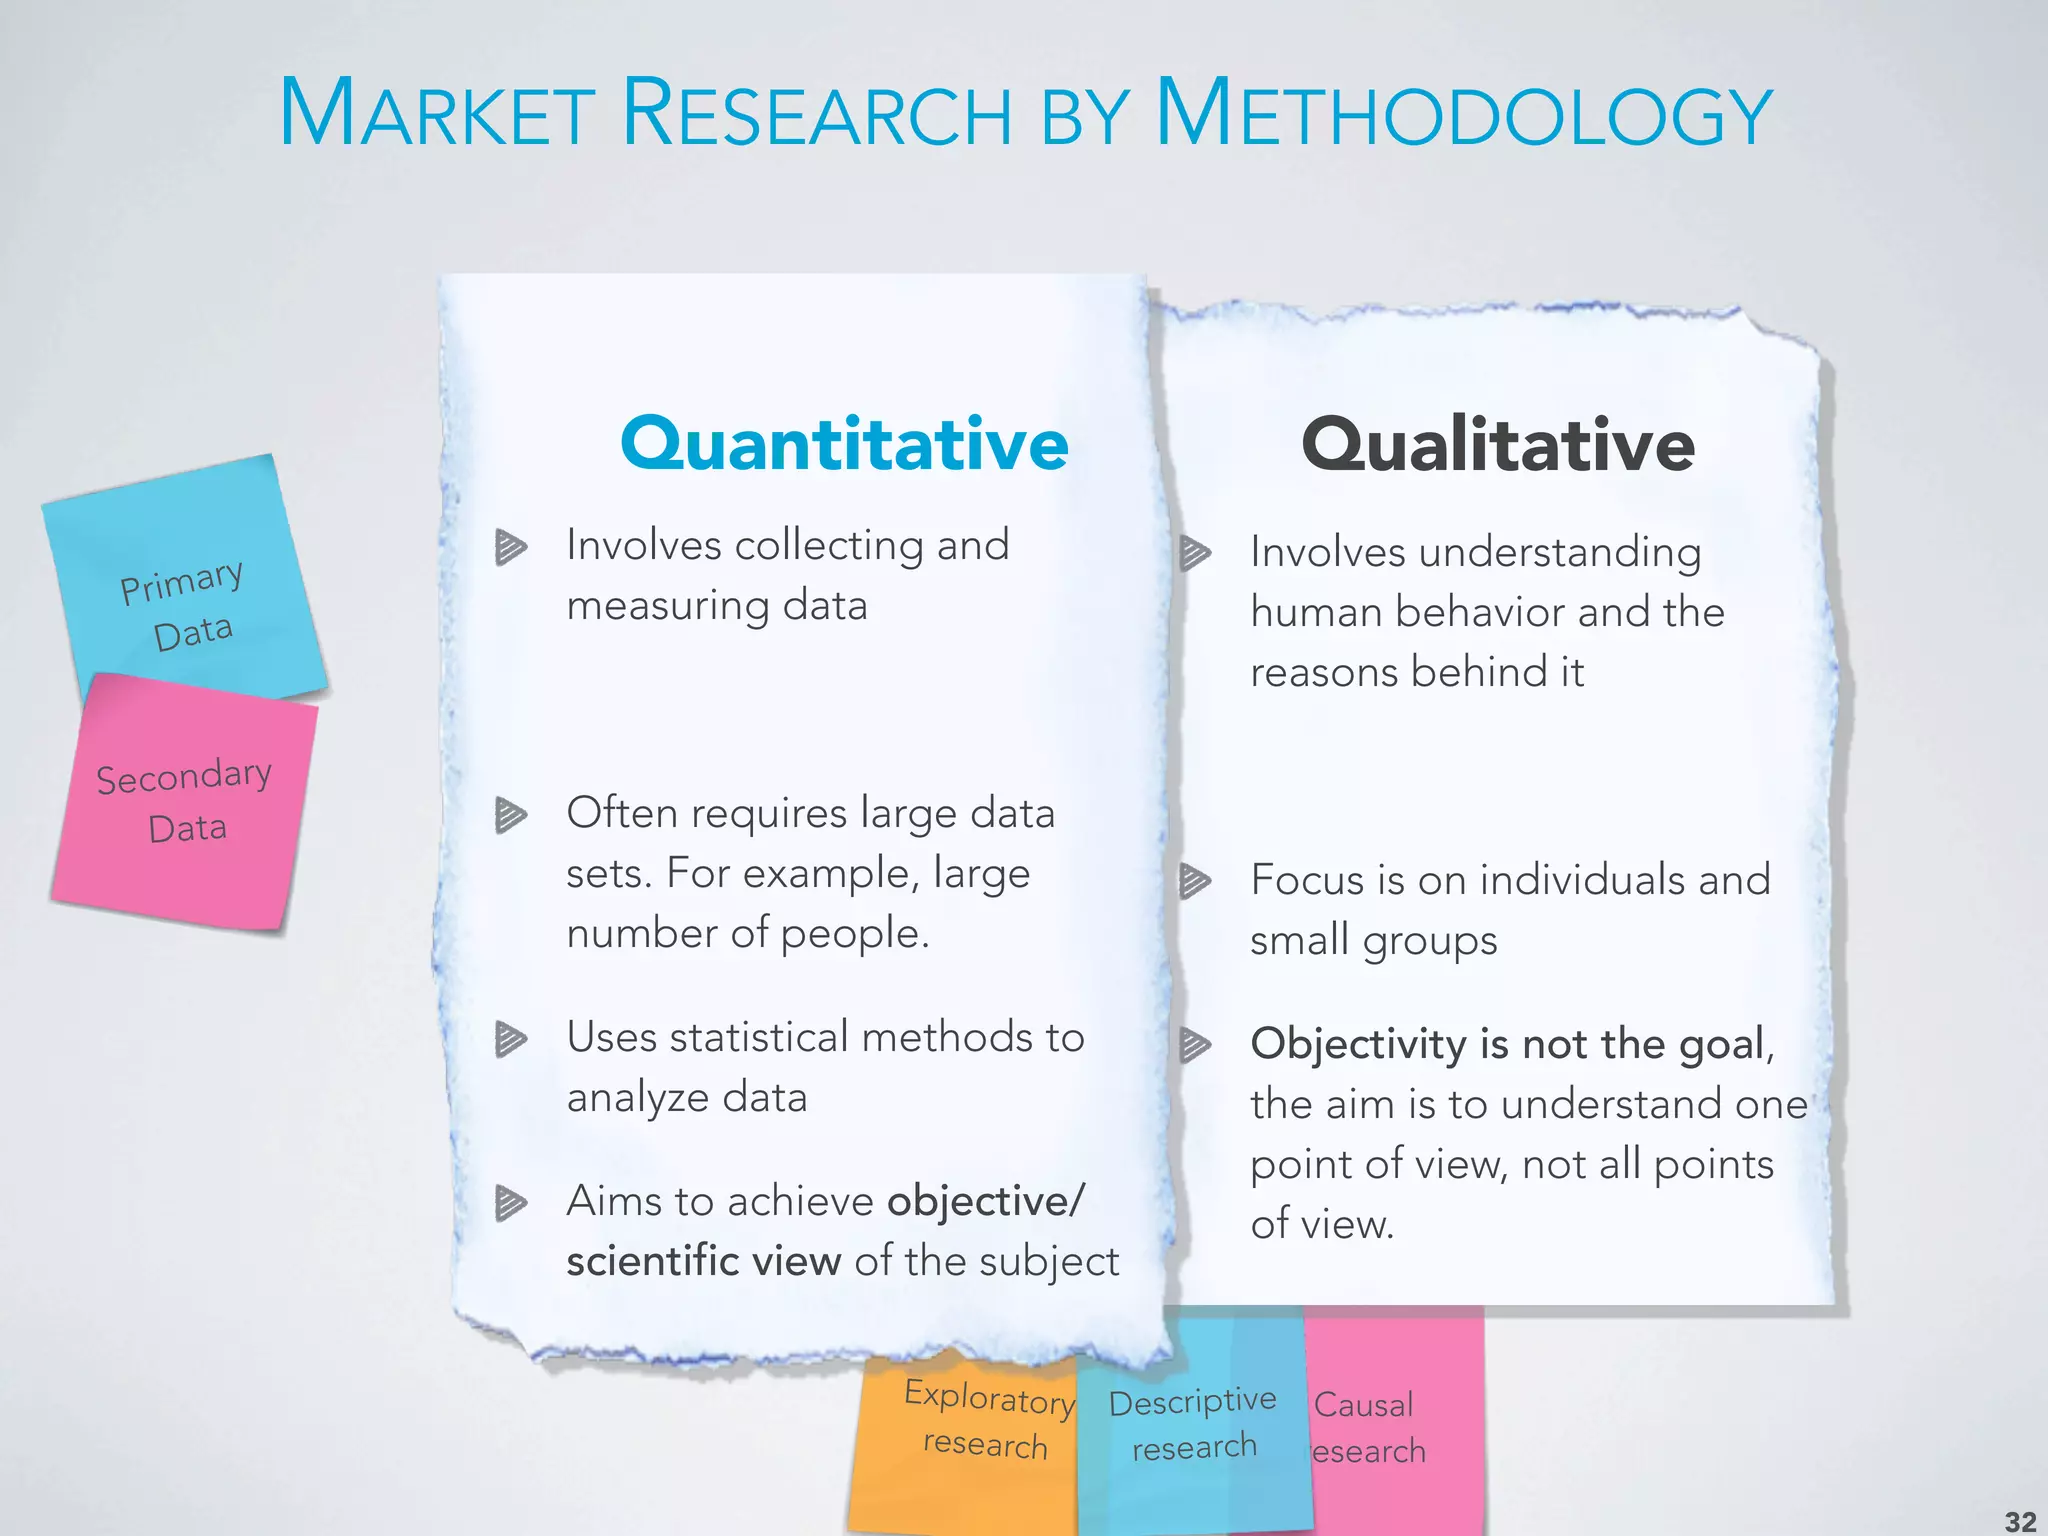


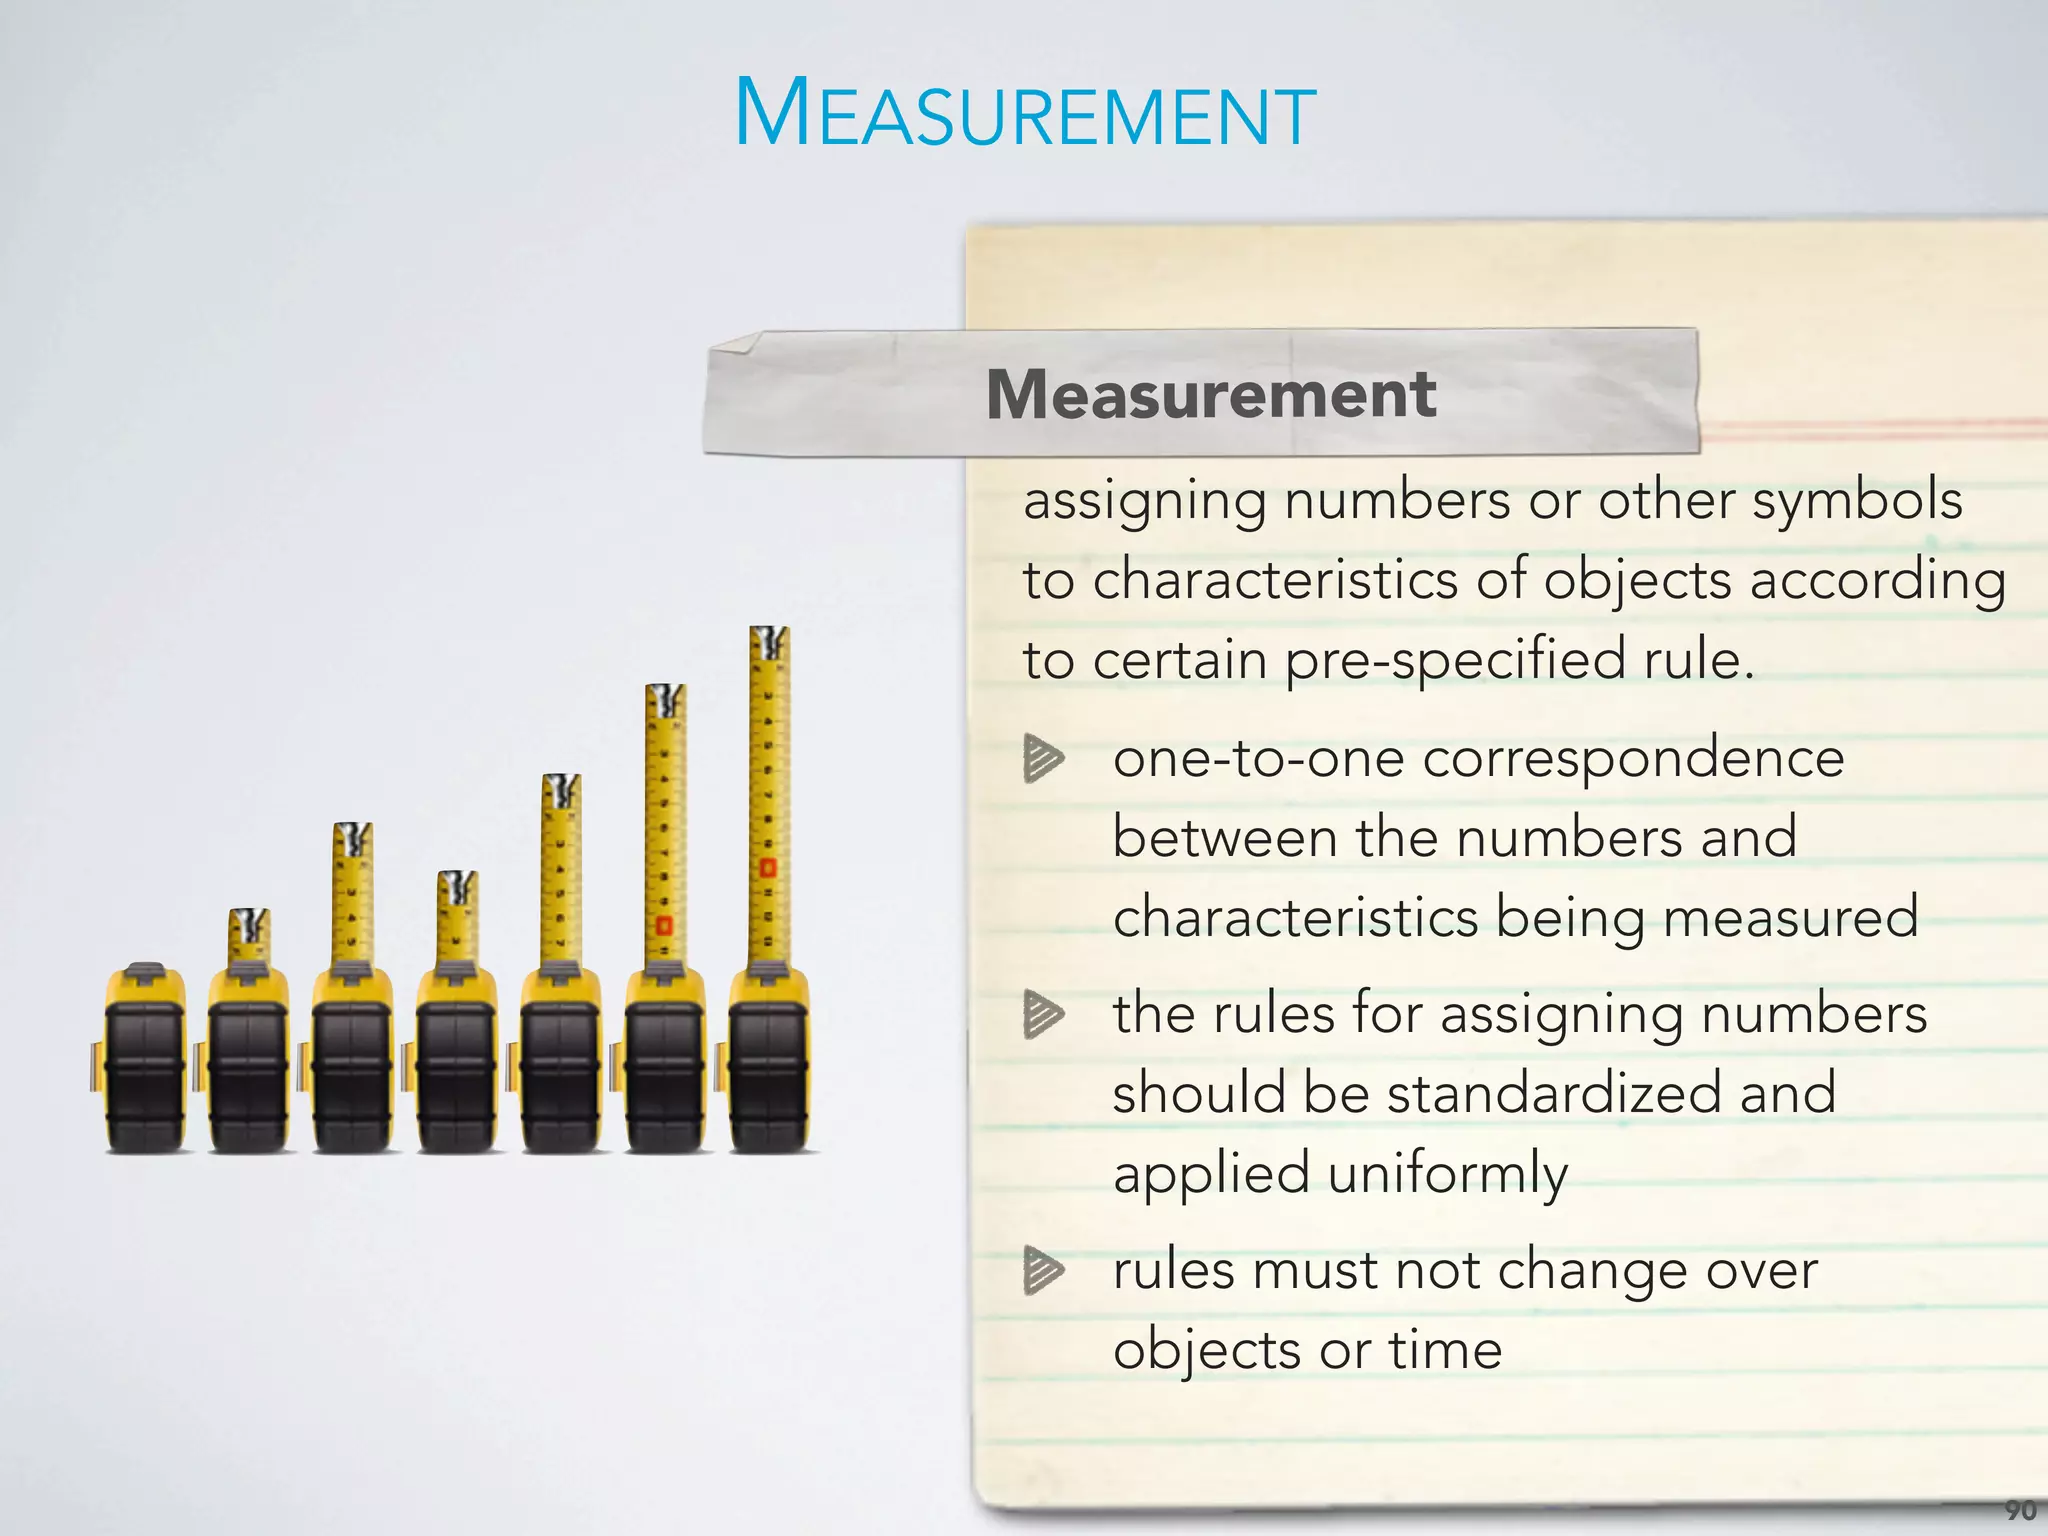
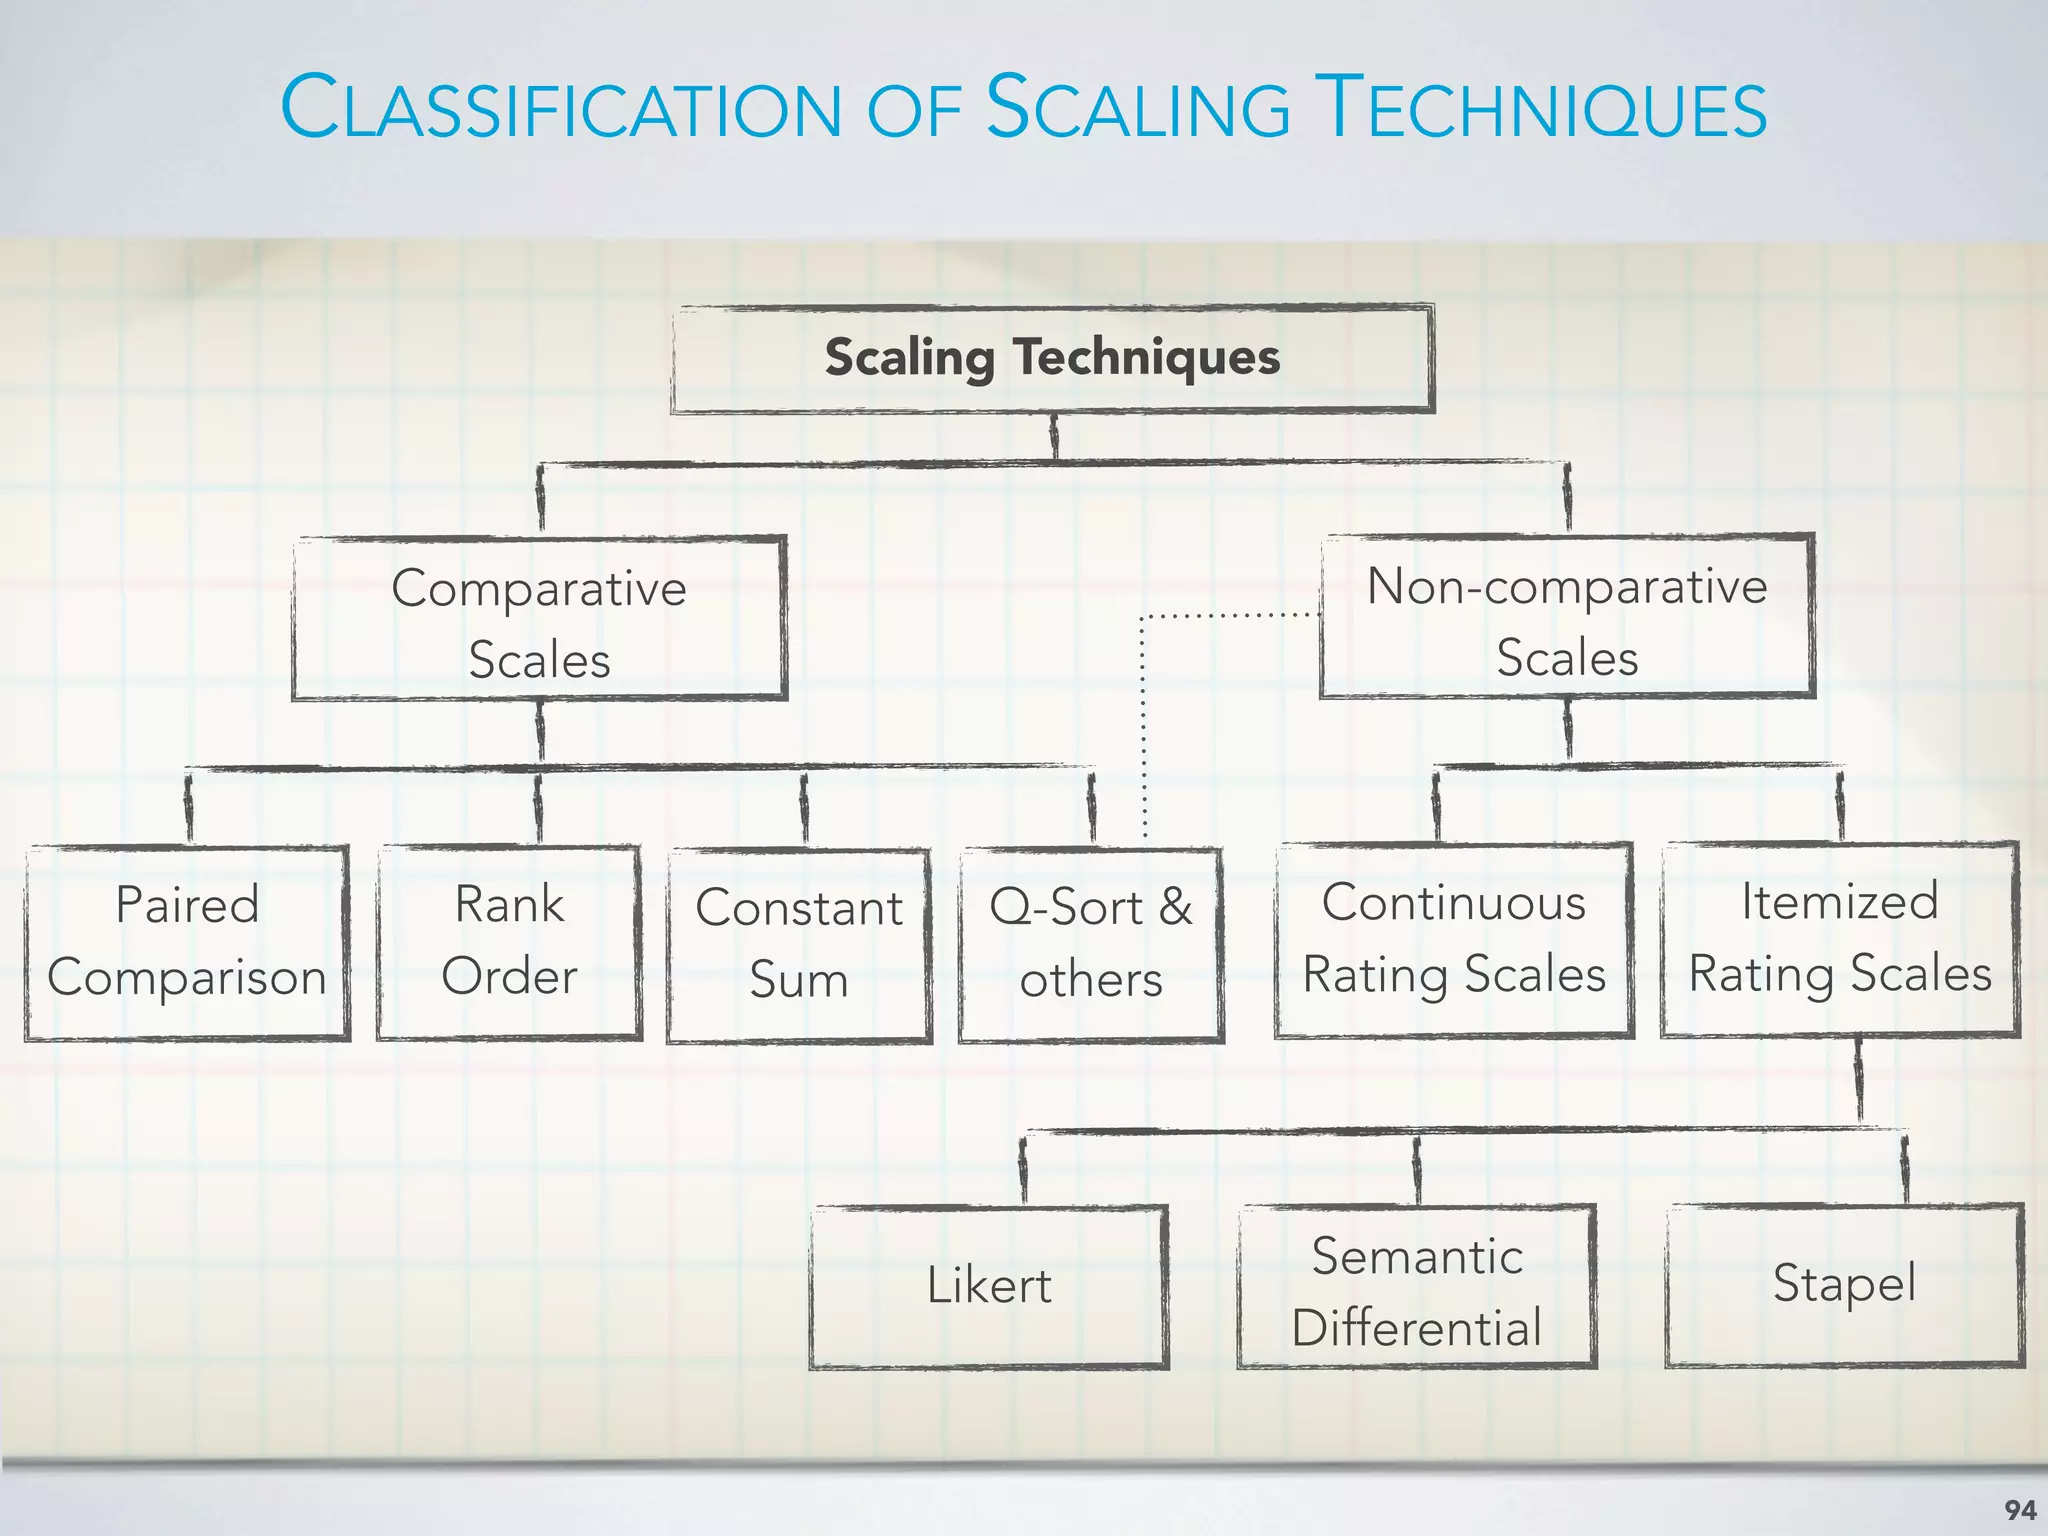
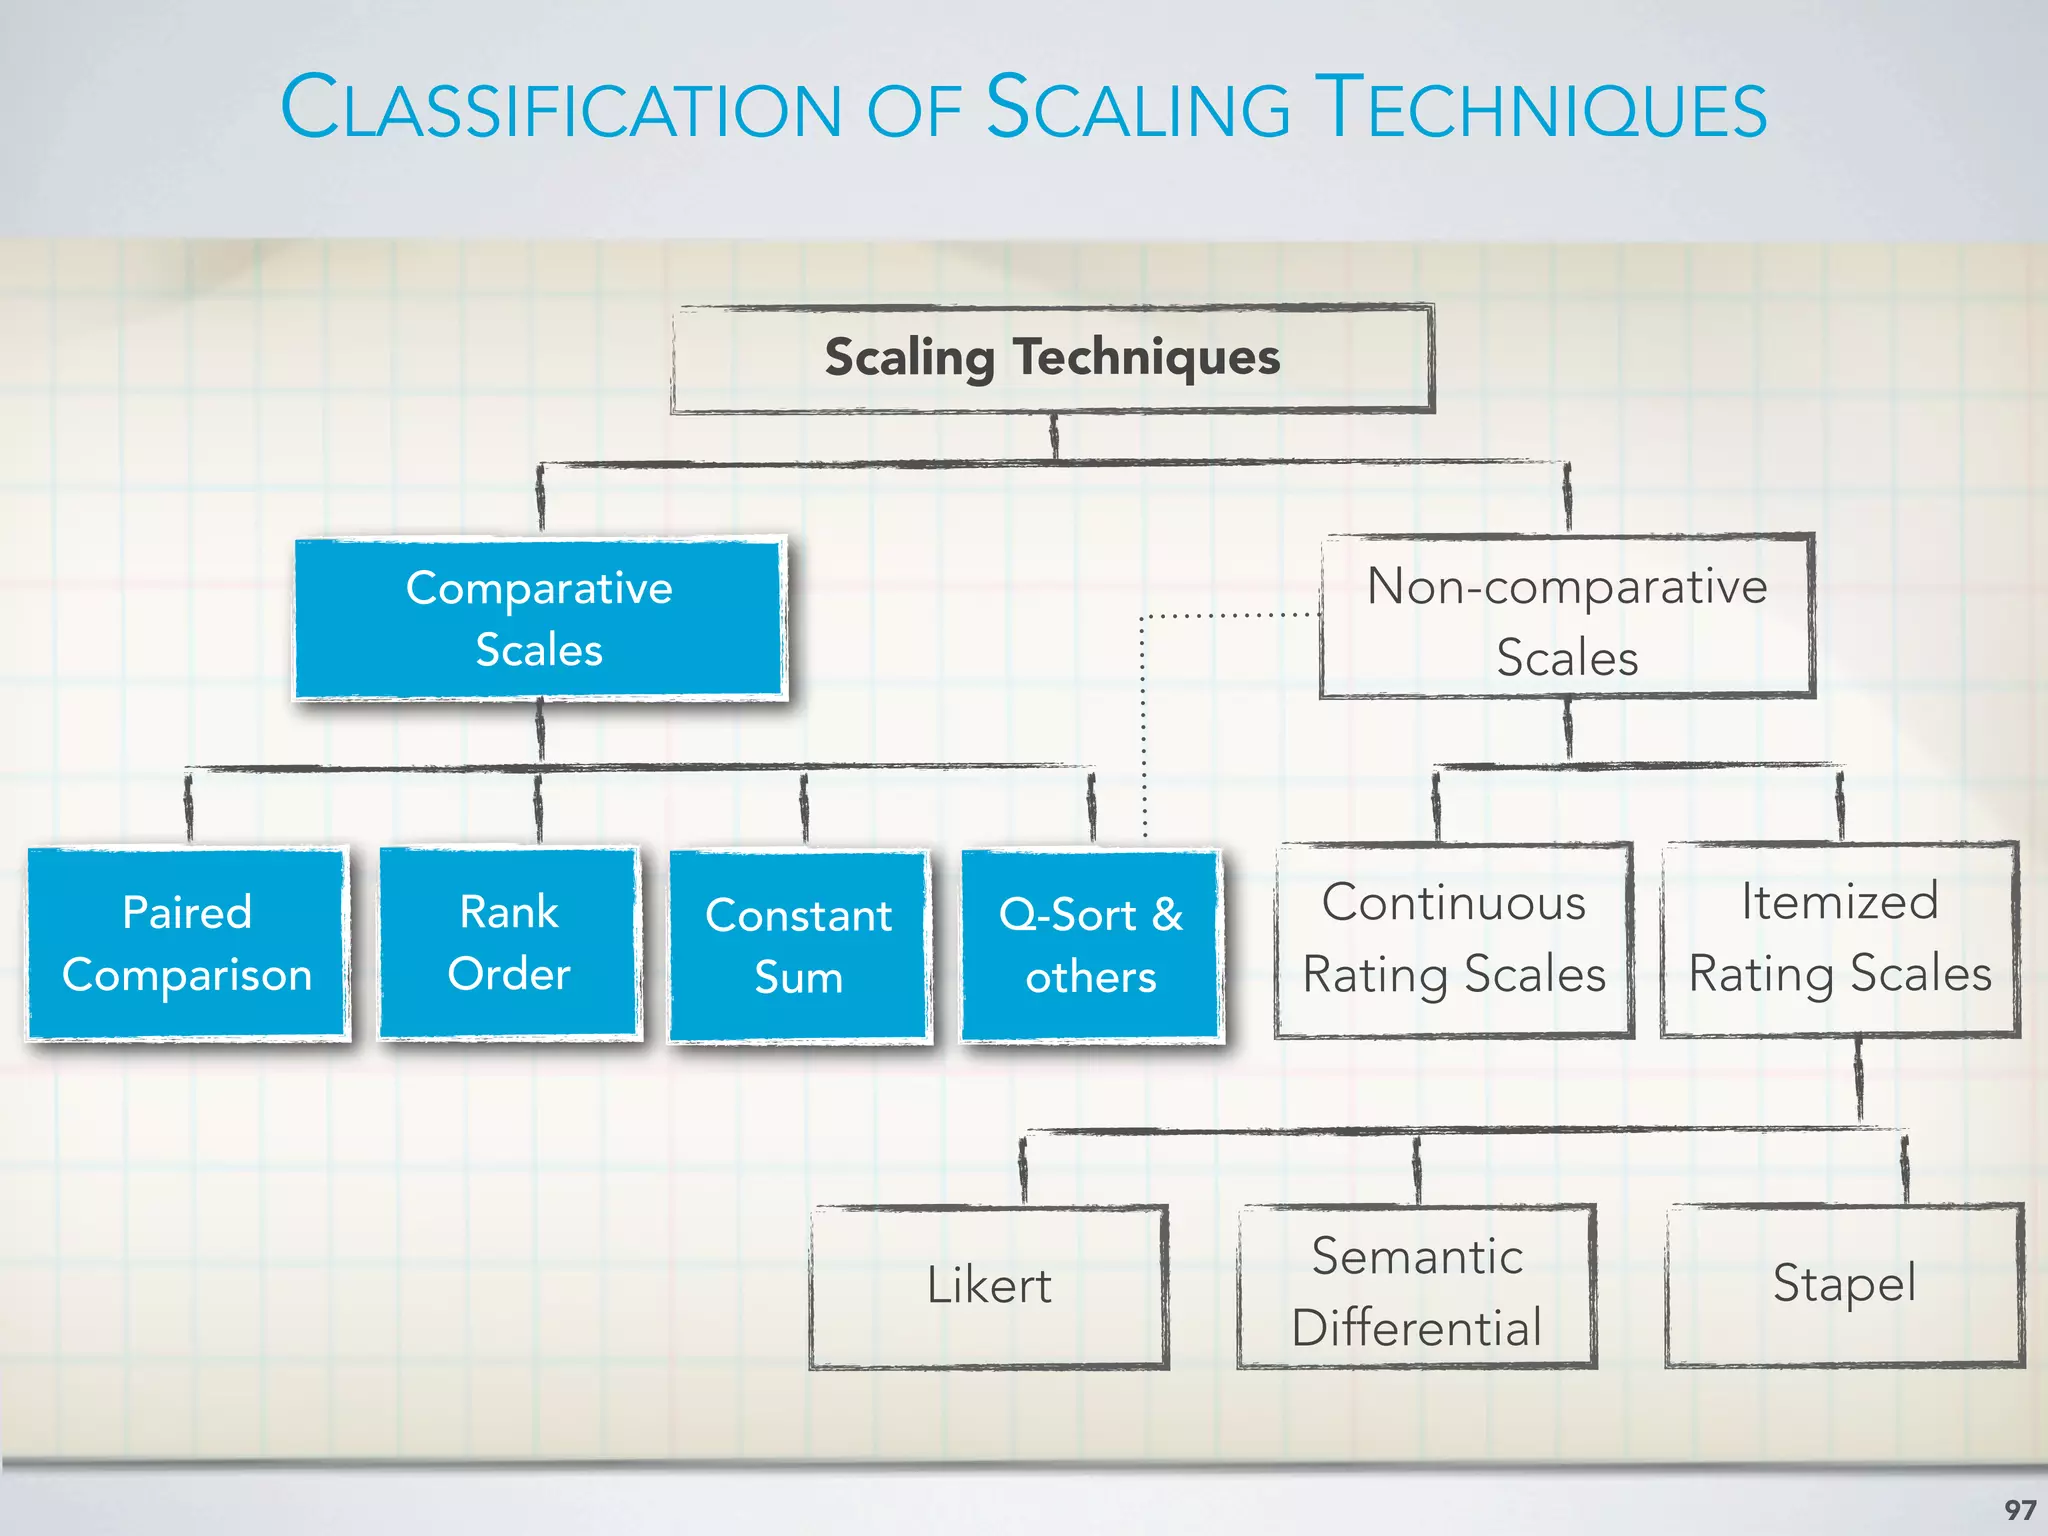
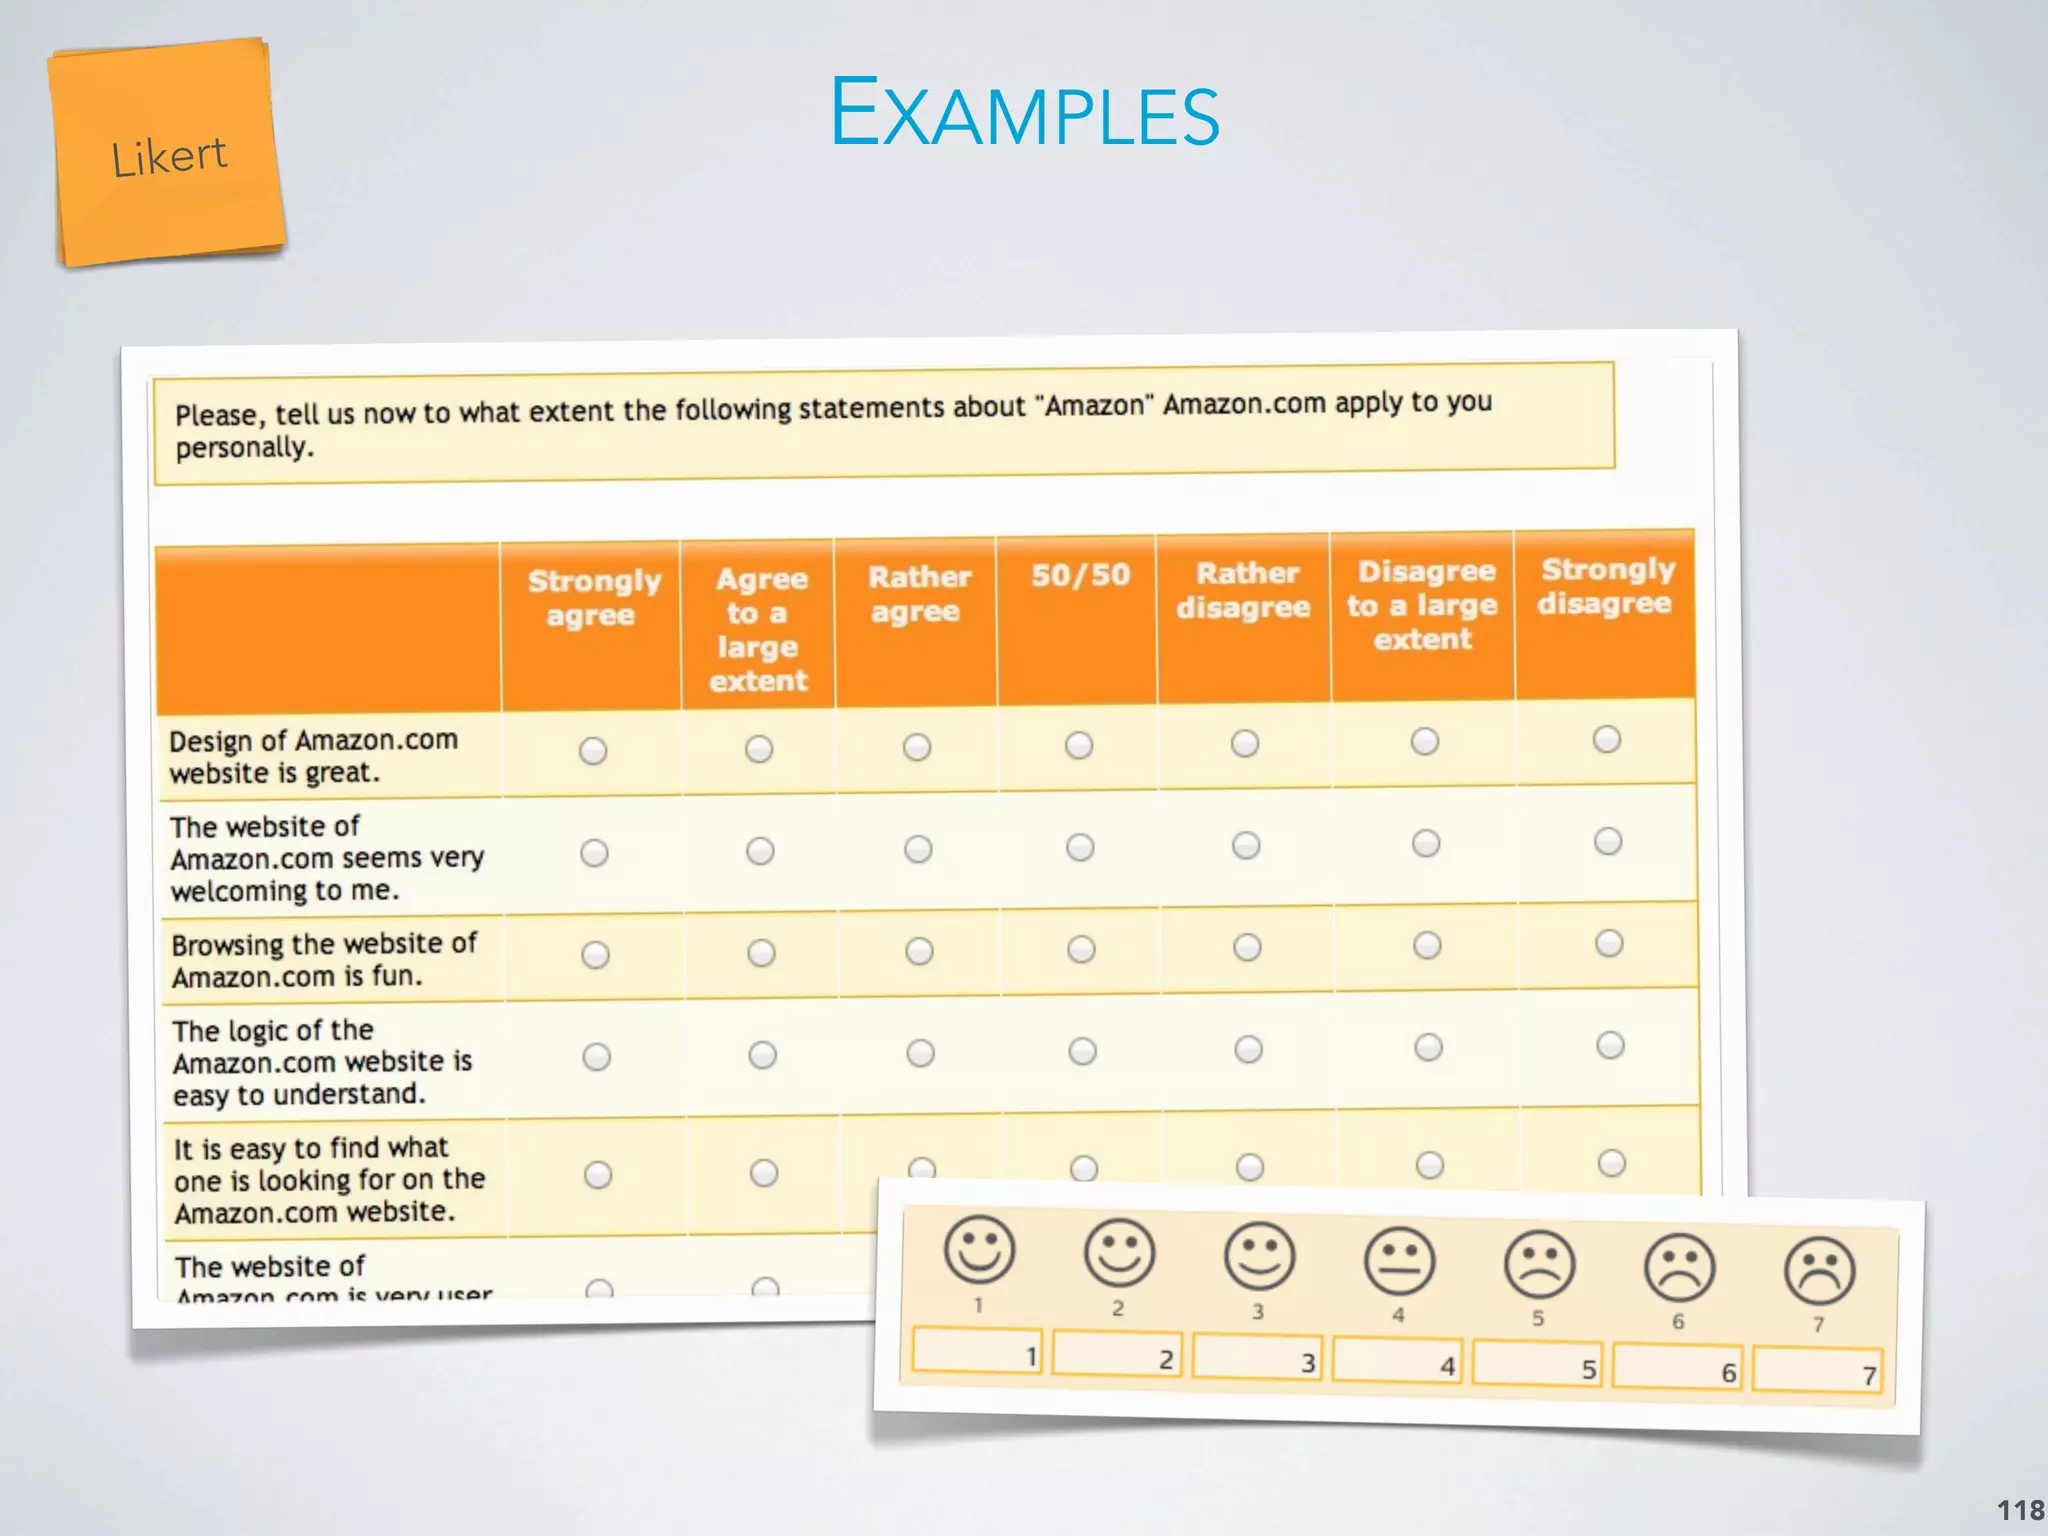
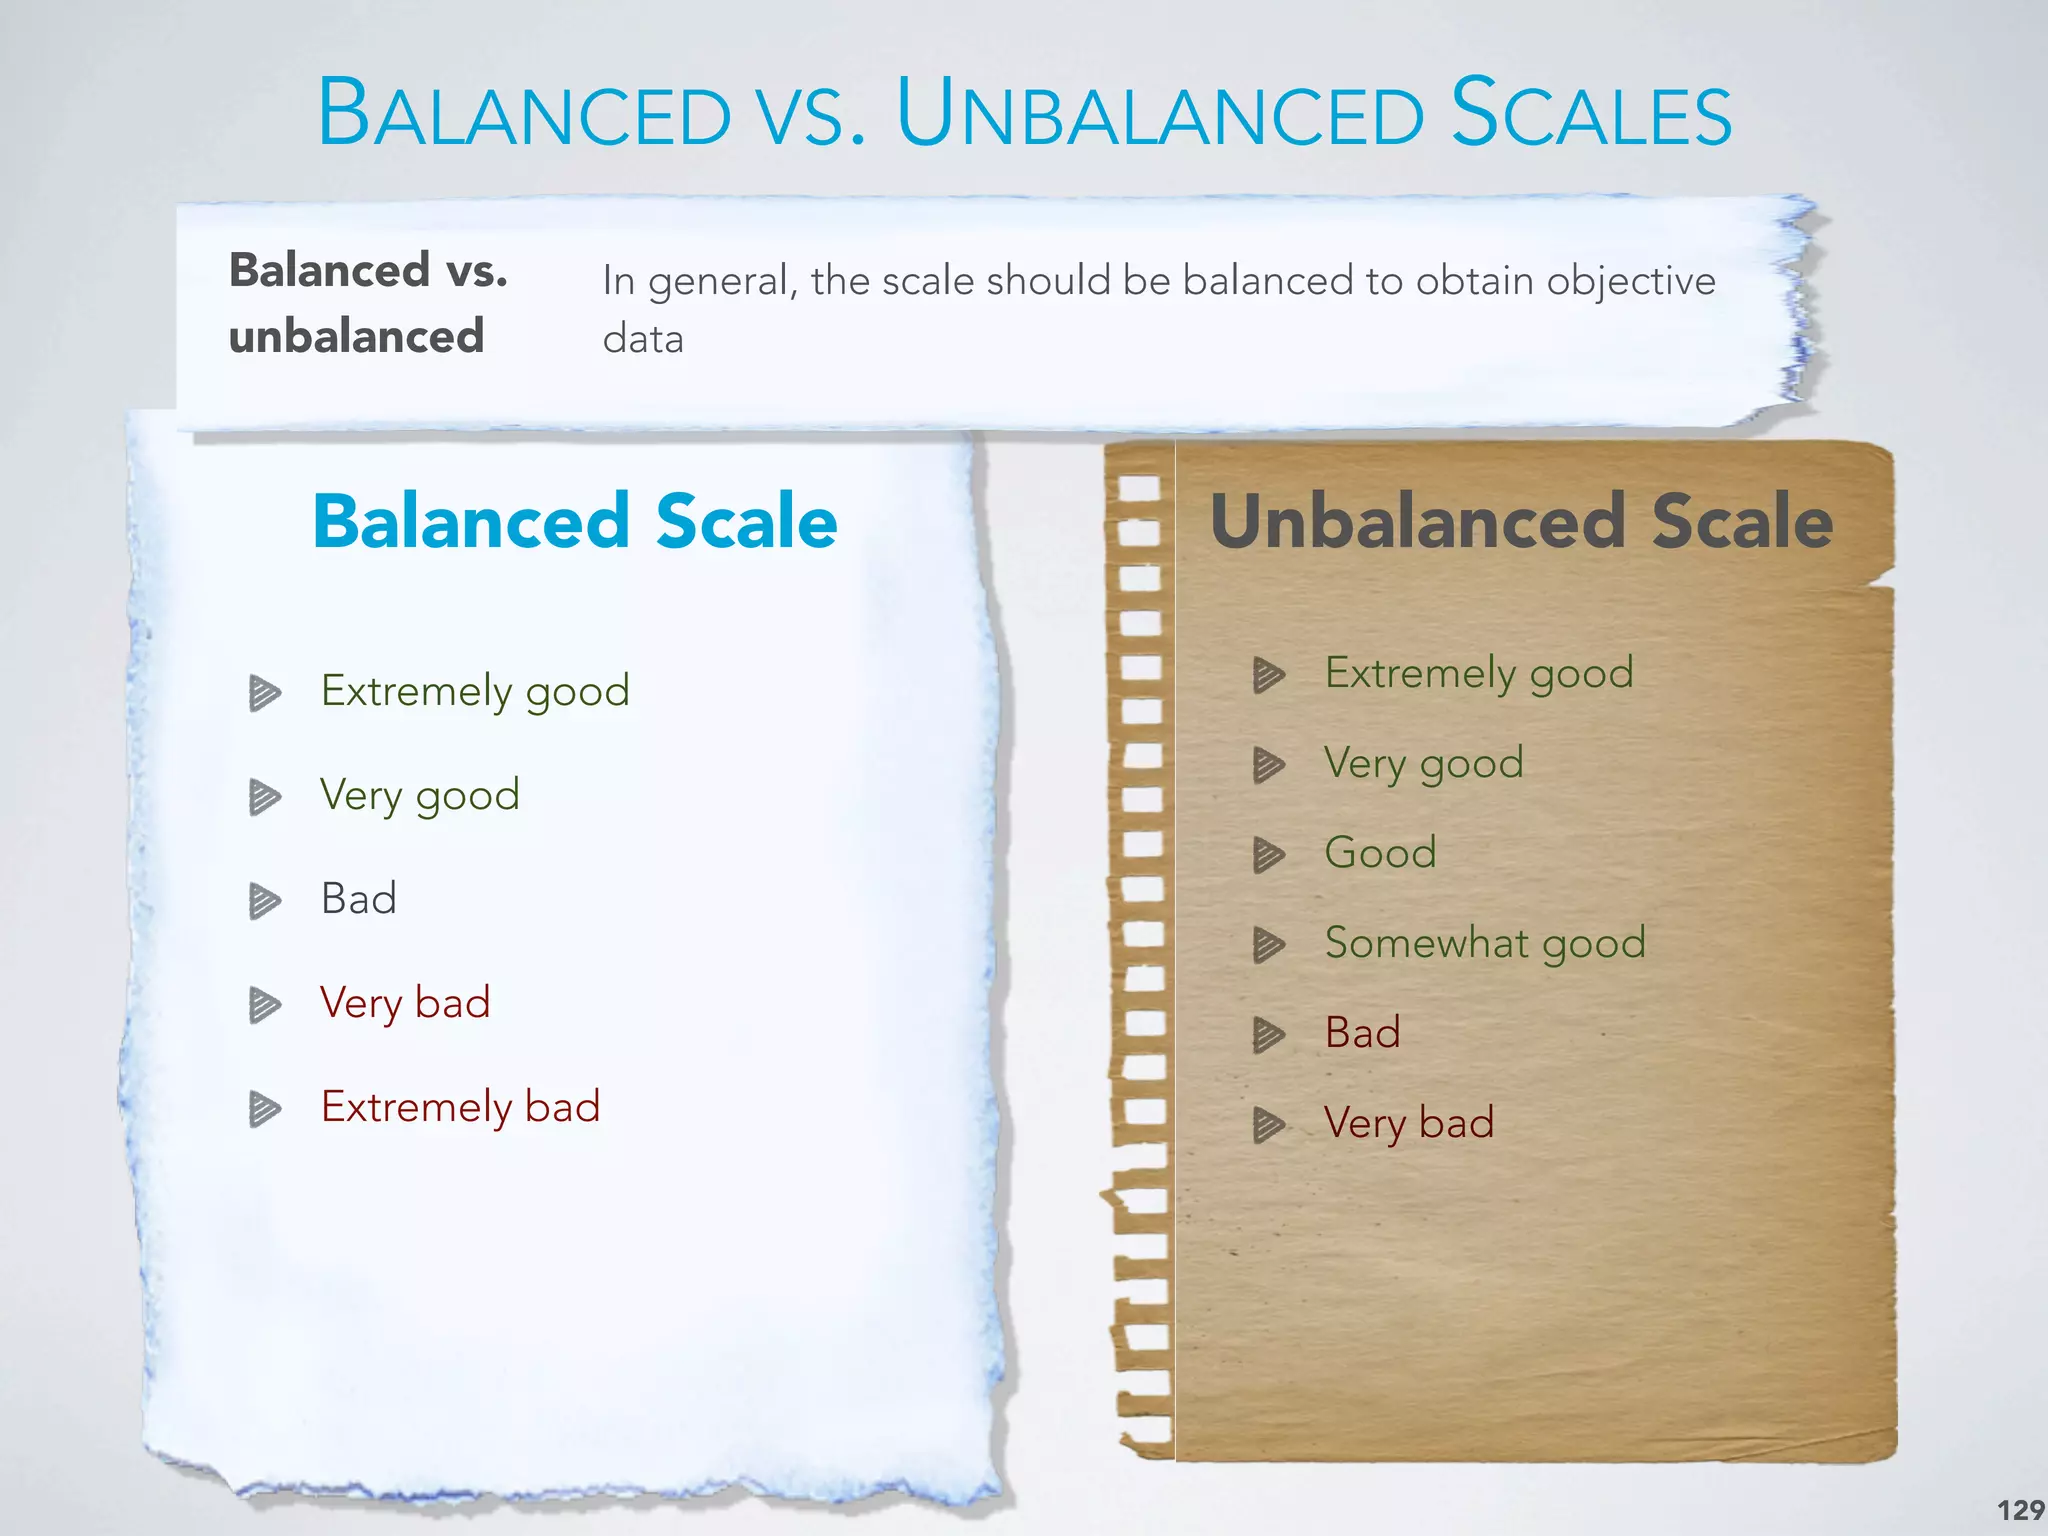
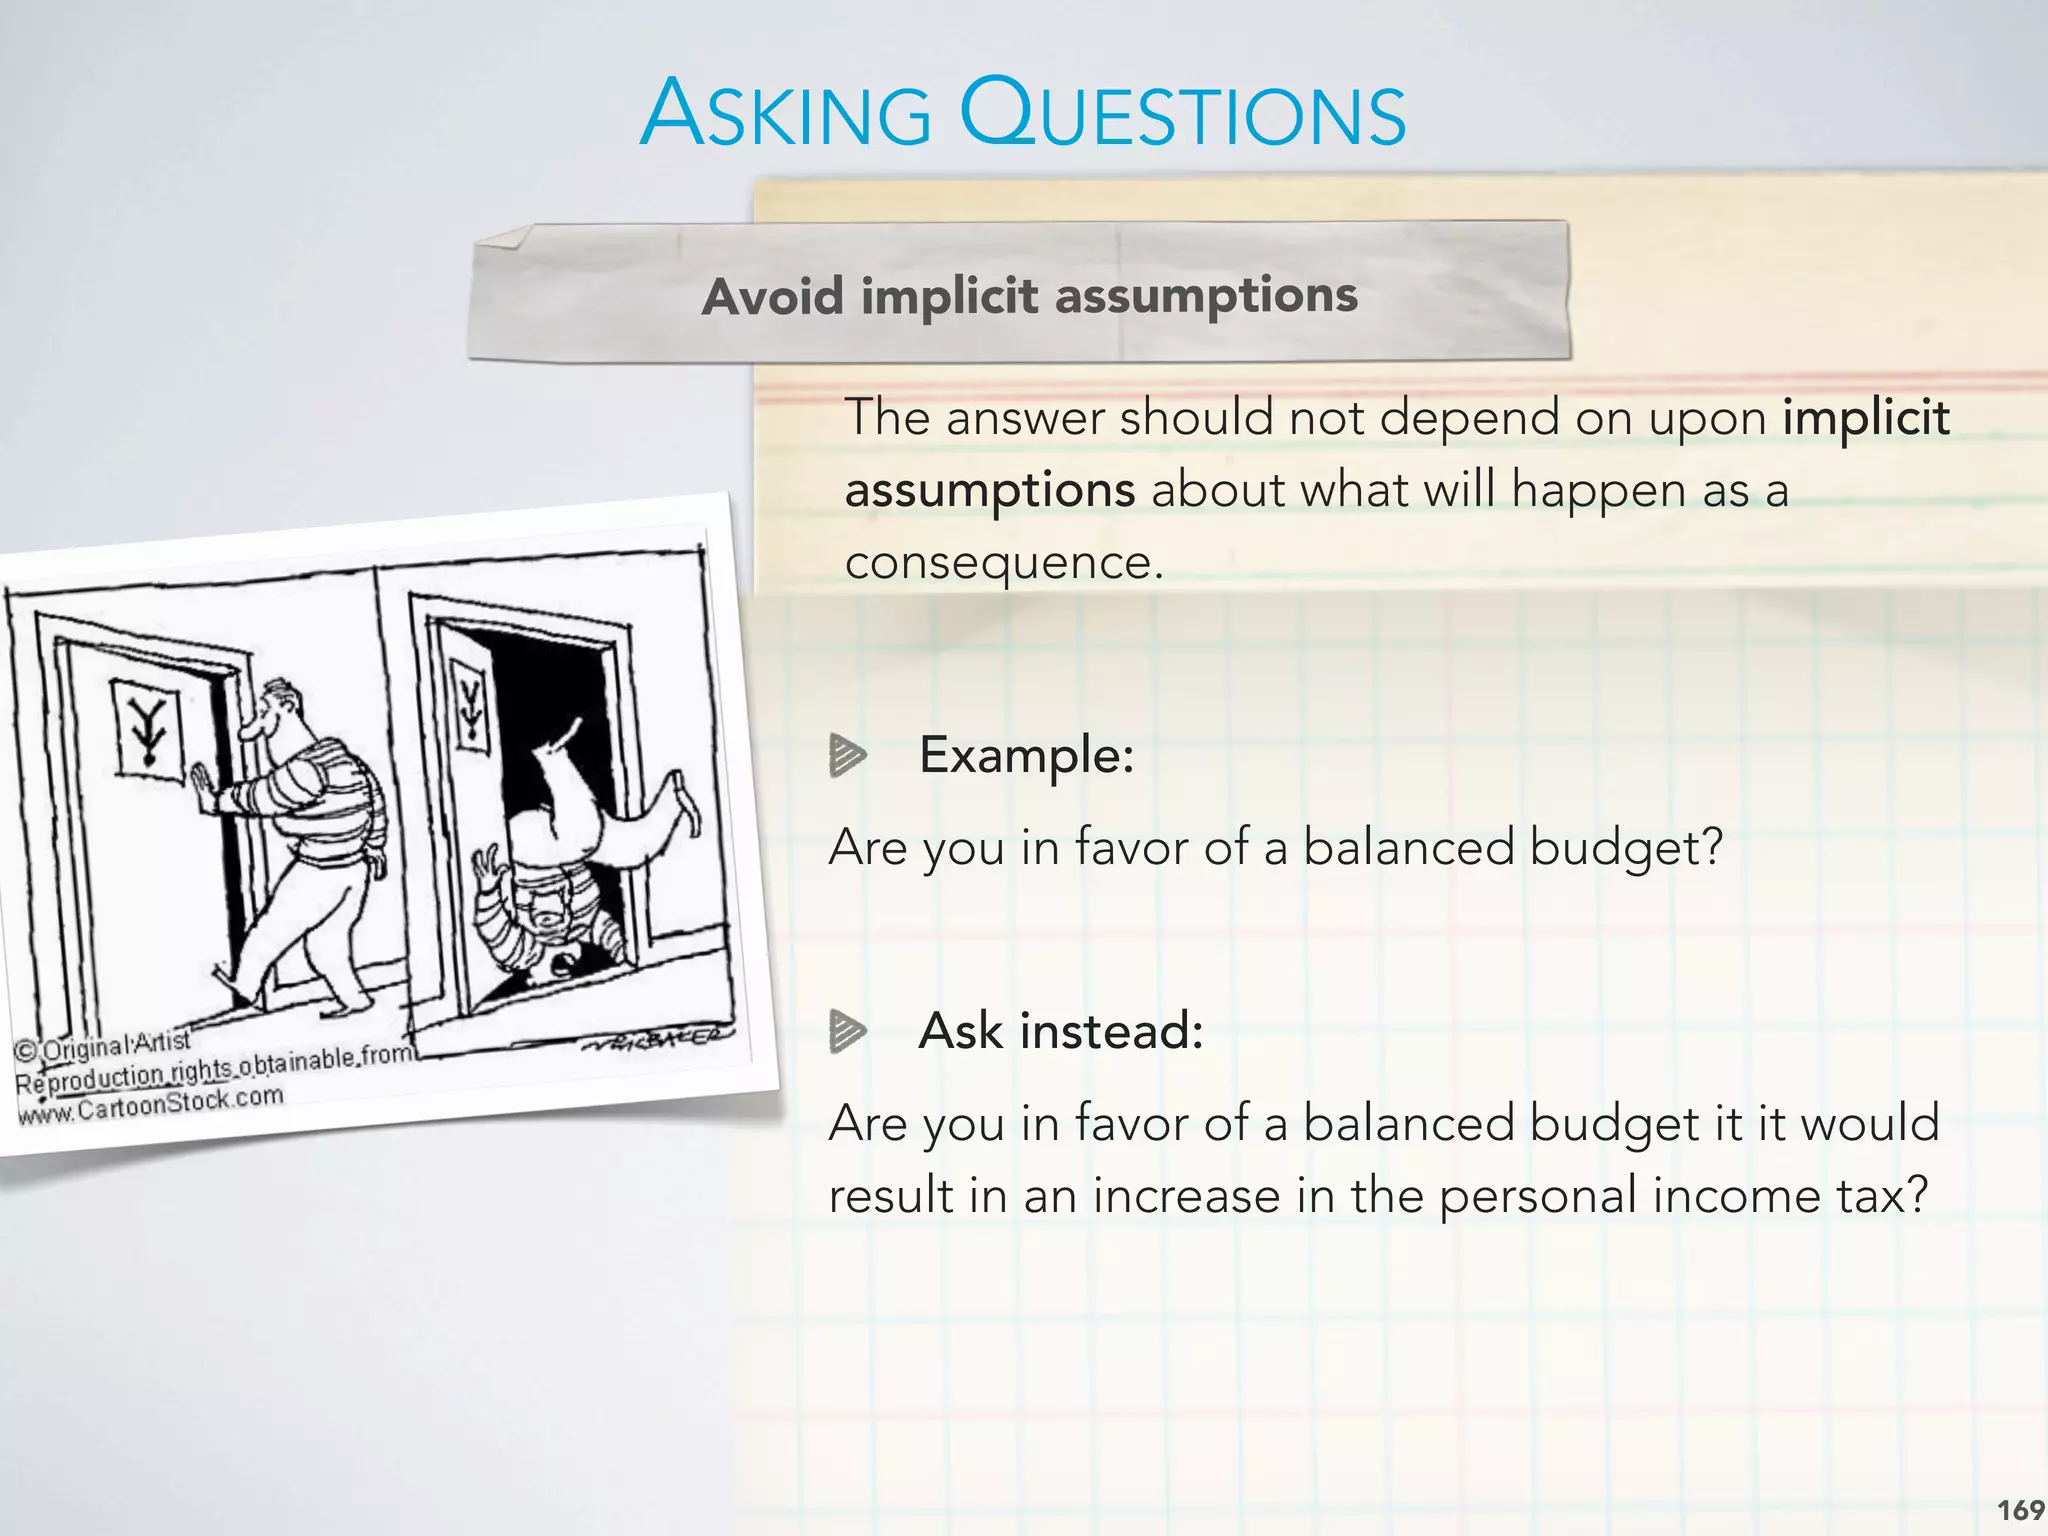
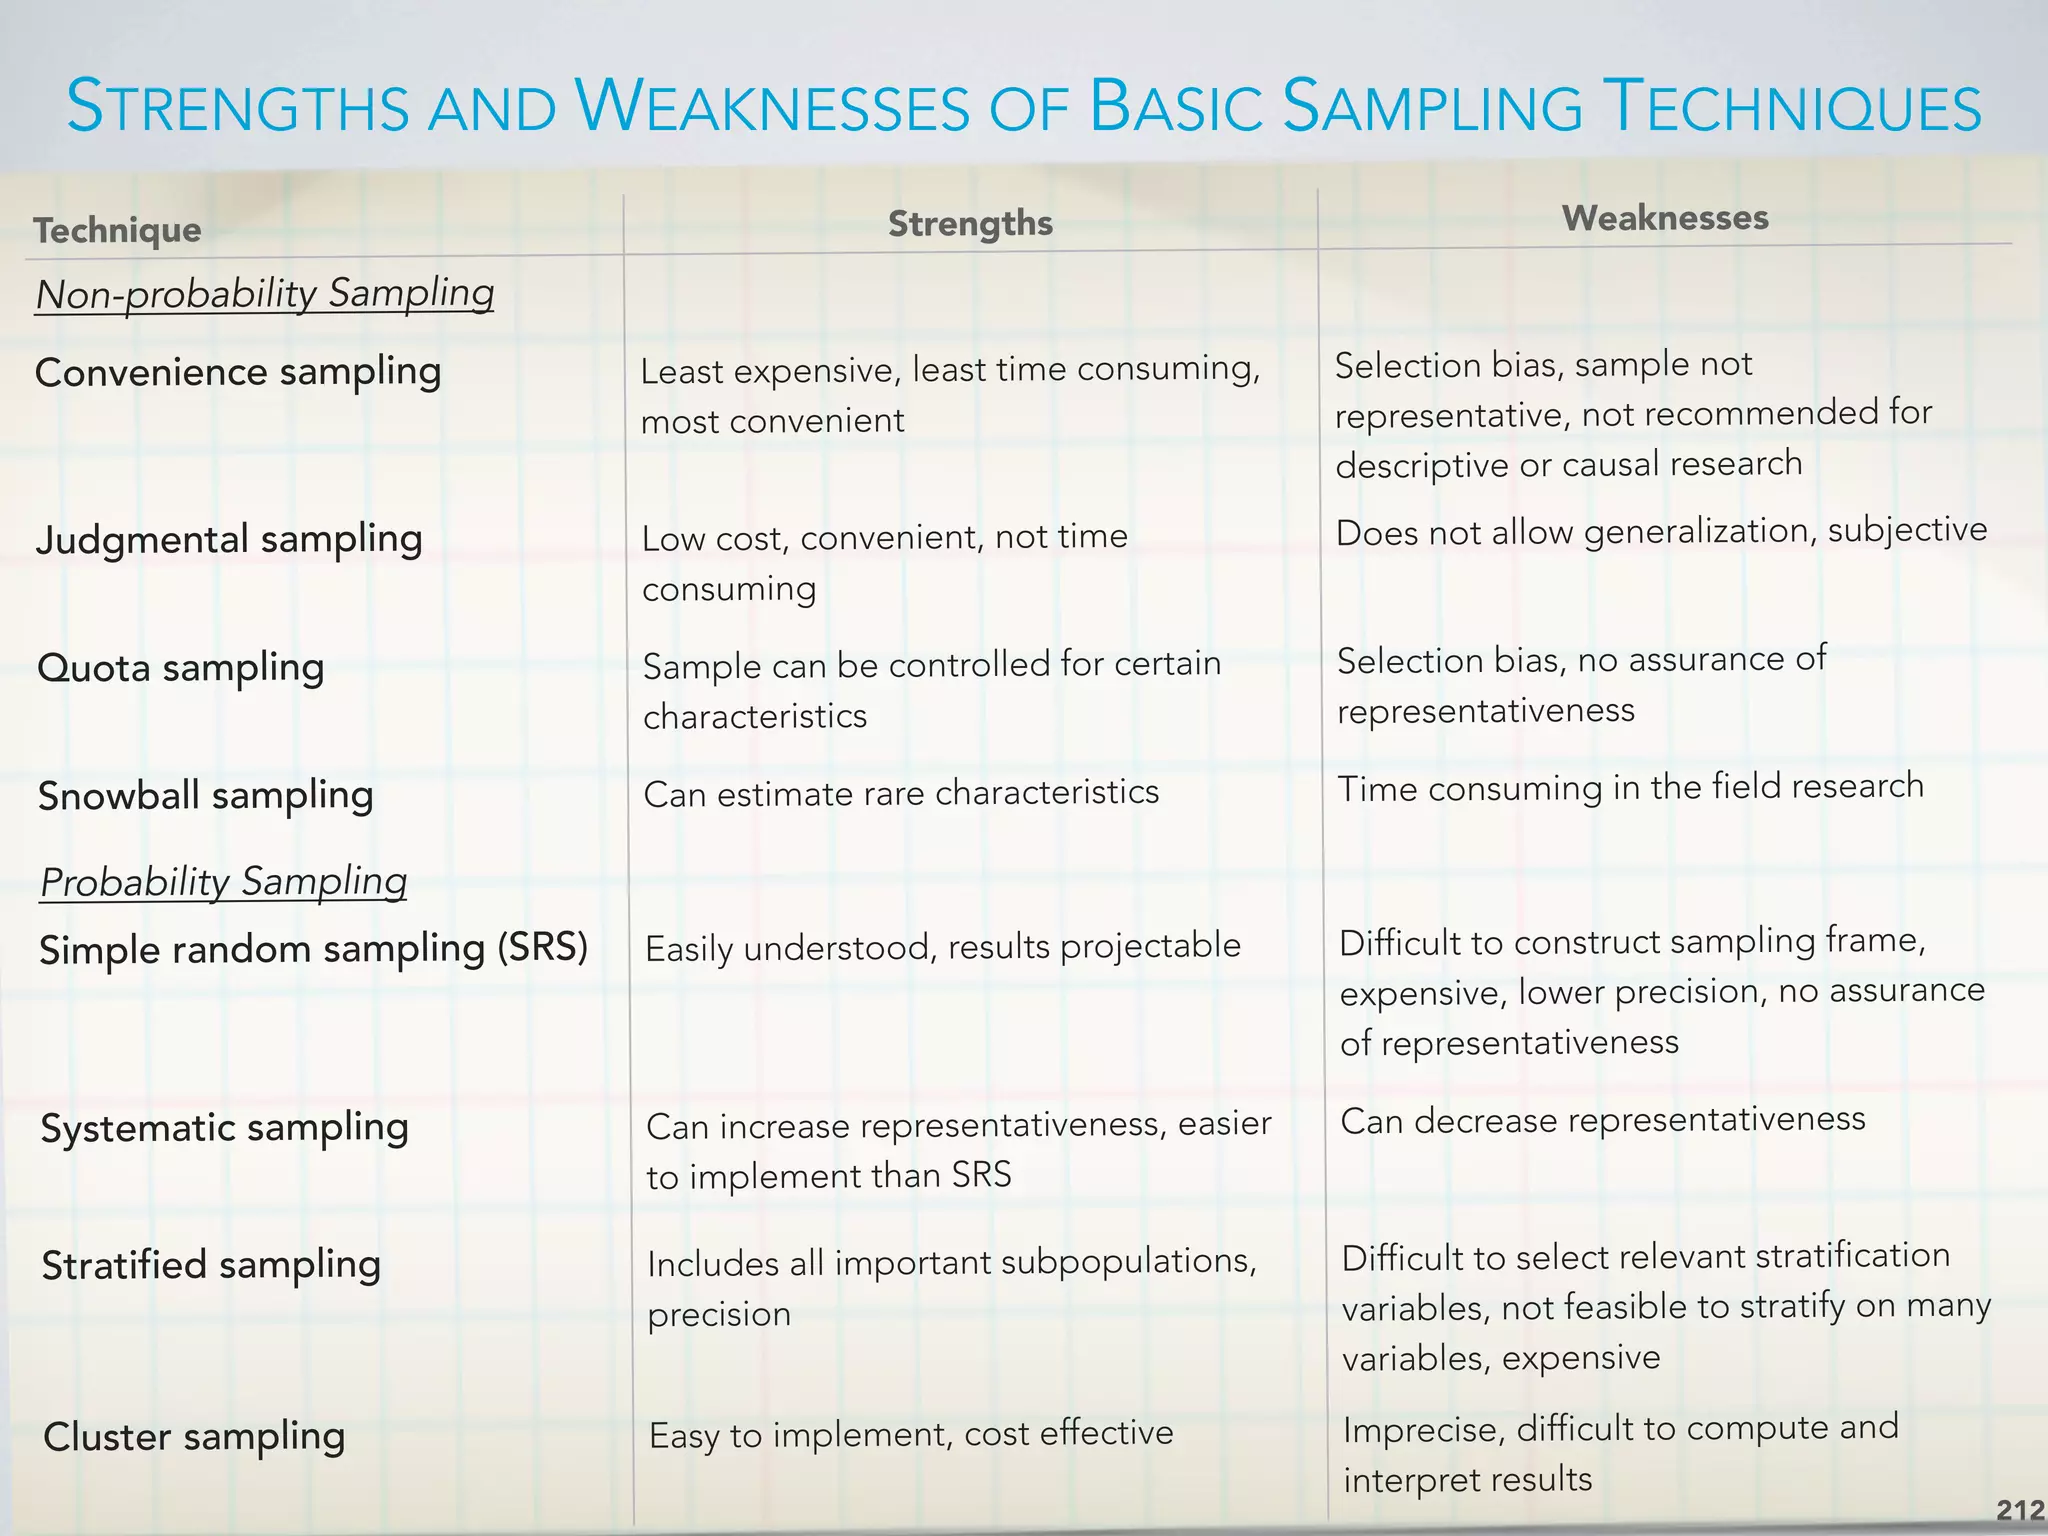
![Requires respondents to indicate a degree of agreement or disagreement with each of a series of
statements about the stimulus object within typically five to seven response categories.
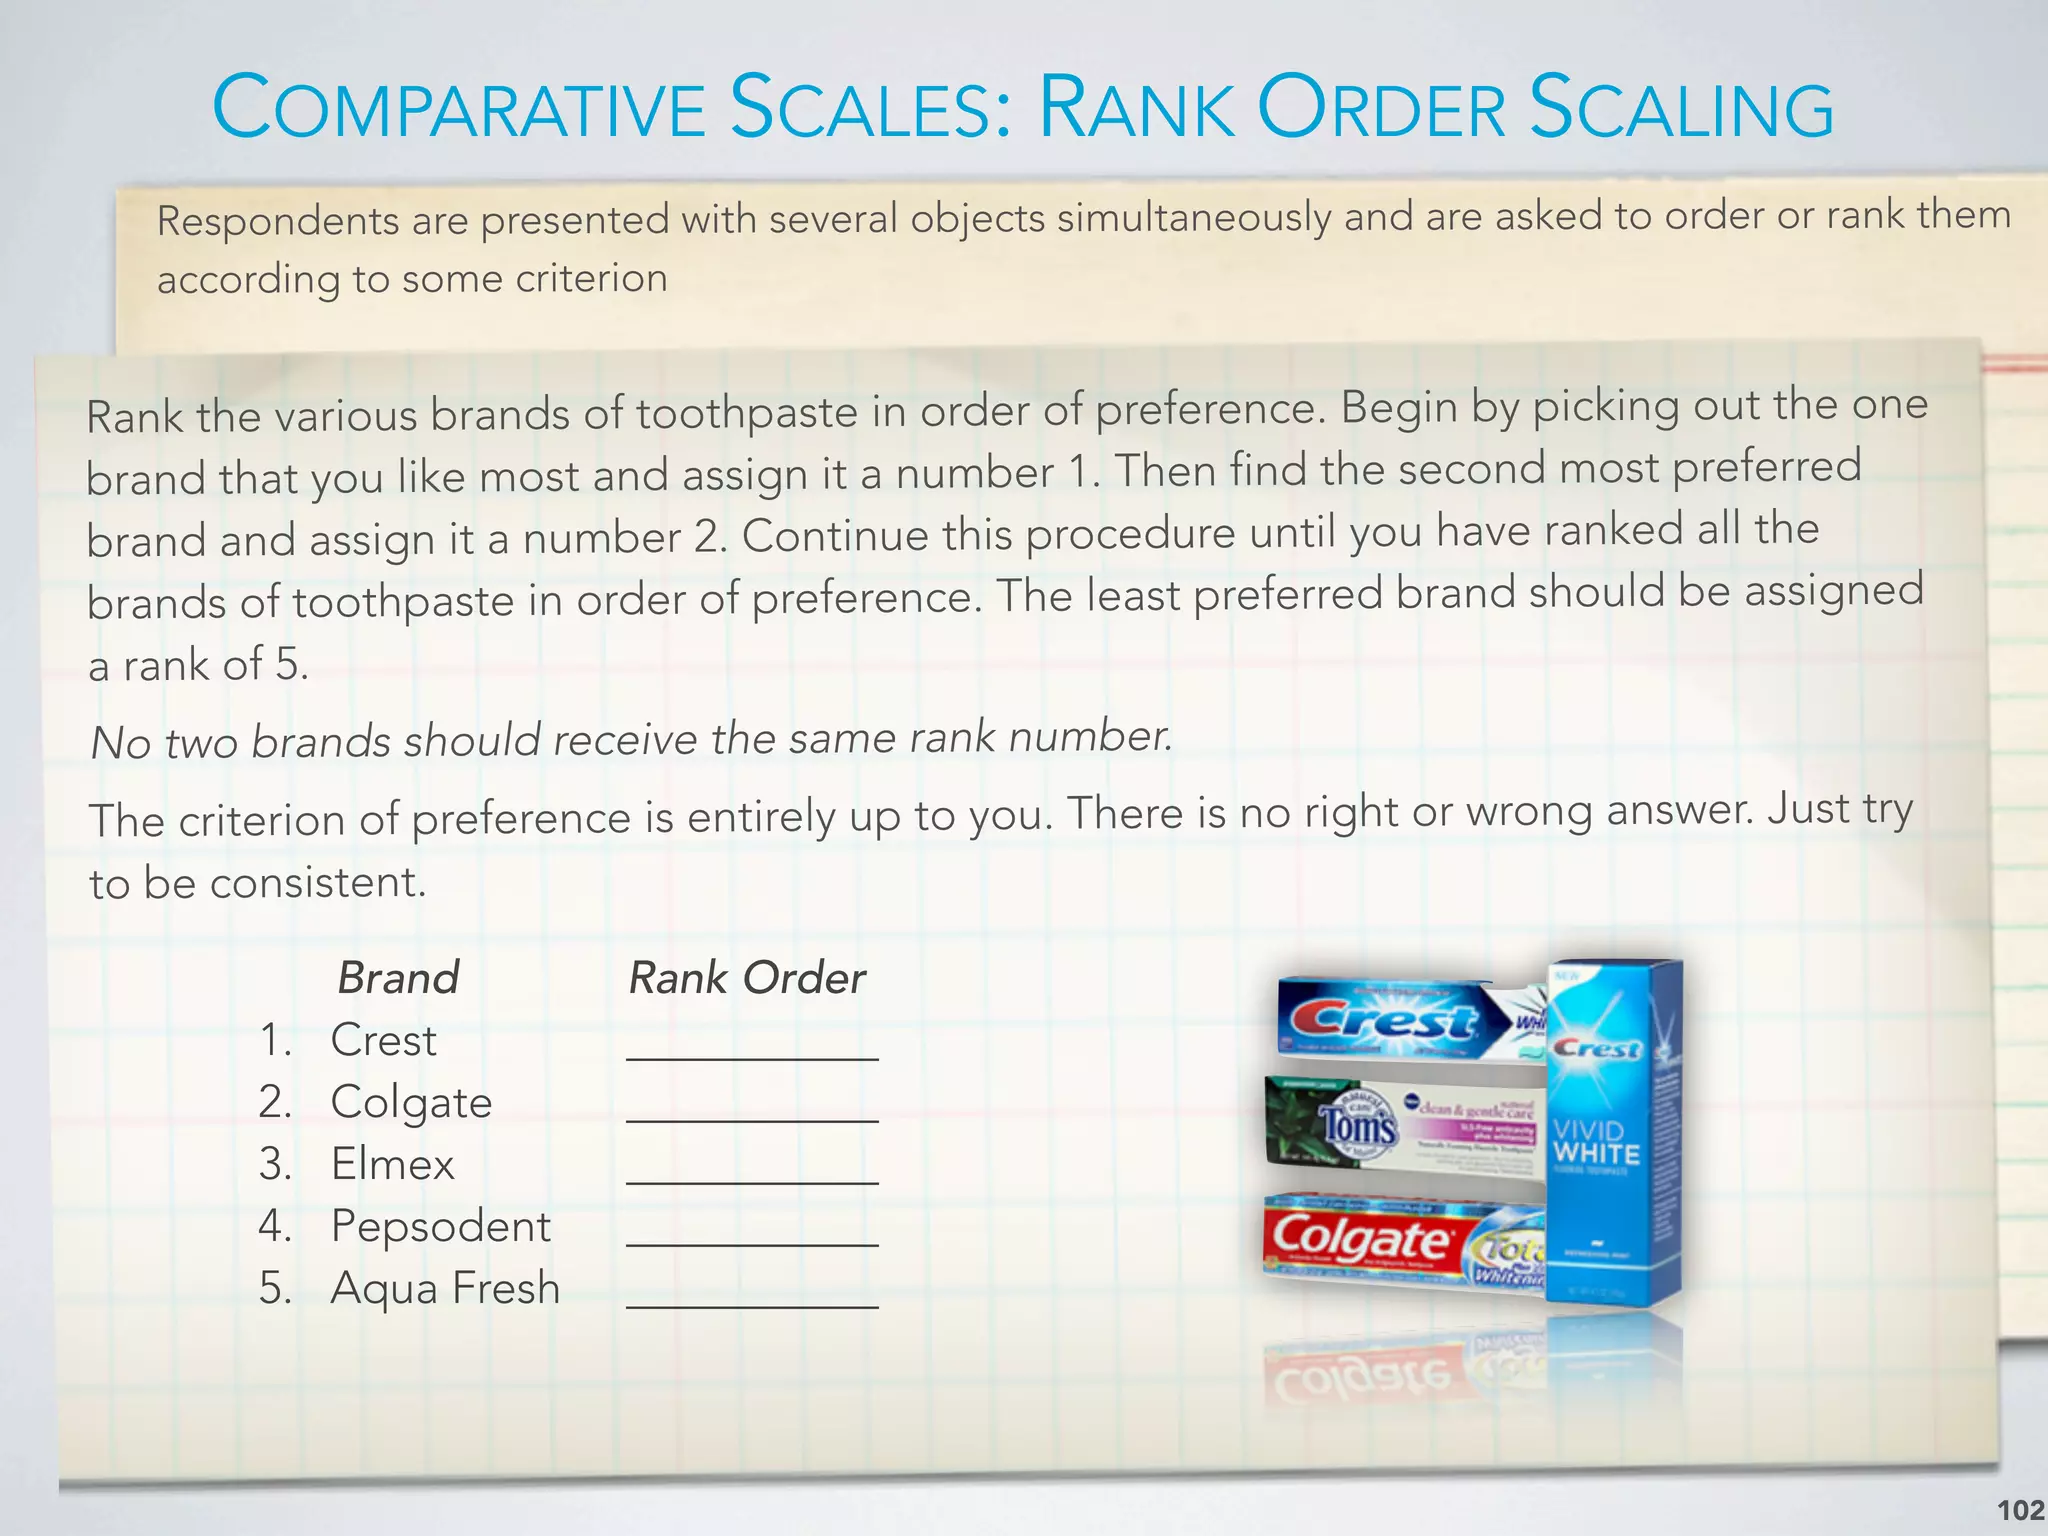
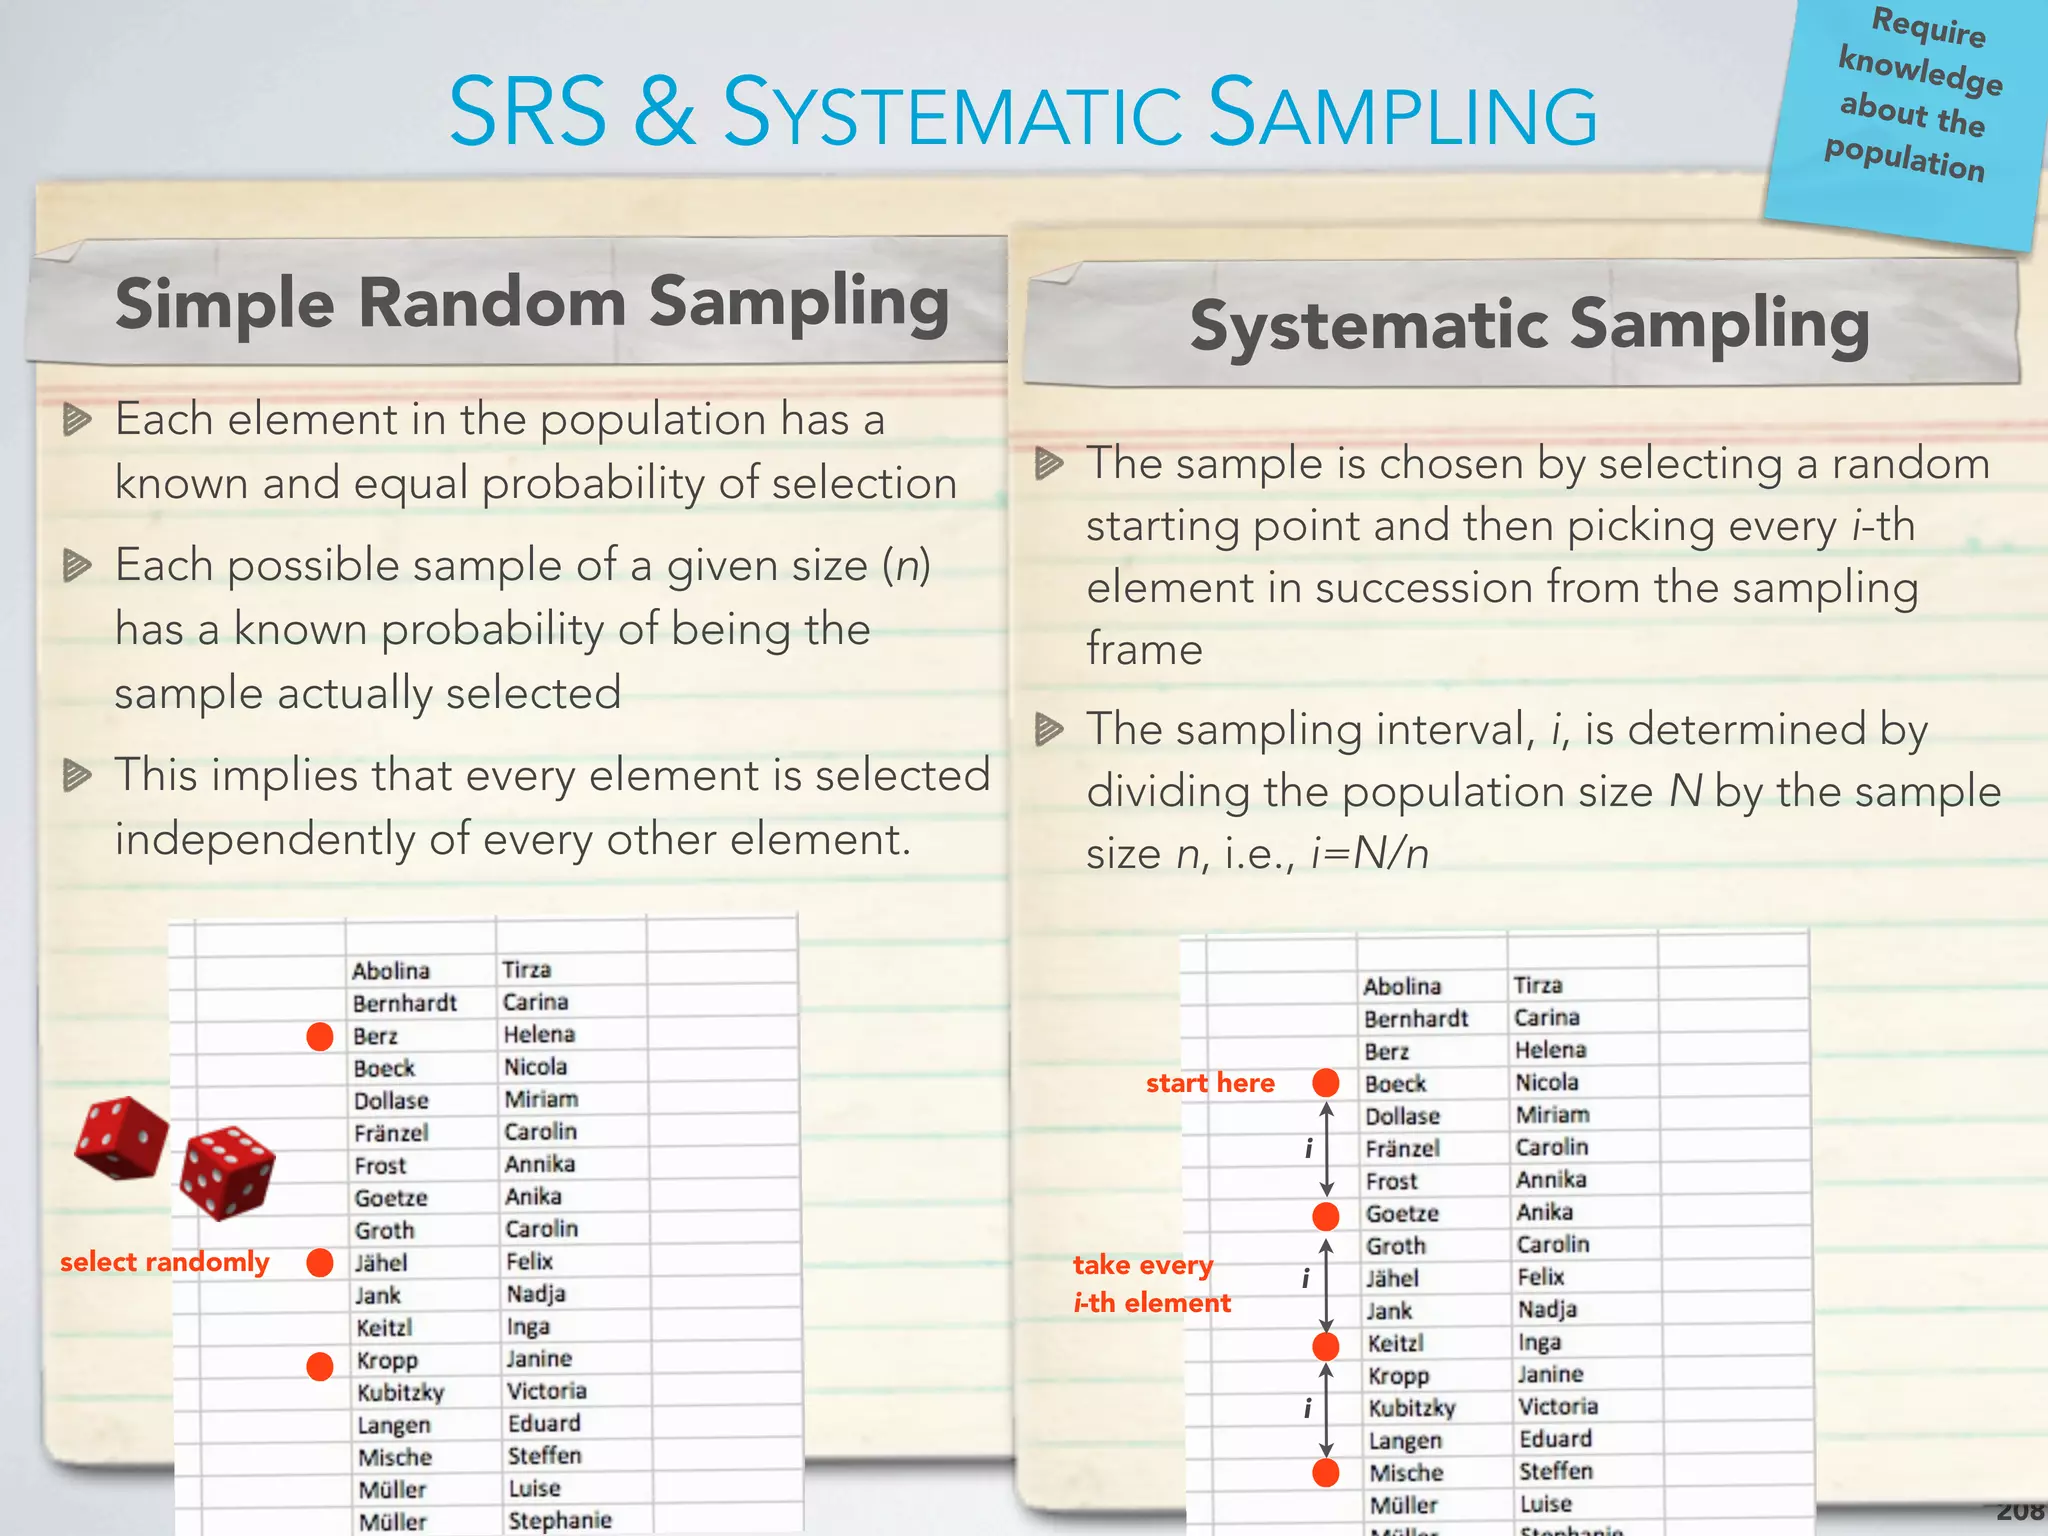
ITEMIZED RATING SCALES: LIKERT SCALE
117
Listed below are different opinions about Sears. Please indicate how strongly you agree or
disagree with each by using the following scale:
Strongly
disagree Disagree
Neither
agree
nor
disagree Agree
Strongly
agree
1 Sears sells high-quality merchandise [1] [x] [3] [4] [5]
2 Sears has poor in-store service [1] [x] [3] [4] [5]
3 I like to shop in Sears [1] [2] [x] [4] [5]
4
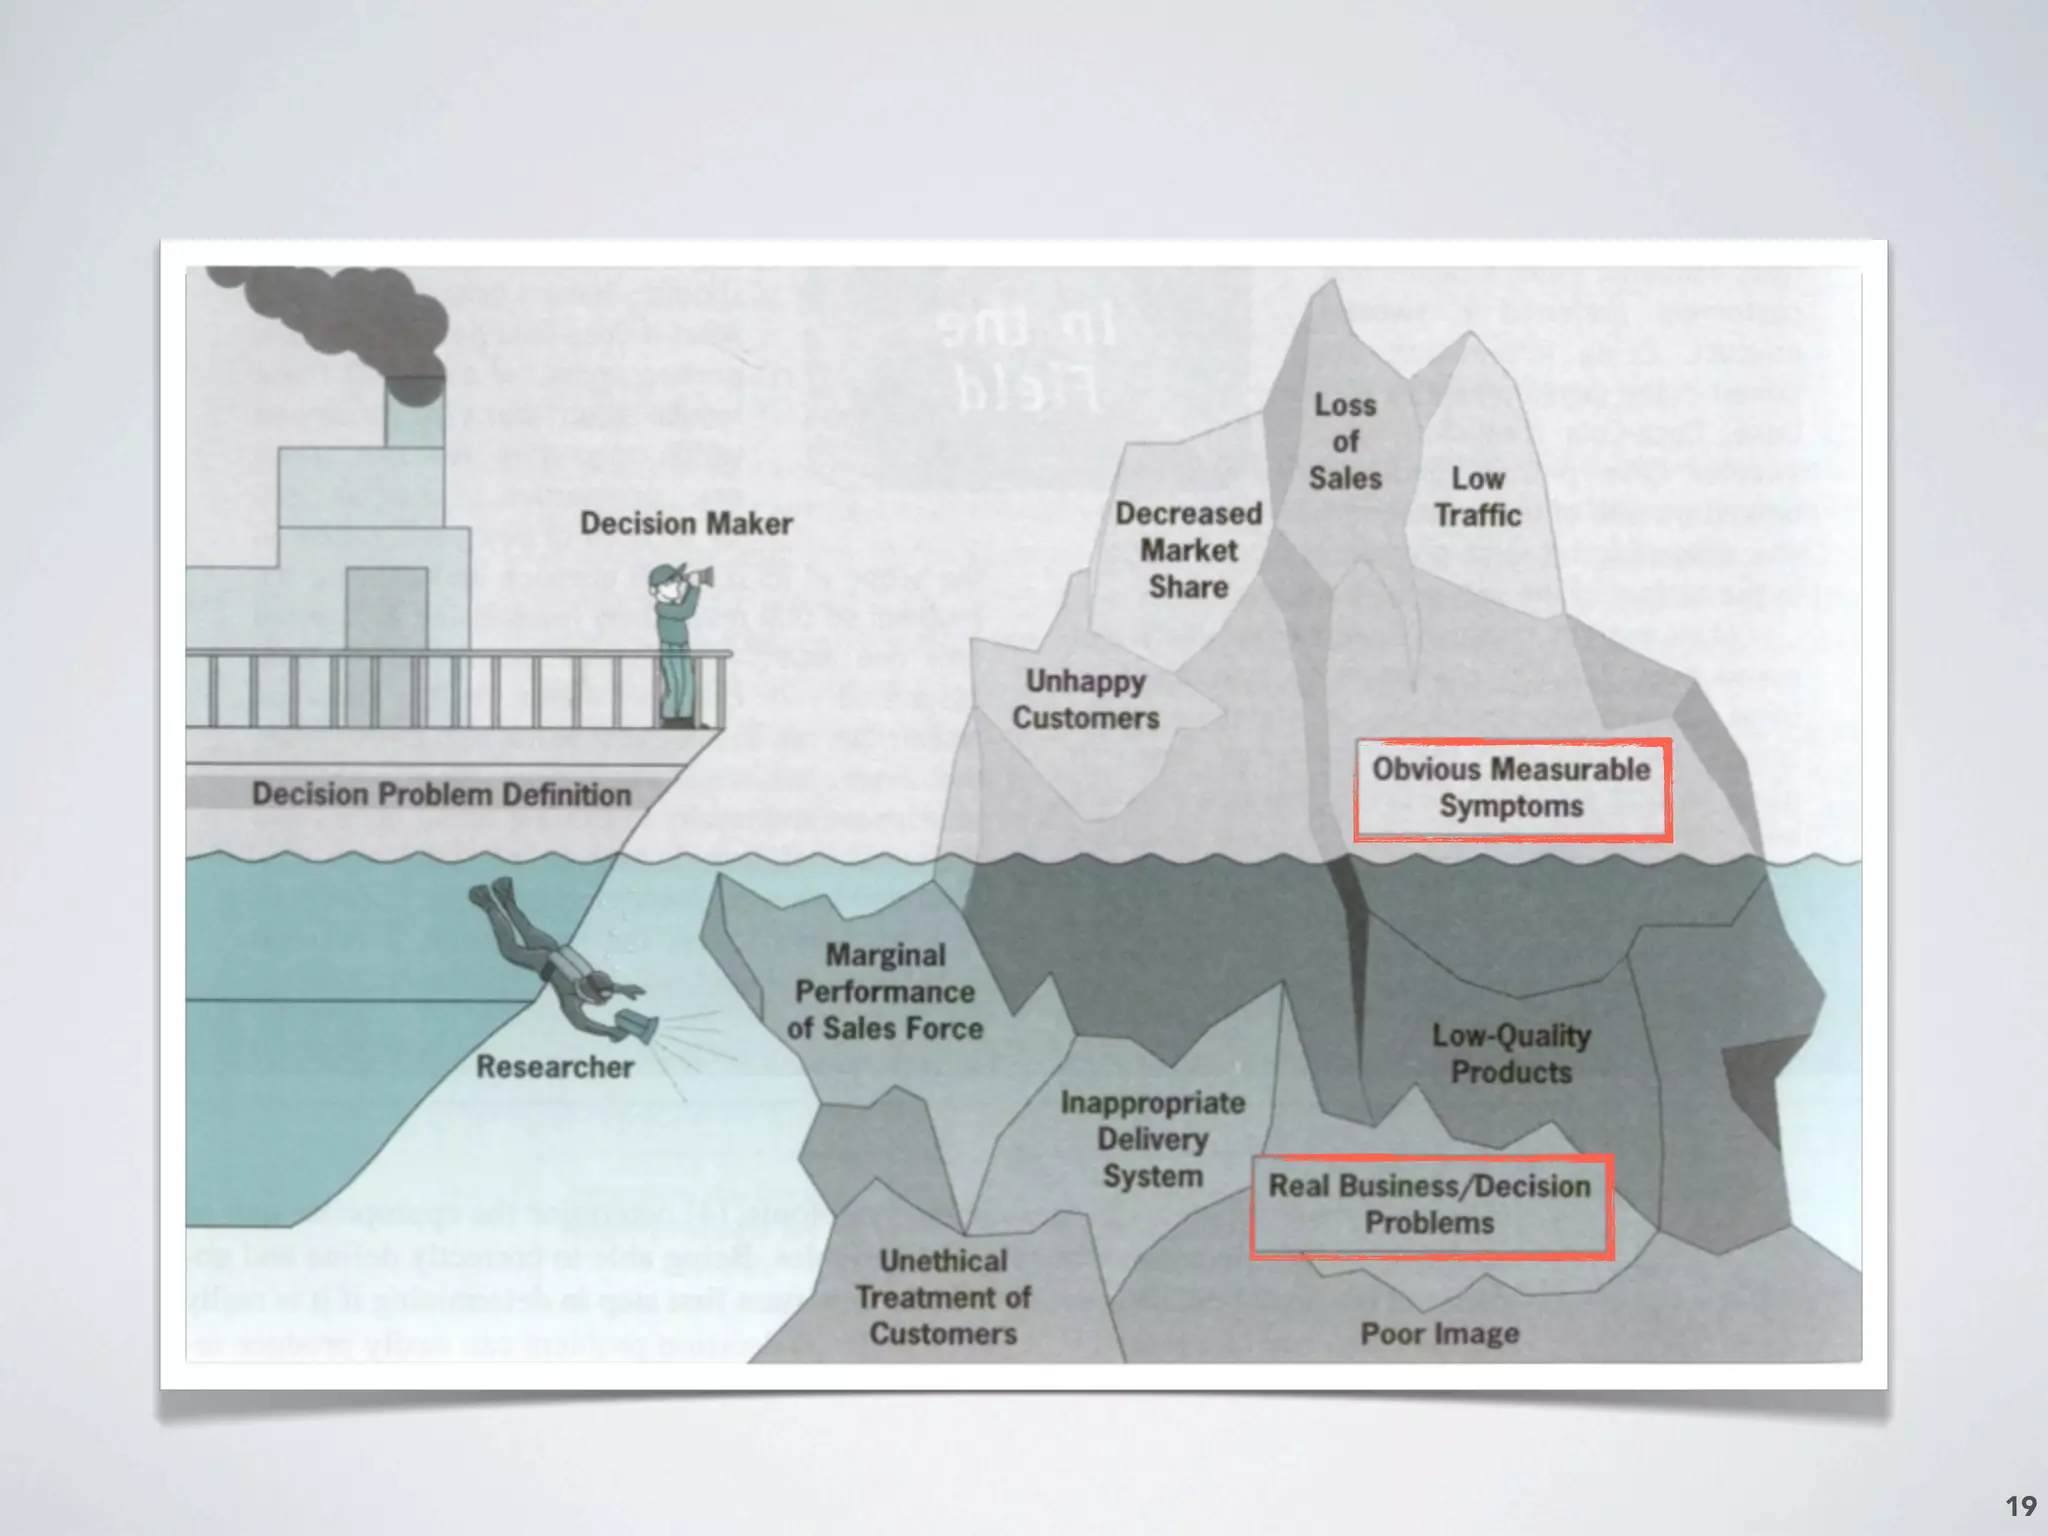
Sears does not offer a good mix of different
brands within a product category
[1] [2] [3] [x] [5]
5 The credit policies at Sears are terrible [1] [2] [3] [x] [5]
6 Sears is where America shops [x] [2] [3] [4] [5]
7 I do not like advertising done by Sears [1] [2] [3] [x] [5]
8 Sears sells a wide variety of merchandise [1] [2] [3] [x] [5]
9 Sears charges fair prices [1] [x] [3] [4] [5]
1 = Strongly agree
2 = Disagree
3 = Neither agree nor disagree
4 = Agree
5 = Strongly agree
NOTICE the reversed scoring of items 2,4,5, and 7. Reverse the scale for these items prior analyzing to be consistent with the whole set of items, i.e. a higher score should
denote a more favorable attitude.](https://image.slidesharecdn.com/marketresearchbypaulmarx-121101082001-phpapp02/75/Market-Research-course-slides-117-2048.jpg)
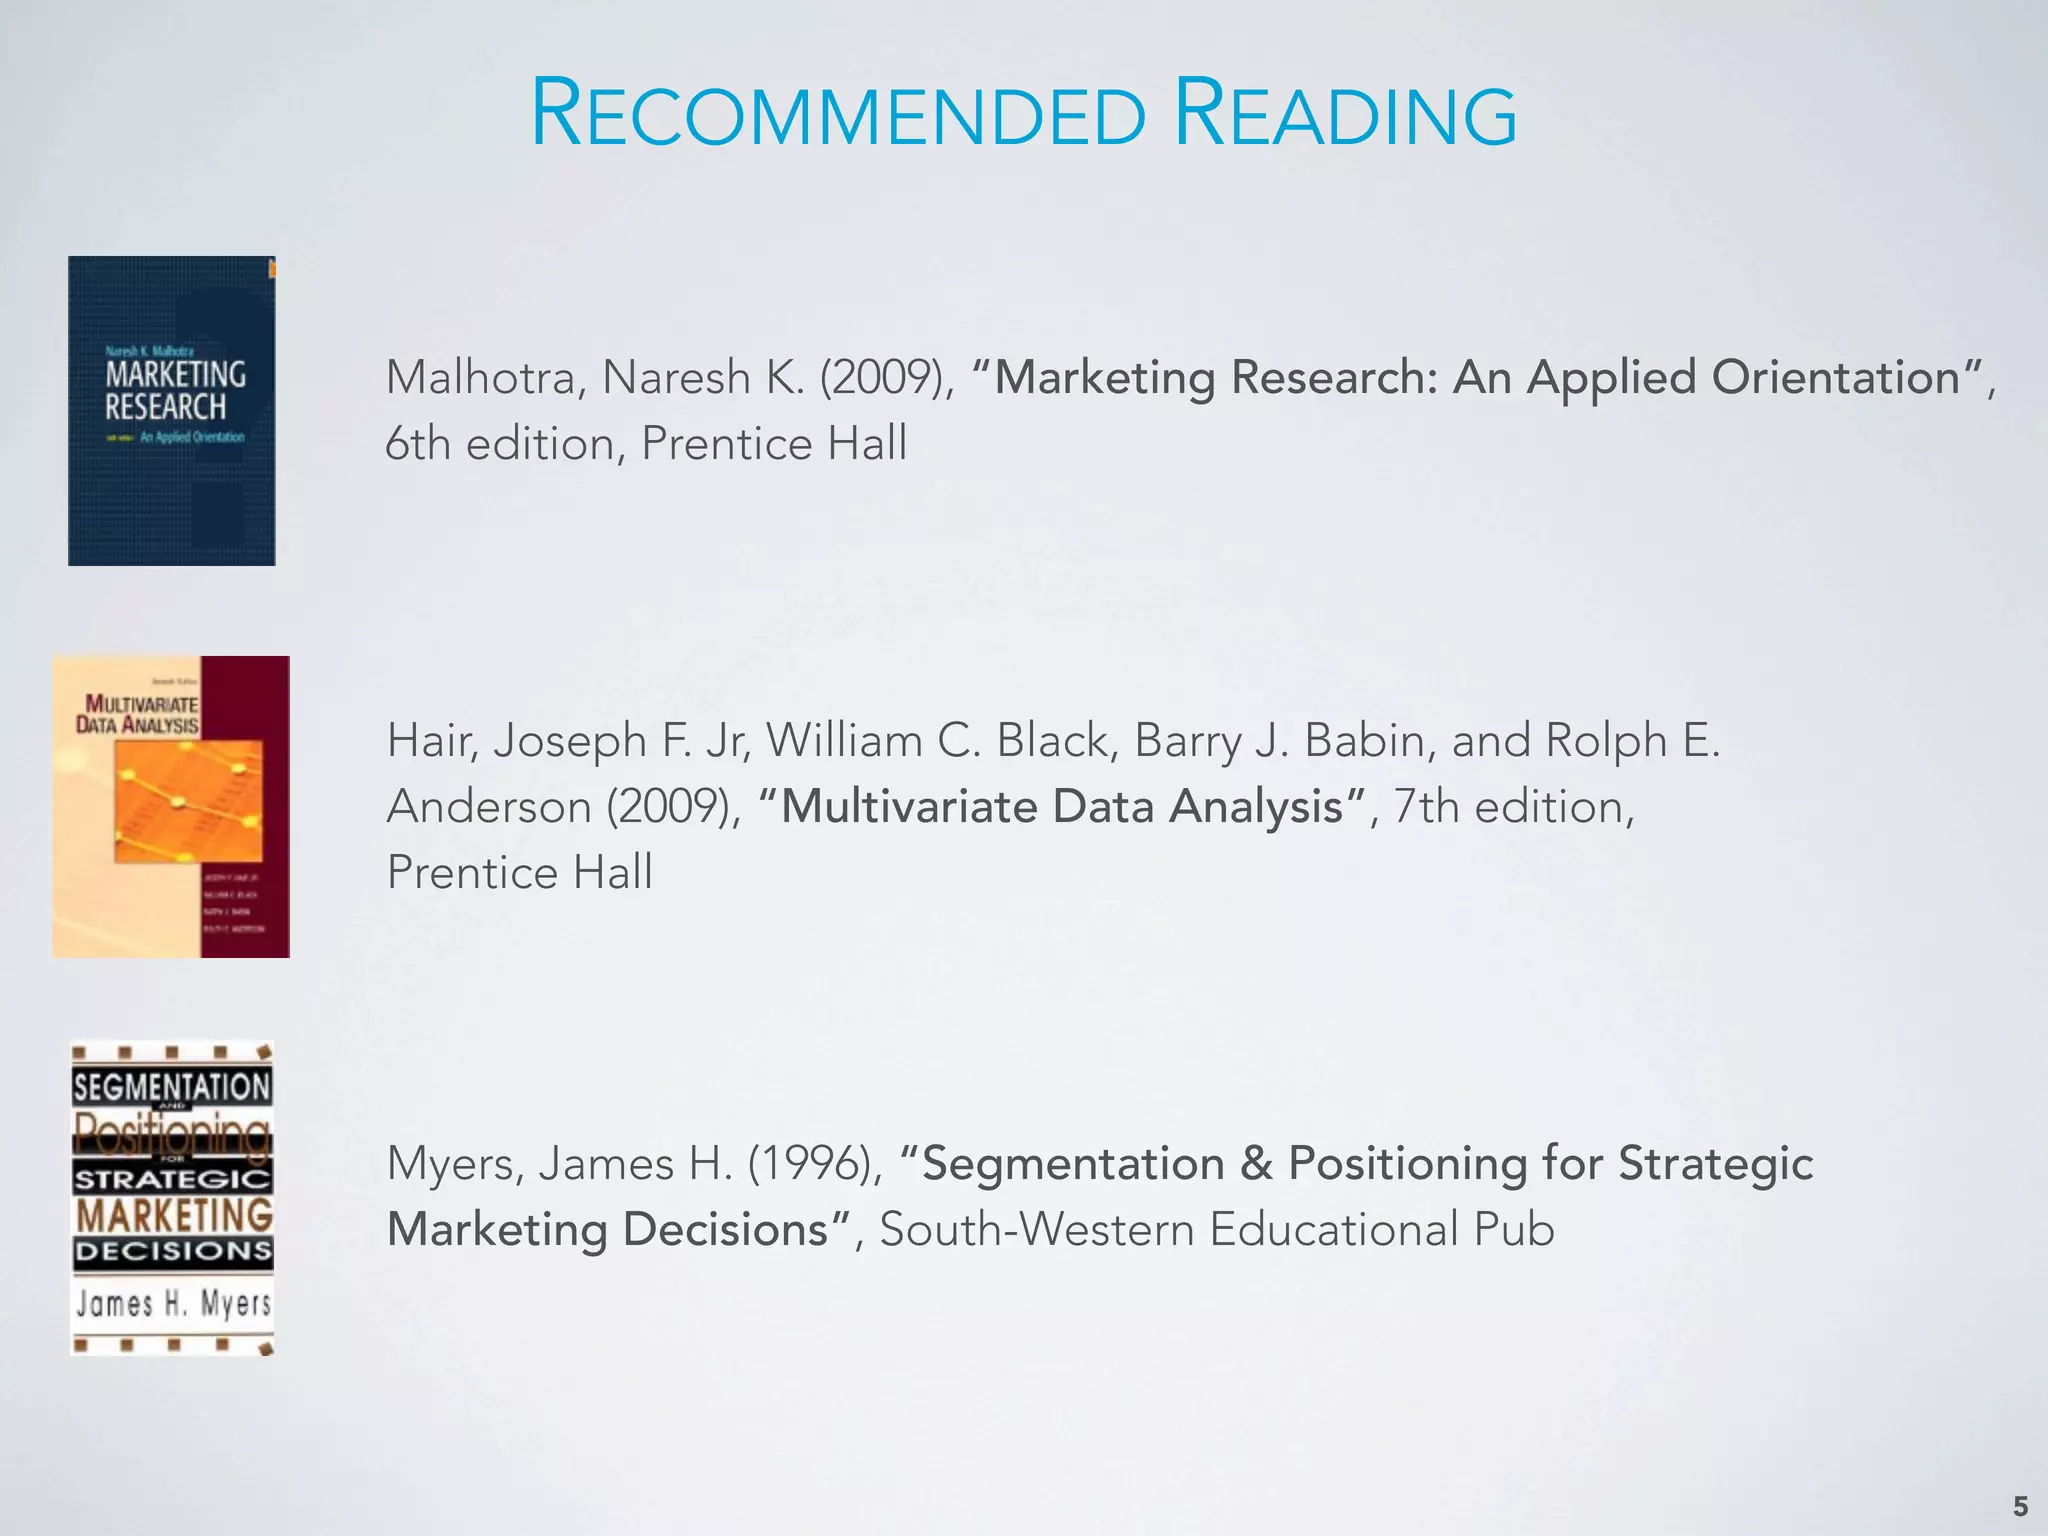
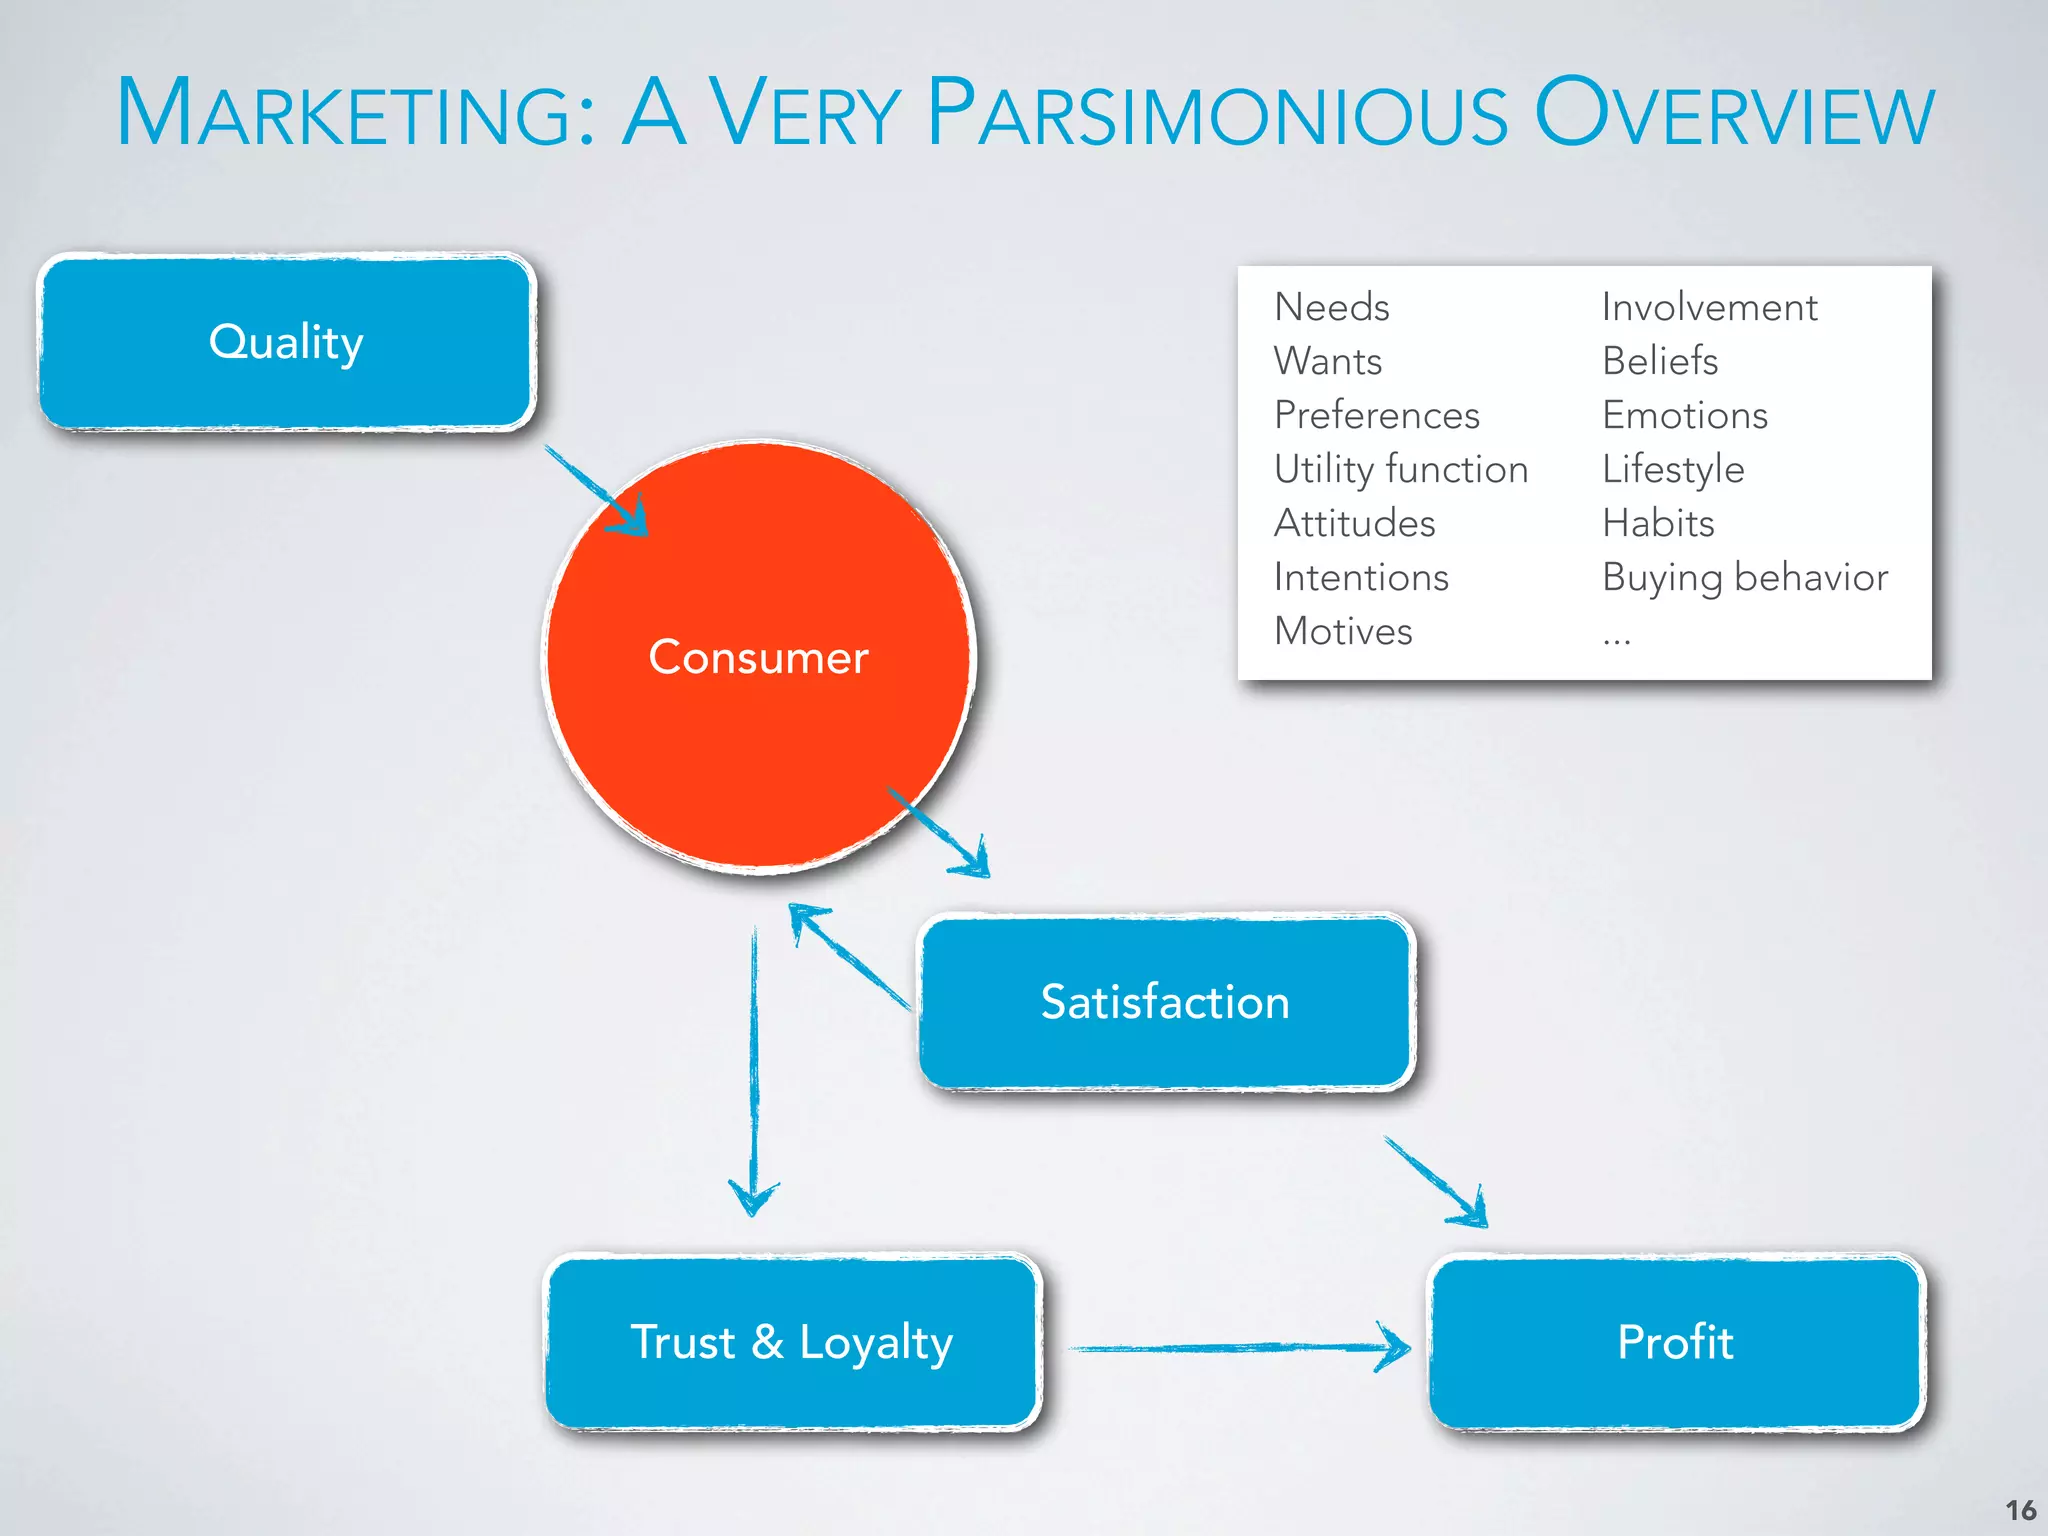
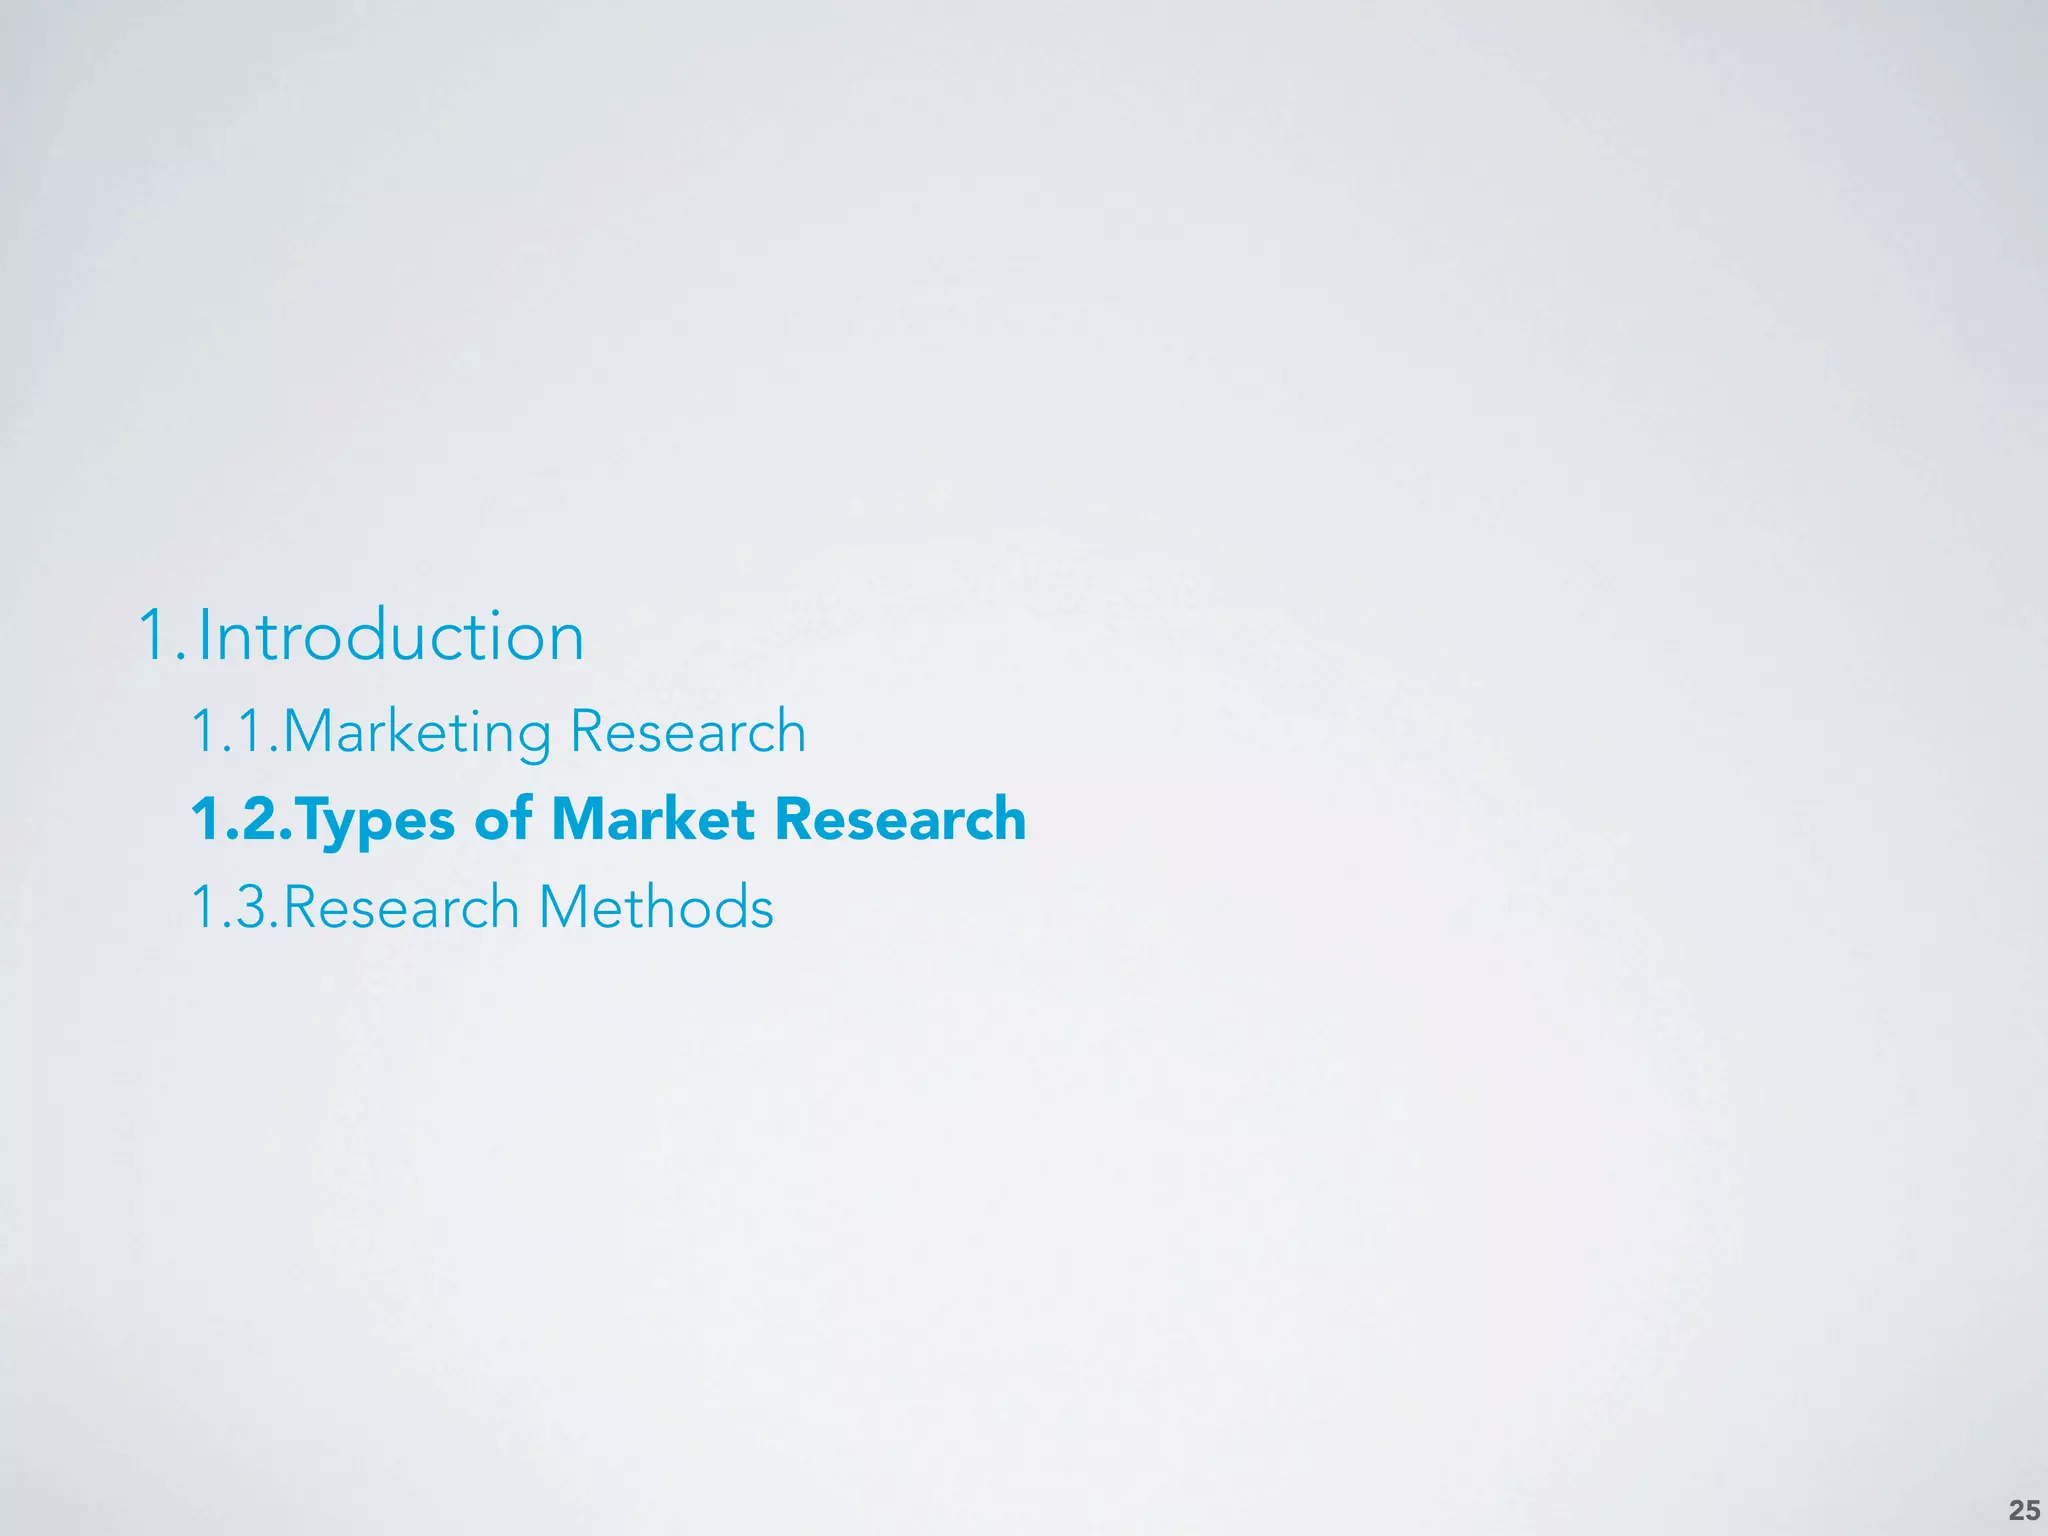
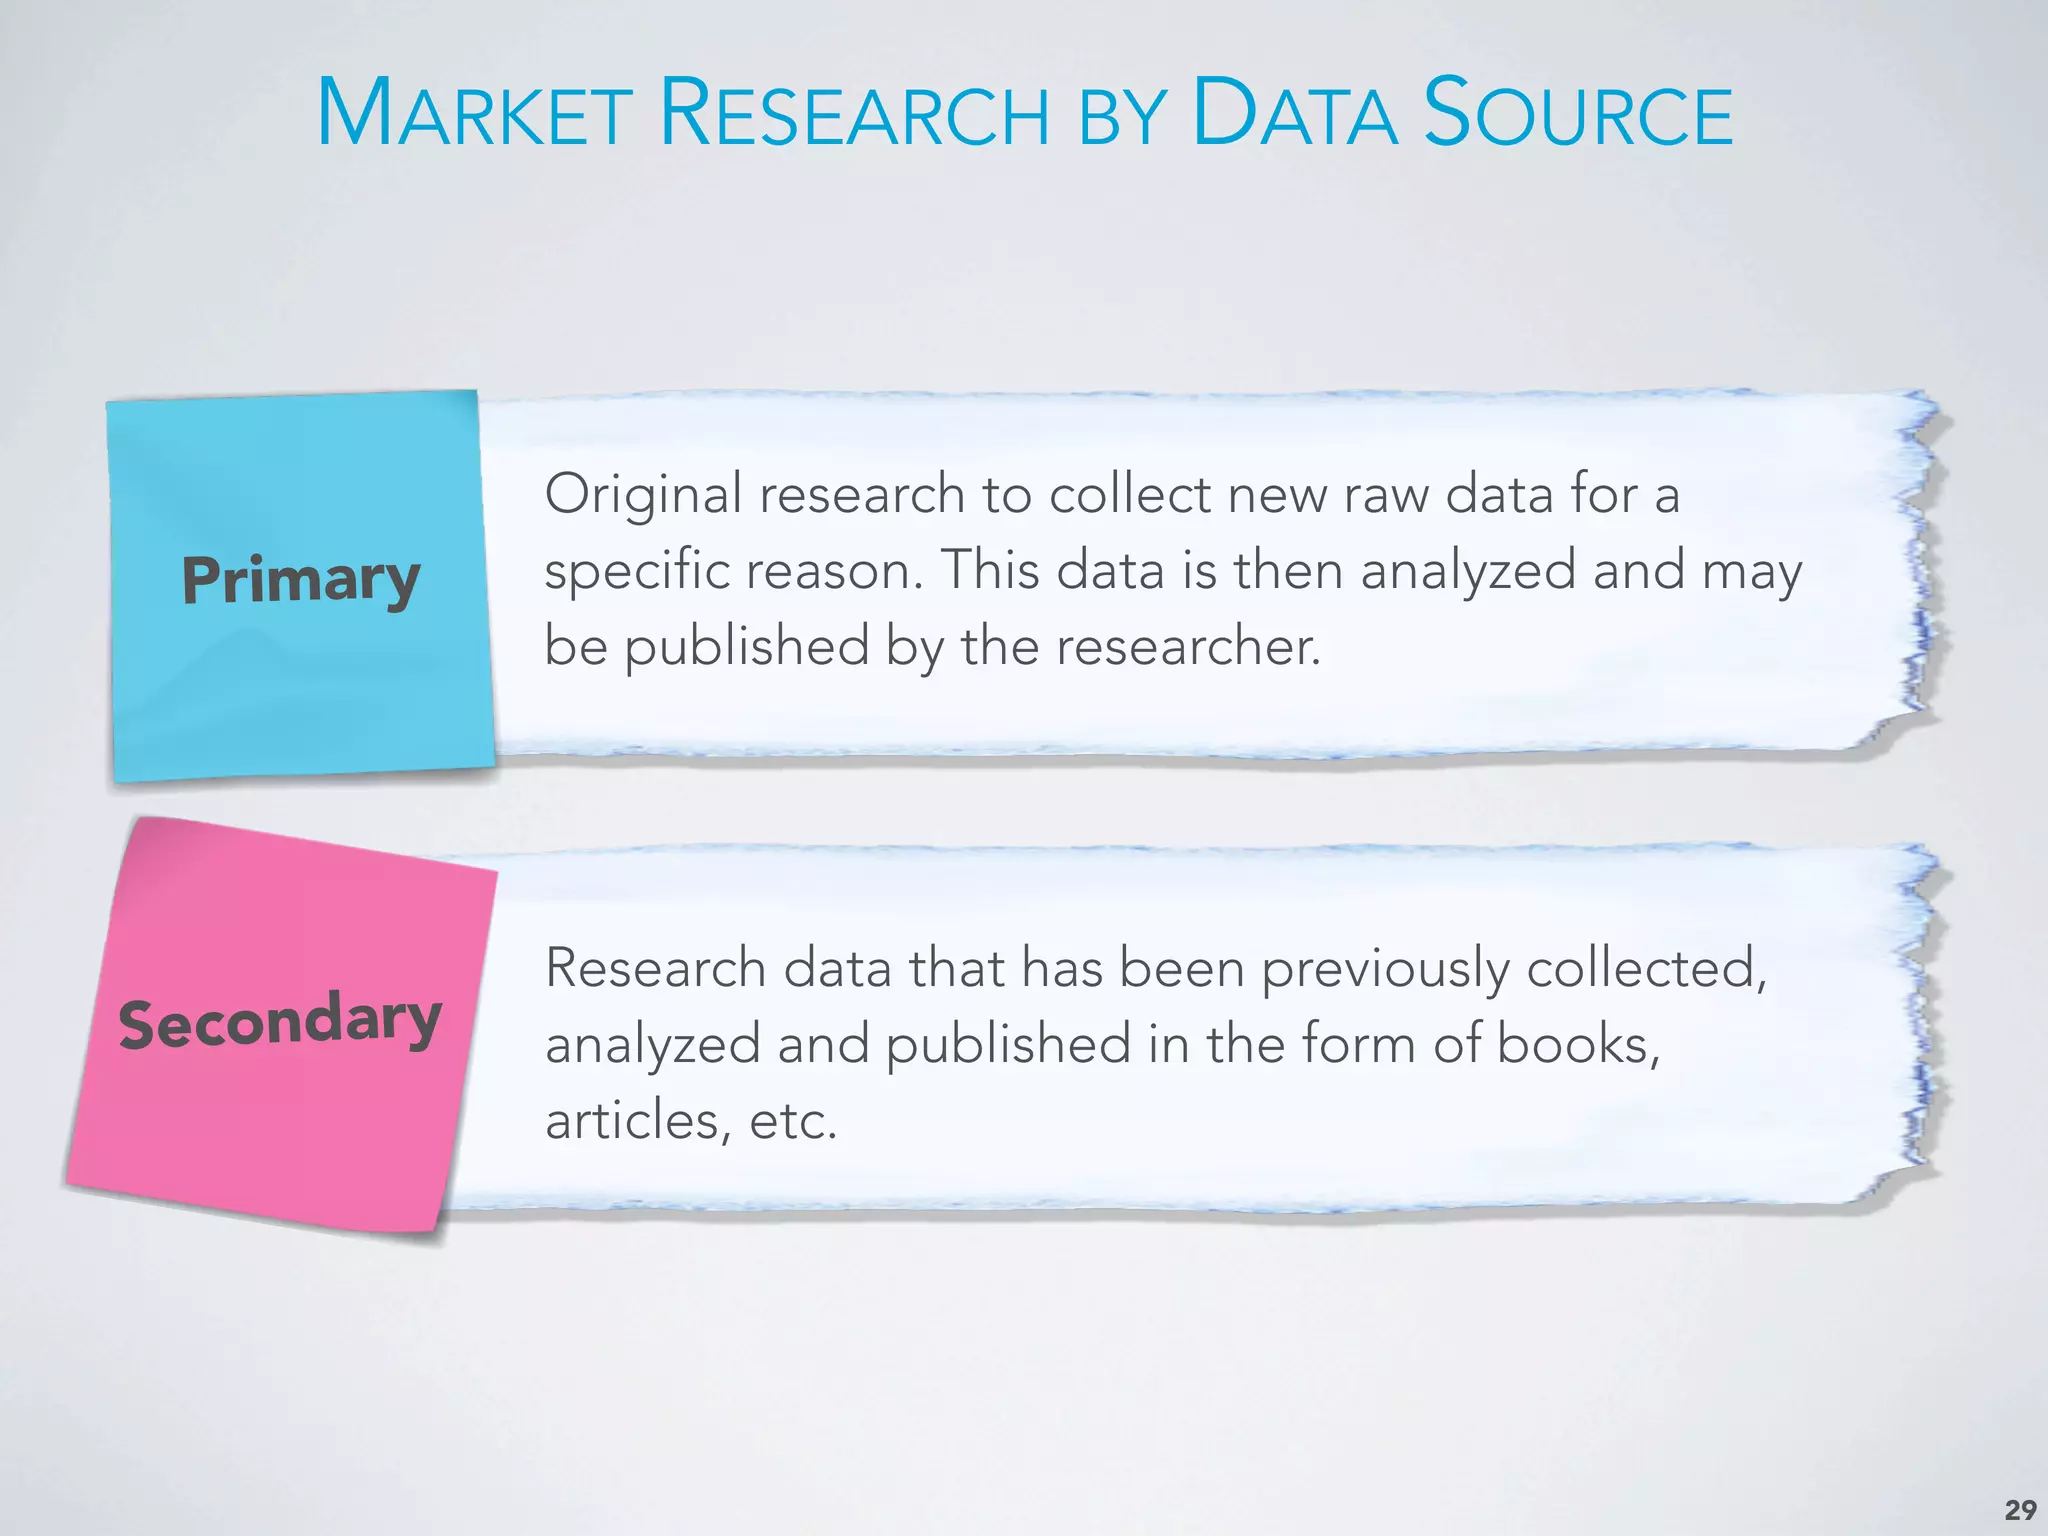
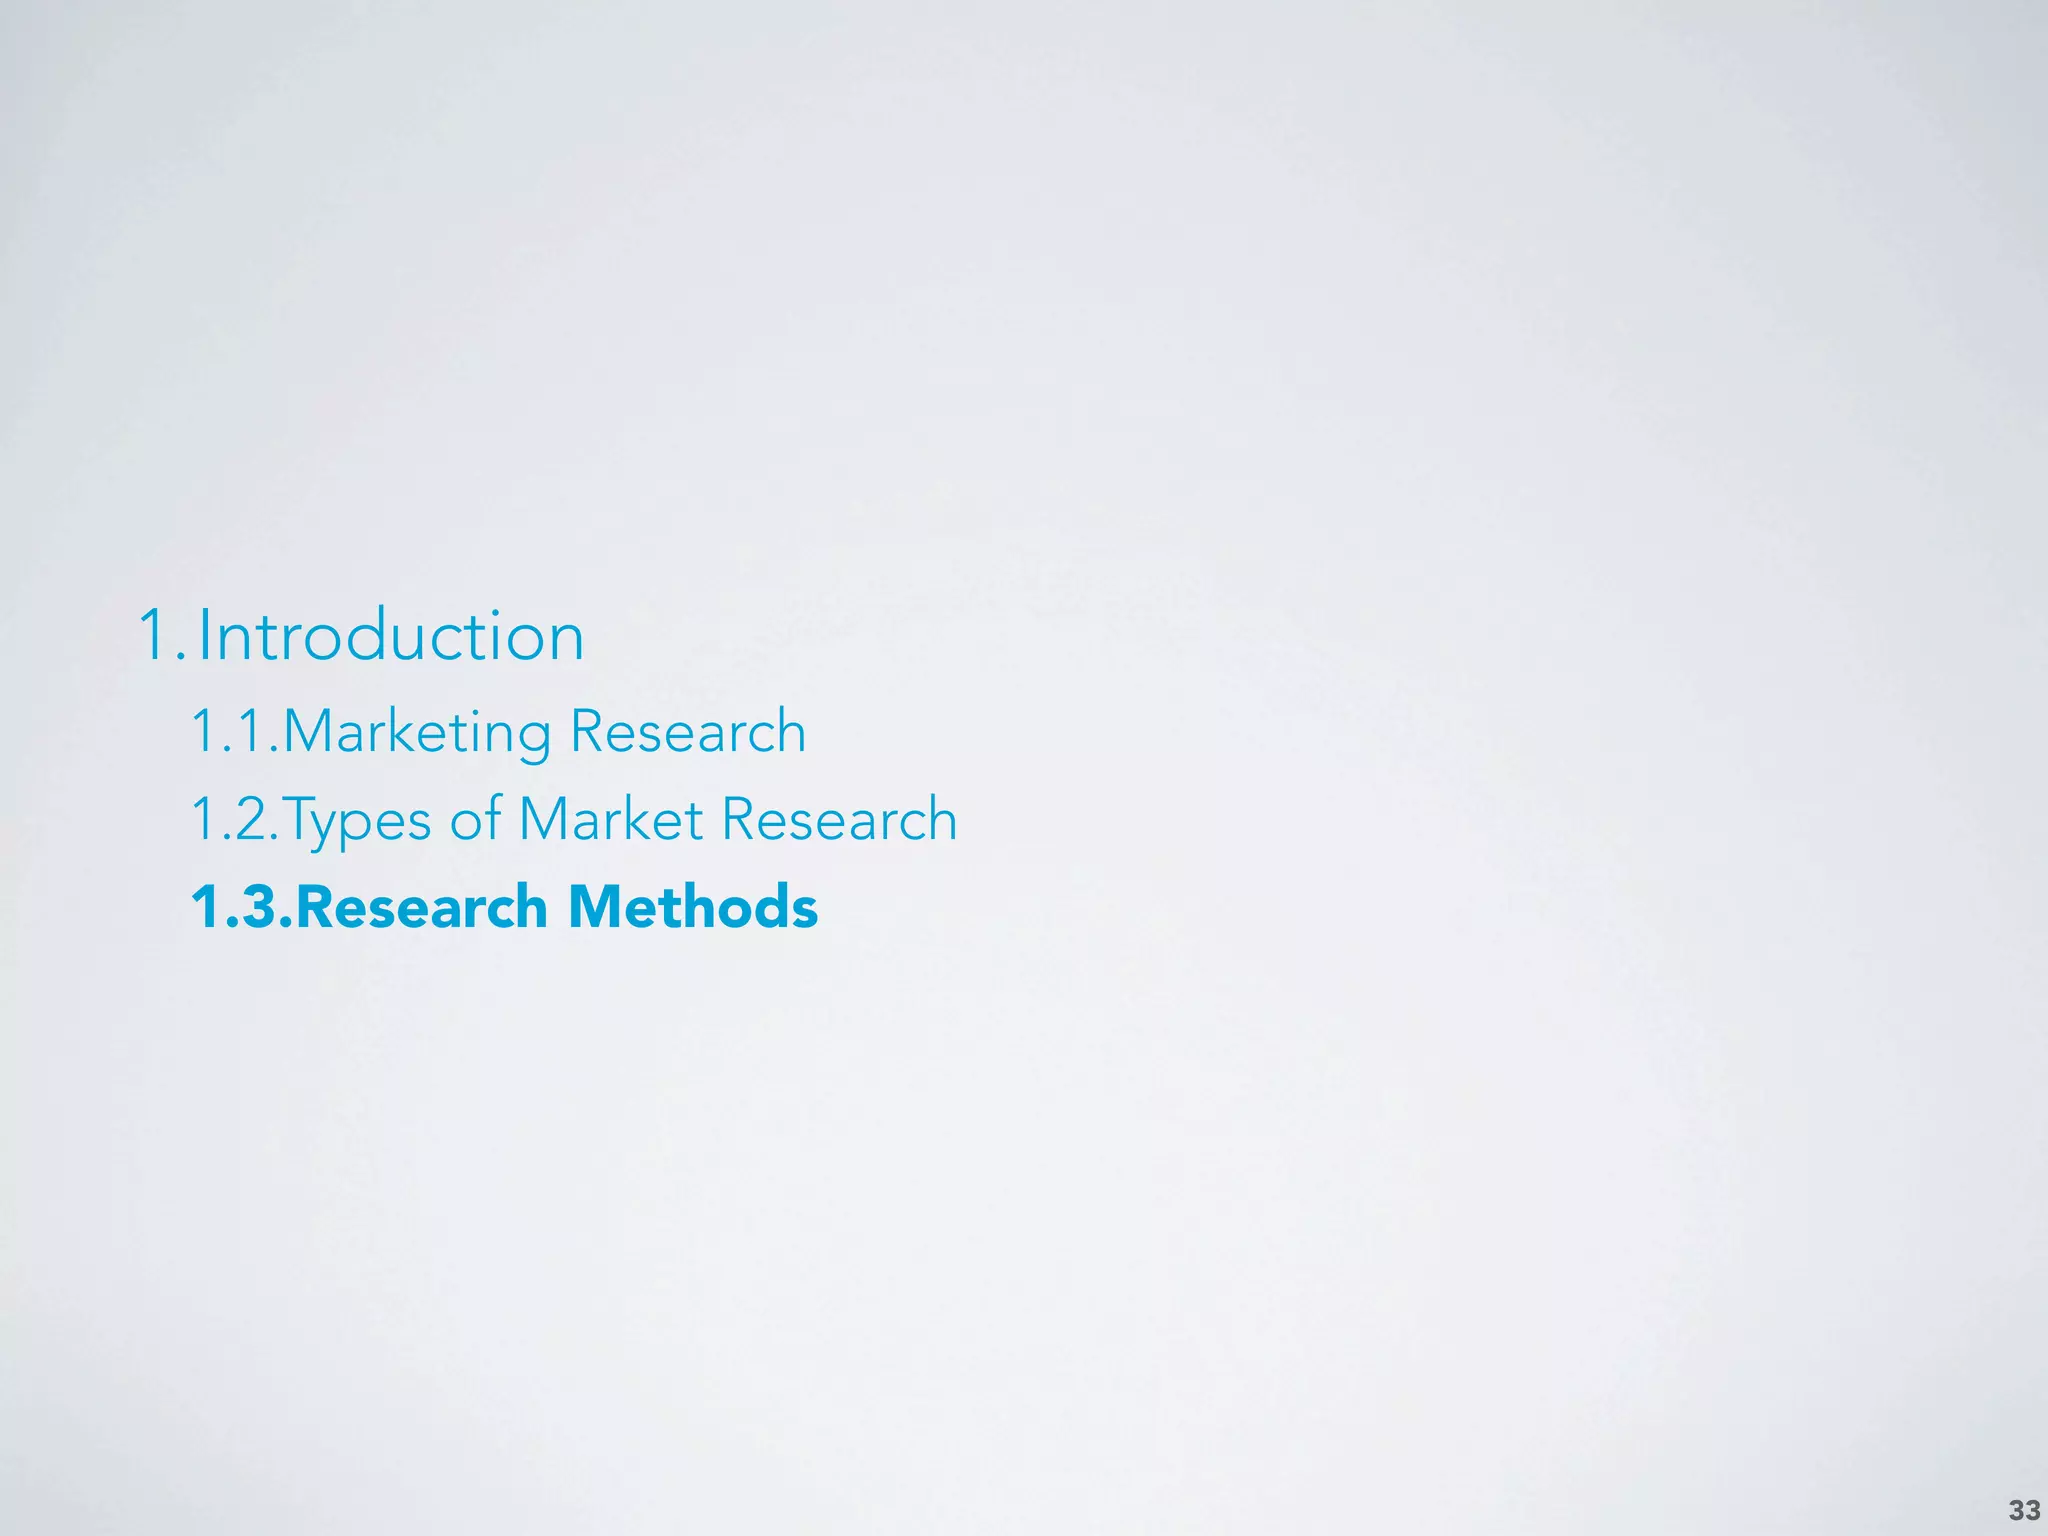
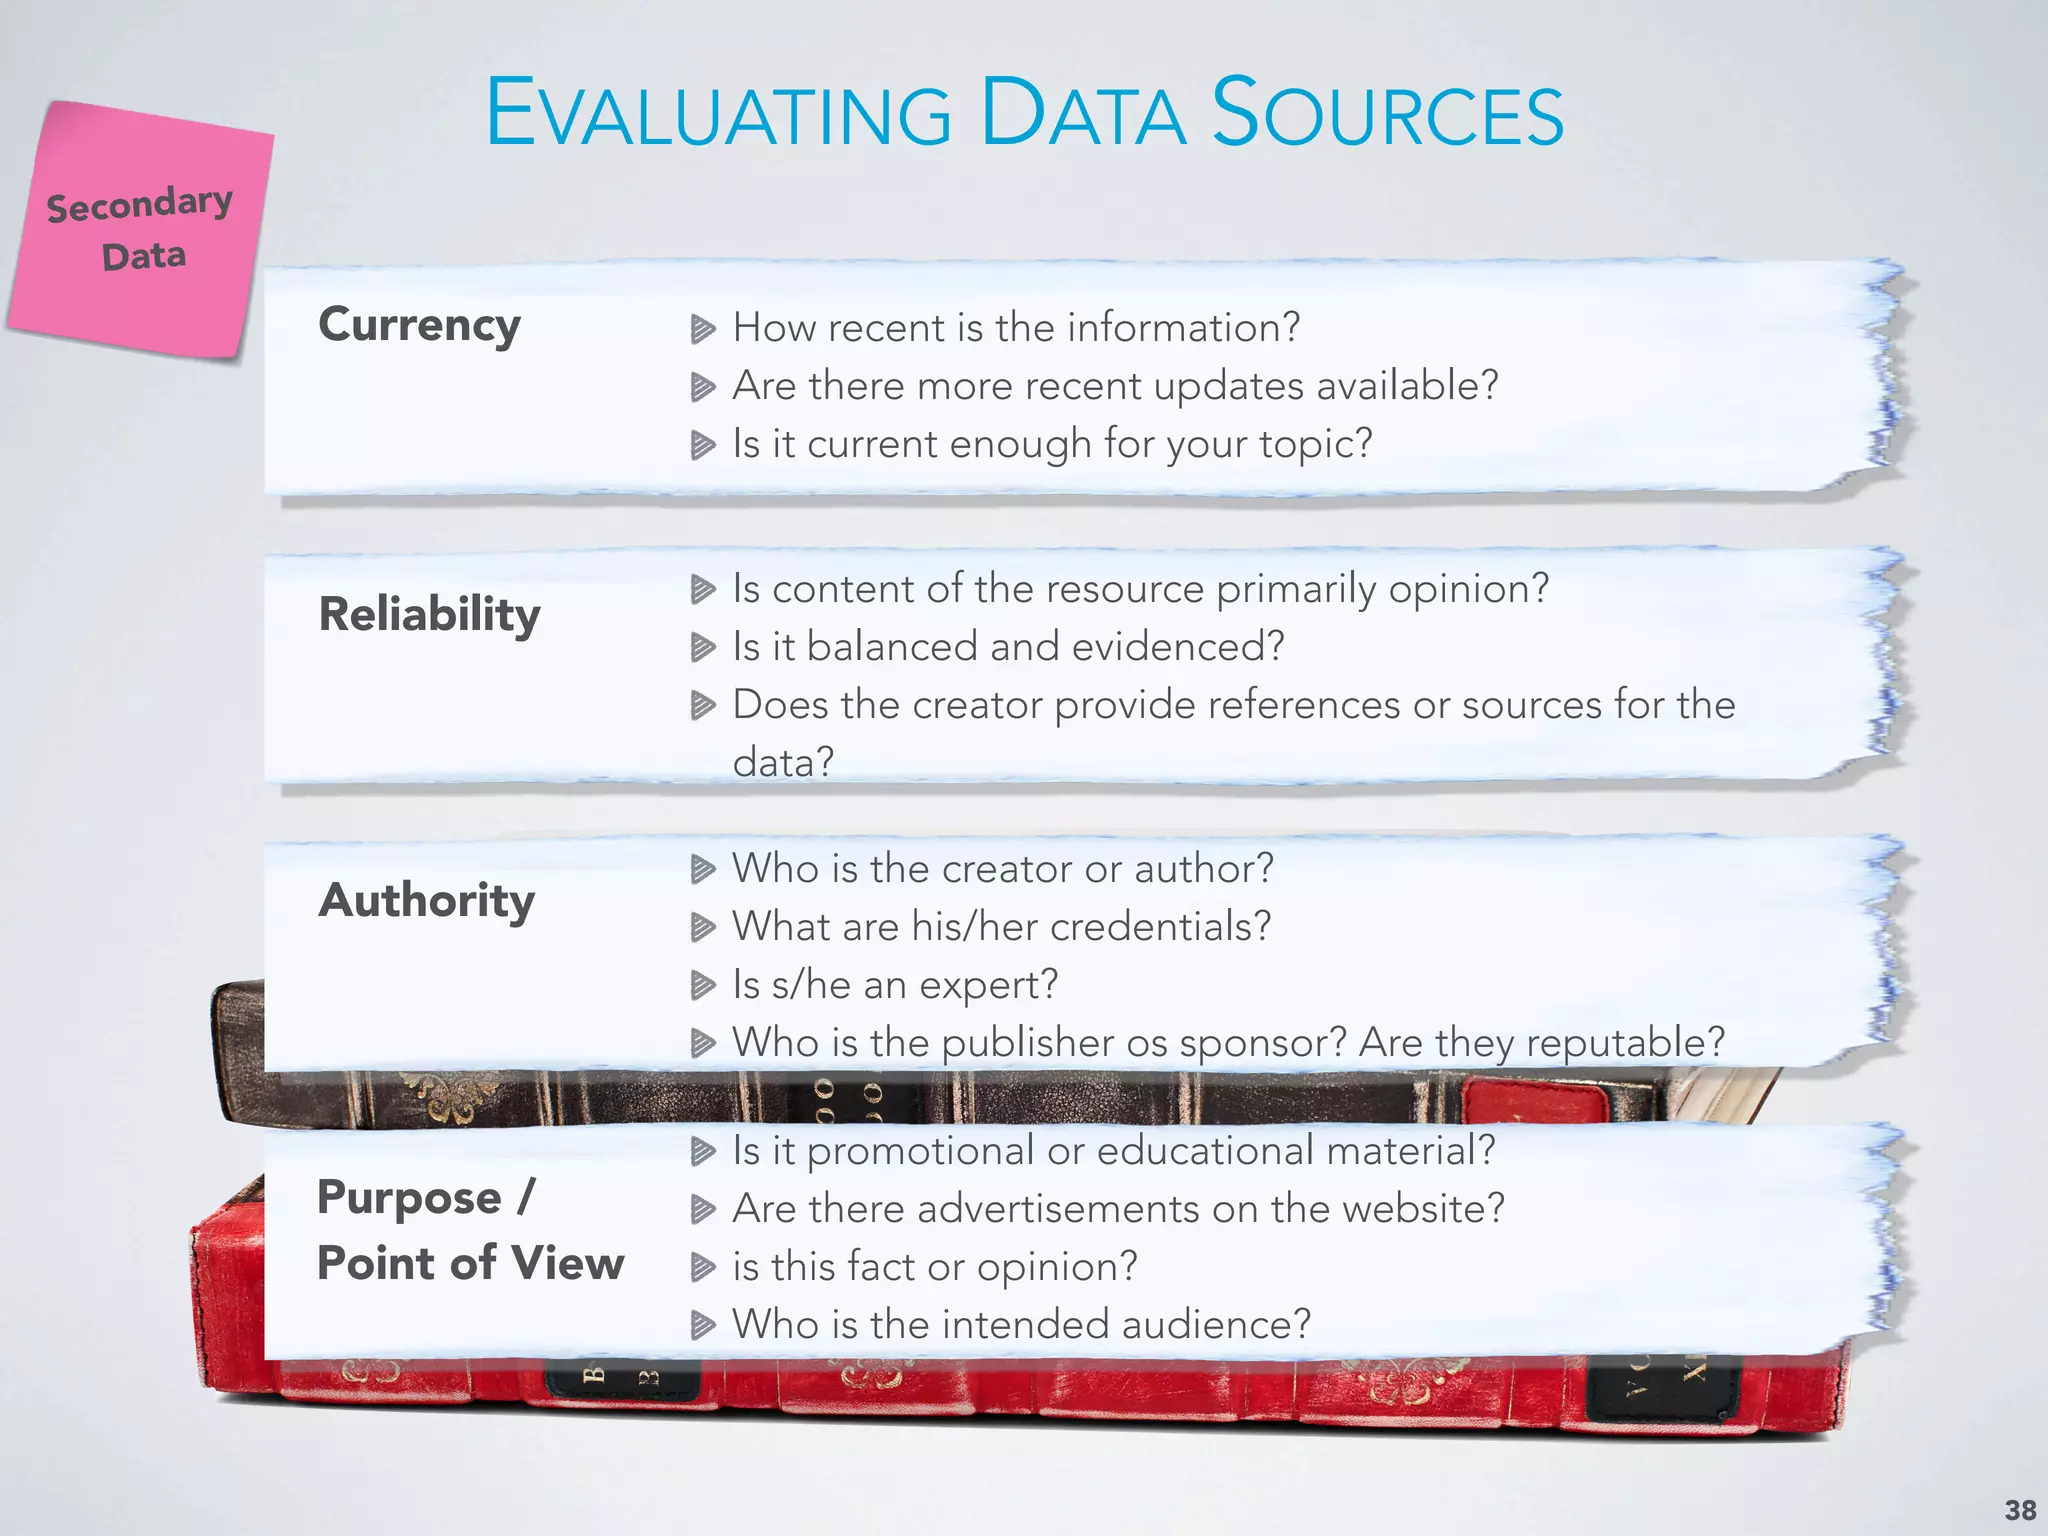
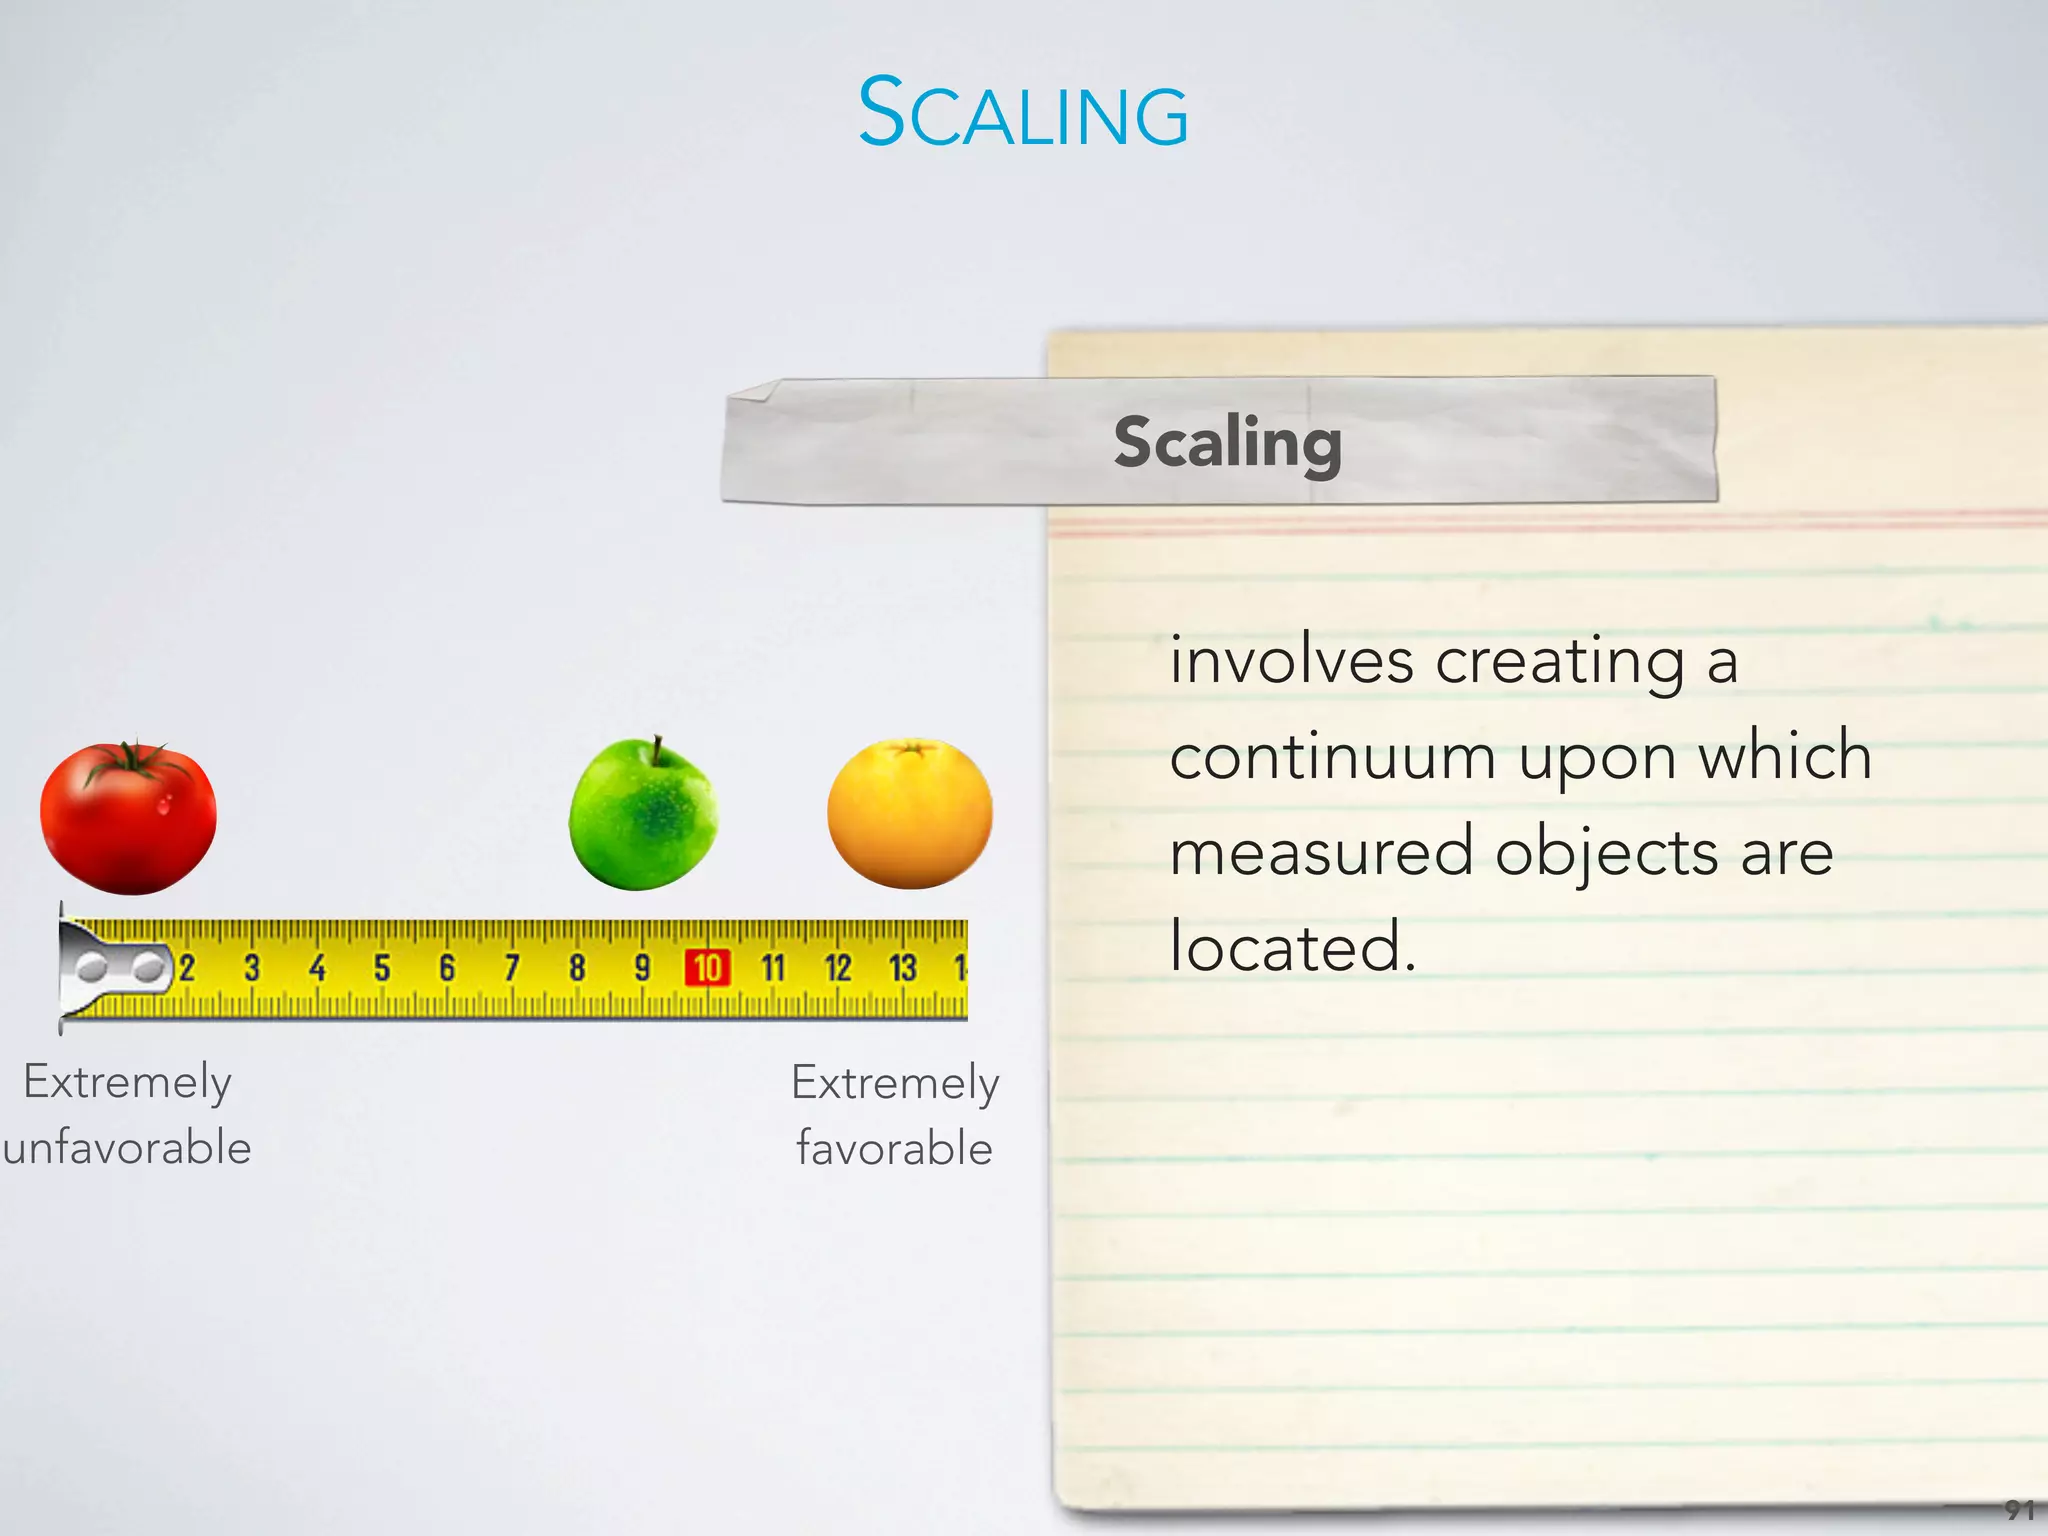
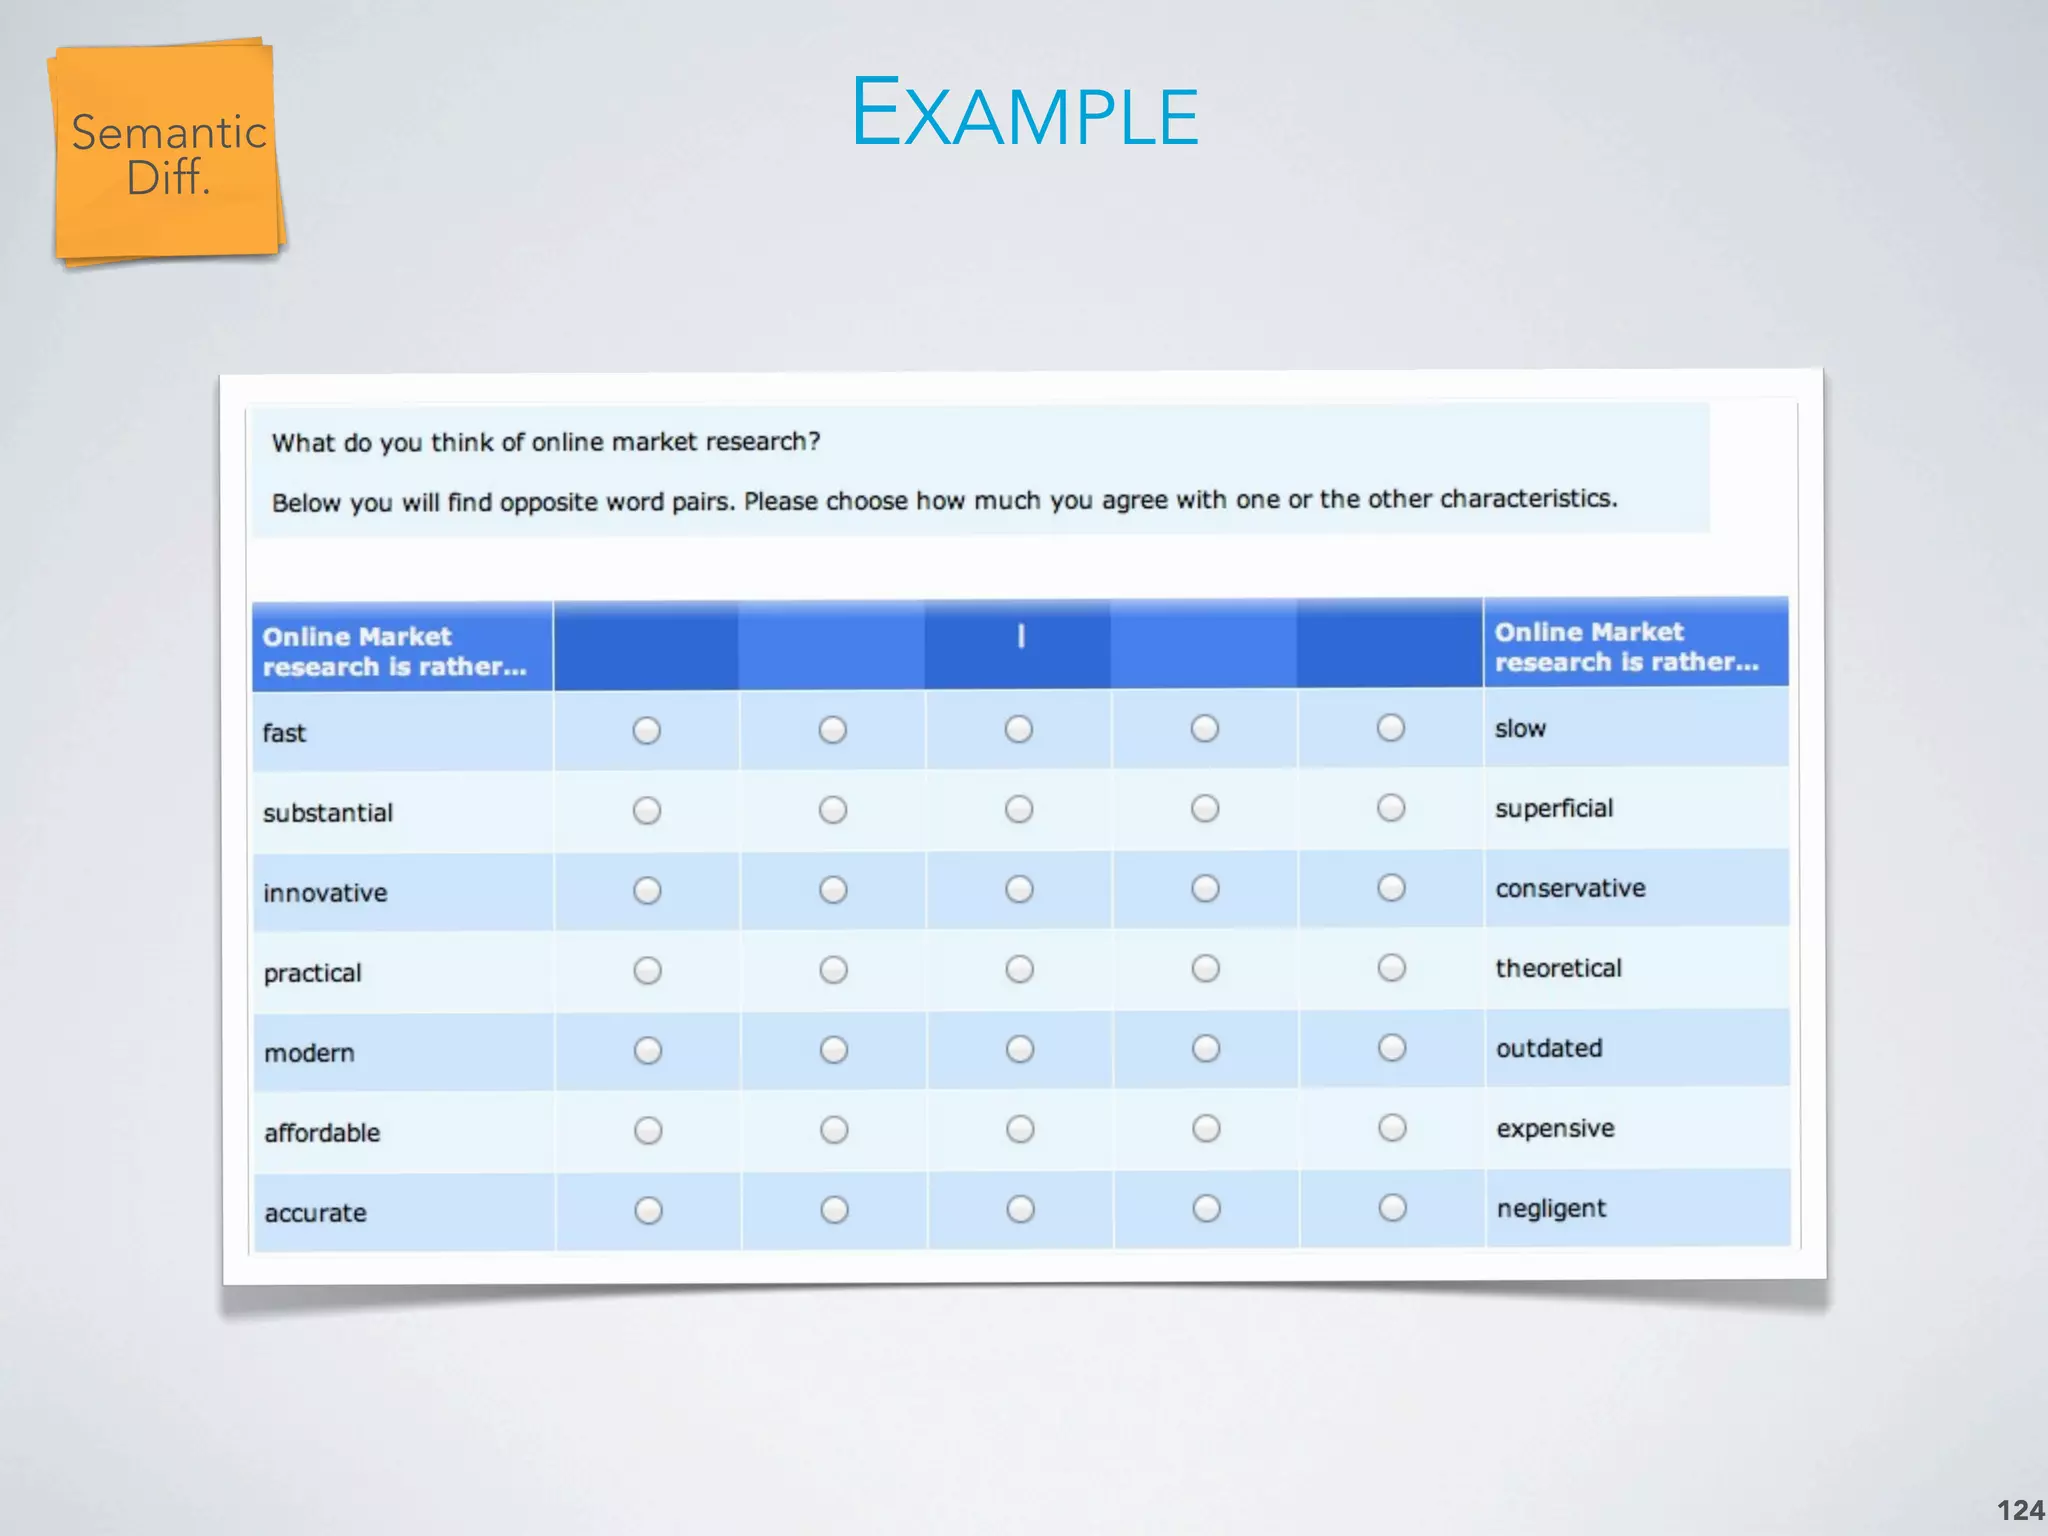
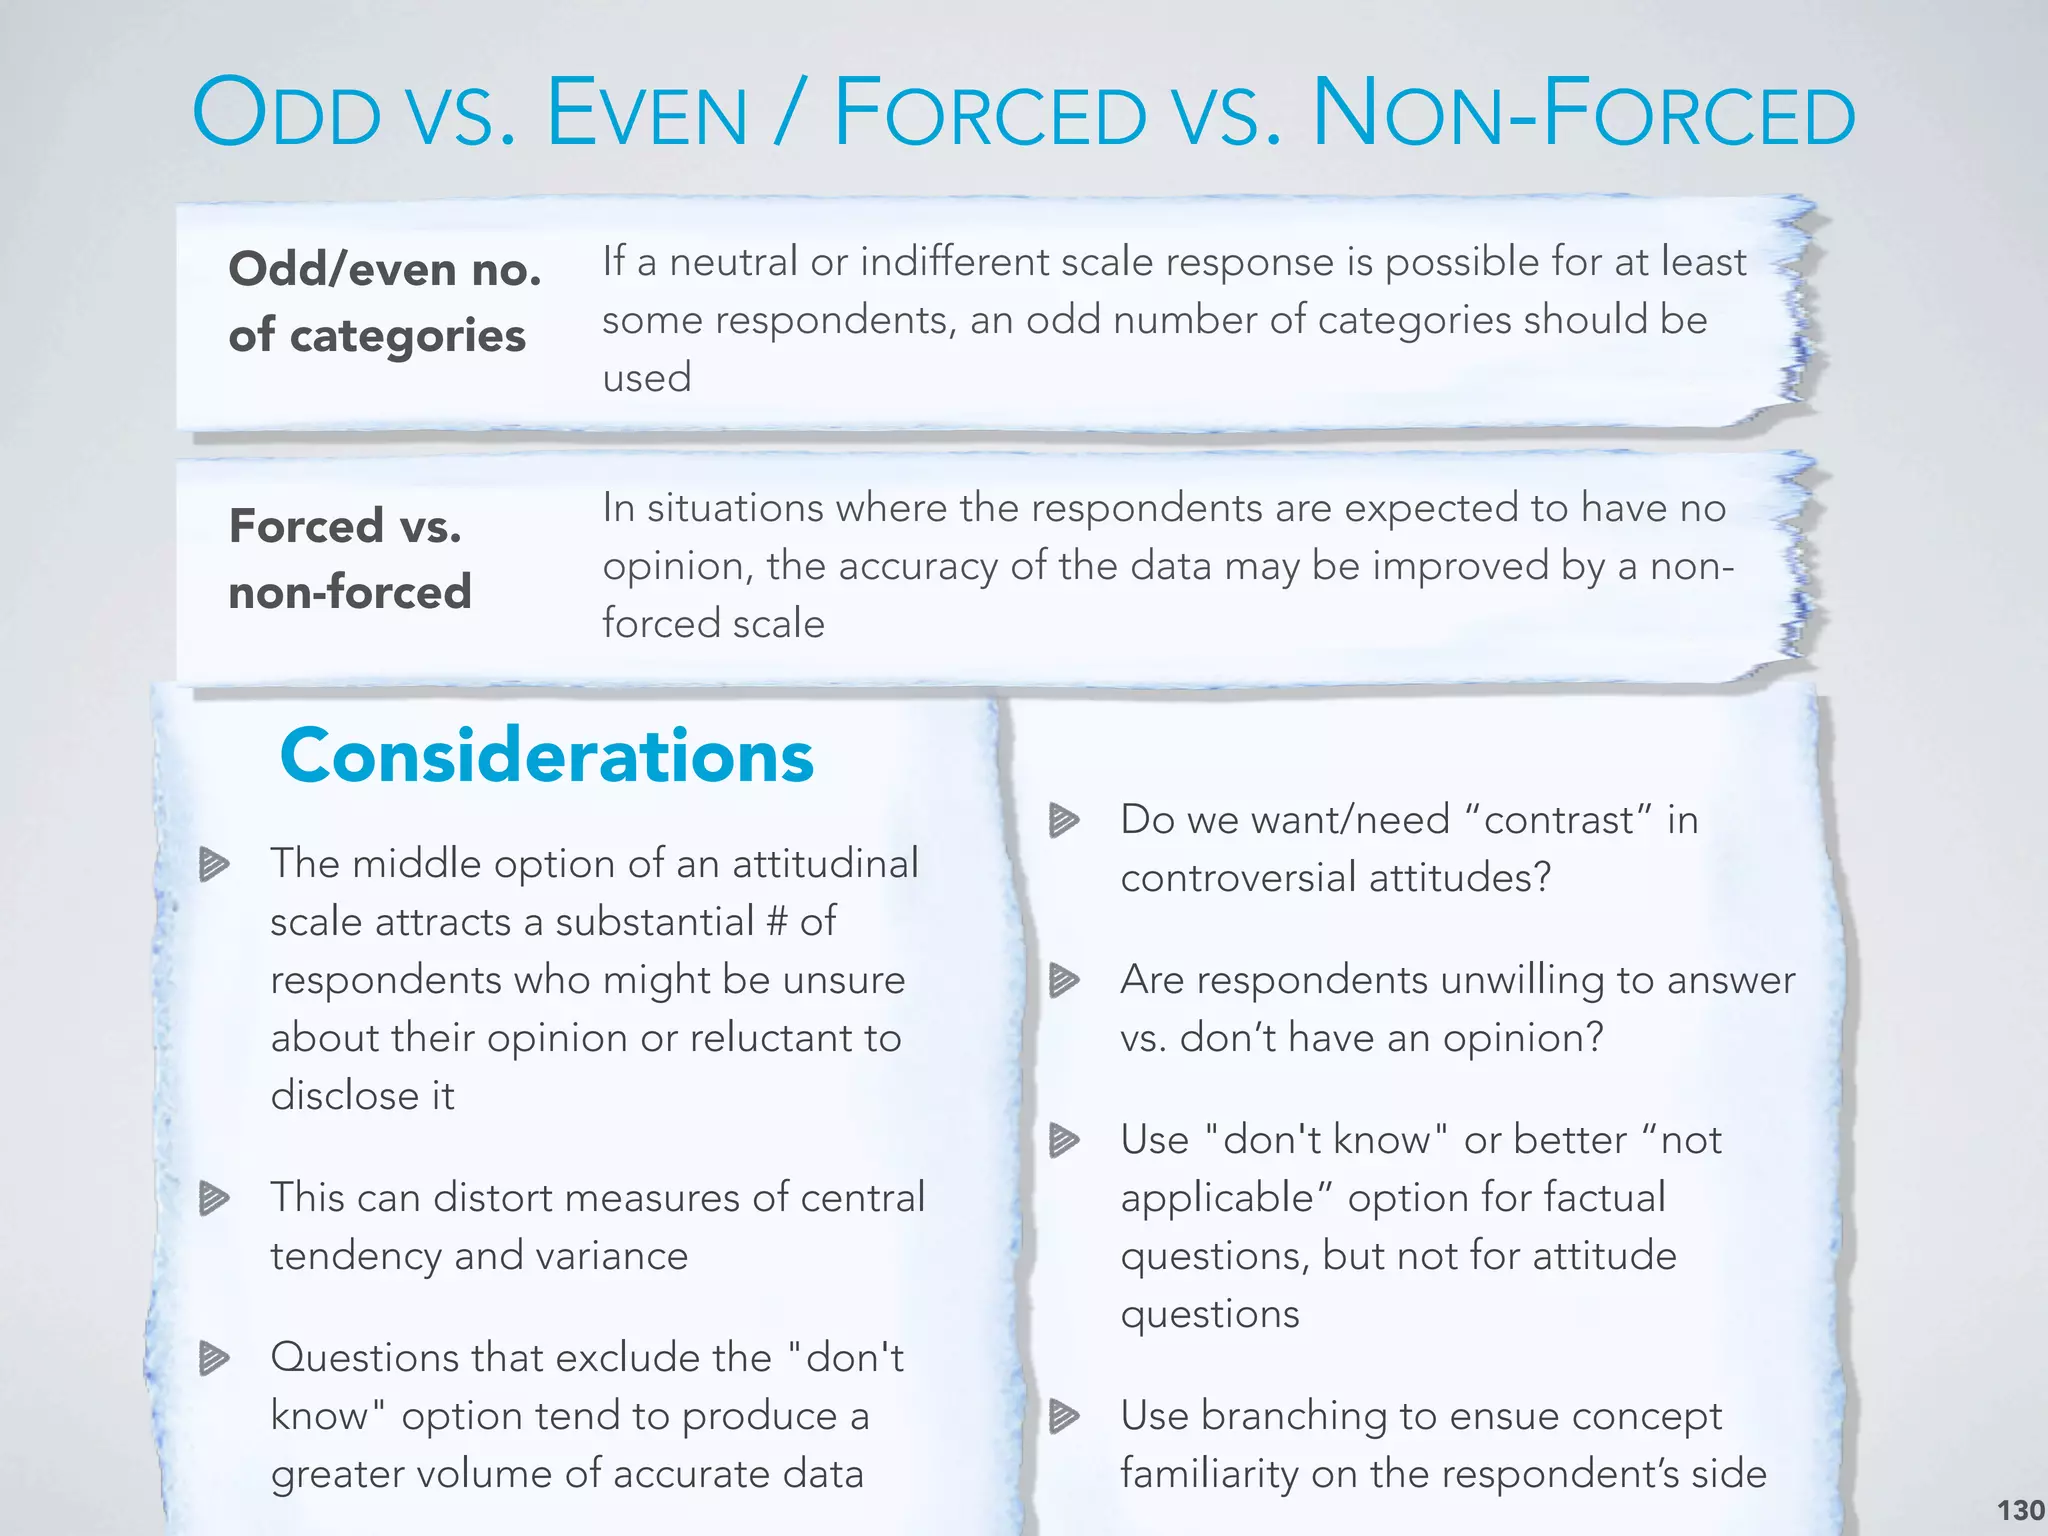
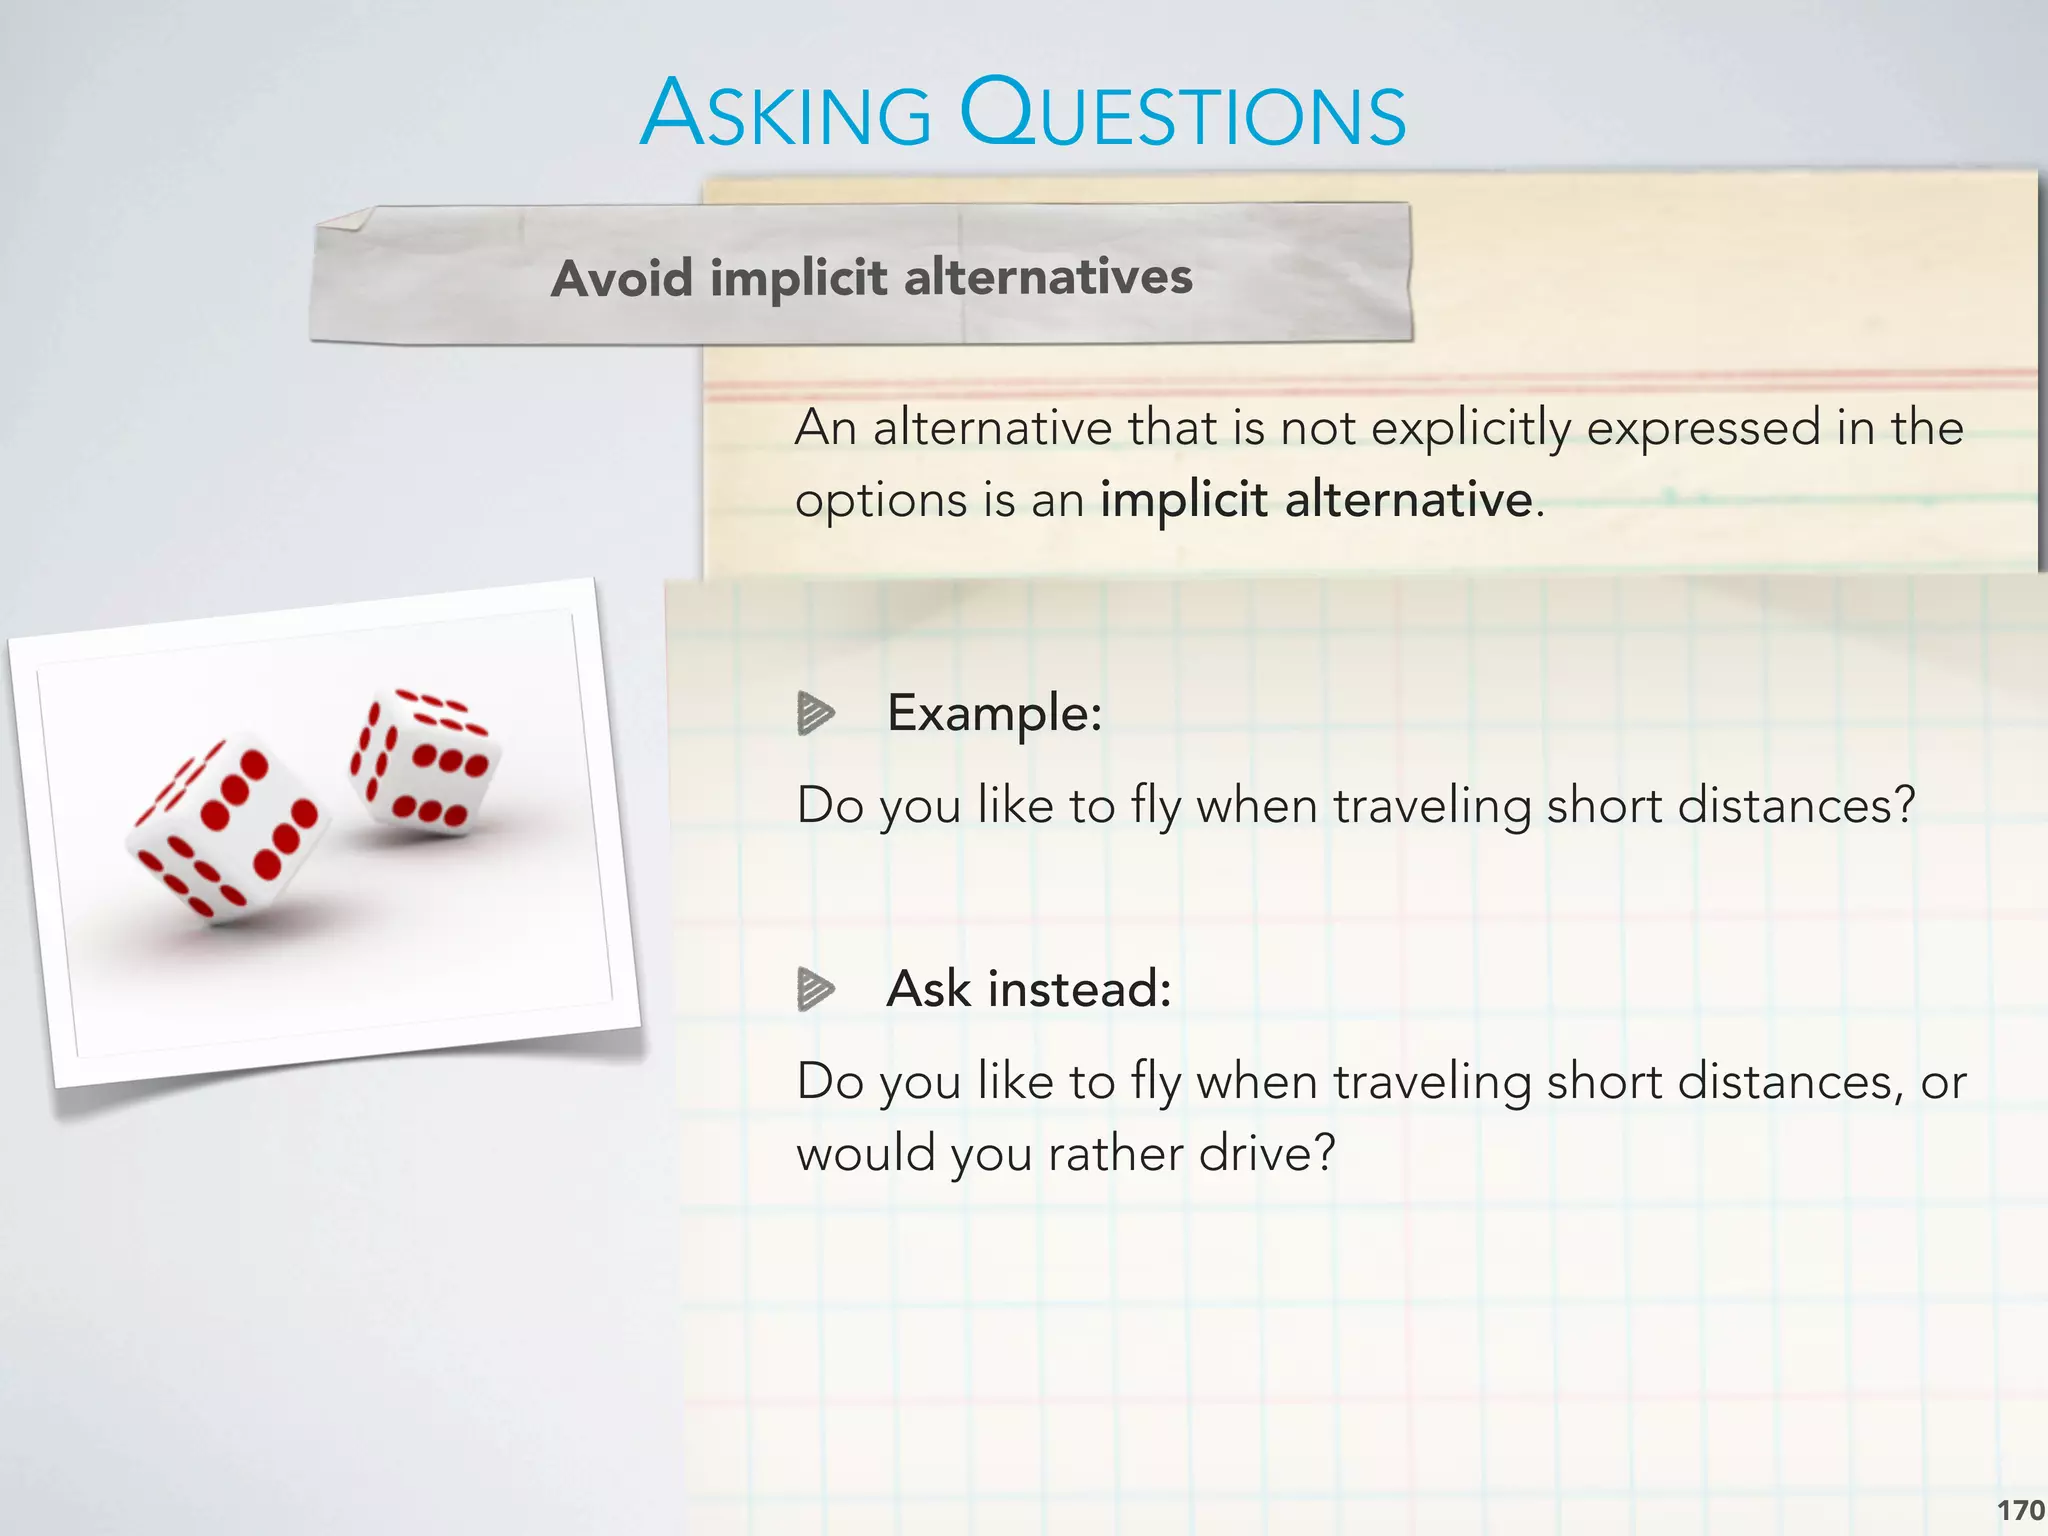
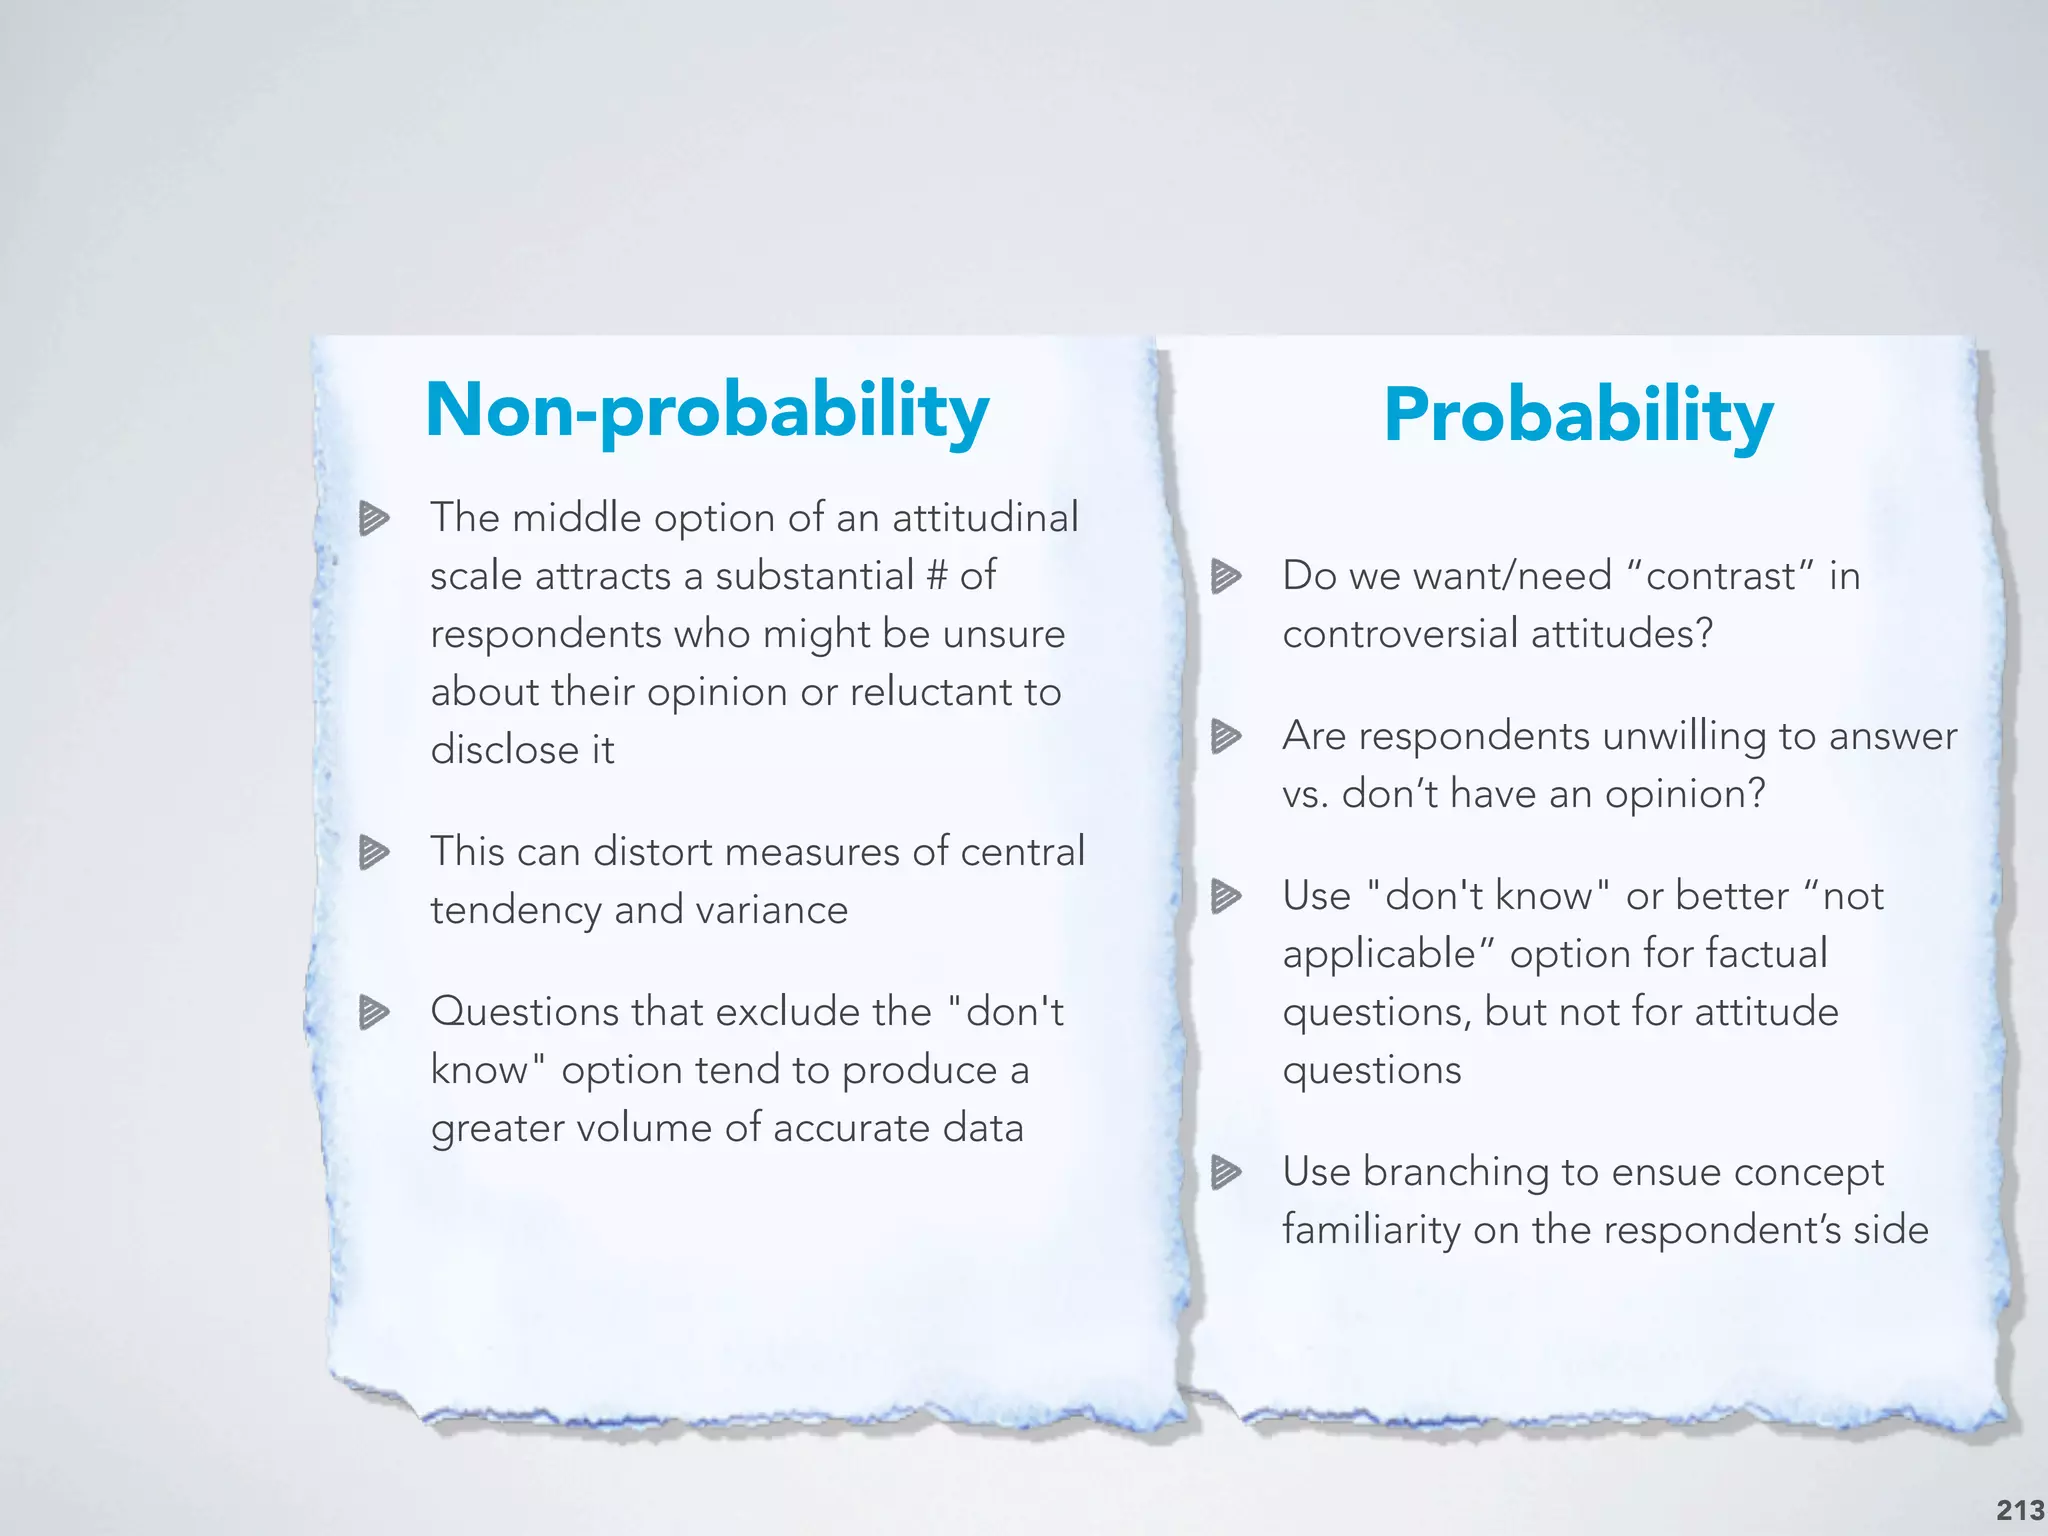
![A rating scale with end point associated with bipolar labels that have semantic meaning.
Respondents are to indicate how accurately or inaccurately each term describes the object.
ITEMIZED RATING SCALES: SEMANTIC DIFFERENTIAL
121
This part of the study measures what certain department stores mean to you by having you
judge them on a series of descriptive scales bounded at each end by one of two bipolar
adjectives. Please mark (X) the blank that best indicates how accurately one or the other
adjective describes what the store means to you. Please be sure to mark every scale; do not
omit any scale.
NOTE: The negative adjective sometimes appears at the left side of the scale and sometimes at the right. This controls the tendency of some respondents, particularly those
with very positive or very negative attitudes, to mark the right- or left-hand sides without reading the labels.
Powerful [ ] [ ] [ ] [ ] [X] [ ] [ ] Weak
Unreliable [ ] [ ] [ ] [ ] [ ] [X] [ ] Reliable
Modern [ ] [ ] [ ] [ ] [ ] [ ] [X] Old fashioned
Cold [ ] [ ] [ ] [ ] [ ] [X] [ ] Warm
Careful [ ] [X] [ ] [ ] [ ] [ ] [ ] Careless
Sears is:](https://image.slidesharecdn.com/marketresearchbypaulmarx-121101082001-phpapp02/75/Market-Research-course-slides-121-2048.jpg)
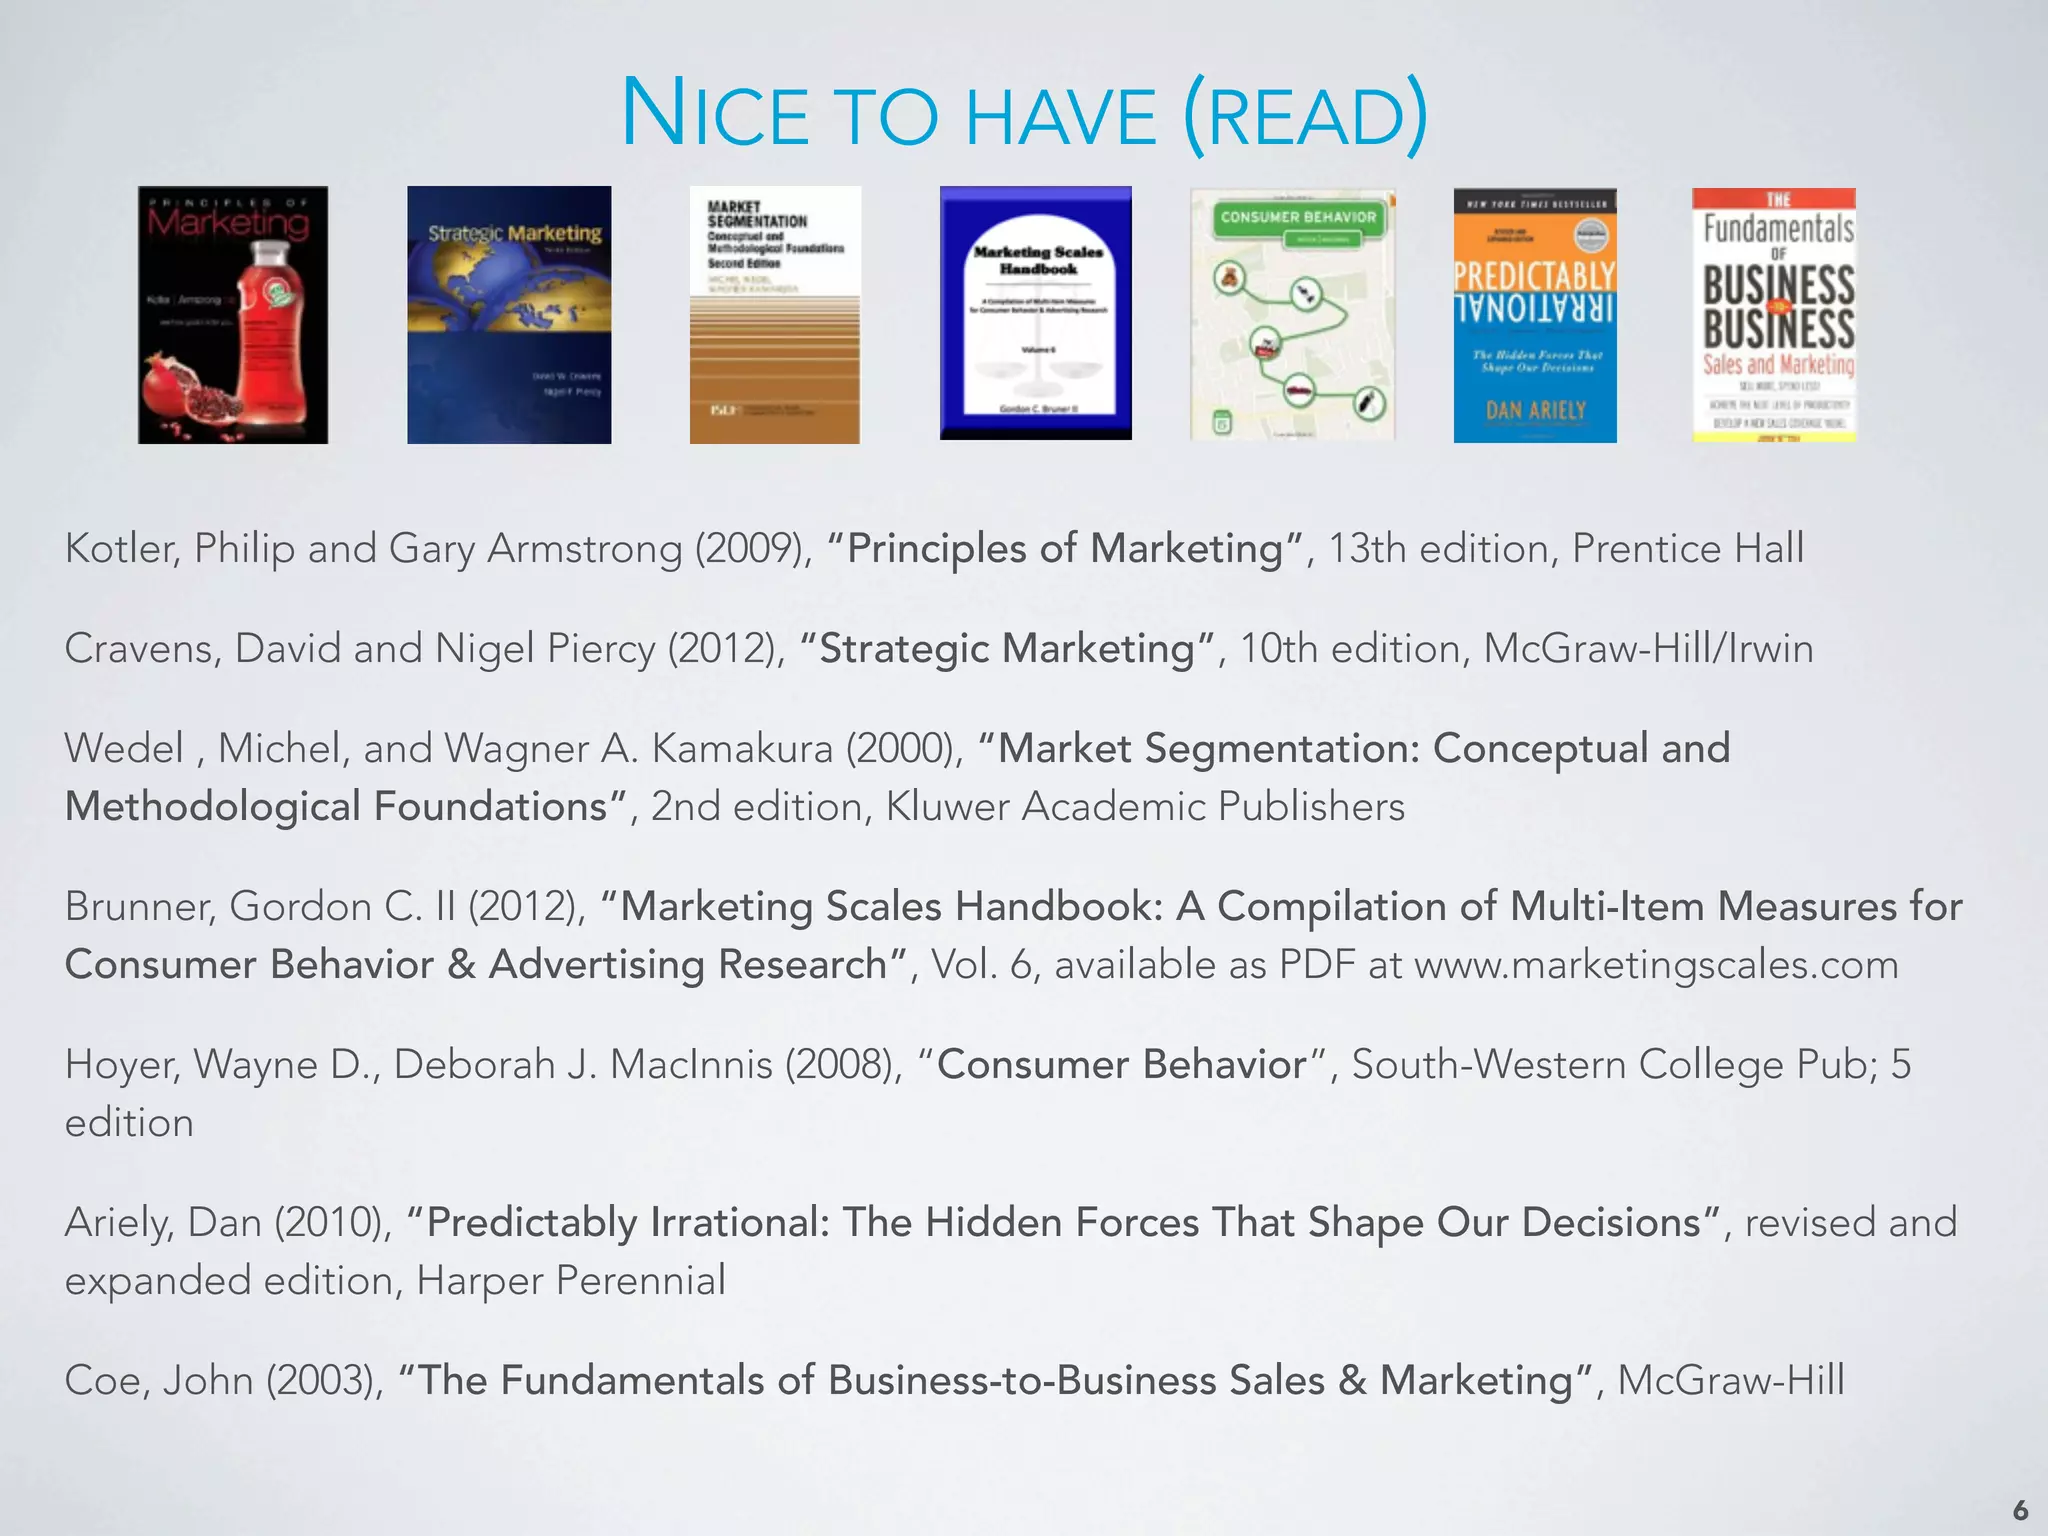
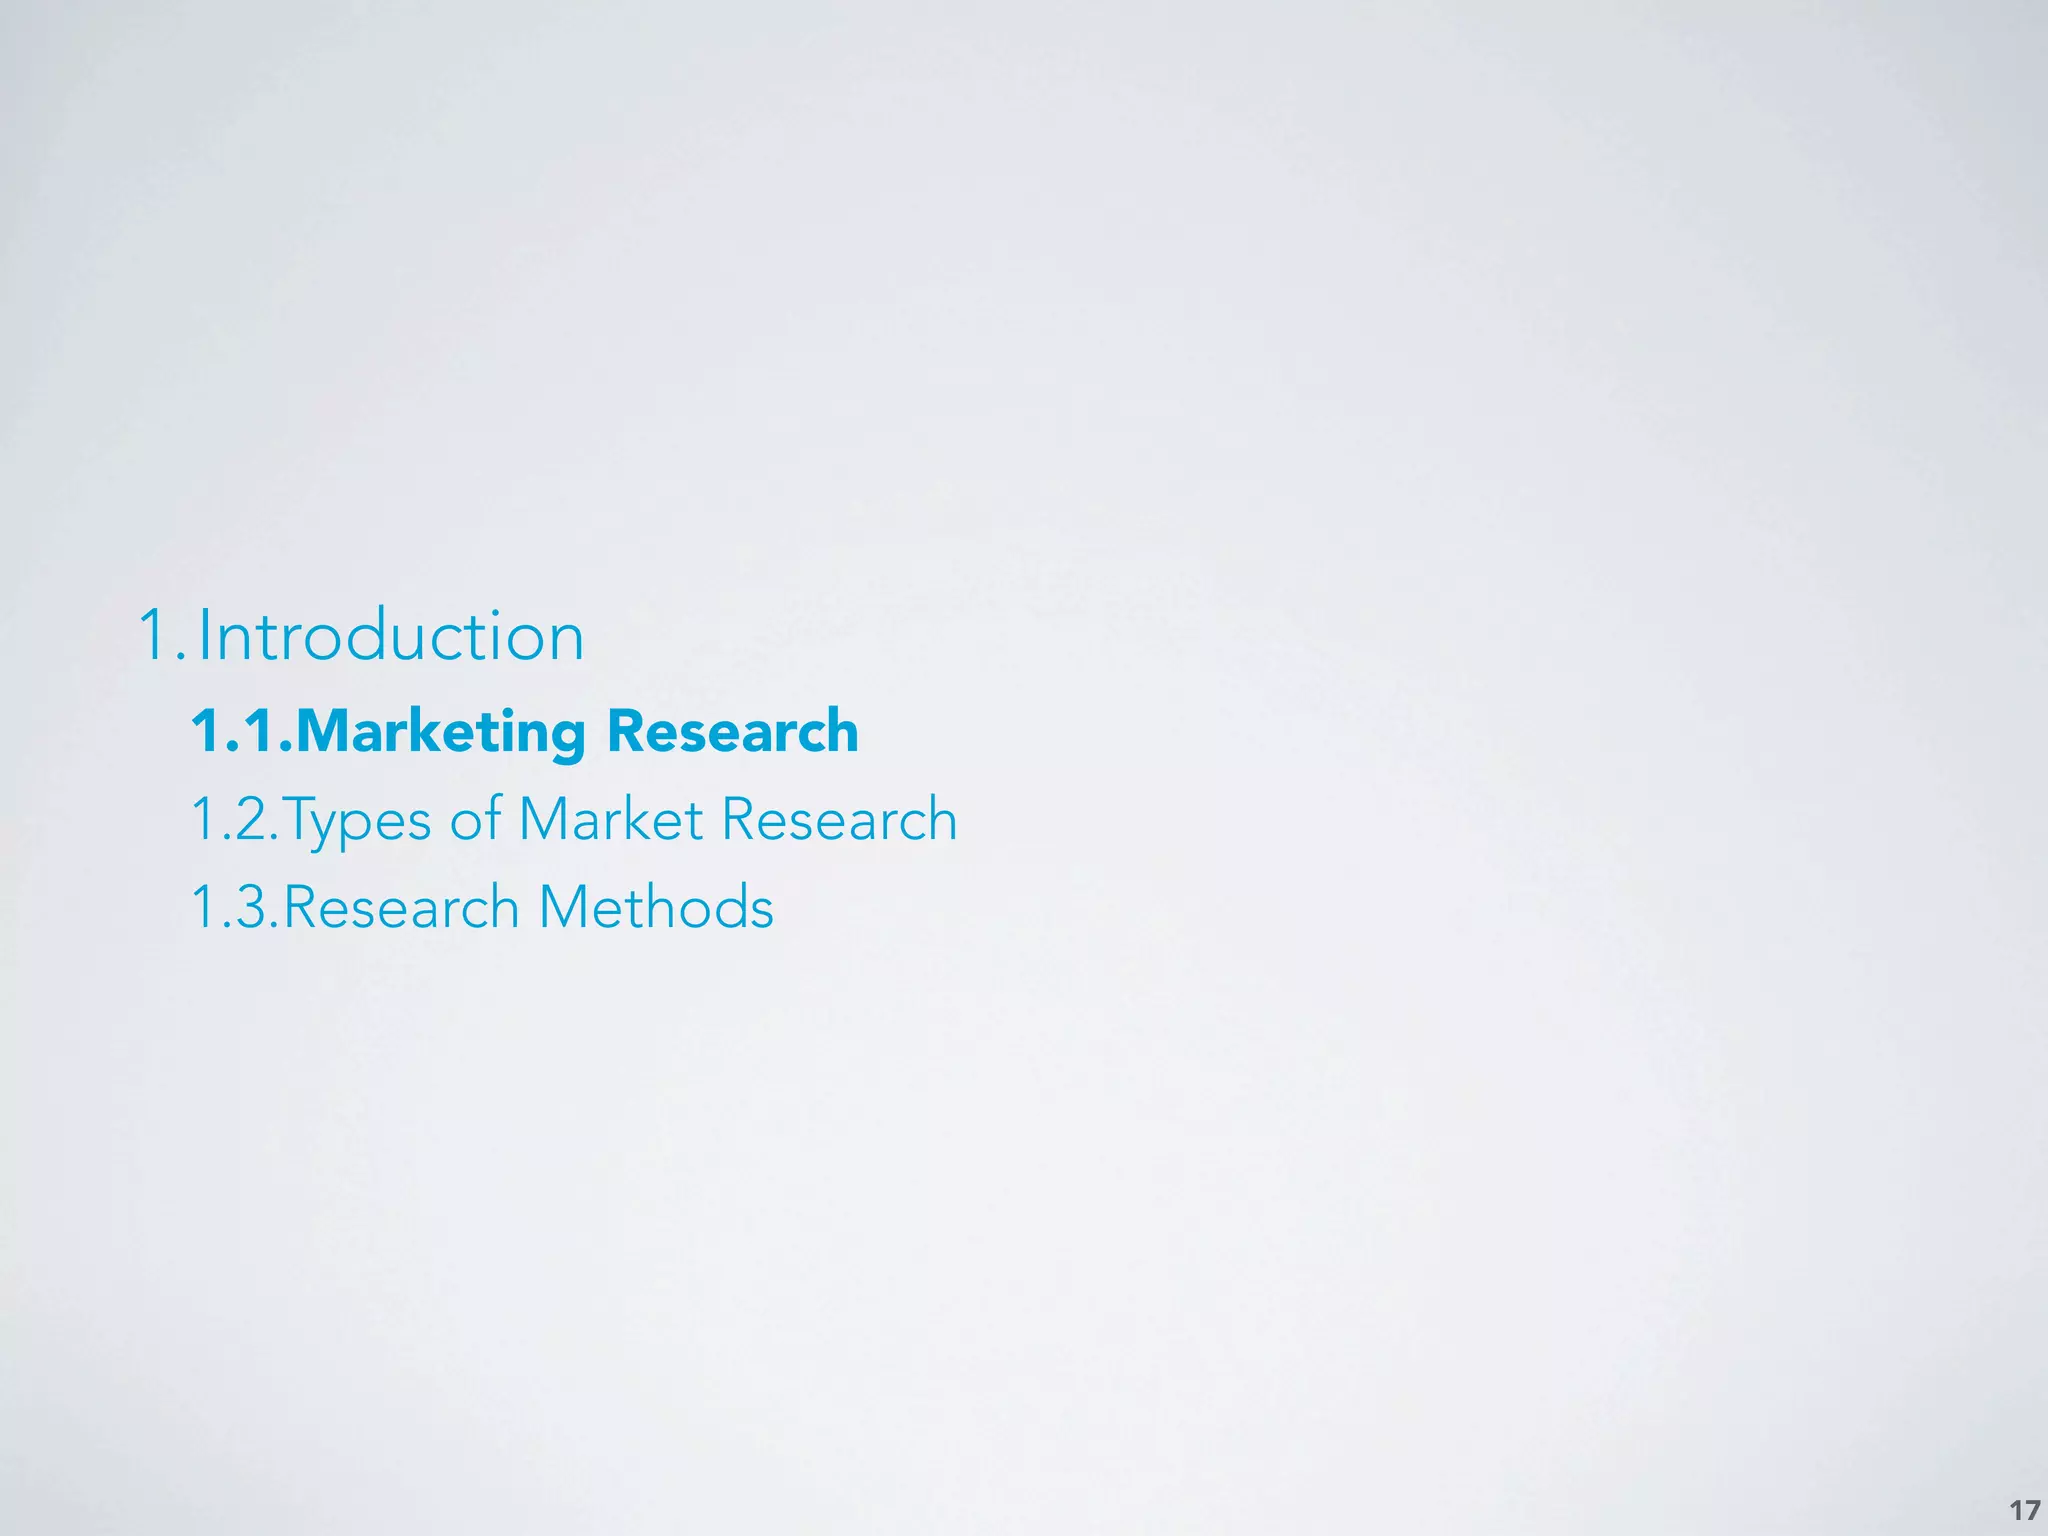
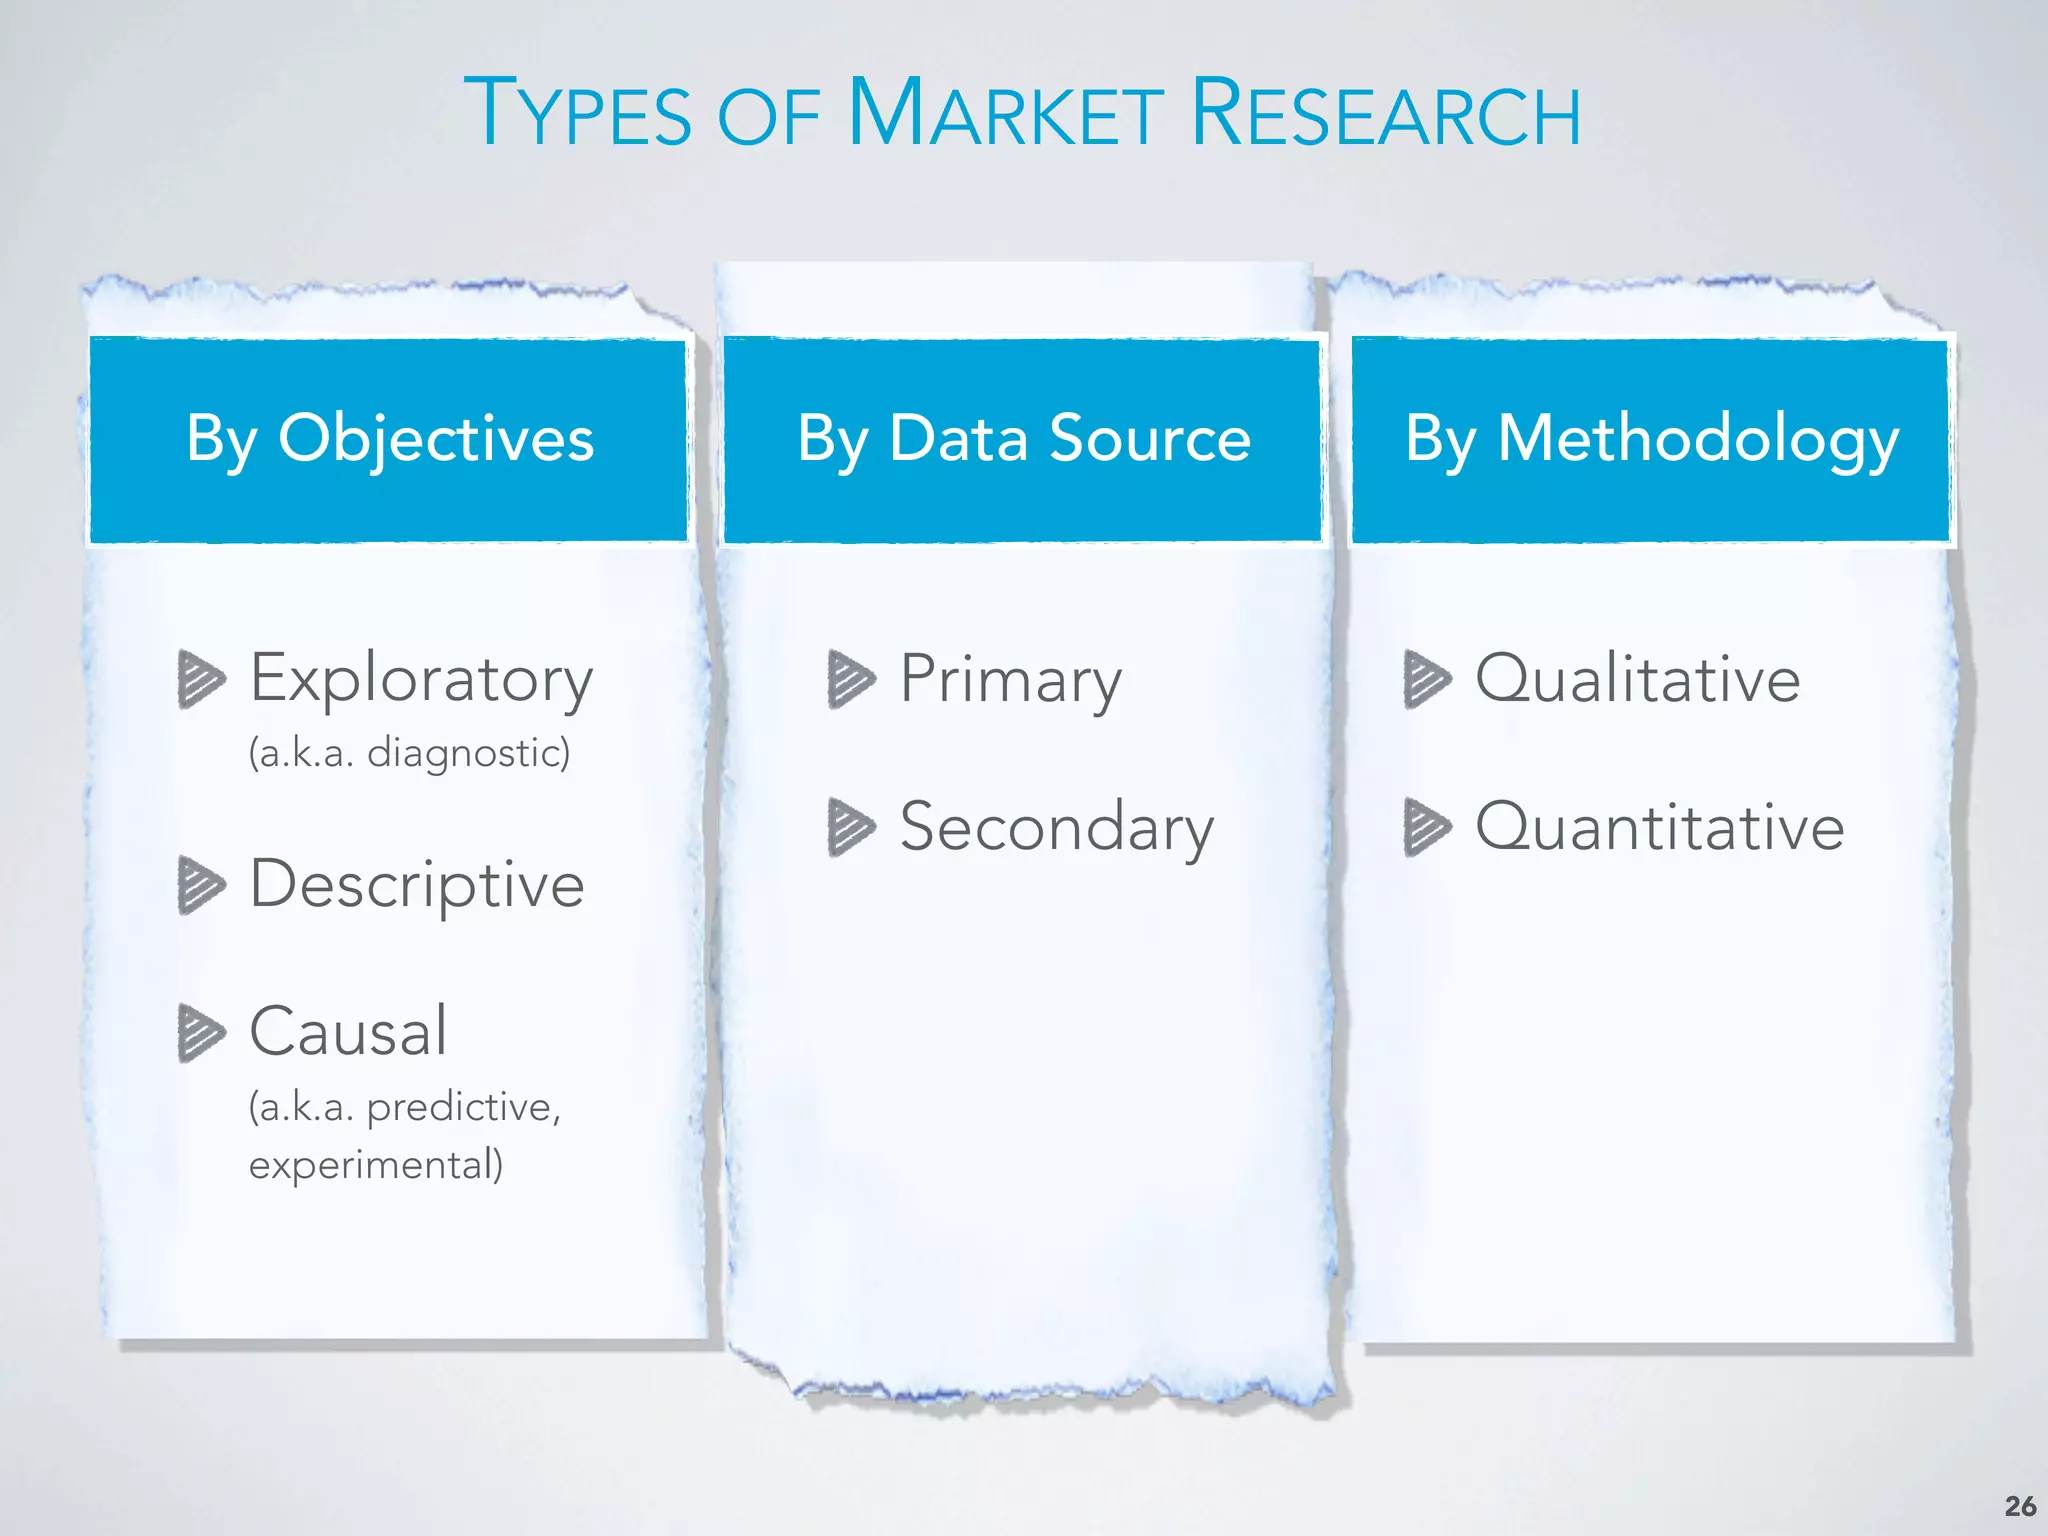
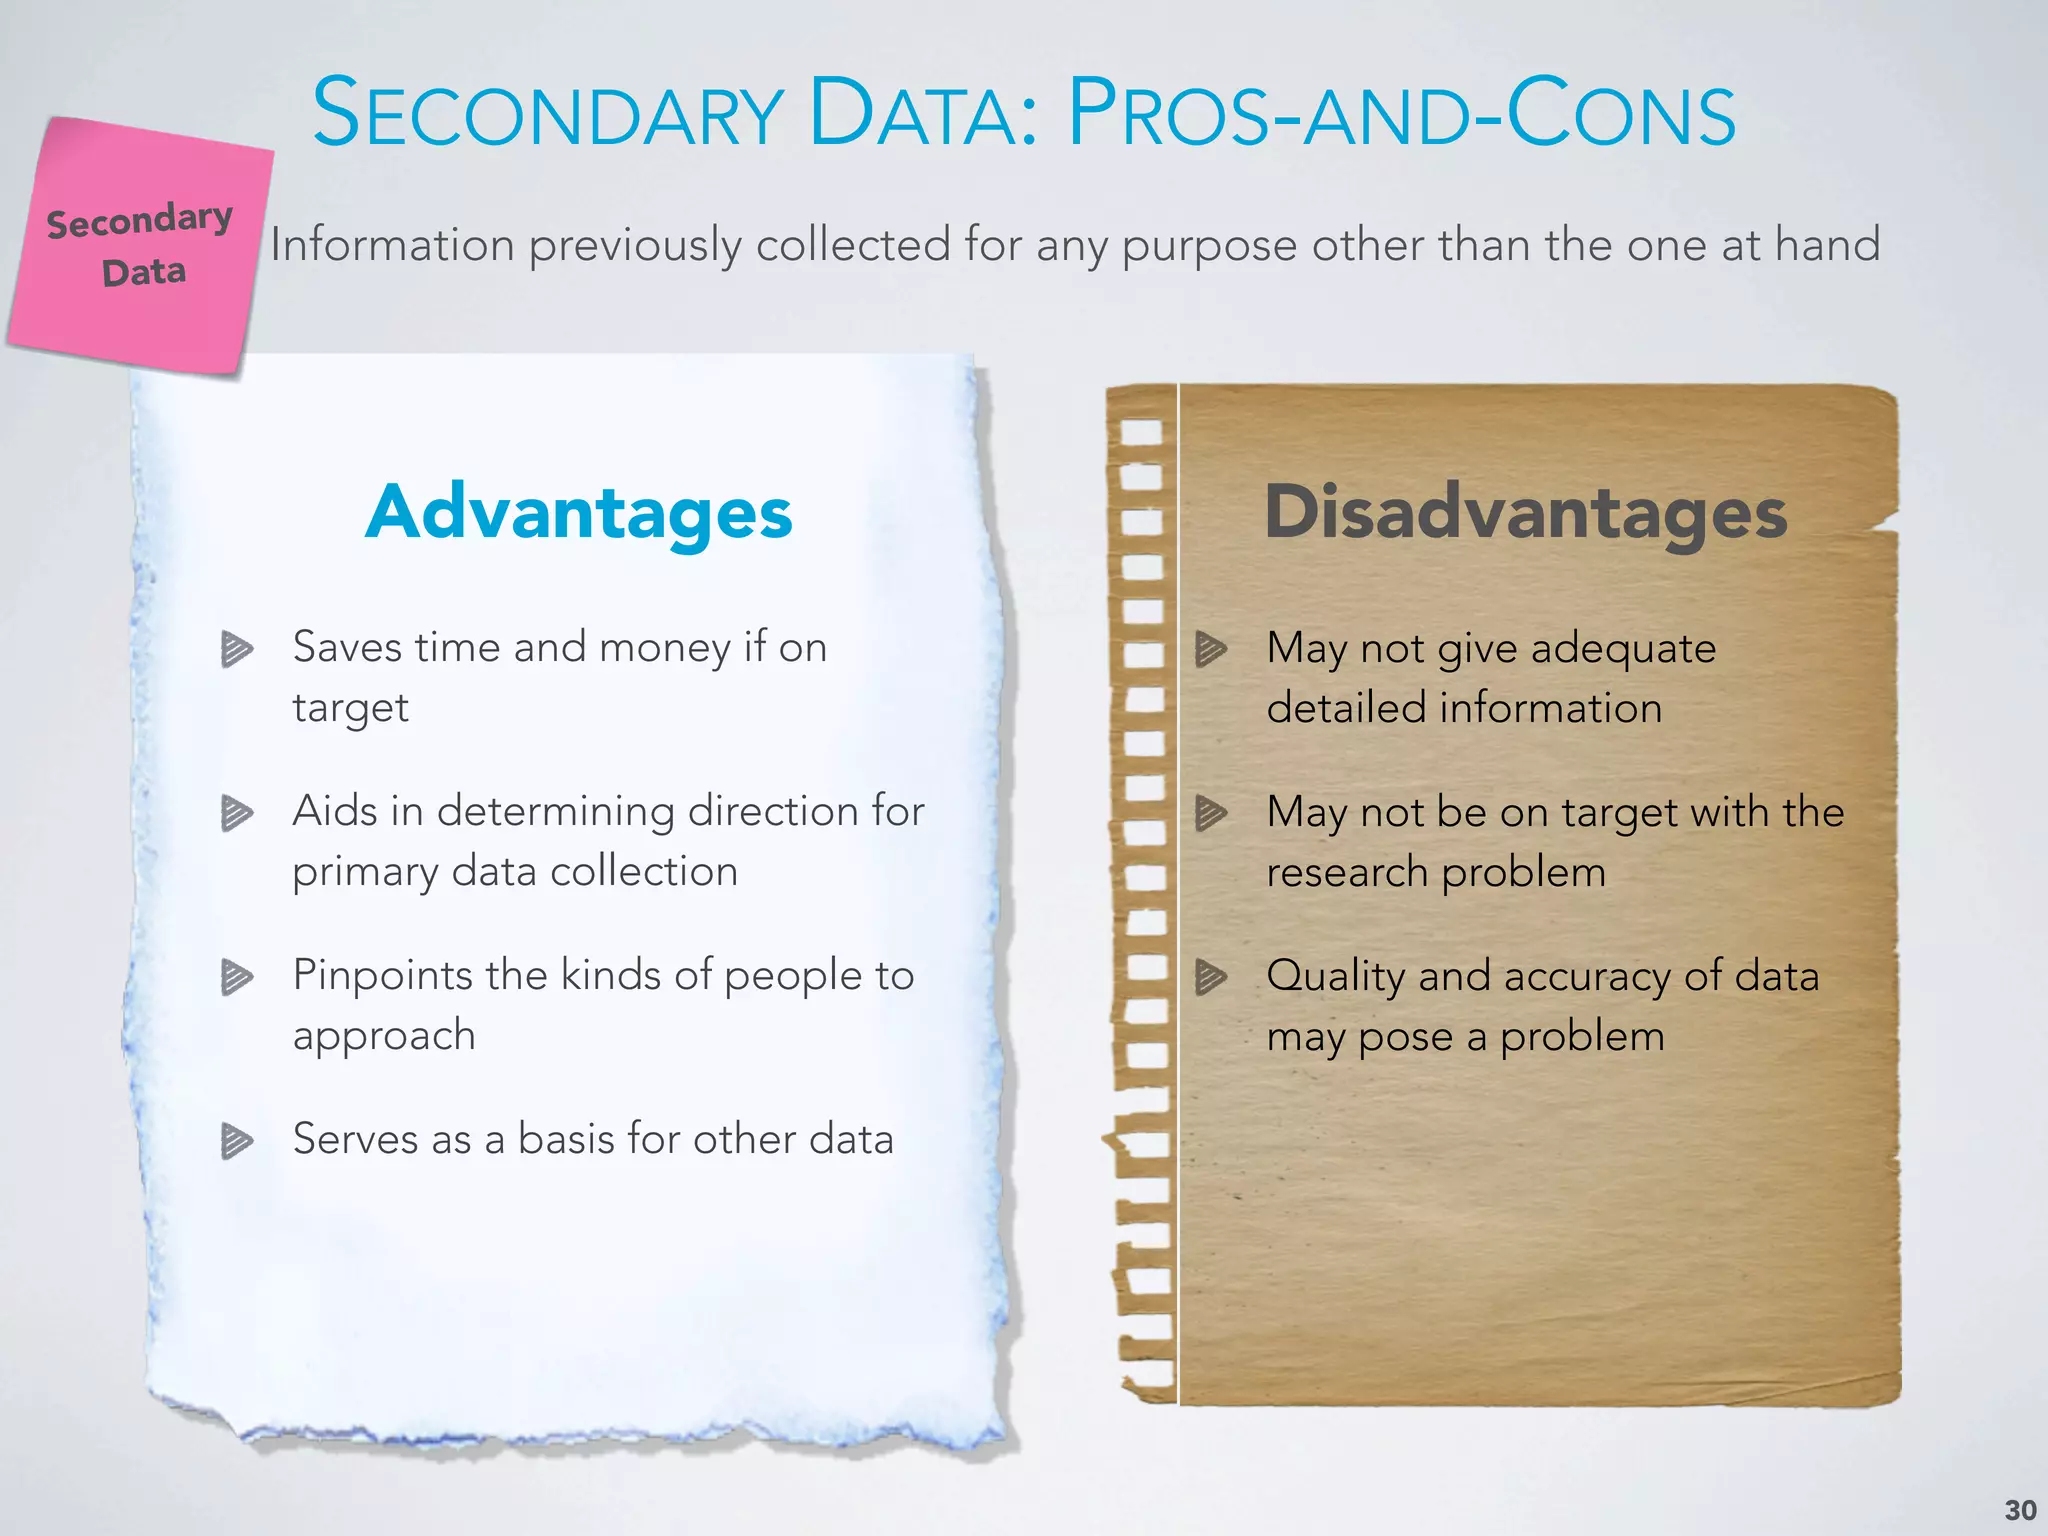
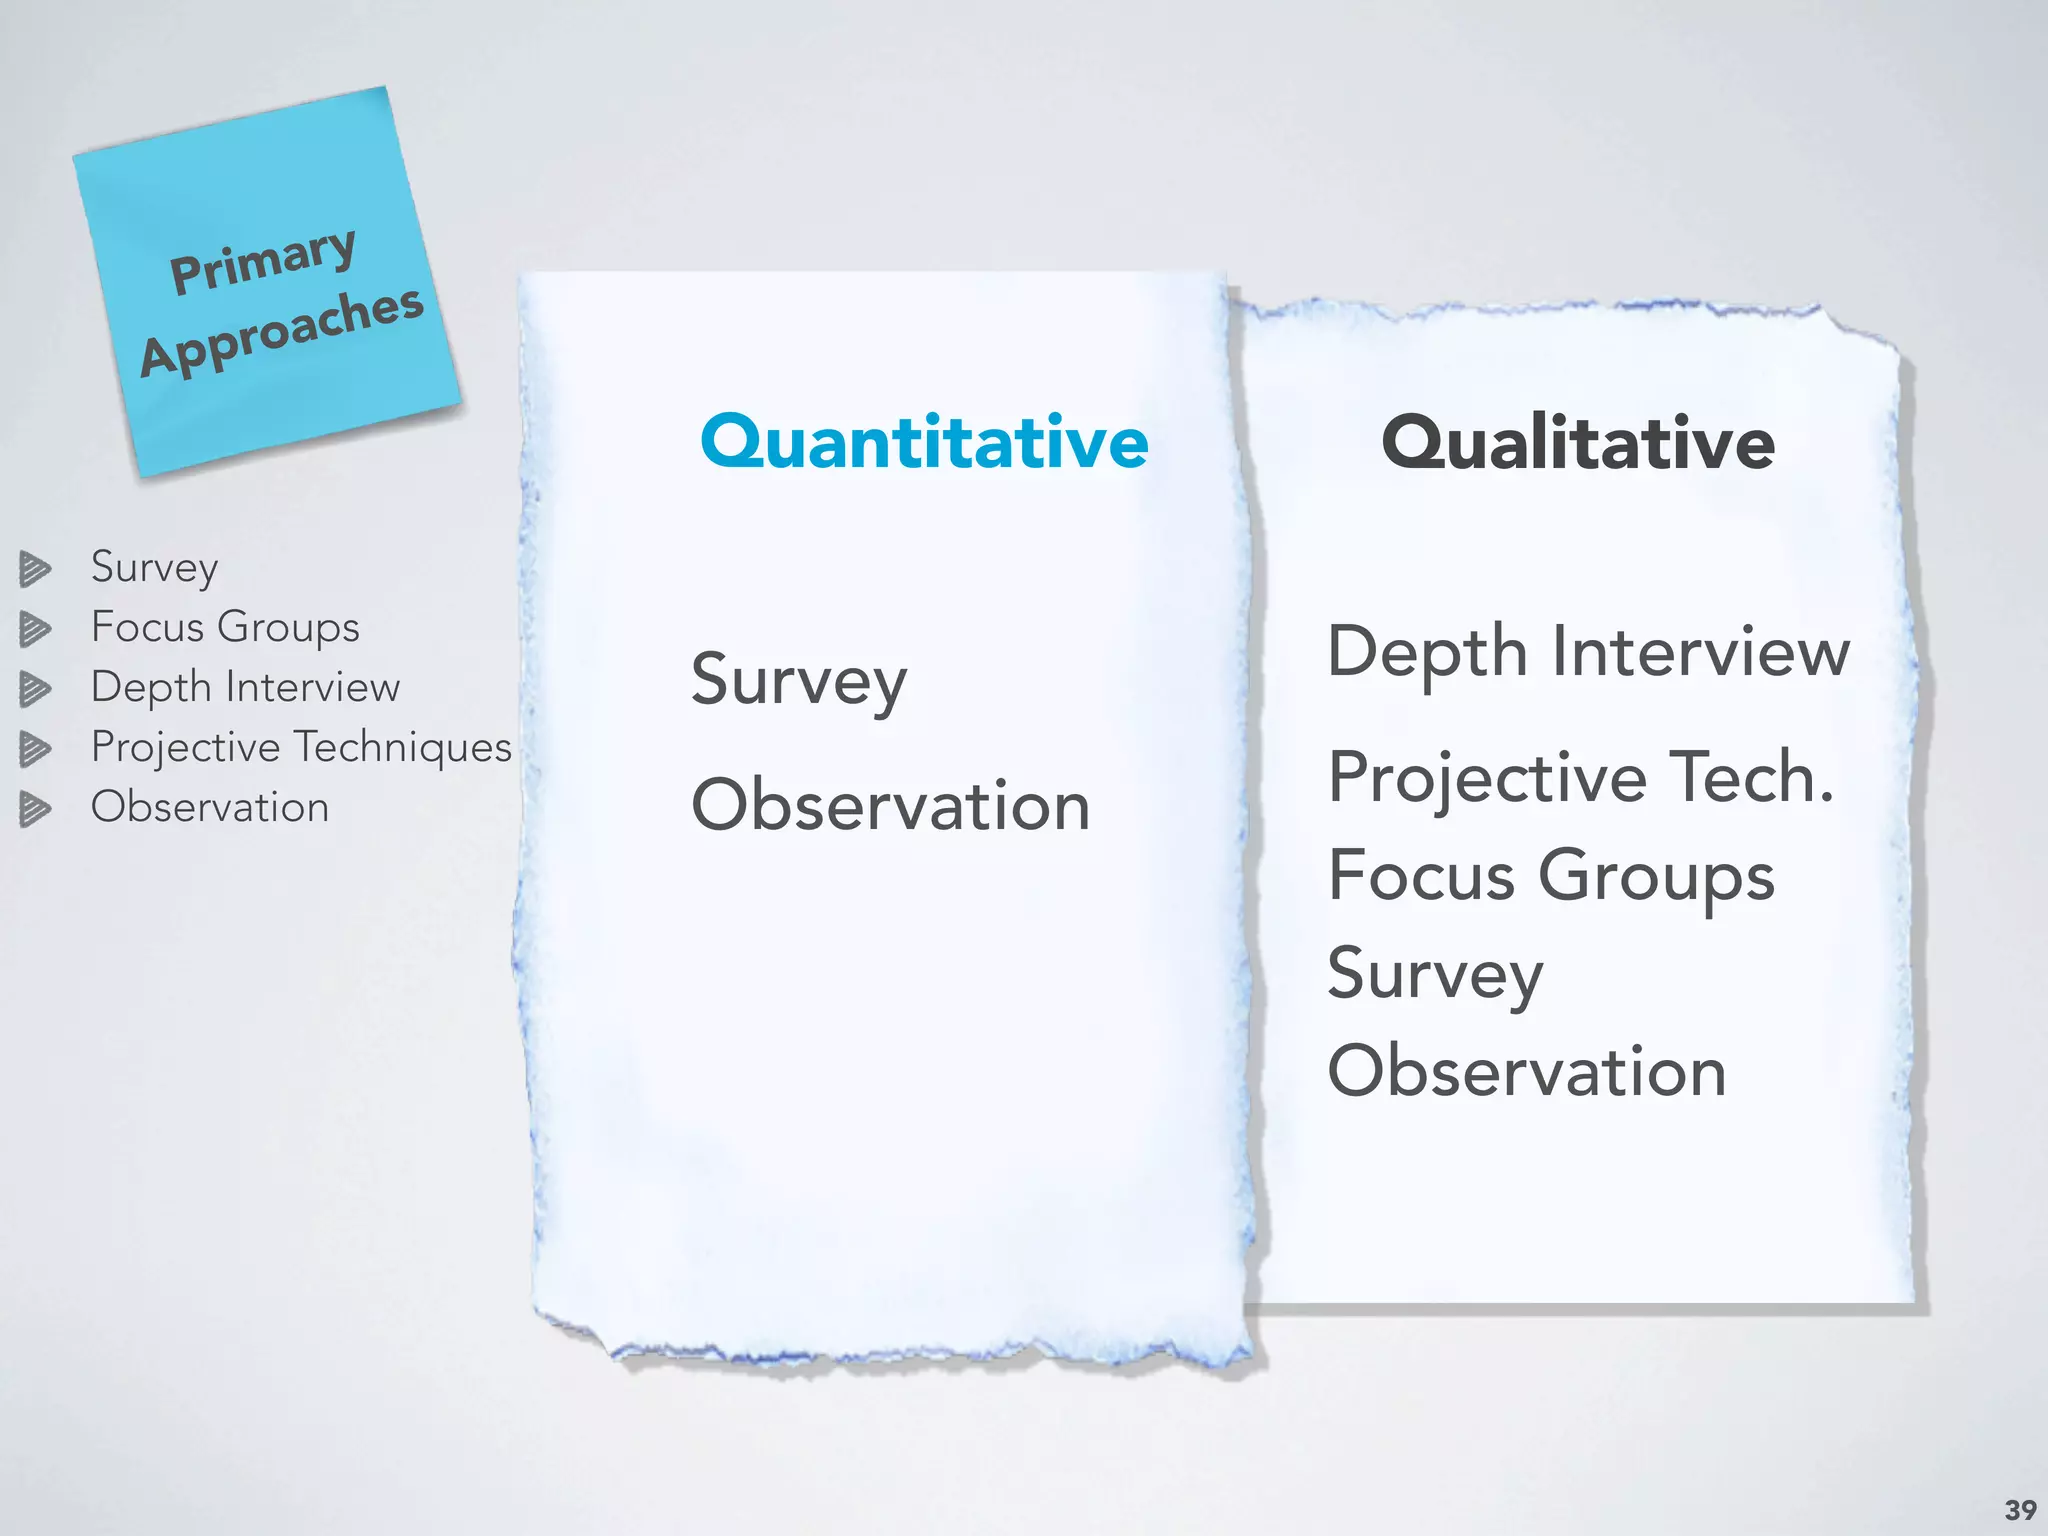
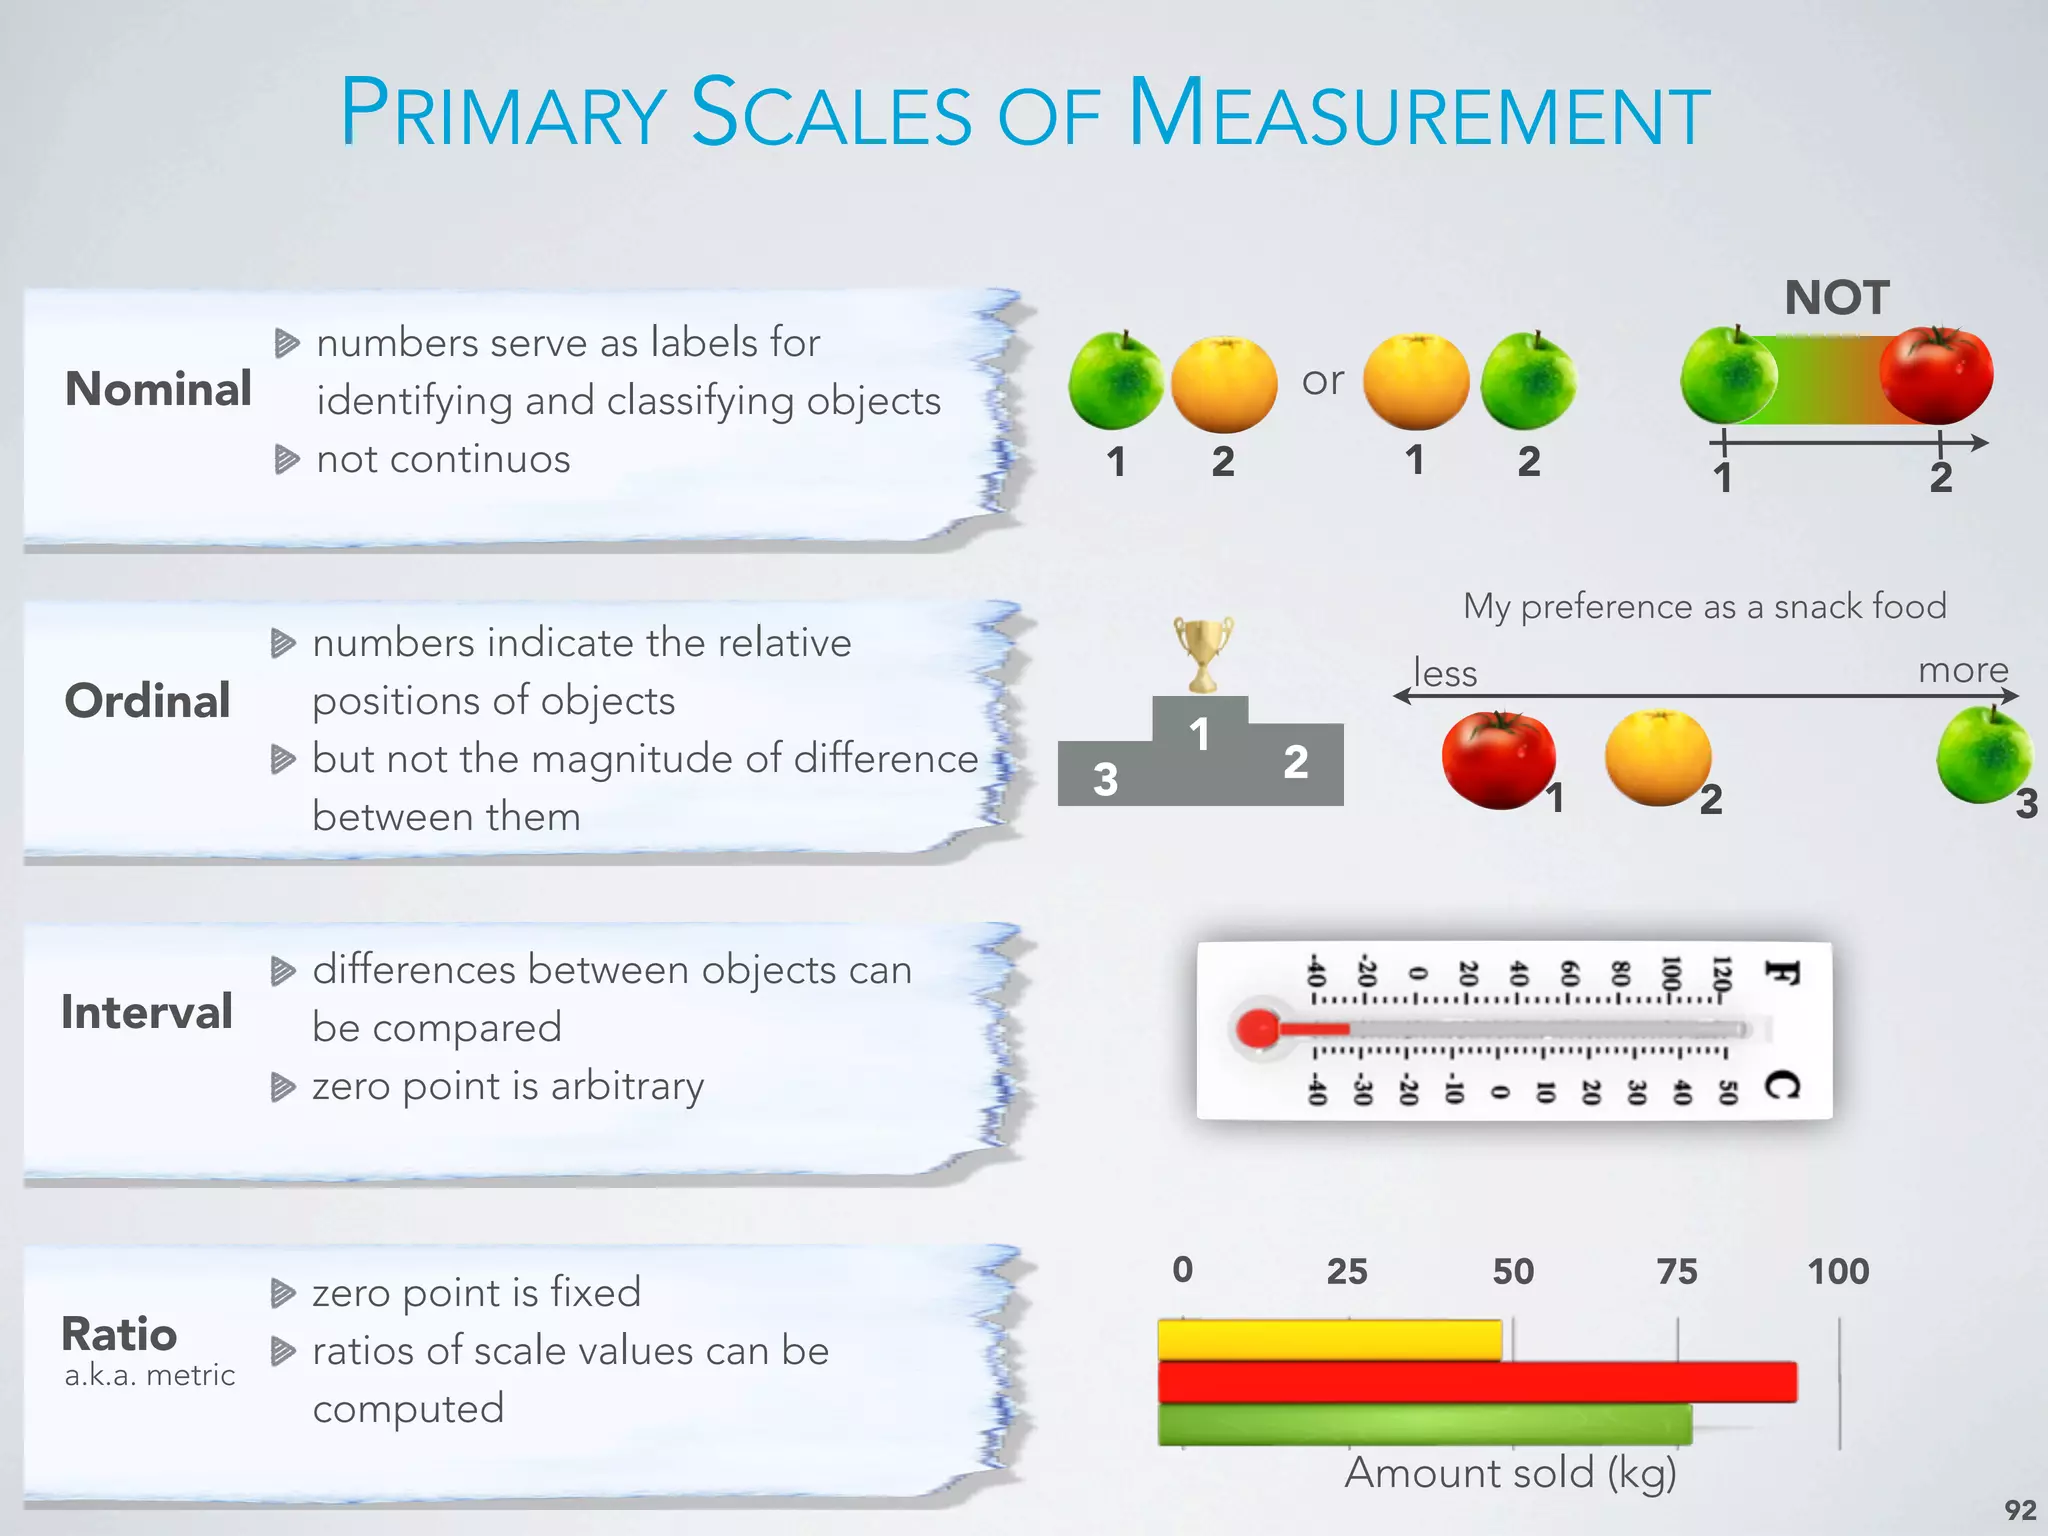
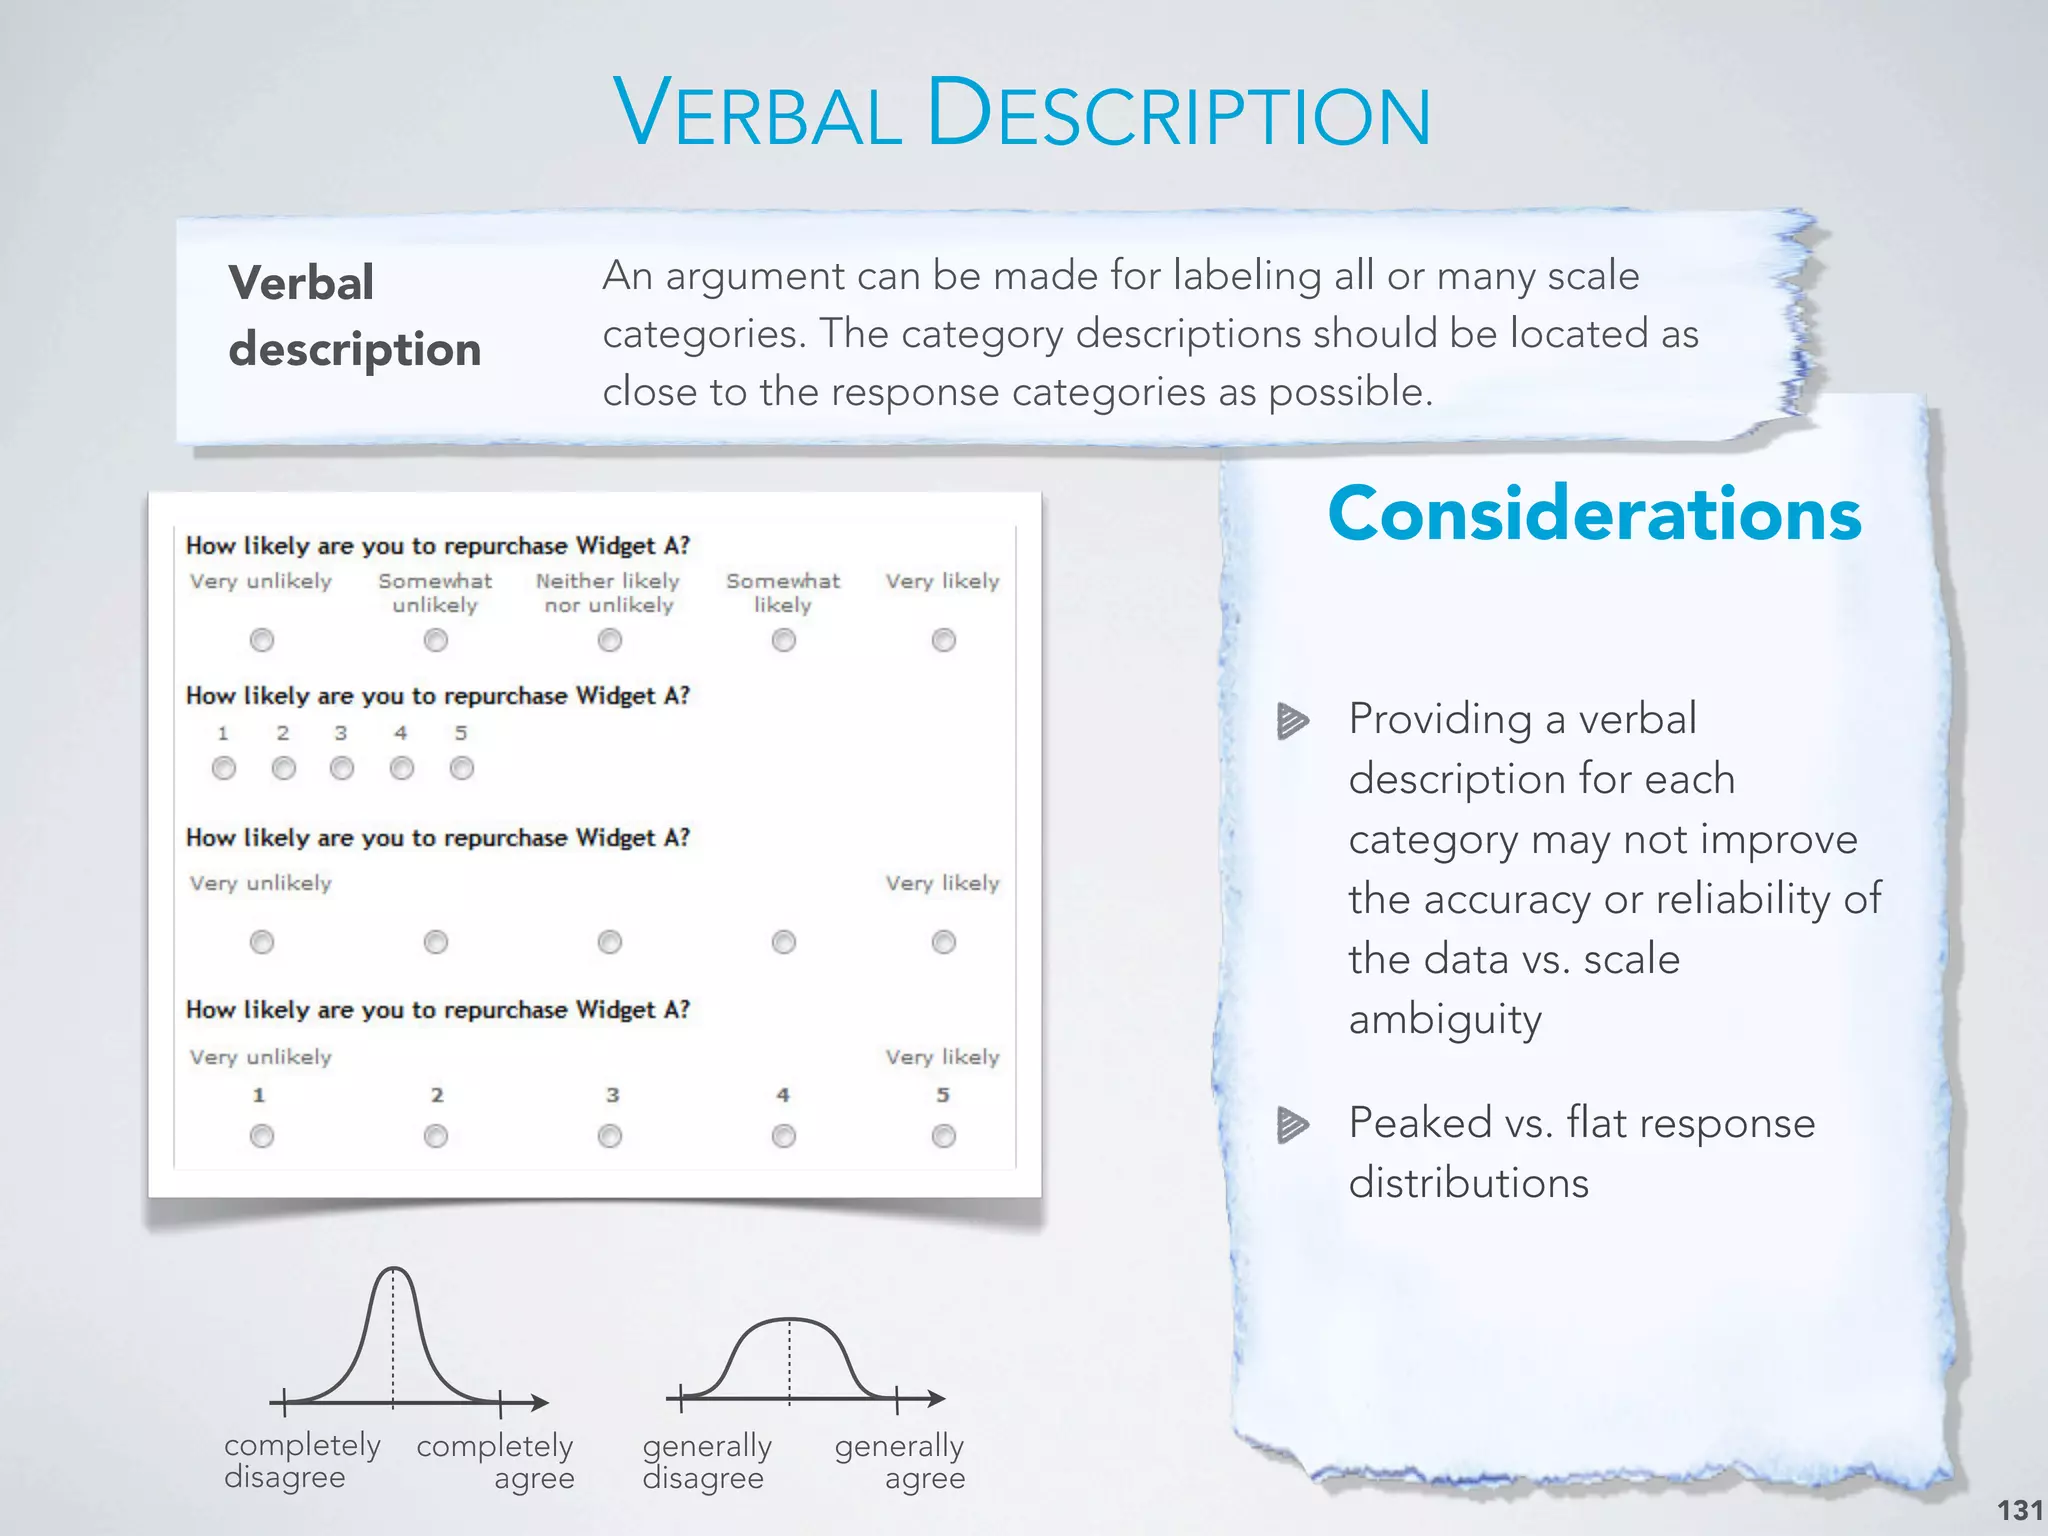
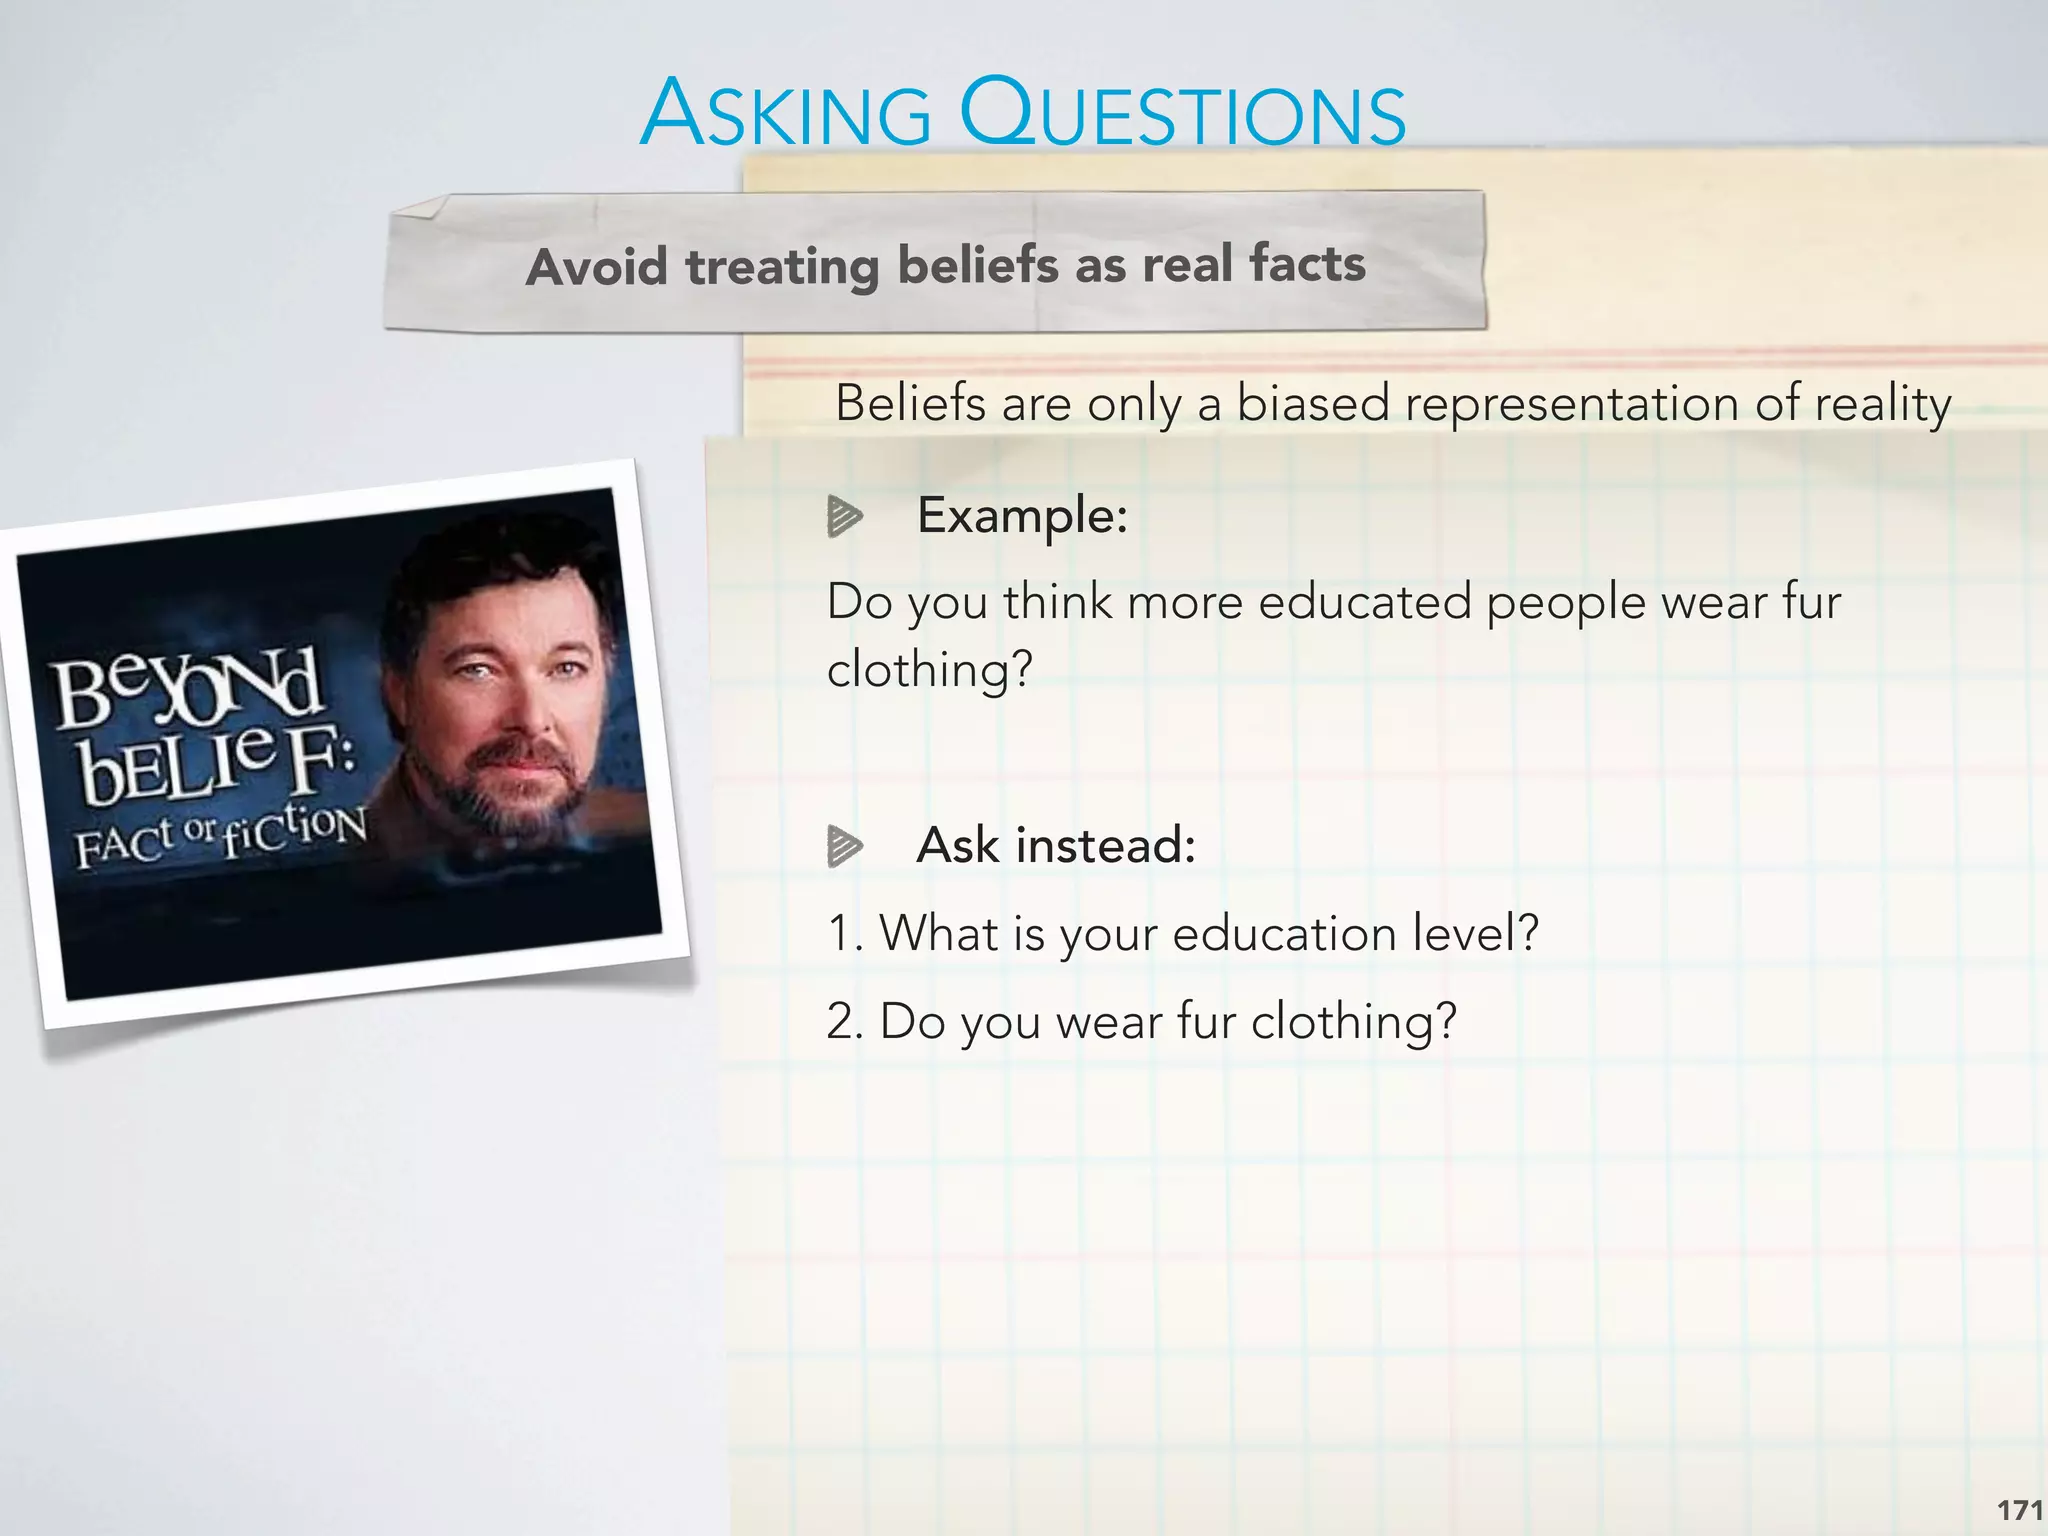
![A SEMANTIC DIFFERENTIAL SCALE FOR MEASURING
SELF-CONCEPTS, PERSON CONCEPTS, AND PRODUCT CONCEPTS
122
Rugged [ ] [ ] [ ] [ ] [ ] [ ] [ ] Delicate
Excitable [ ] [ ] [ ] [ ] [ ] [ ] [ ] Calm
Uncomfortable [ ] [ ] [ ] [ ] [ ] [ ] [ ] Comfortable
Dominating [ ] [ ] [ ] [ ] [ ] [ ] [ ] Submissive
Thrifty [ ] [ ] [ ] [ ] [ ] [ ] [ ] Indulgent
Pleasant [ ] [ ] [ ] [ ] [ ] [ ] [ ] Unpleasant
Contemporary [ ] [ ] [ ] [ ] [ ] [ ] [ ] Non-contemporary
Organized [ ] [ ] [ ] [ ] [ ] [ ] [ ] Unorganized
Rational [ ] [ ] [ ] [ ] [ ] [ ] [ ] Emotional
Youthful [ ] [ ] [ ] [ ] [ ] [ ] [ ] Mature
Formal [ ] [ ] [ ] [ ] [ ] [ ] [ ] Informal
Orthodox [ ] [ ] [ ] [ ] [ ] [ ] [ ] Liberal
Complex [ ] [ ] [ ] [ ] [ ] [ ] [ ] Simple
Colorless [ ] [ ] [ ] [ ] [ ] [ ] [ ] Colorful
Modest [ ] [ ] [ ] [ ] [ ] [ ] [ ] Vain
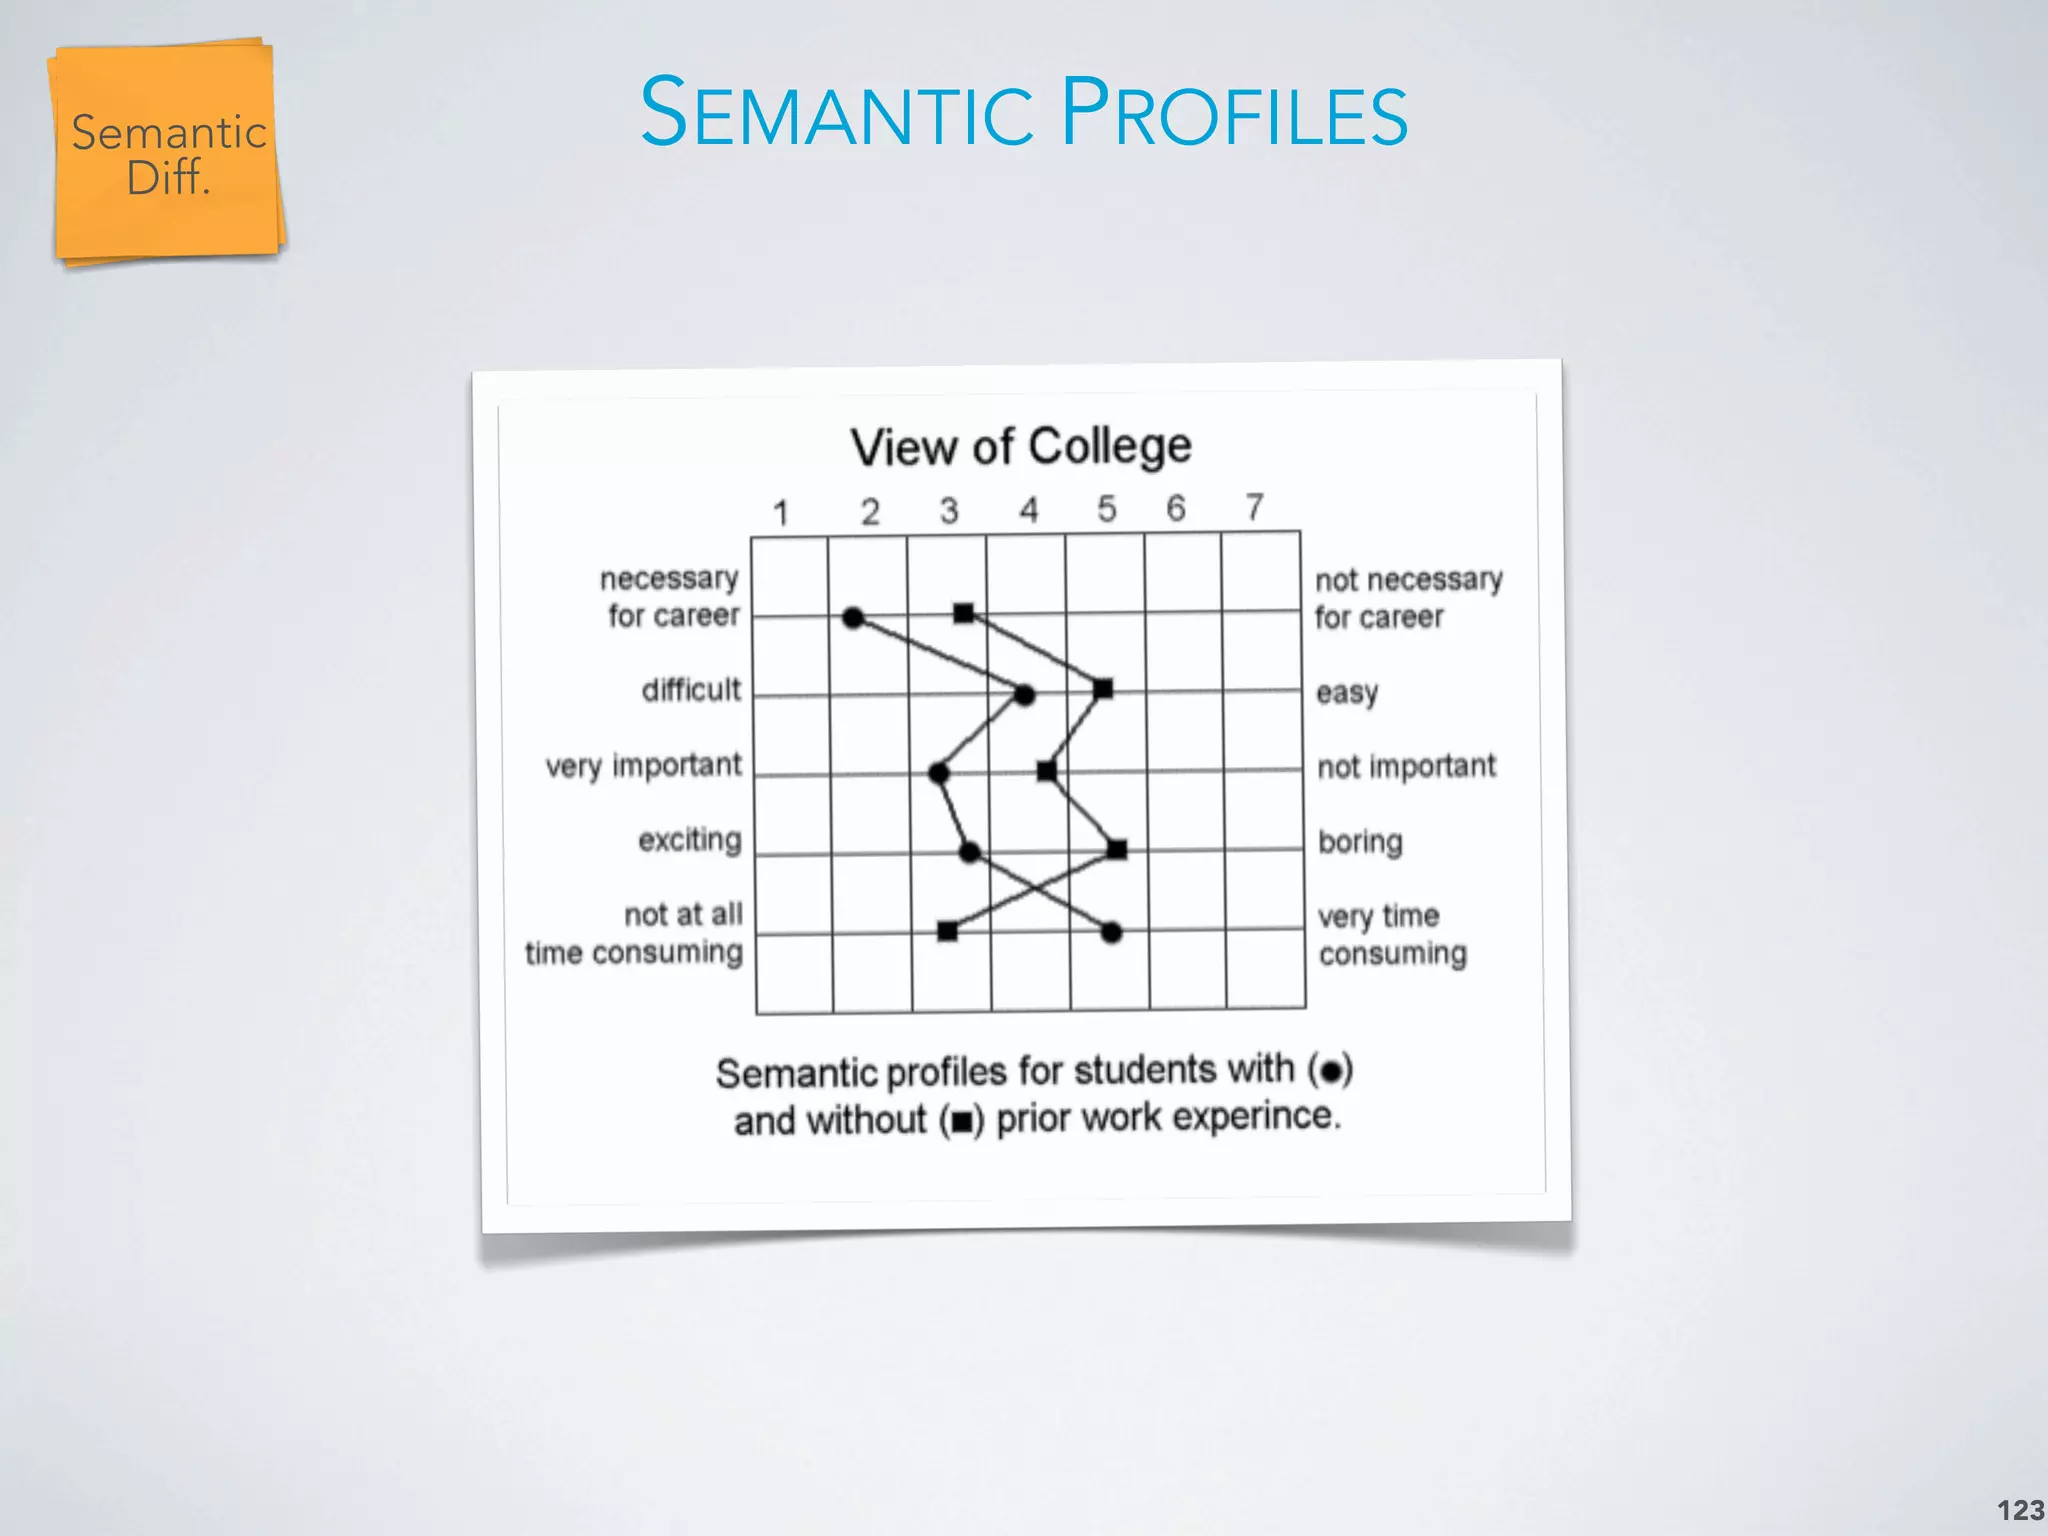
Rating profiles of different objects / respondents / segments.
Each point corresponds to a mean or median of the respective scale.
LikertSemantic
Diff.](https://image.slidesharecdn.com/marketresearchbypaulmarx-121101082001-phpapp02/75/Market-Research-course-slides-122-2048.jpg)
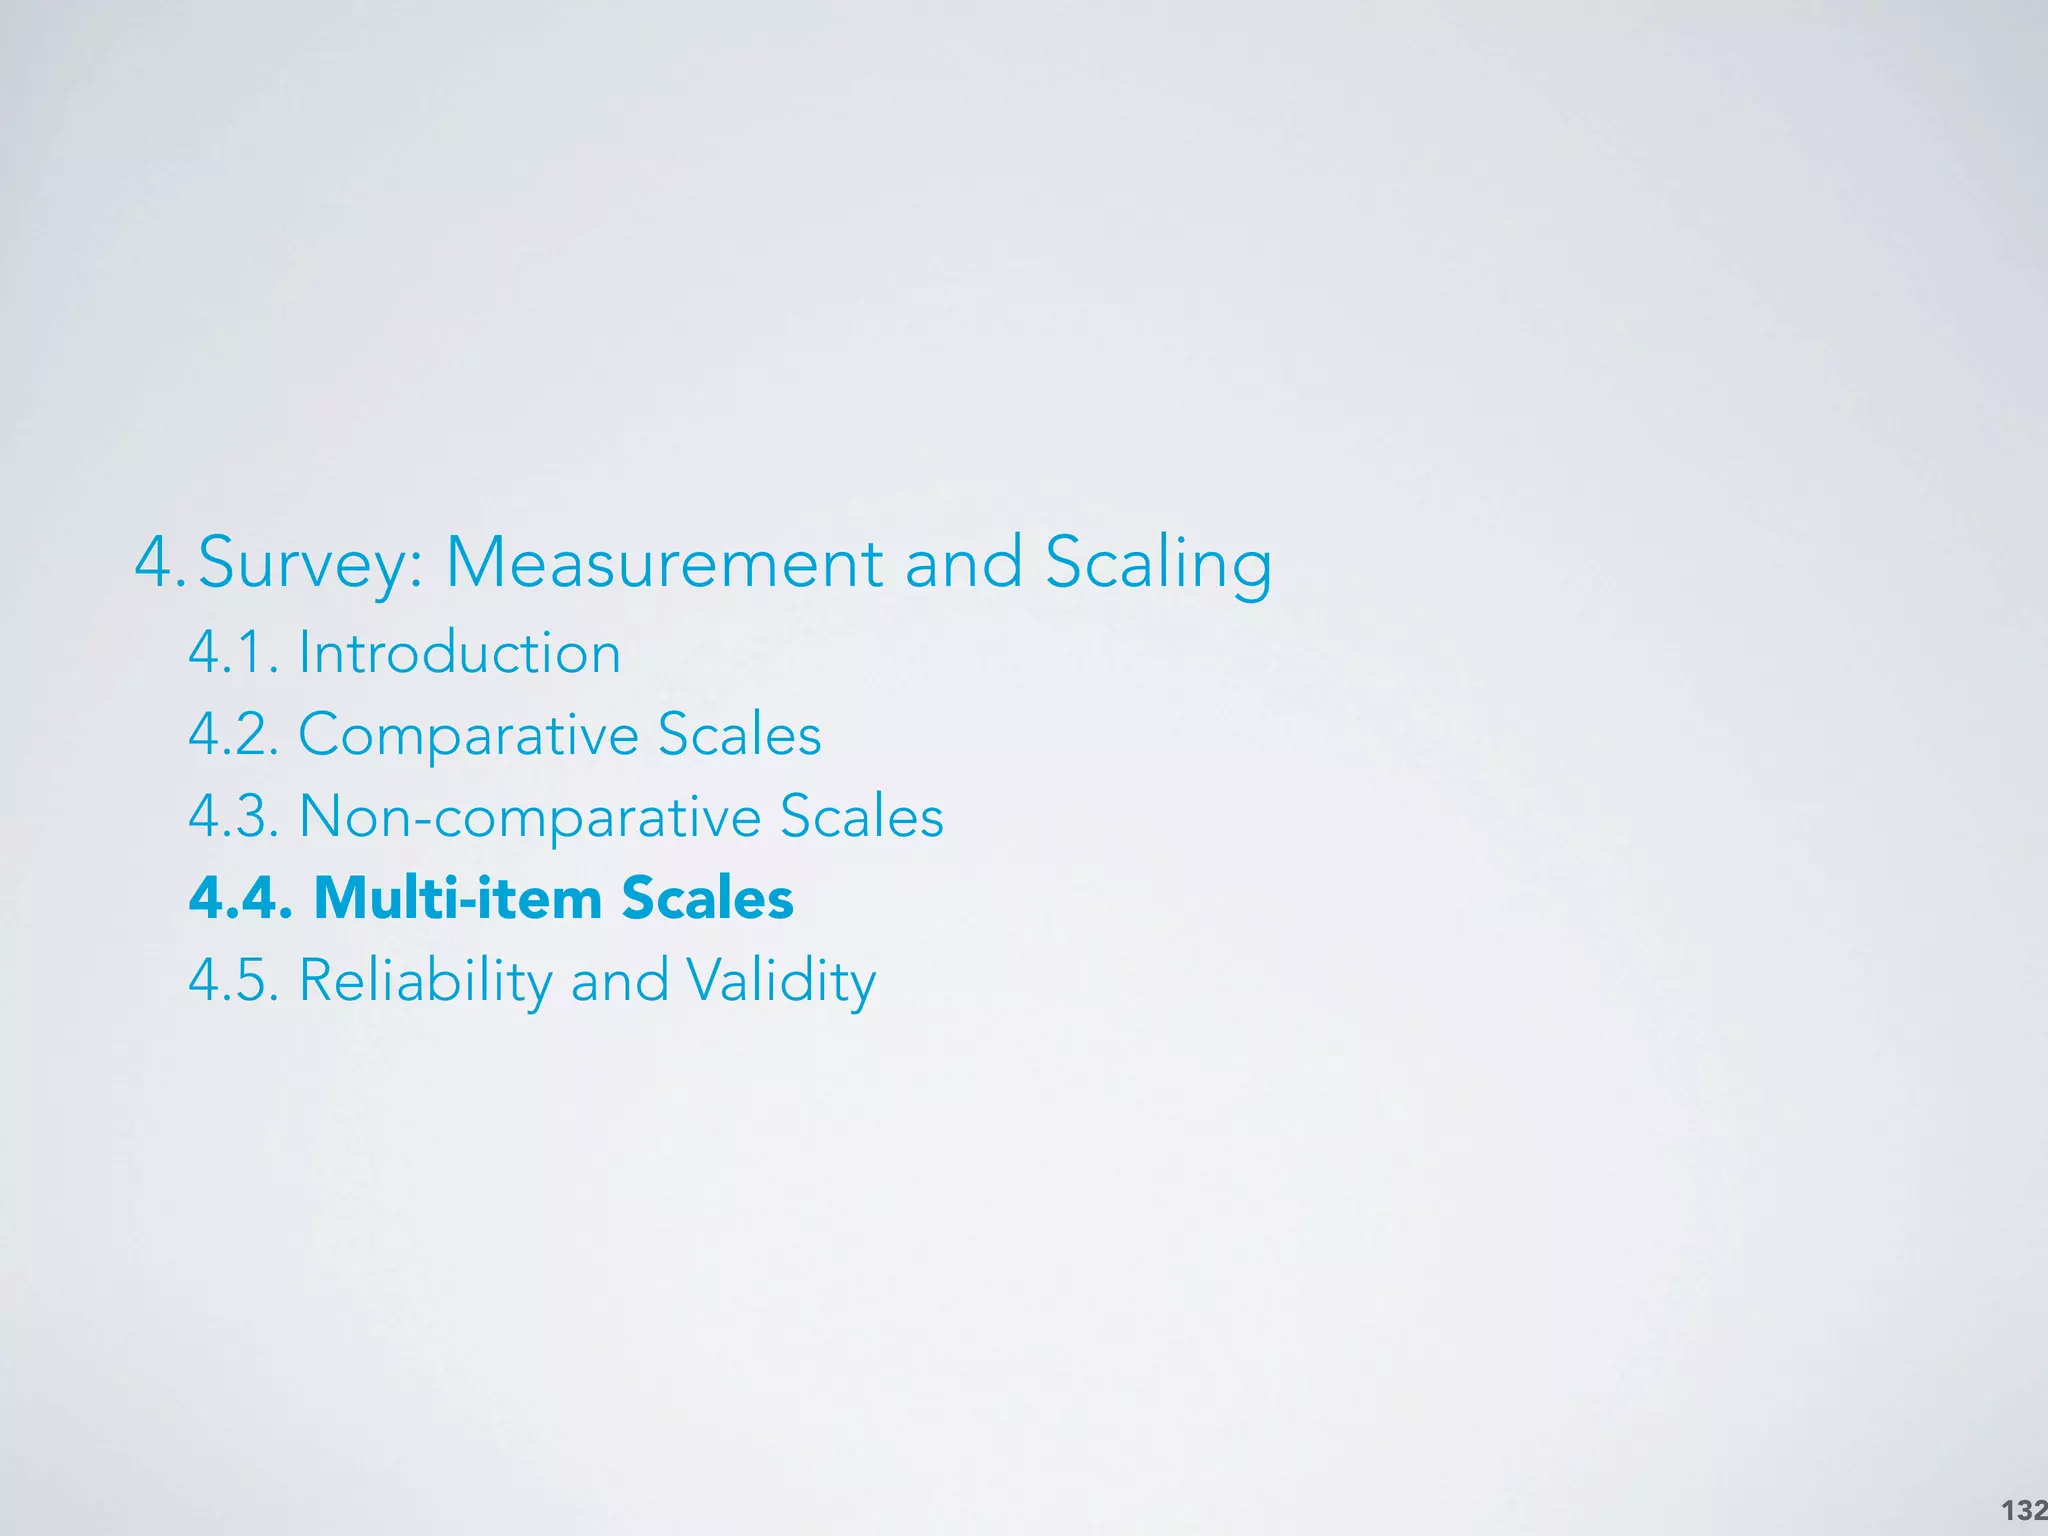
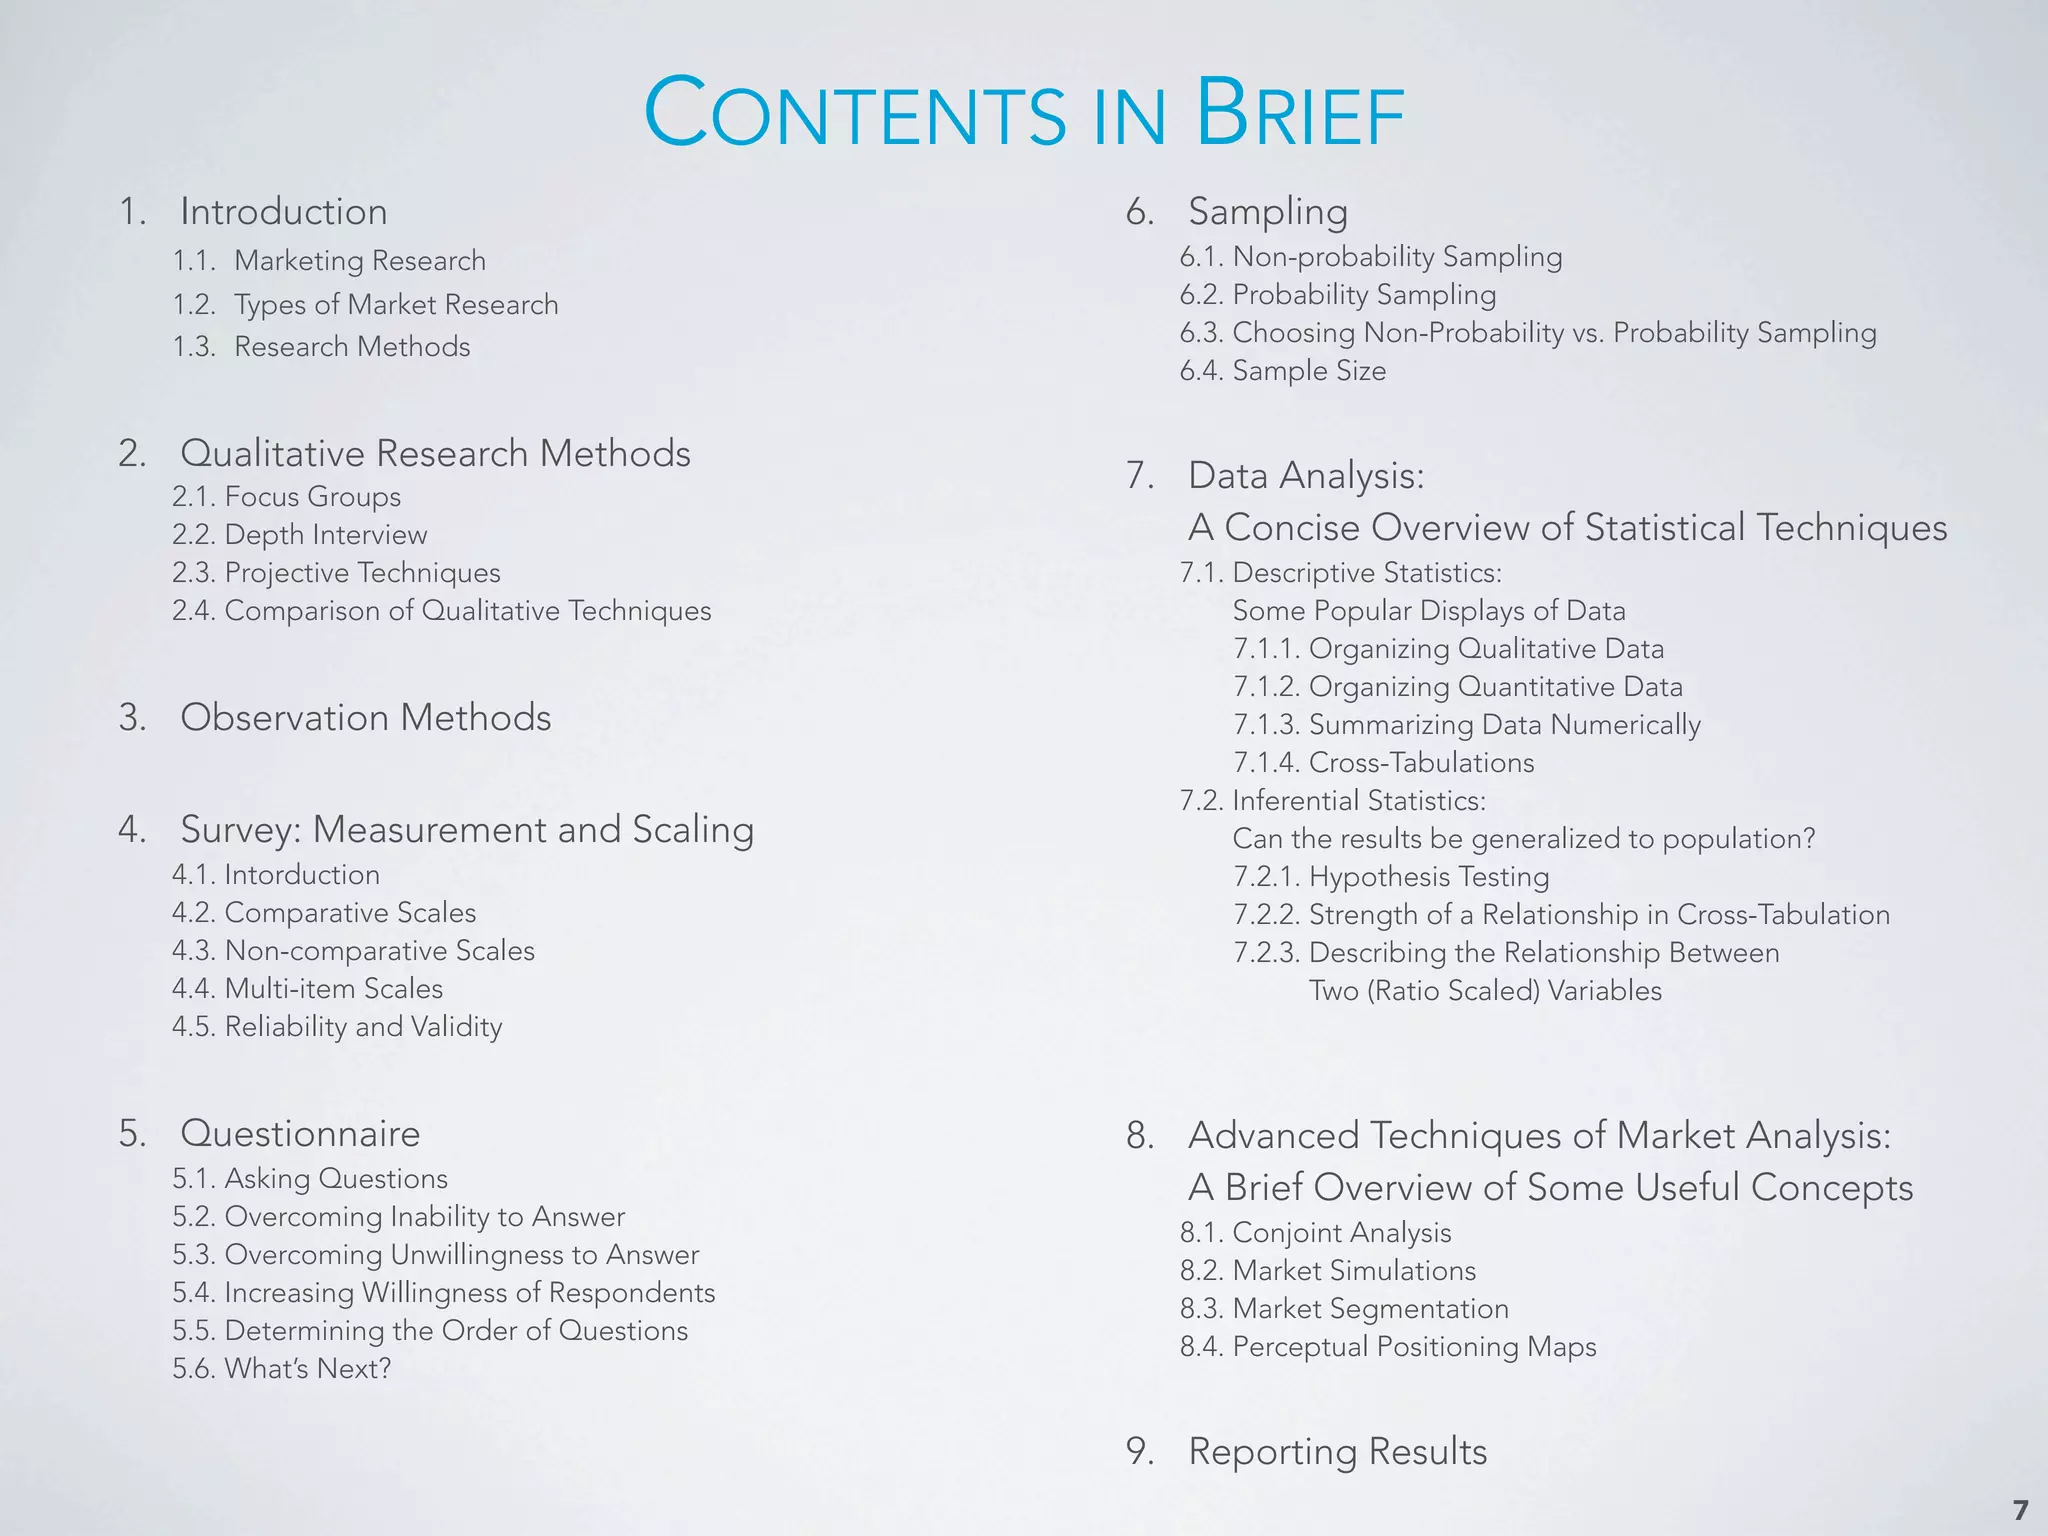
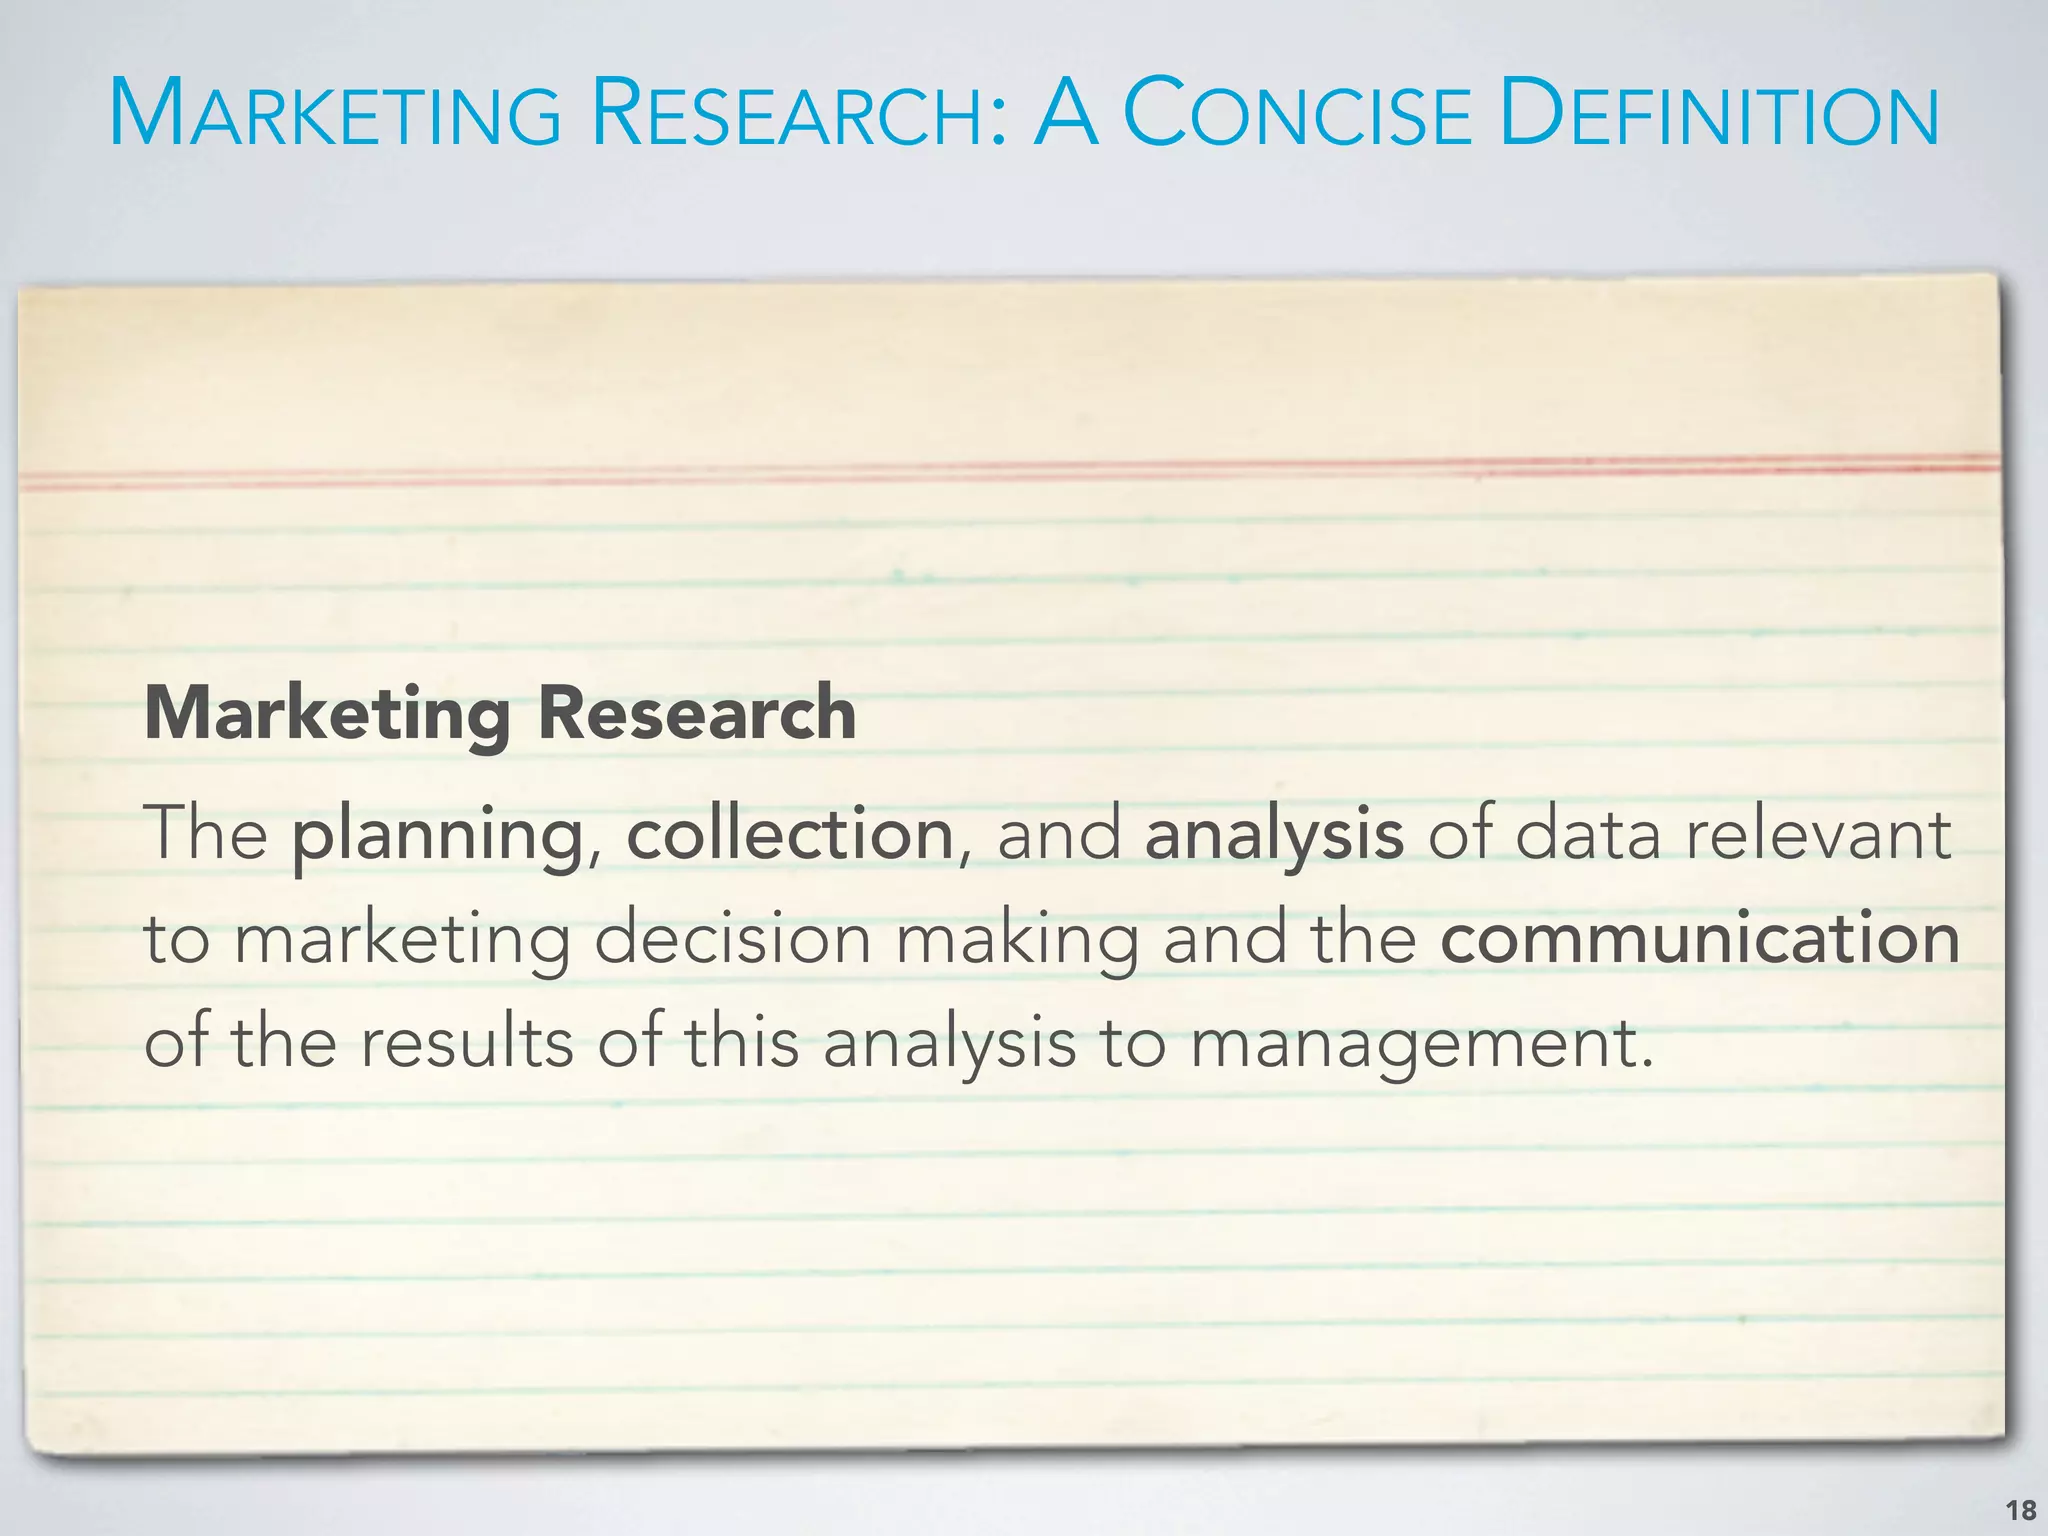
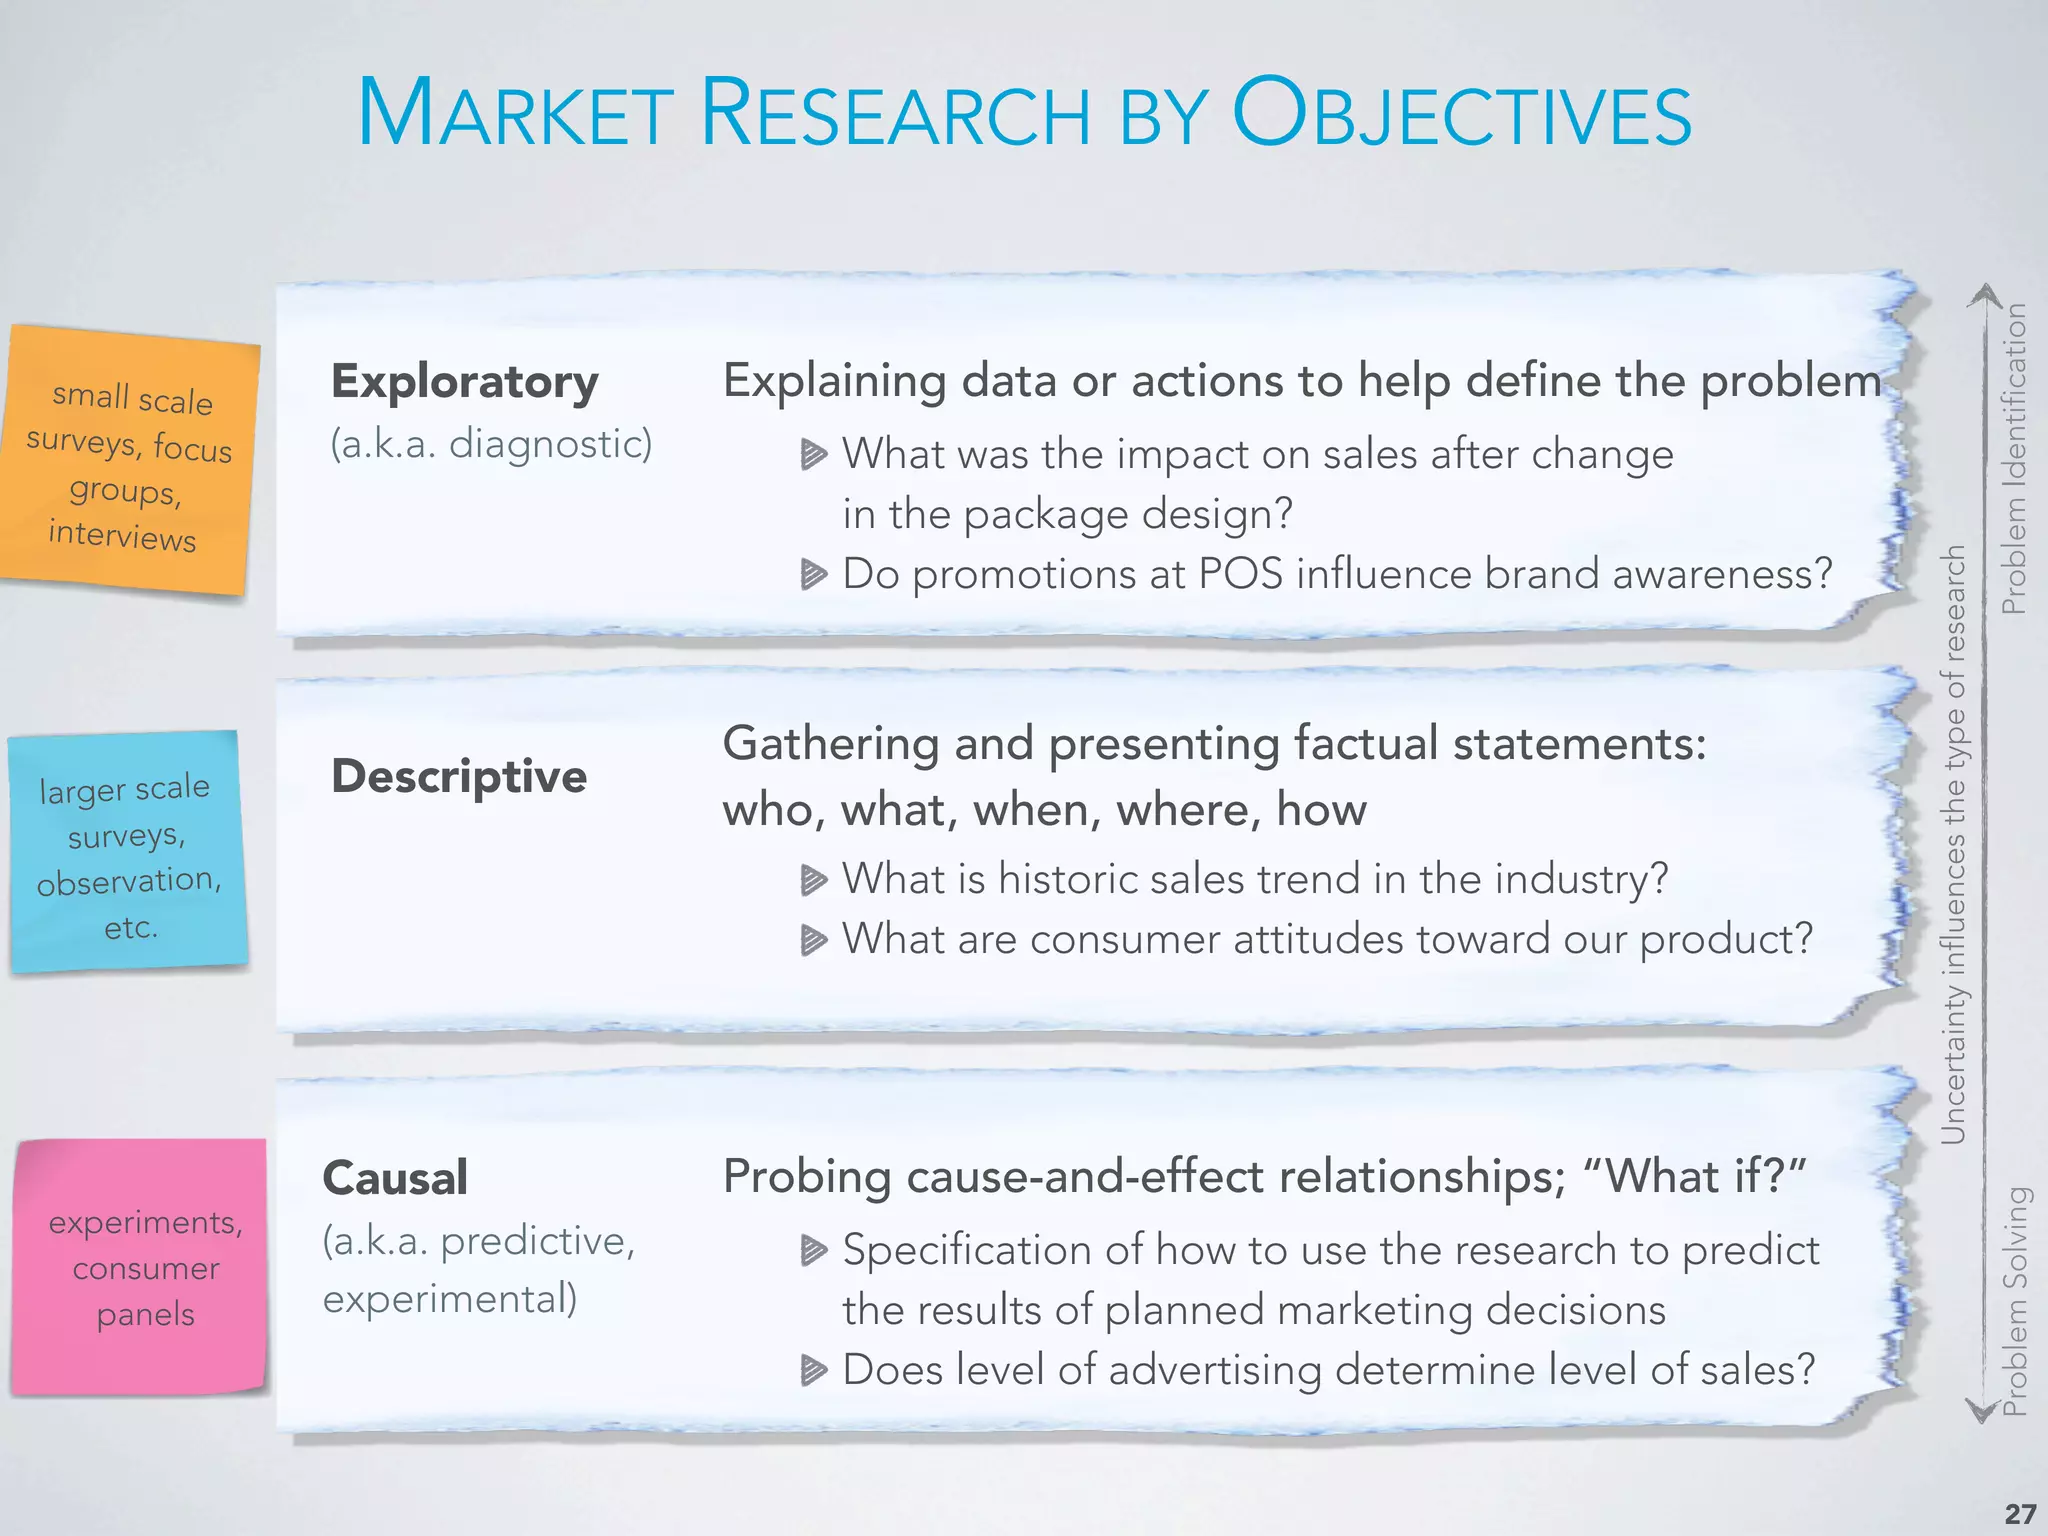
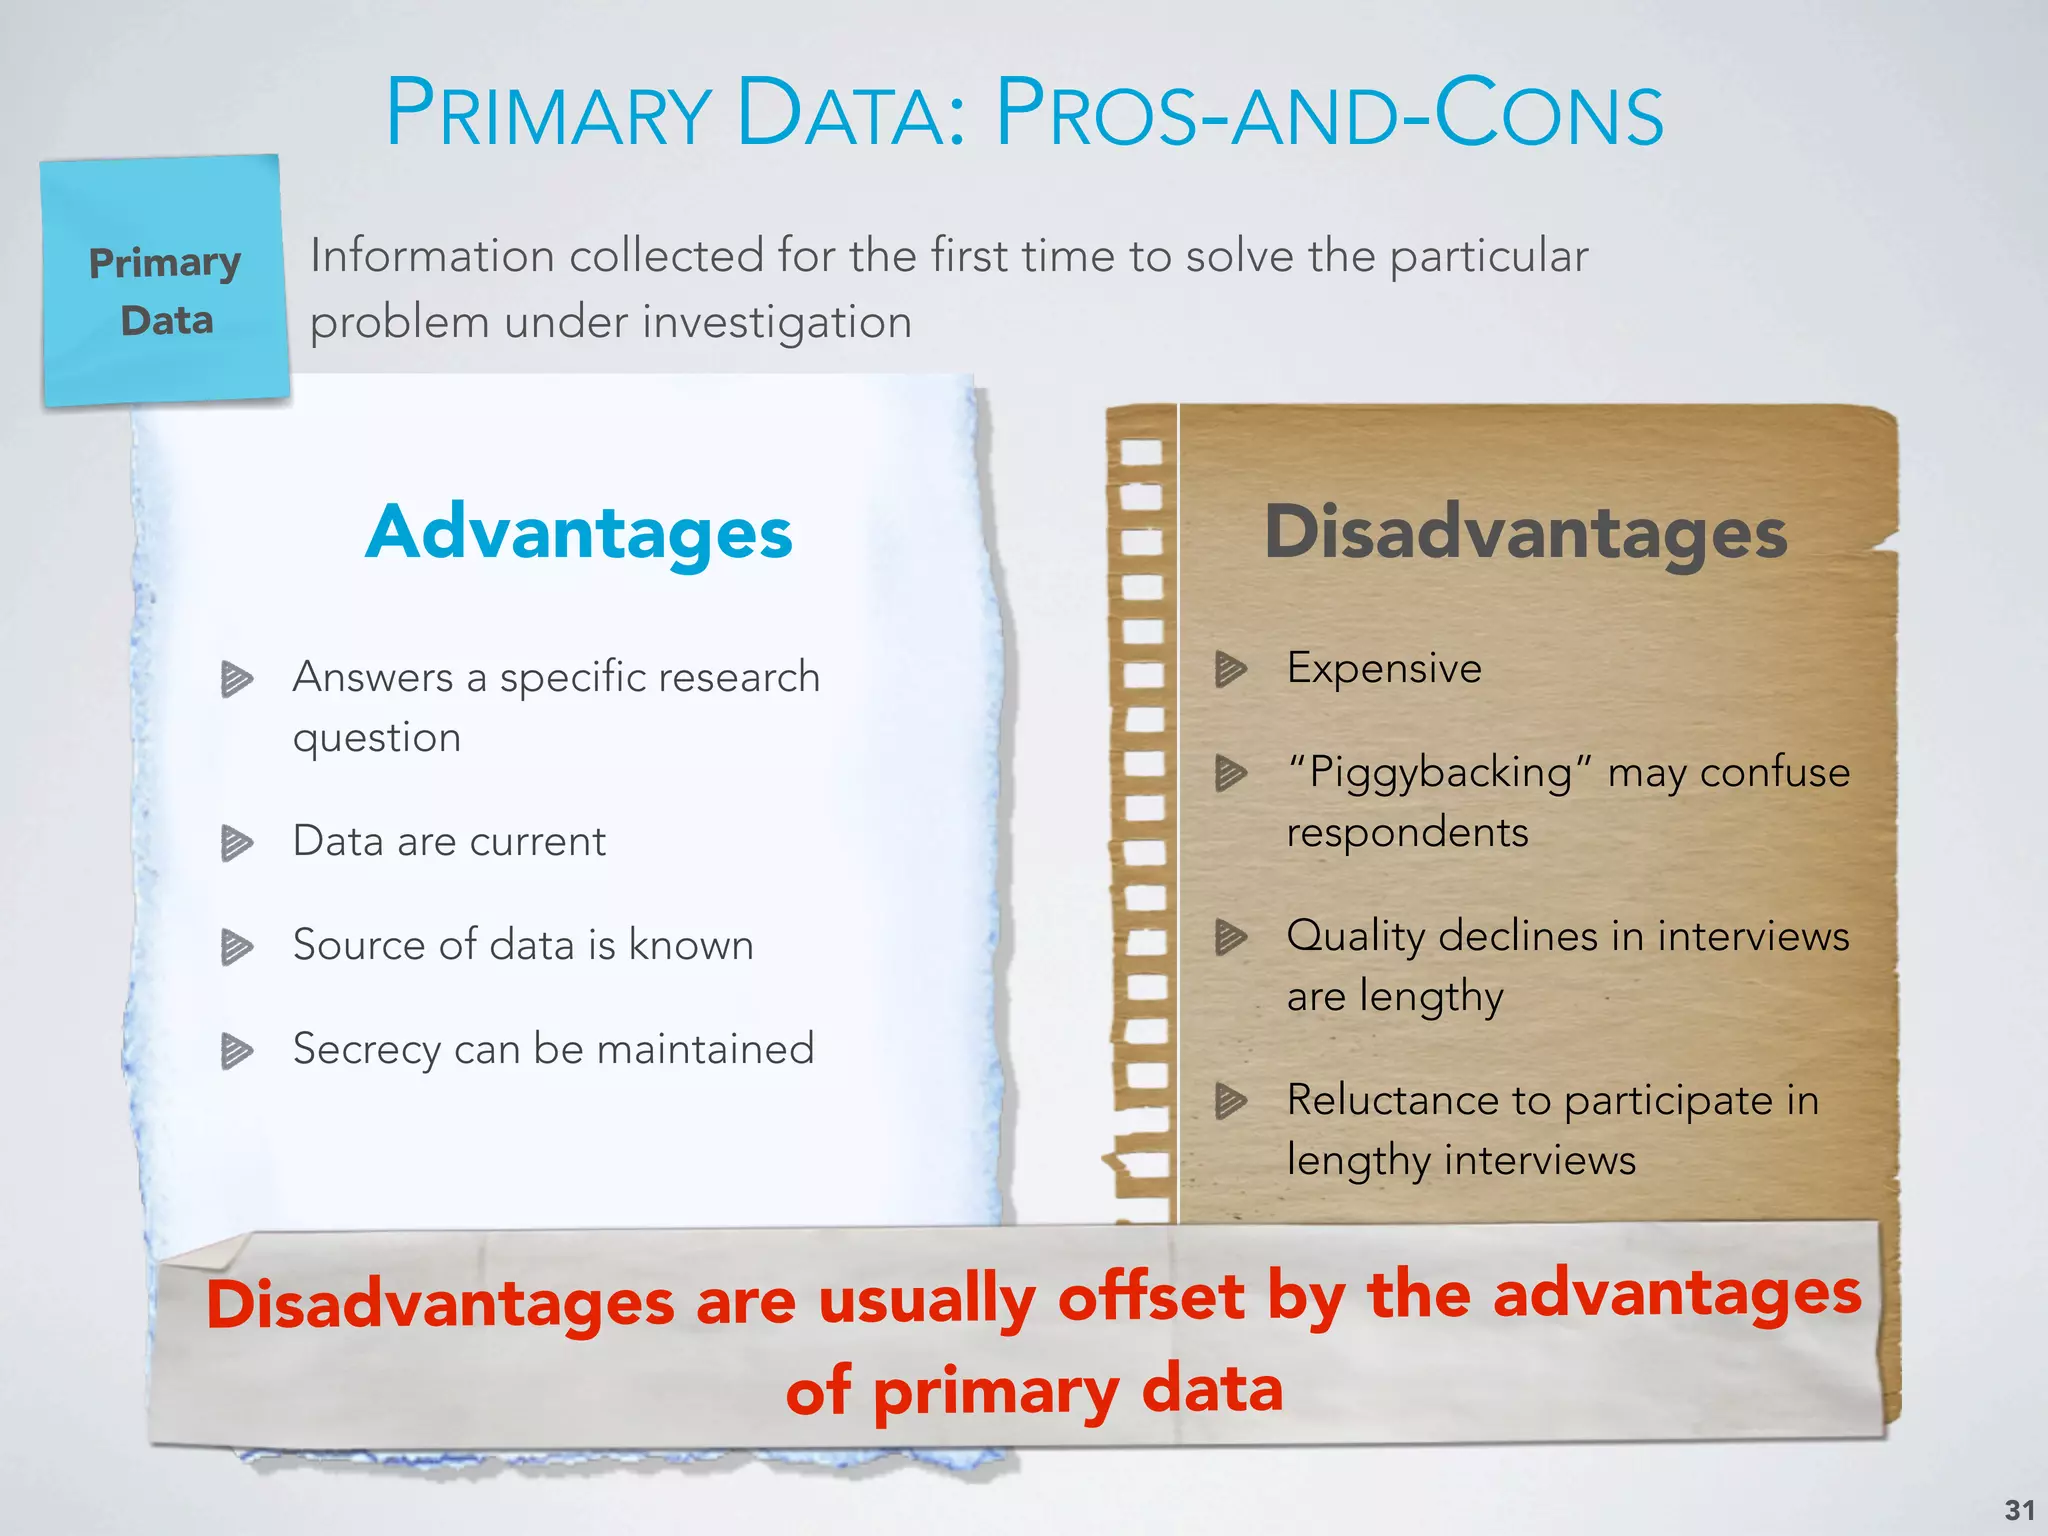
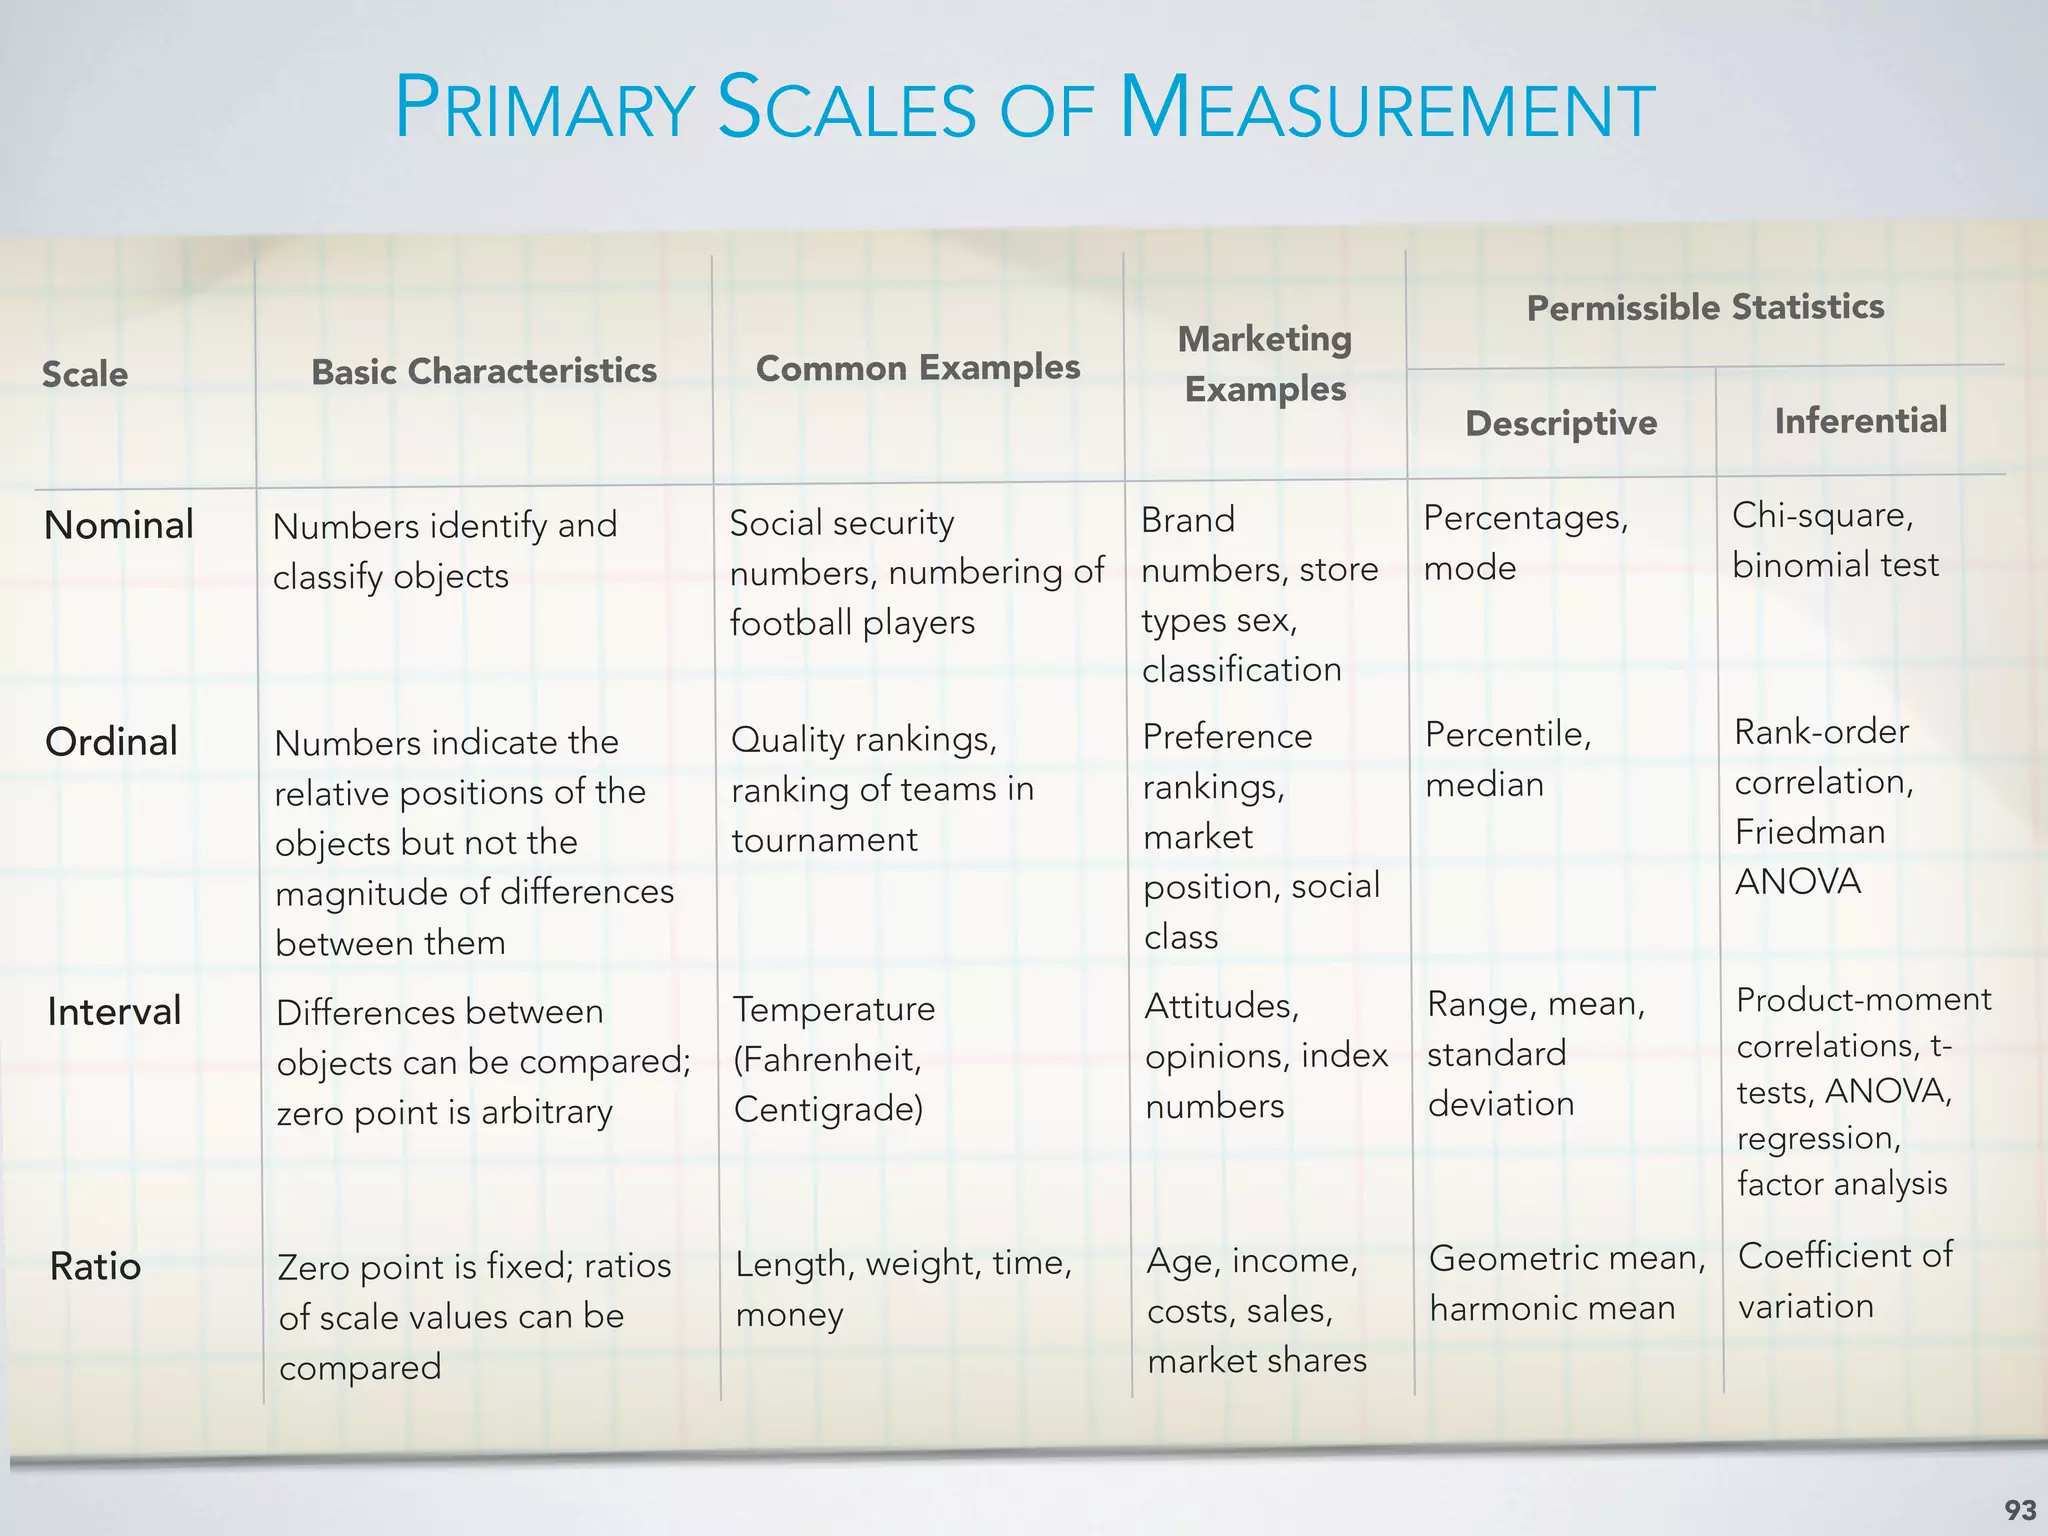
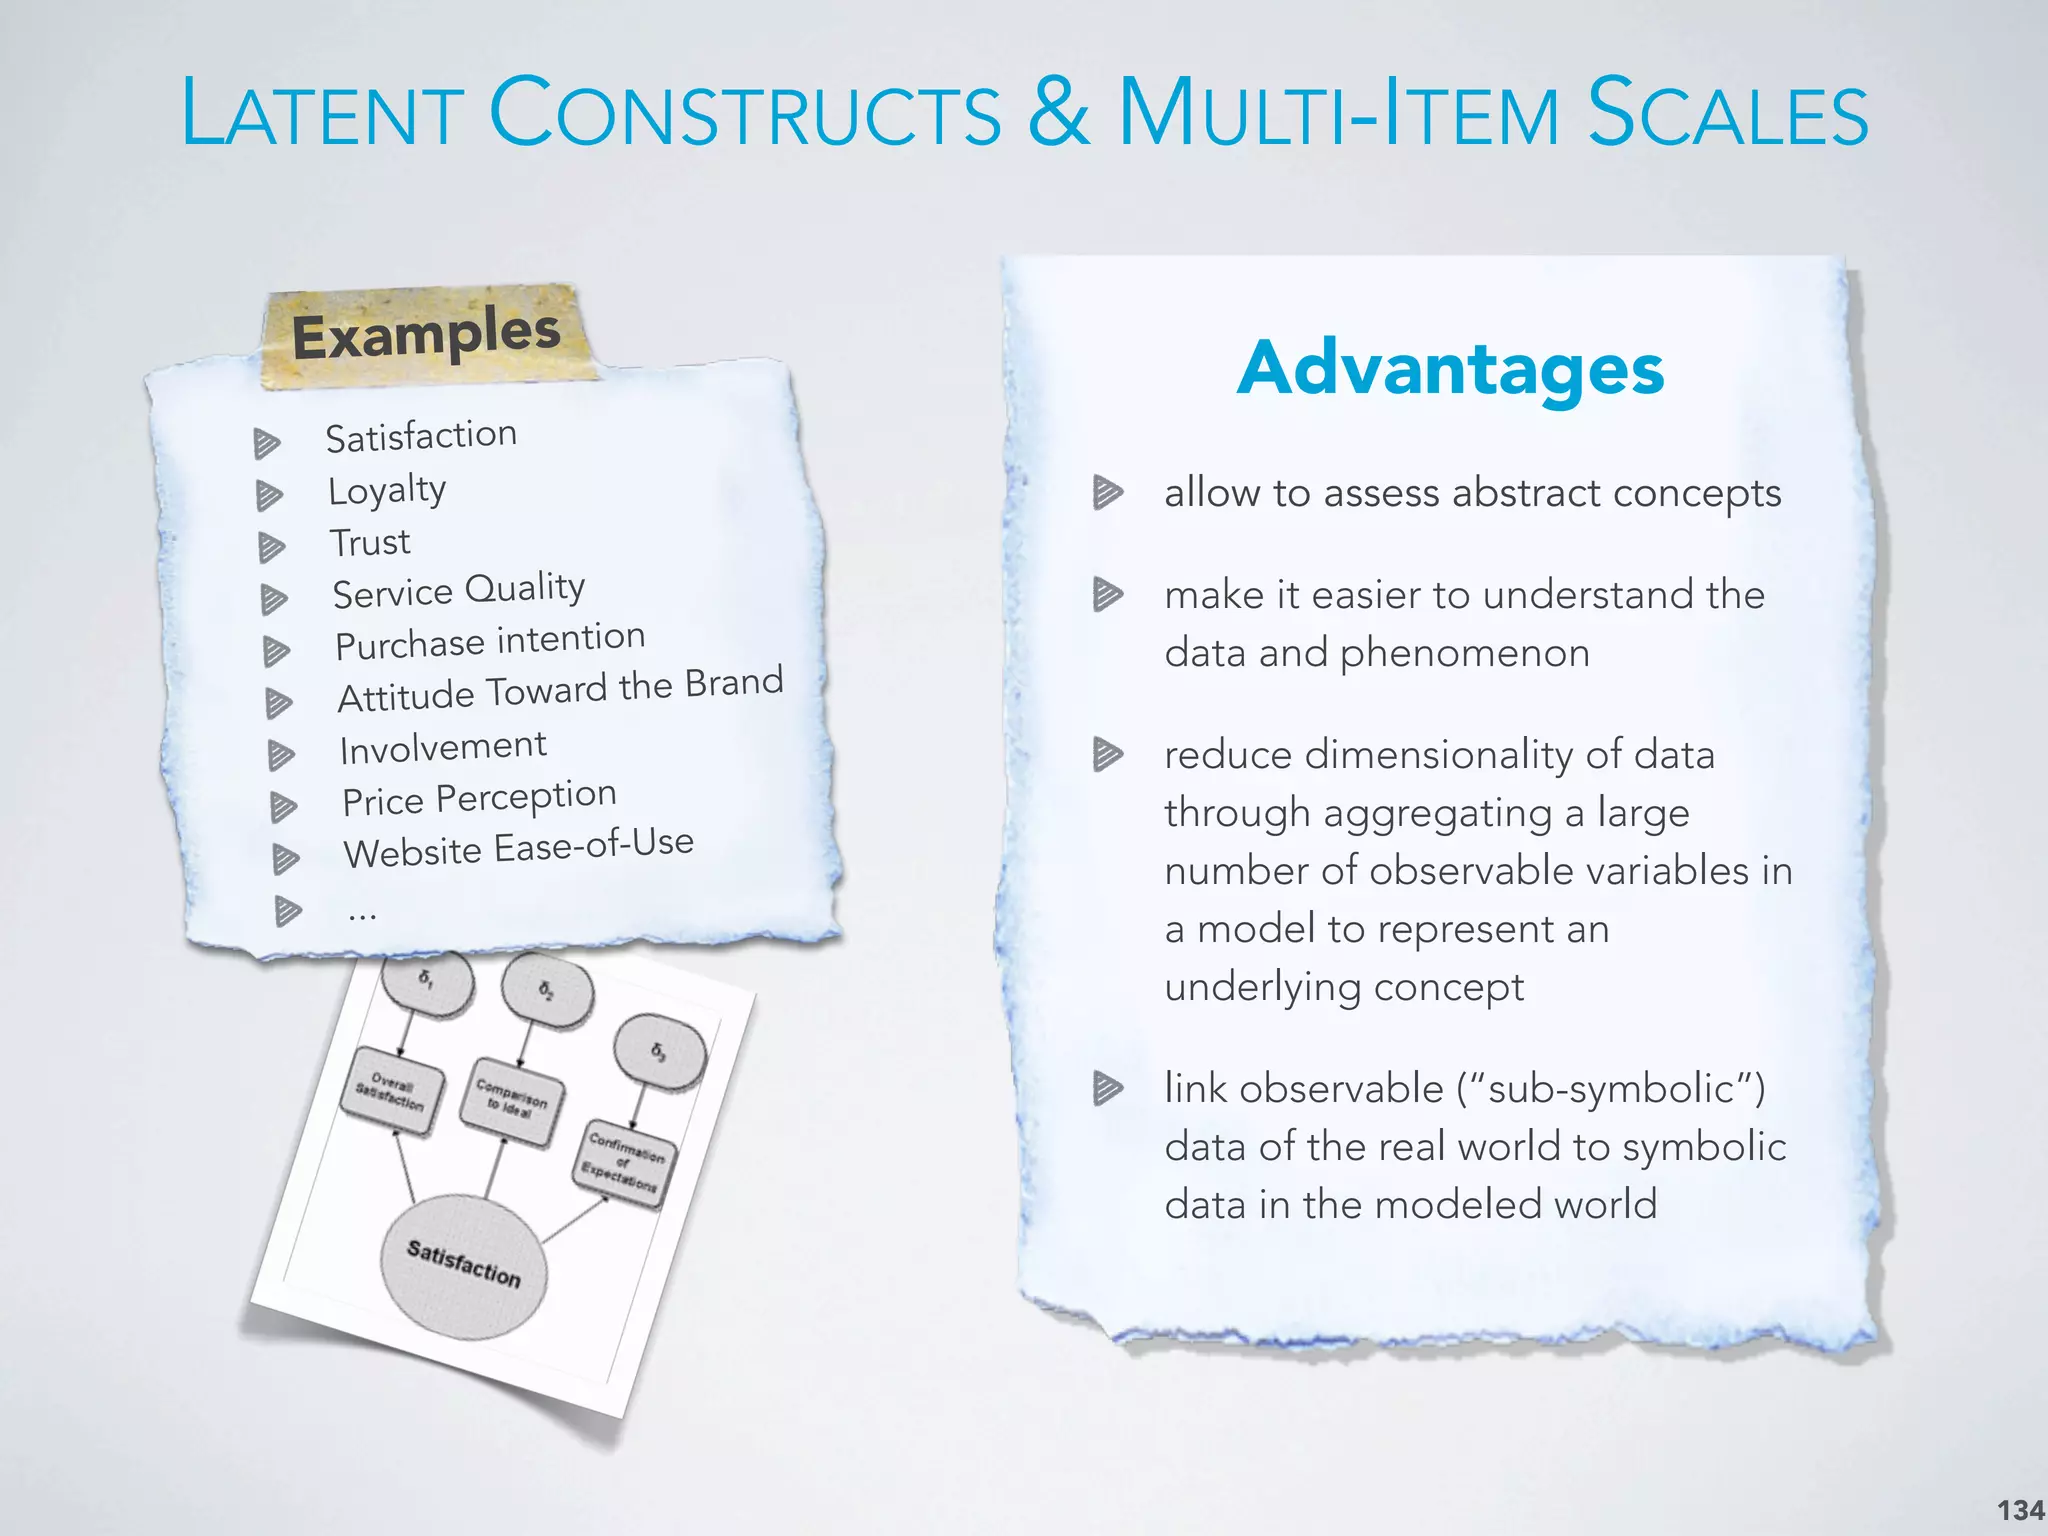
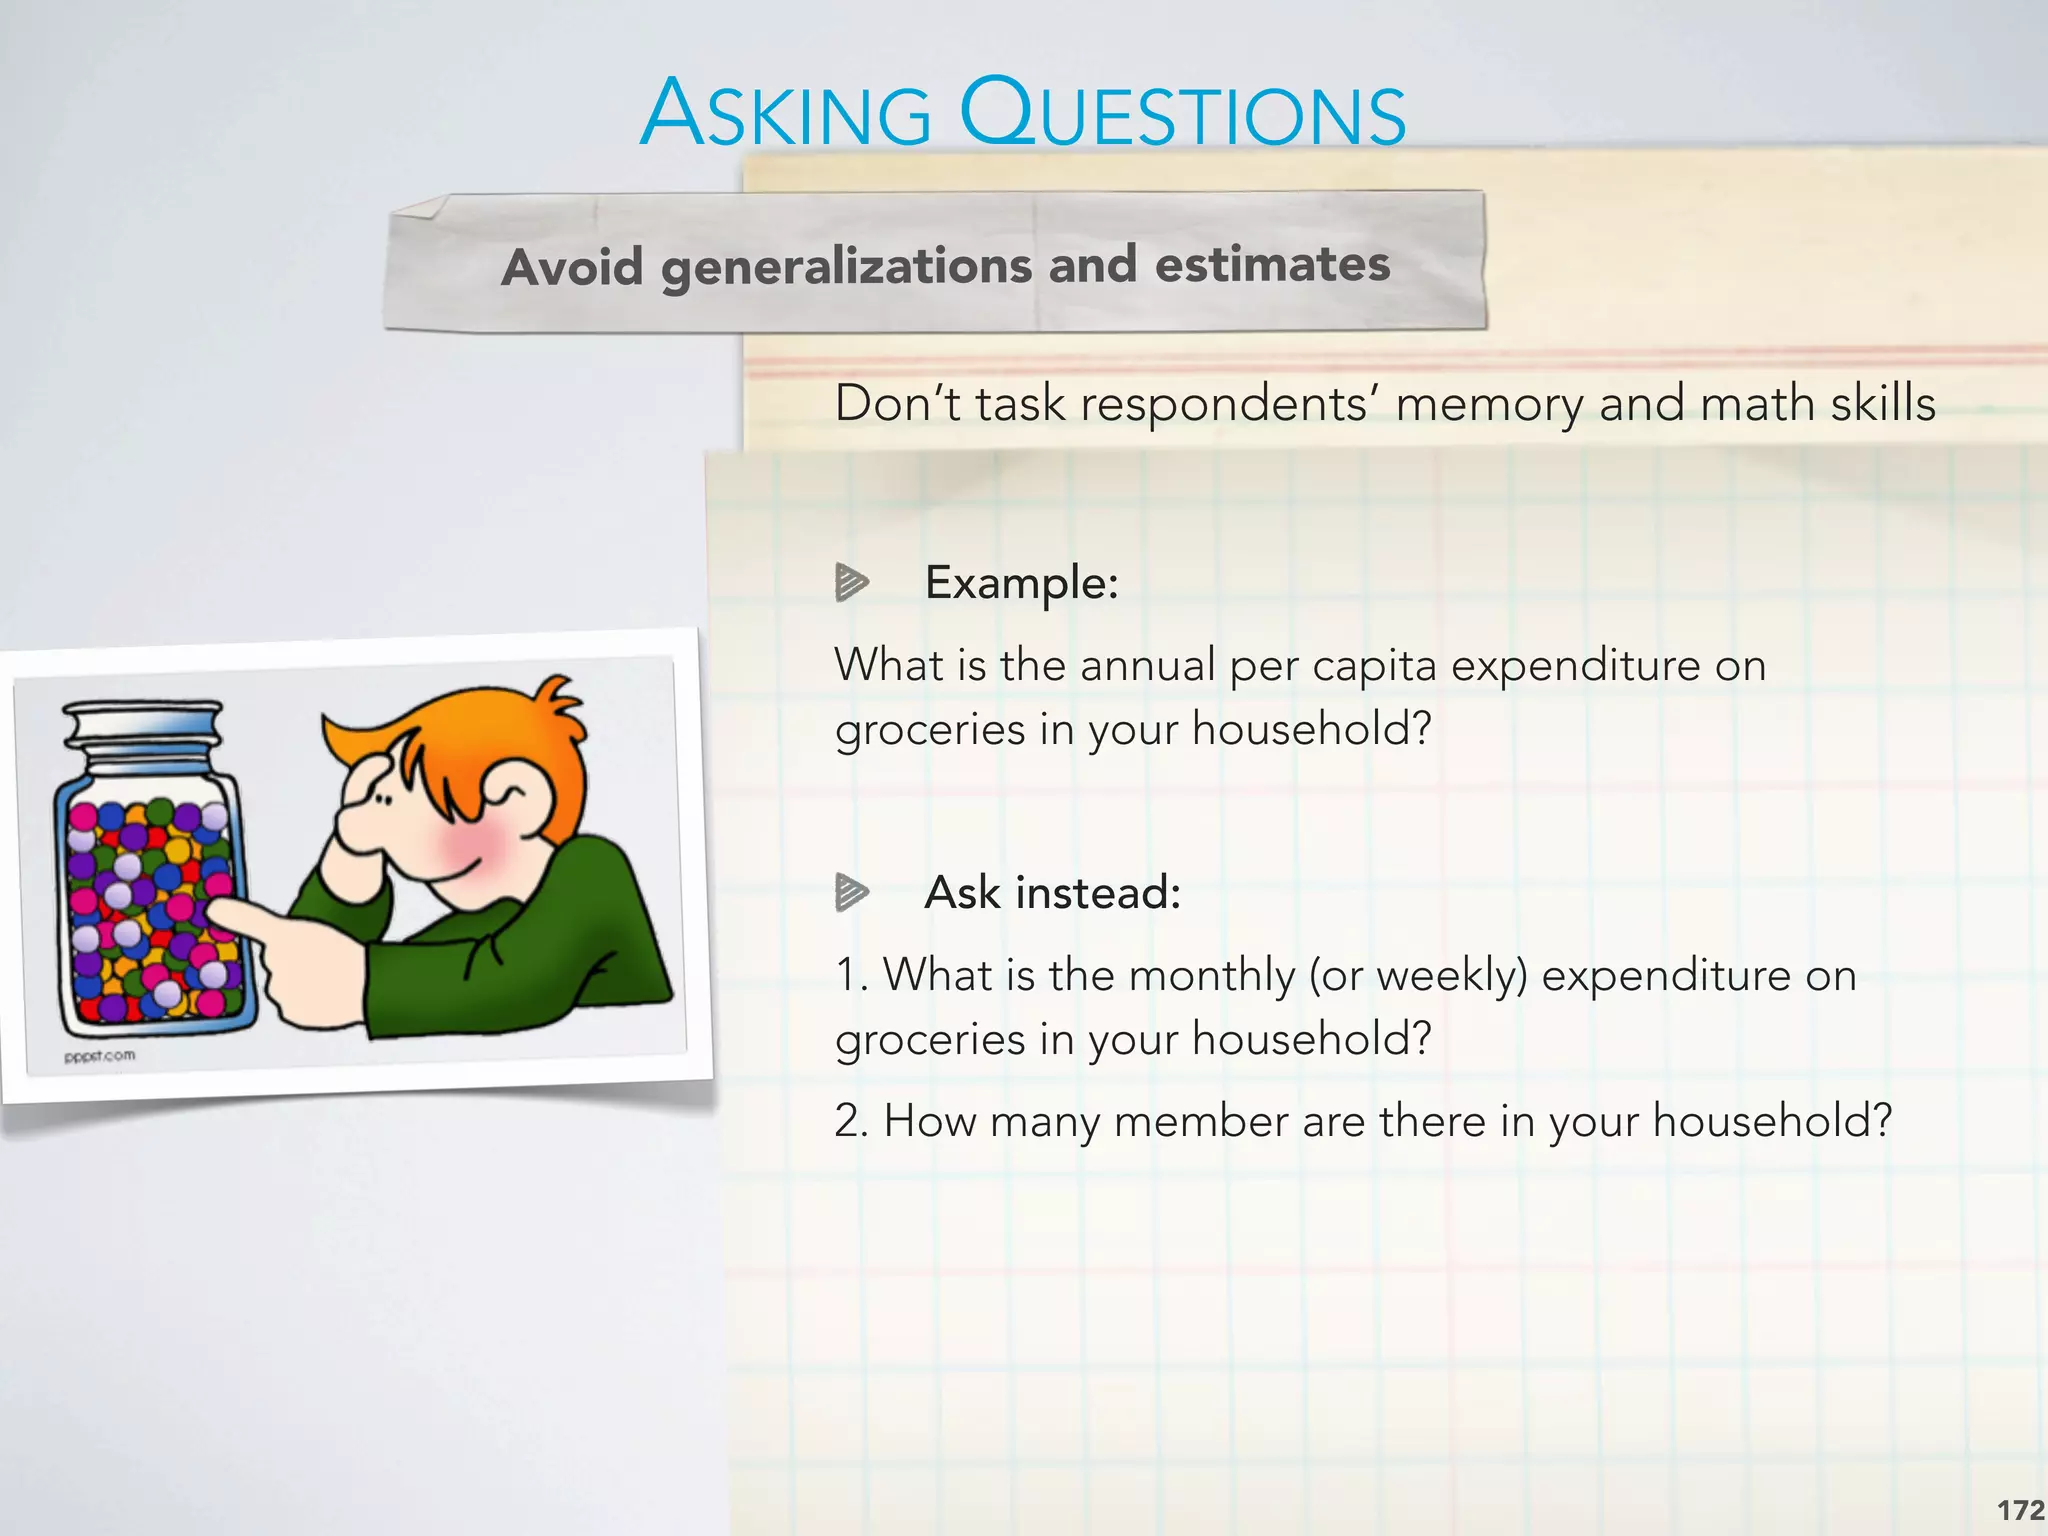
![LATENT CONSTRUCTS
133
A Latent Construct
is a variable that cannot be observed or
measured directly but can be inferred from other
observable measurable variables.
Thus, the researcher must capture the
variable through questions representing the
presence/level of the variable in question.
A Latent Construct
satisfied [ ] [ ] [ ] [ ] [ ] [ ] [ ] dissatisfied
pleased [ ] [ ] [ ] [ ] [ ] [ ] [ ] displeased
favorable [ ] [ ] [ ] [ ] [ ] [ ] [ ] unfavorable
pleasant [ ] [ ] [ ] [ ] [ ] [ ] [ ] unpleasant
I like it very much [ ] [ ] [ ] [ ] [ ] [ ] [ ] I didn't like it at all
contented [ ] [ ] [ ] [ ] [ ] [ ] [ ] frustrated
delighted [ ] [ ] [ ] [ ] [ ] [ ] [ ] terrible
Please indicate how satisfied you were with your purchase of _____
by checking the space that best gives your answer.
α=.84](https://image.slidesharecdn.com/marketresearchbypaulmarx-121101082001-phpapp02/75/Market-Research-course-slides-133-2048.jpg)
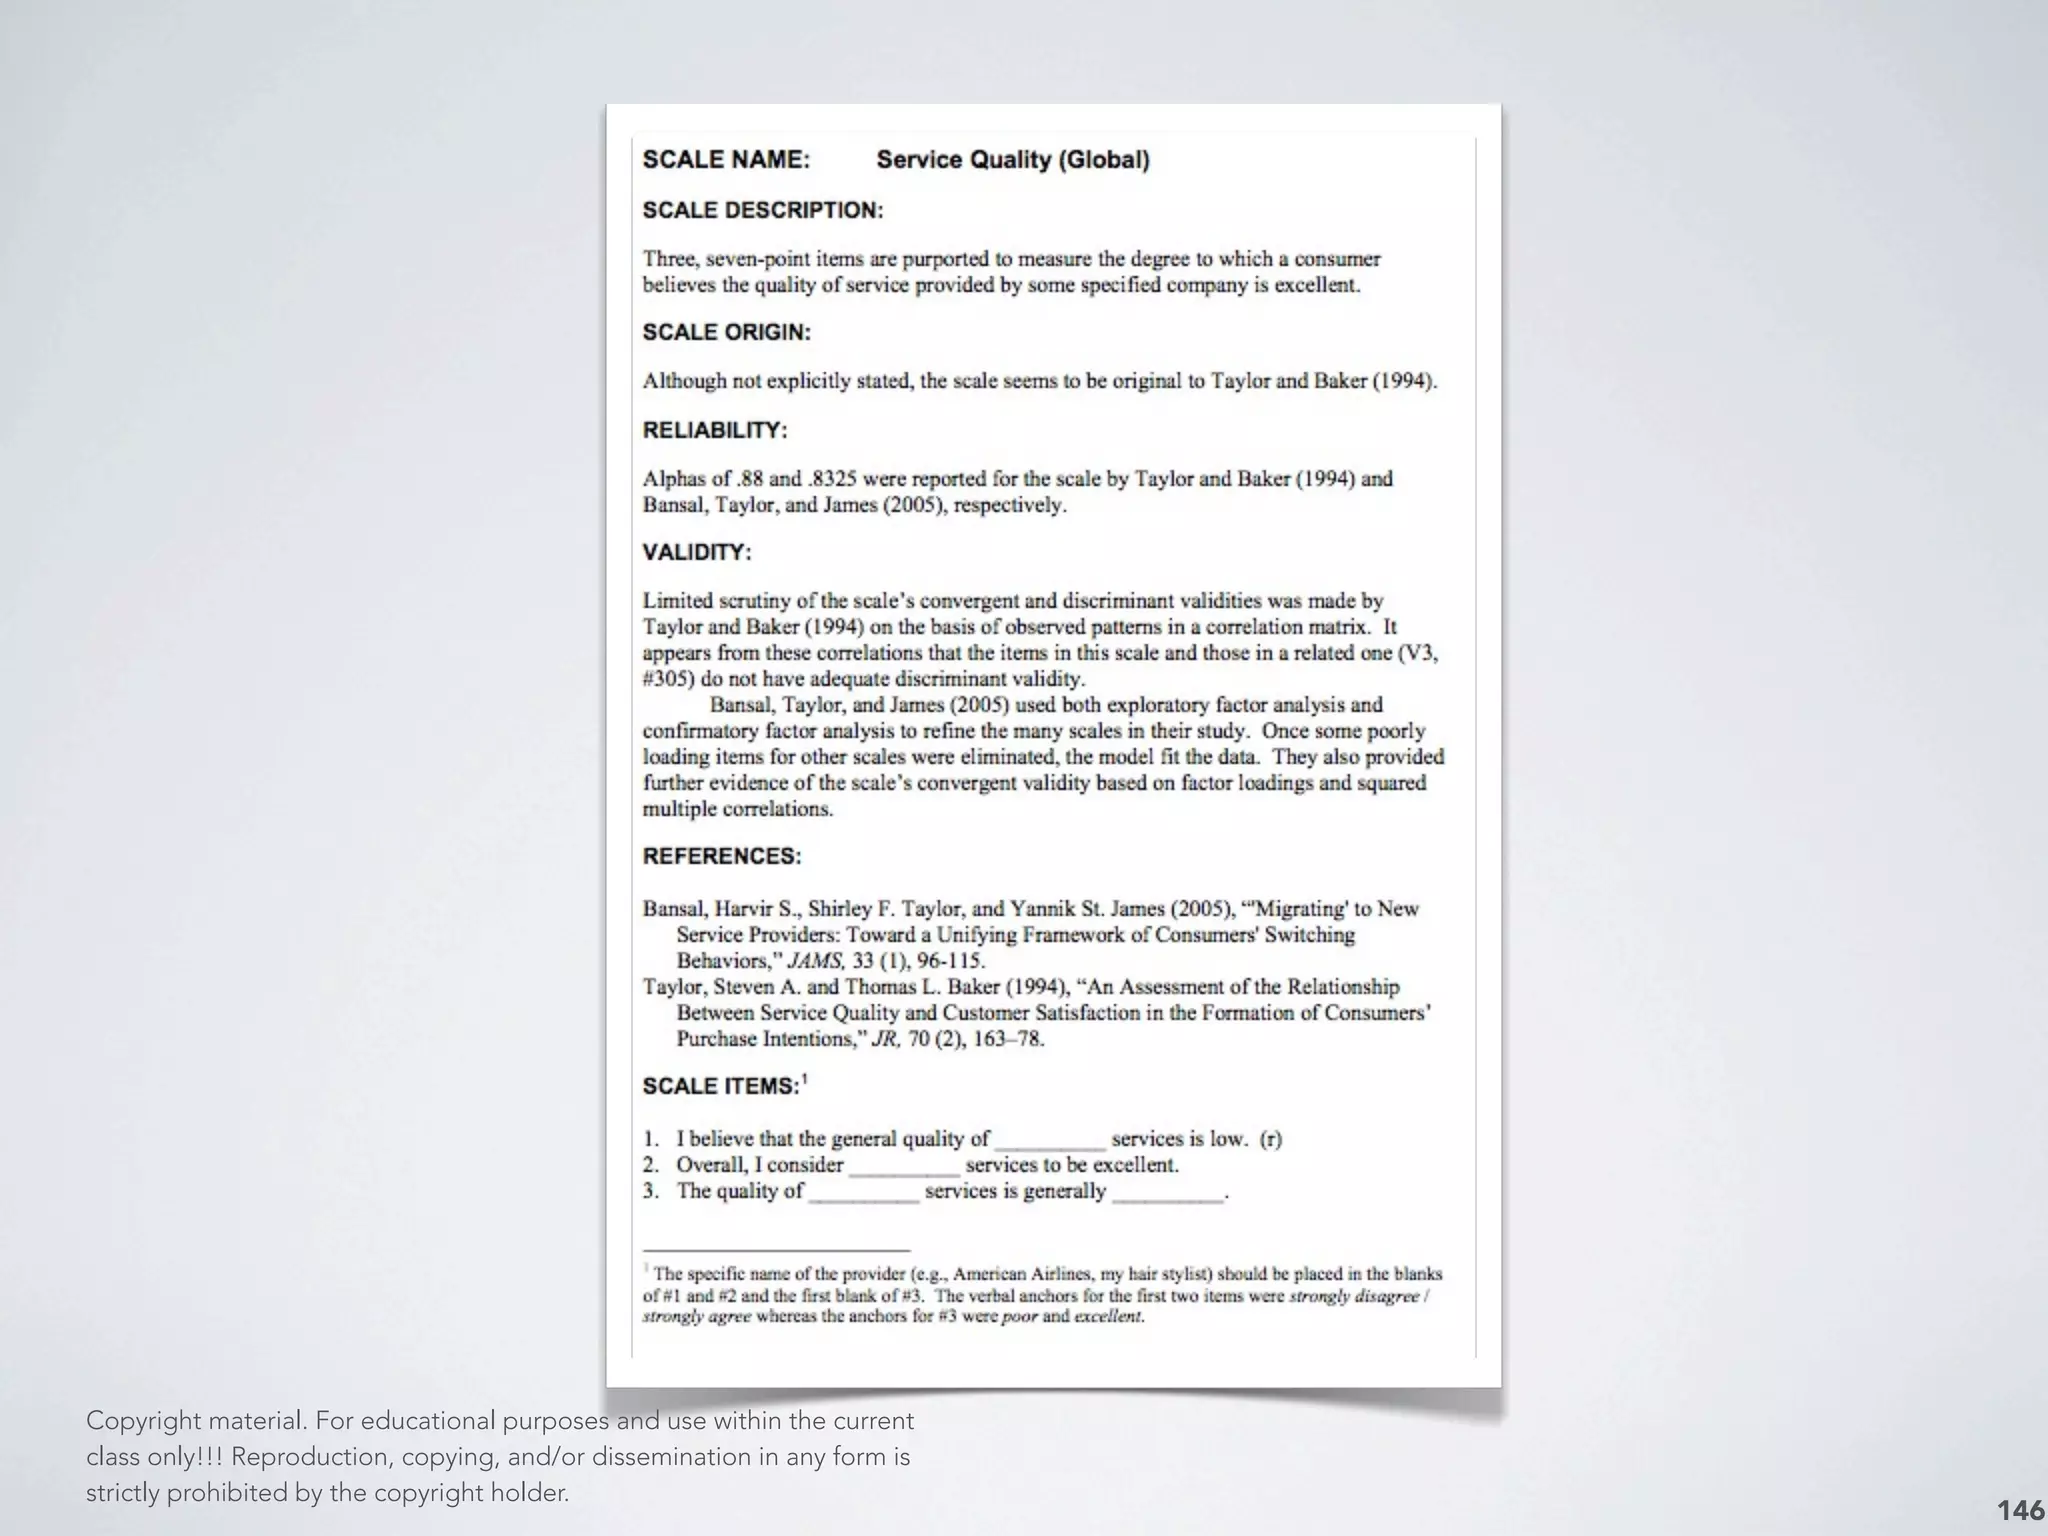
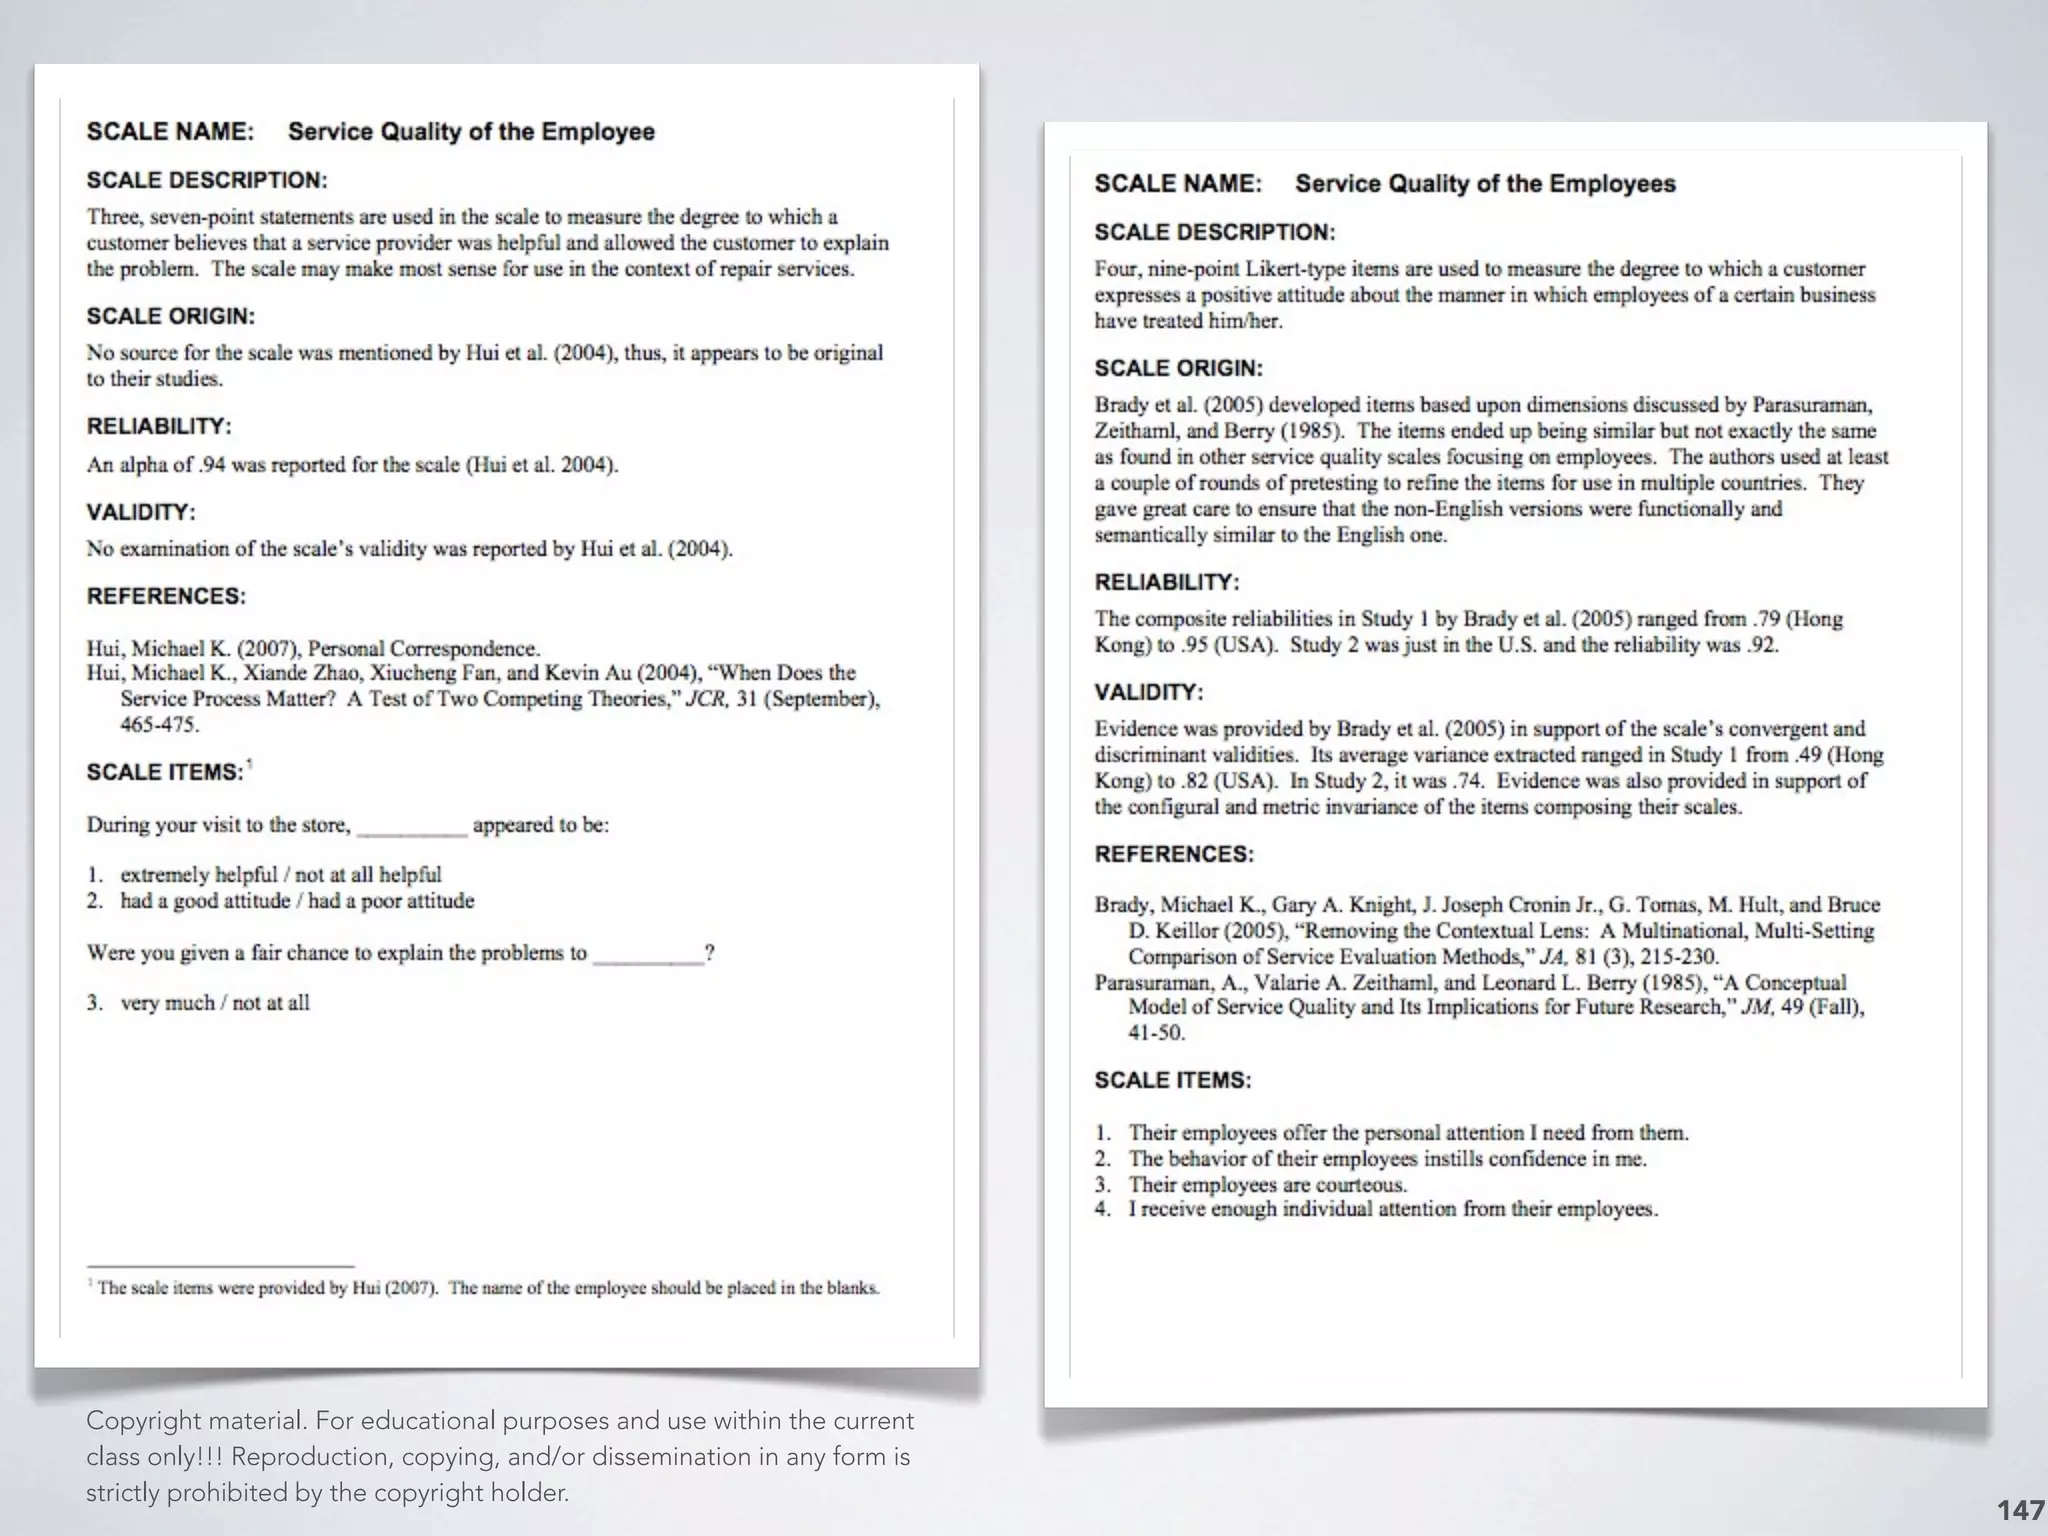
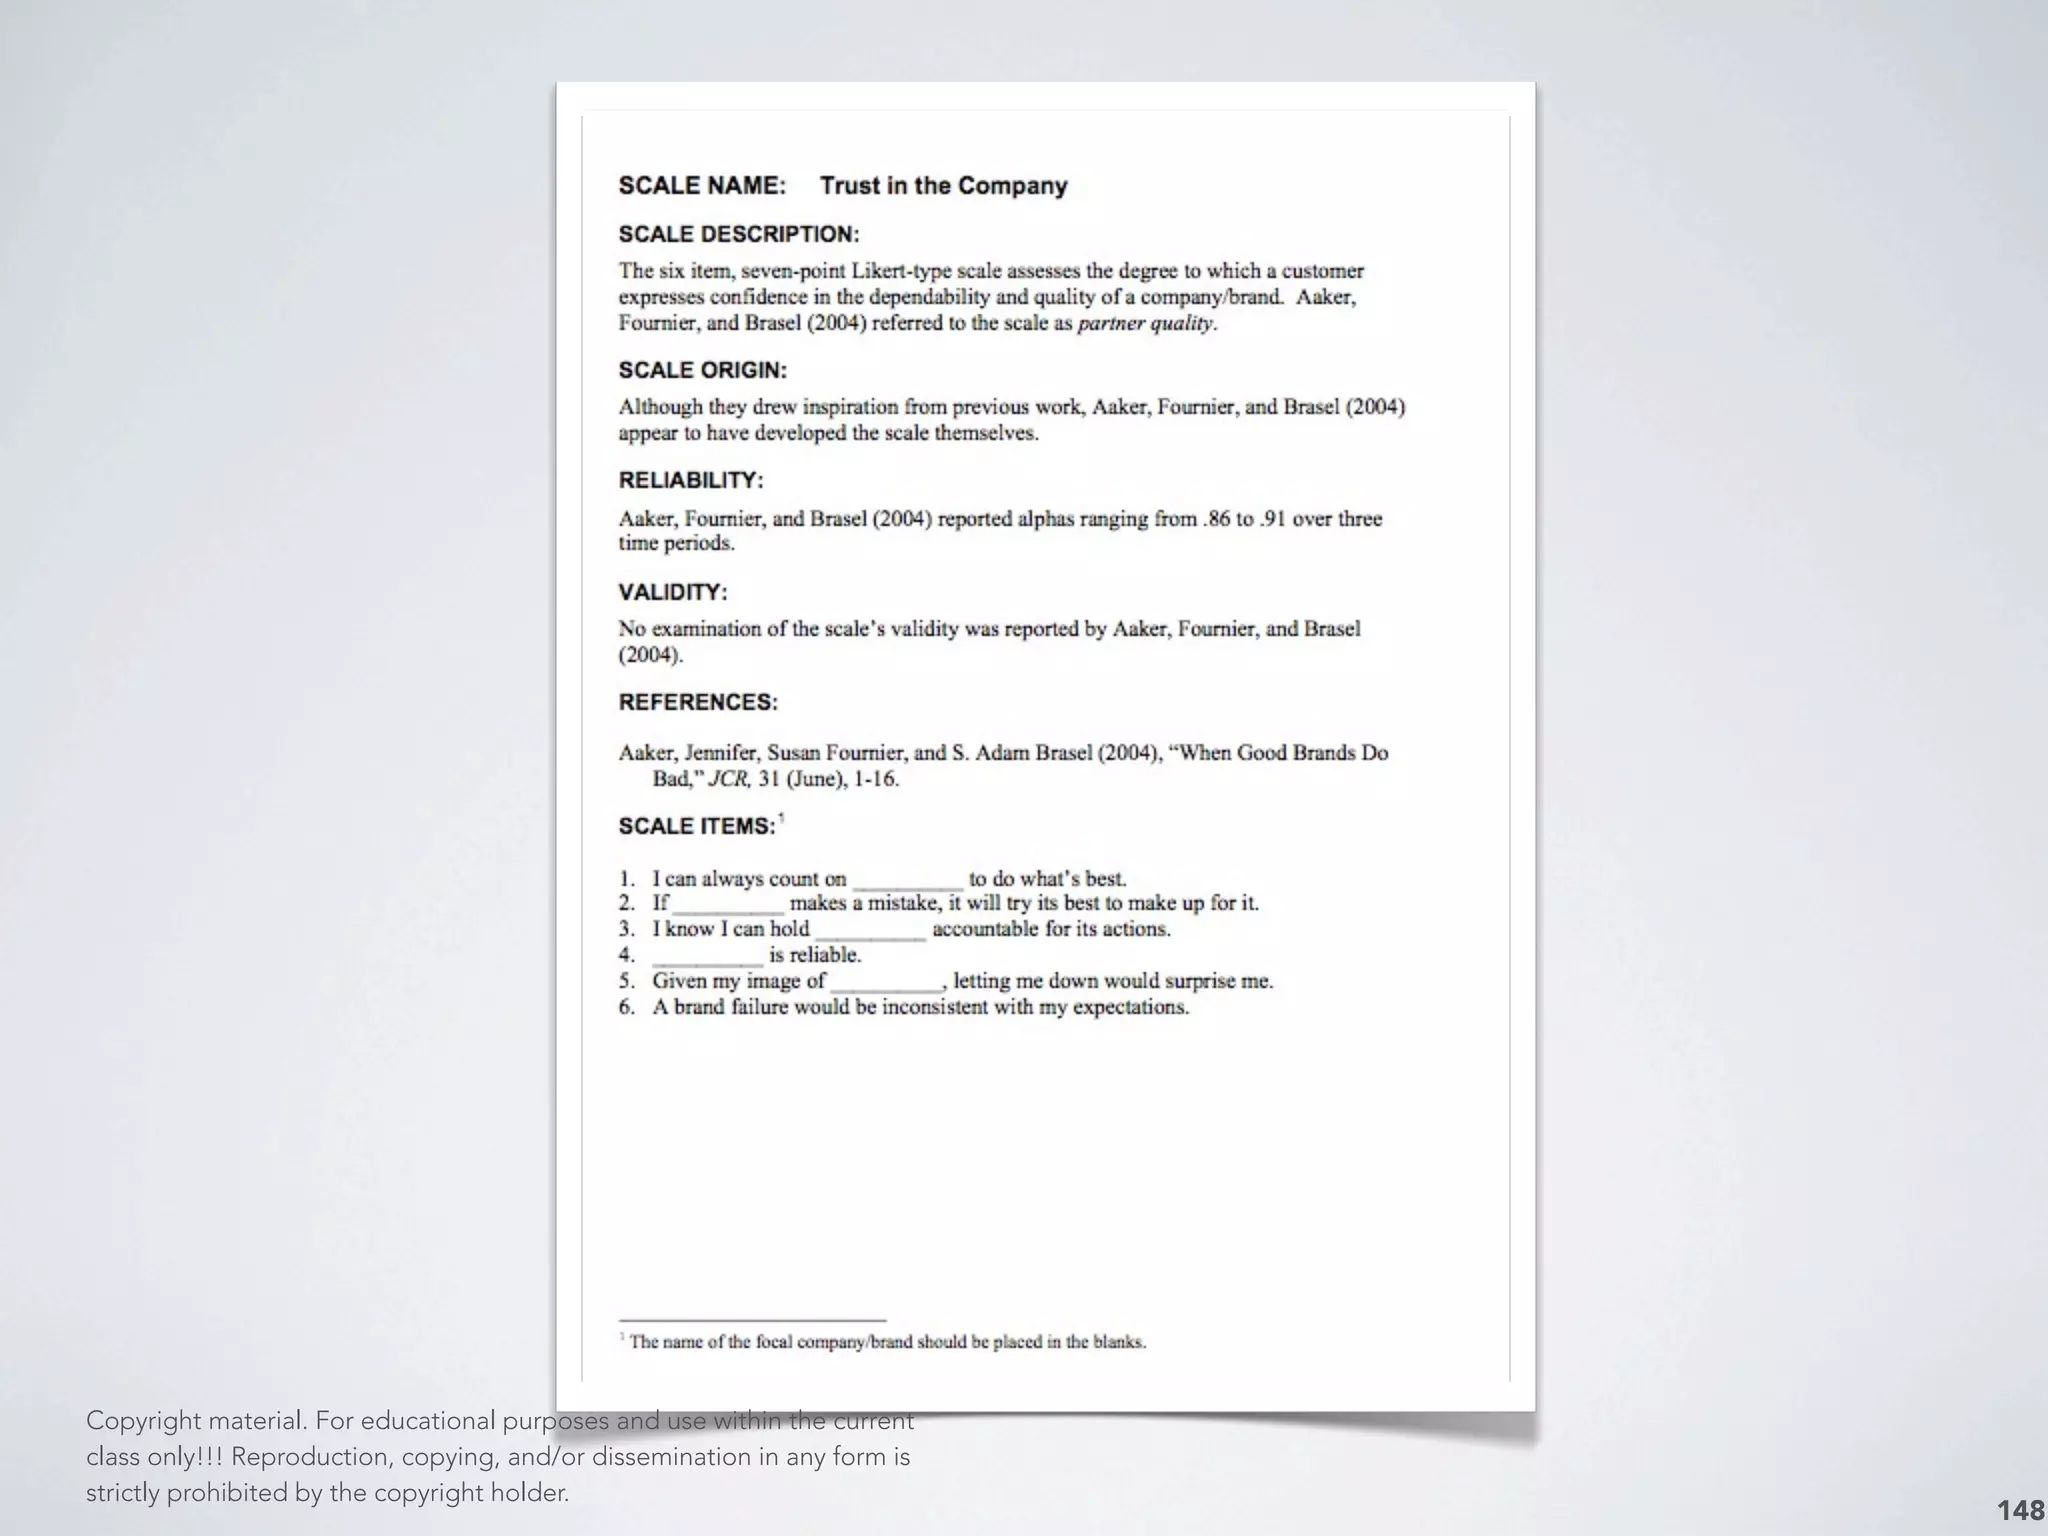


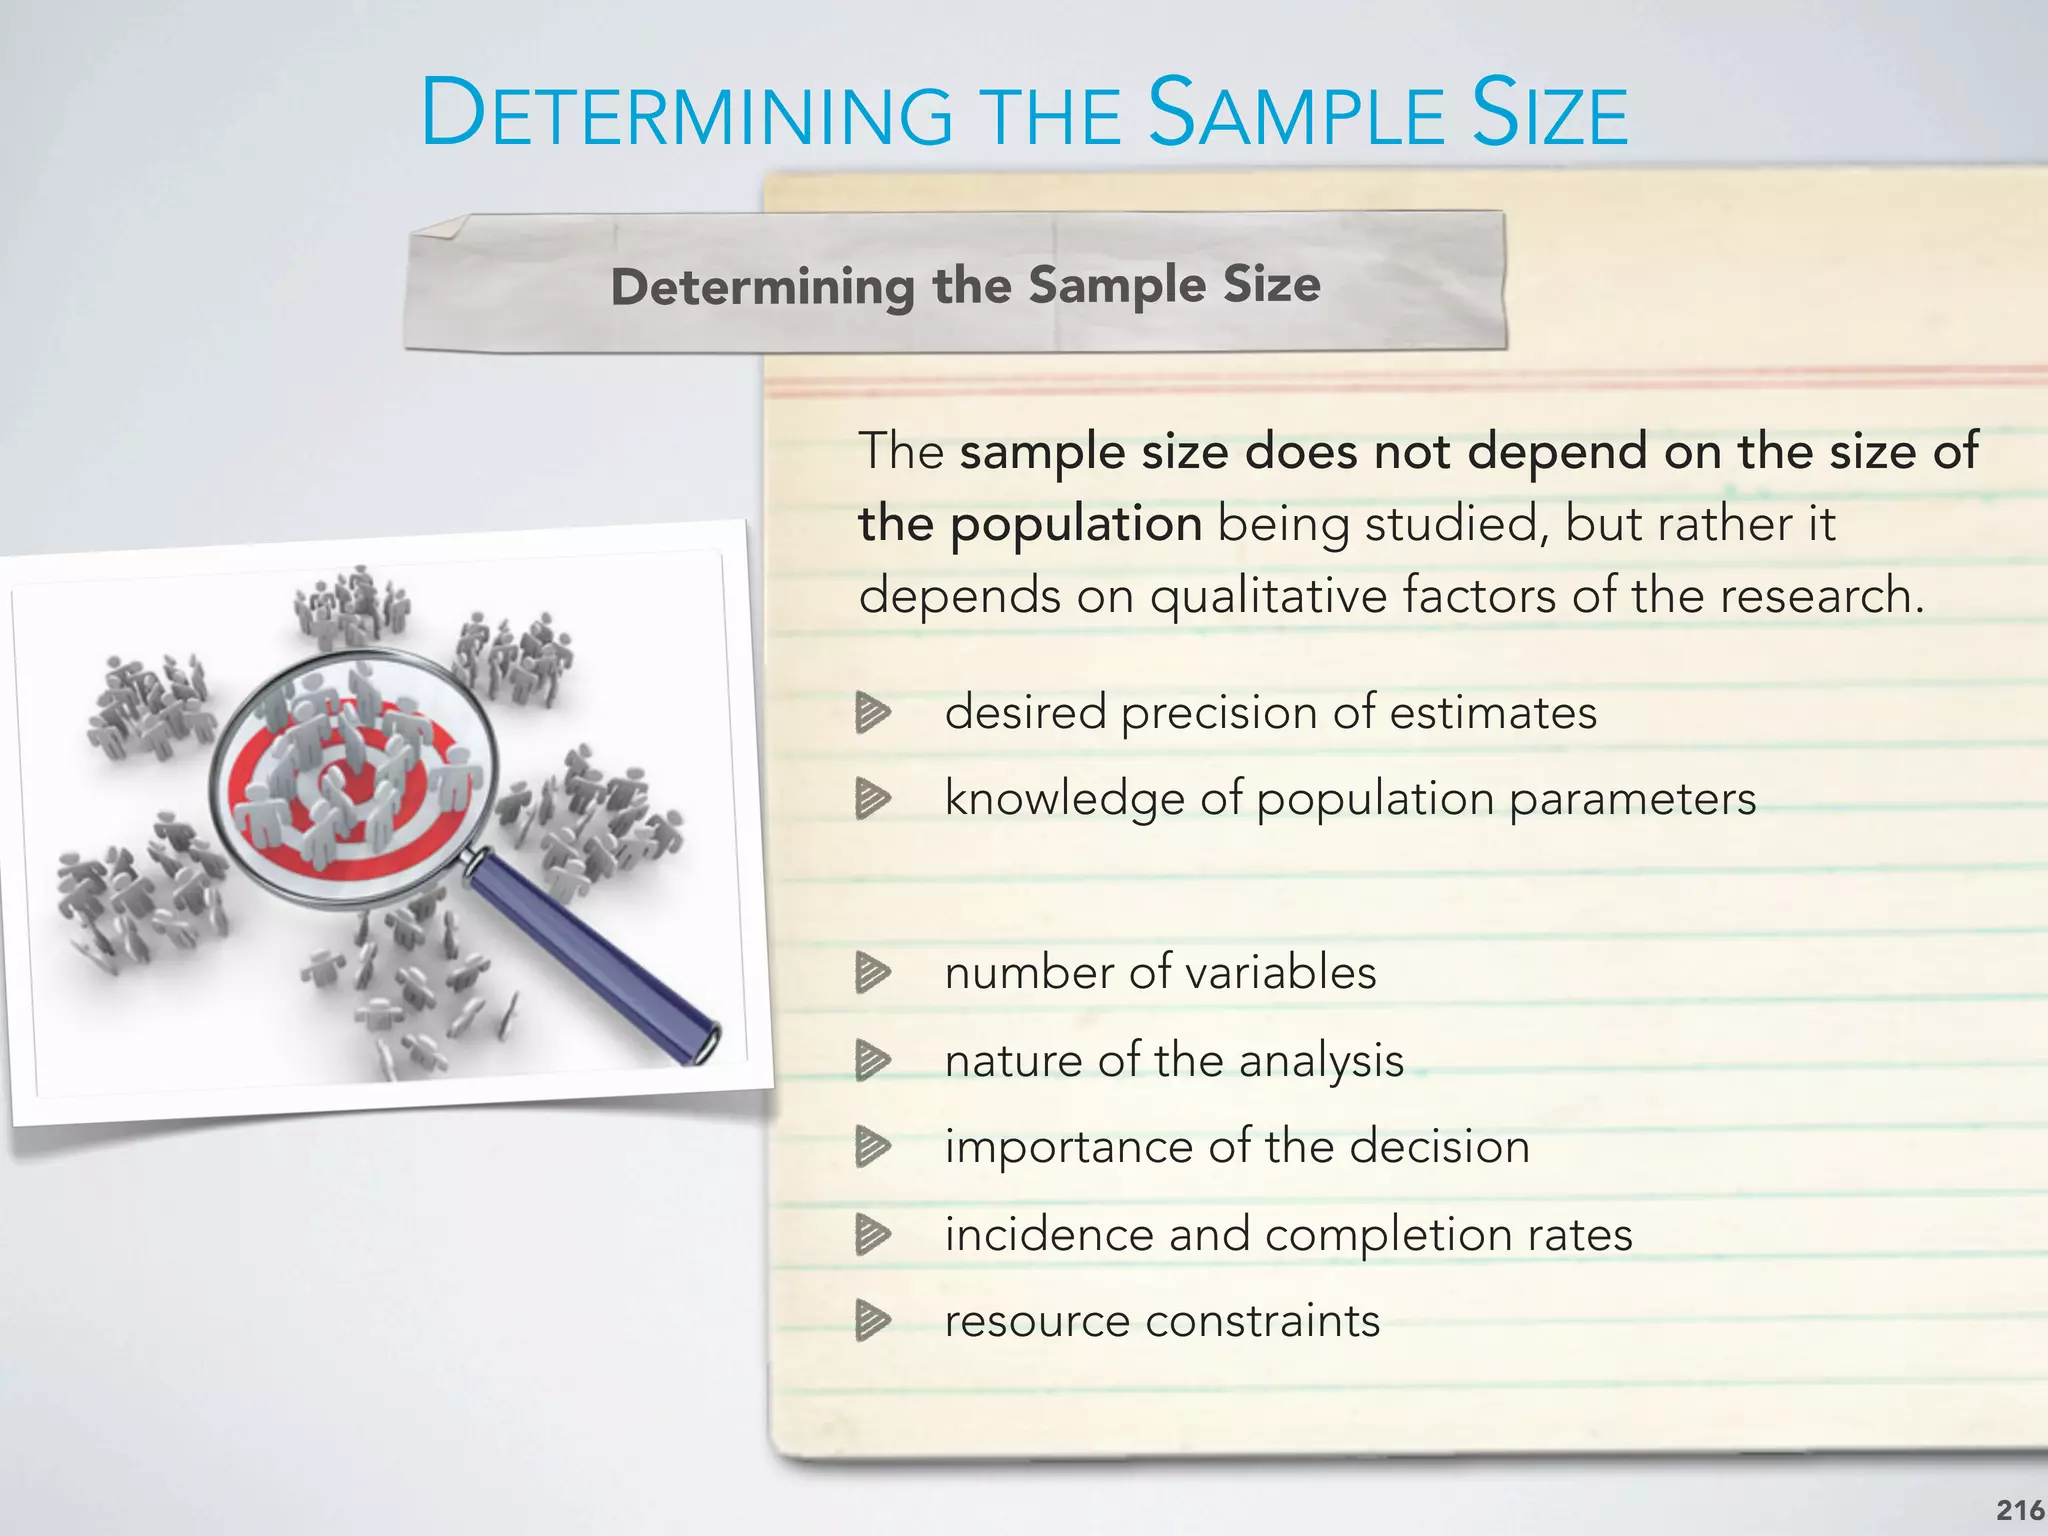
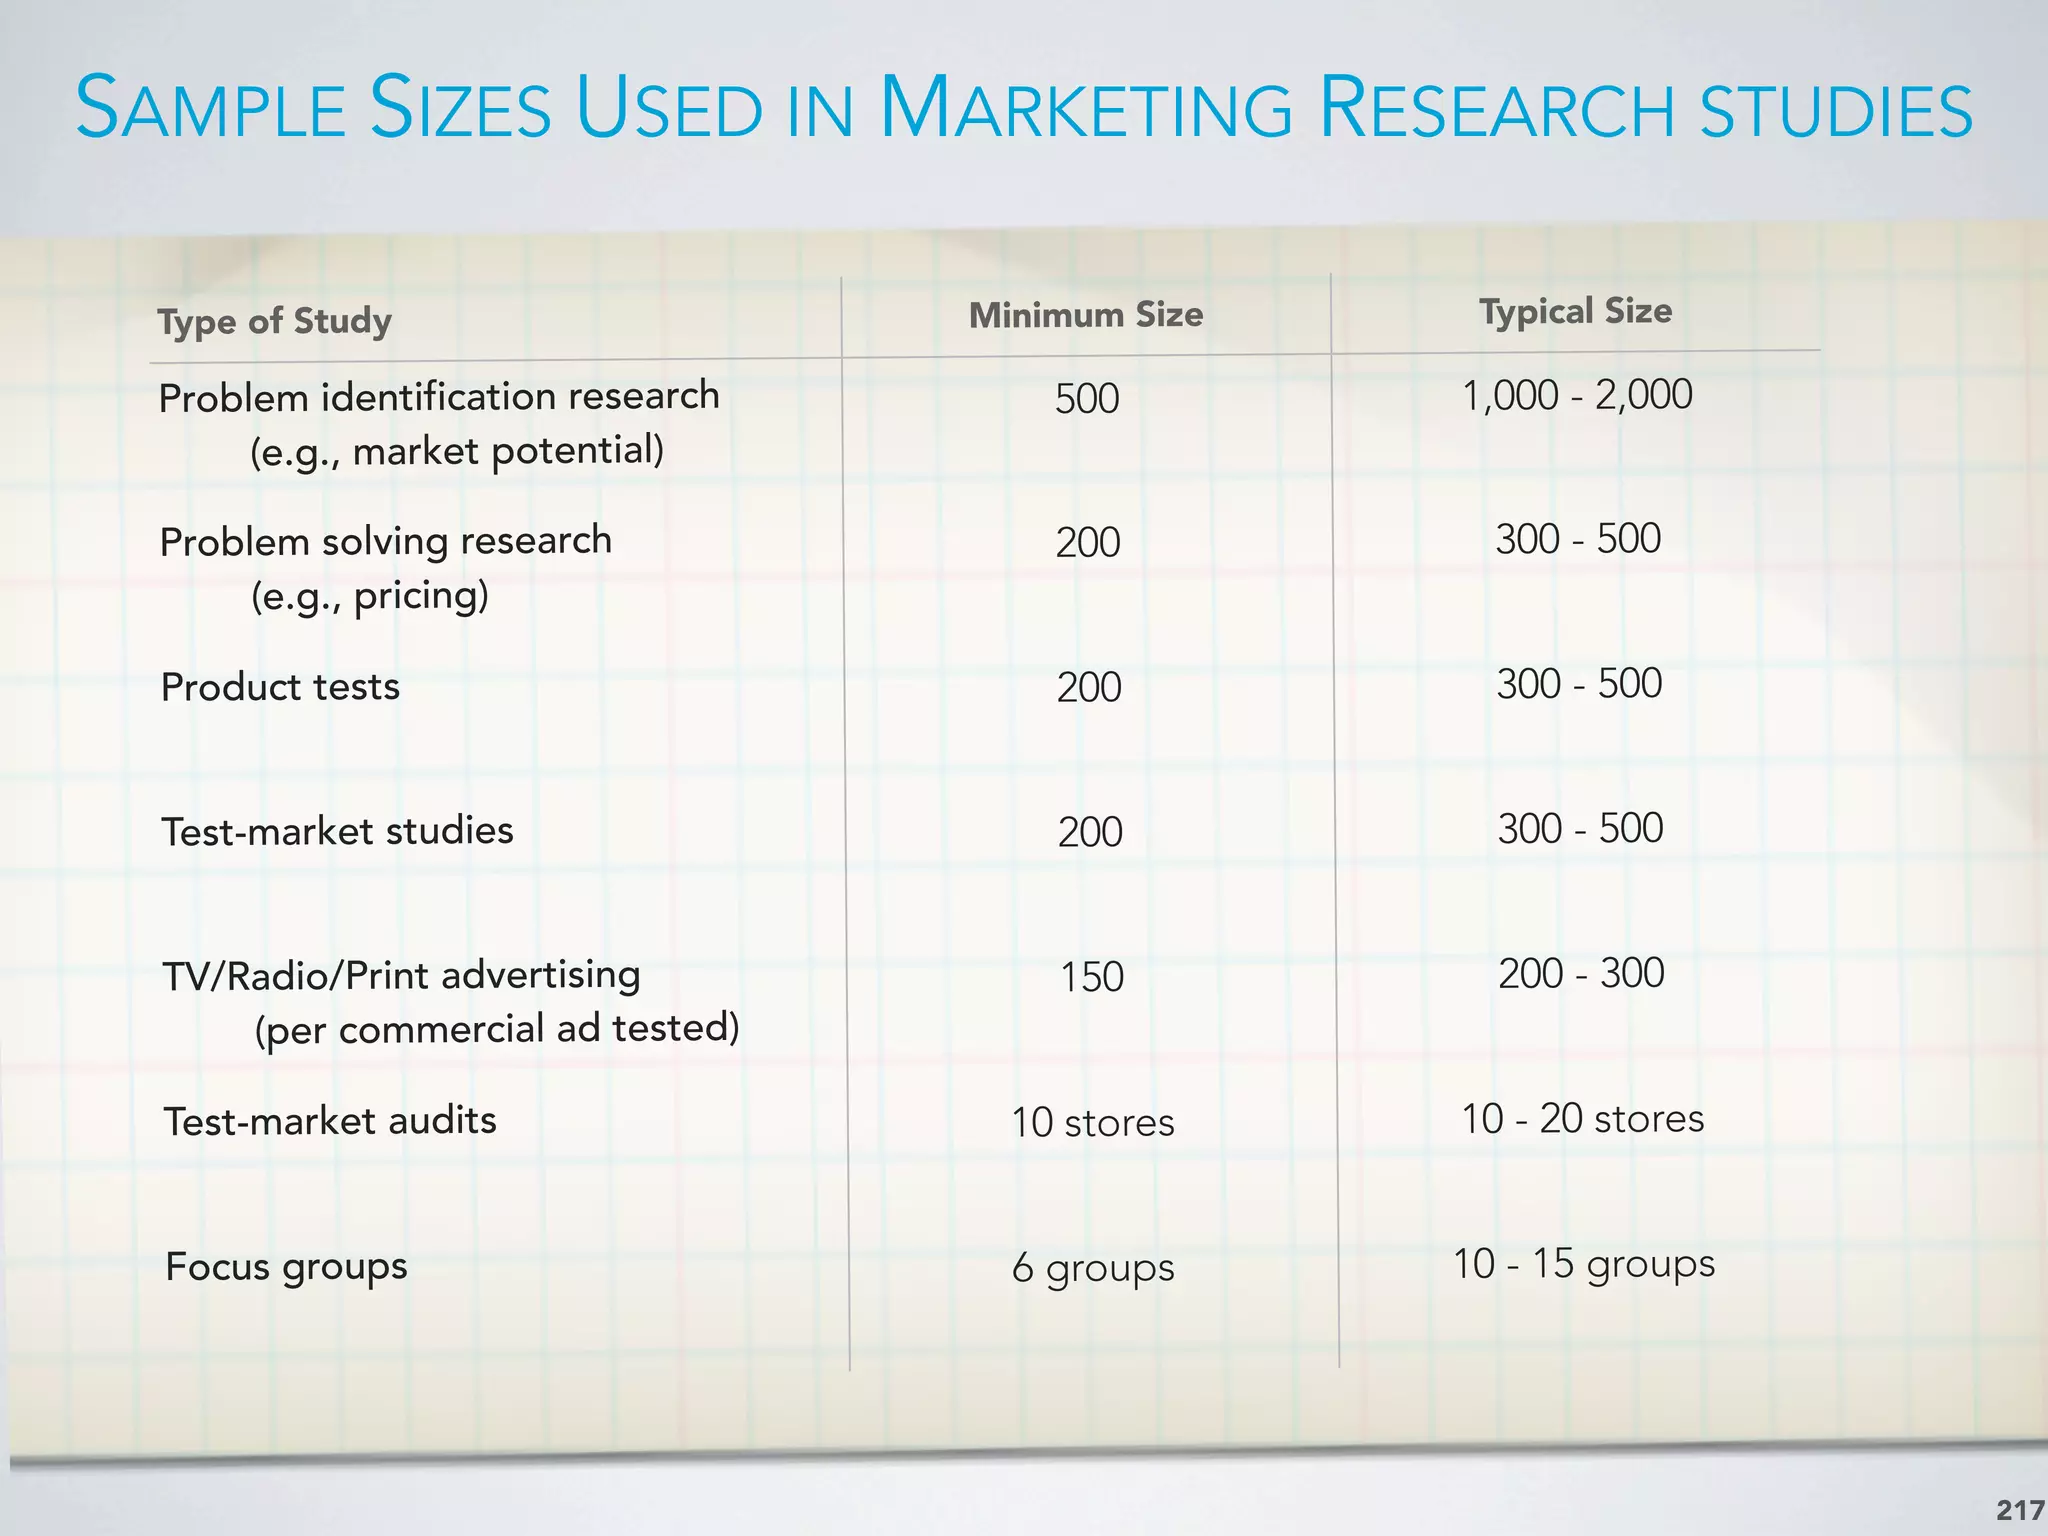
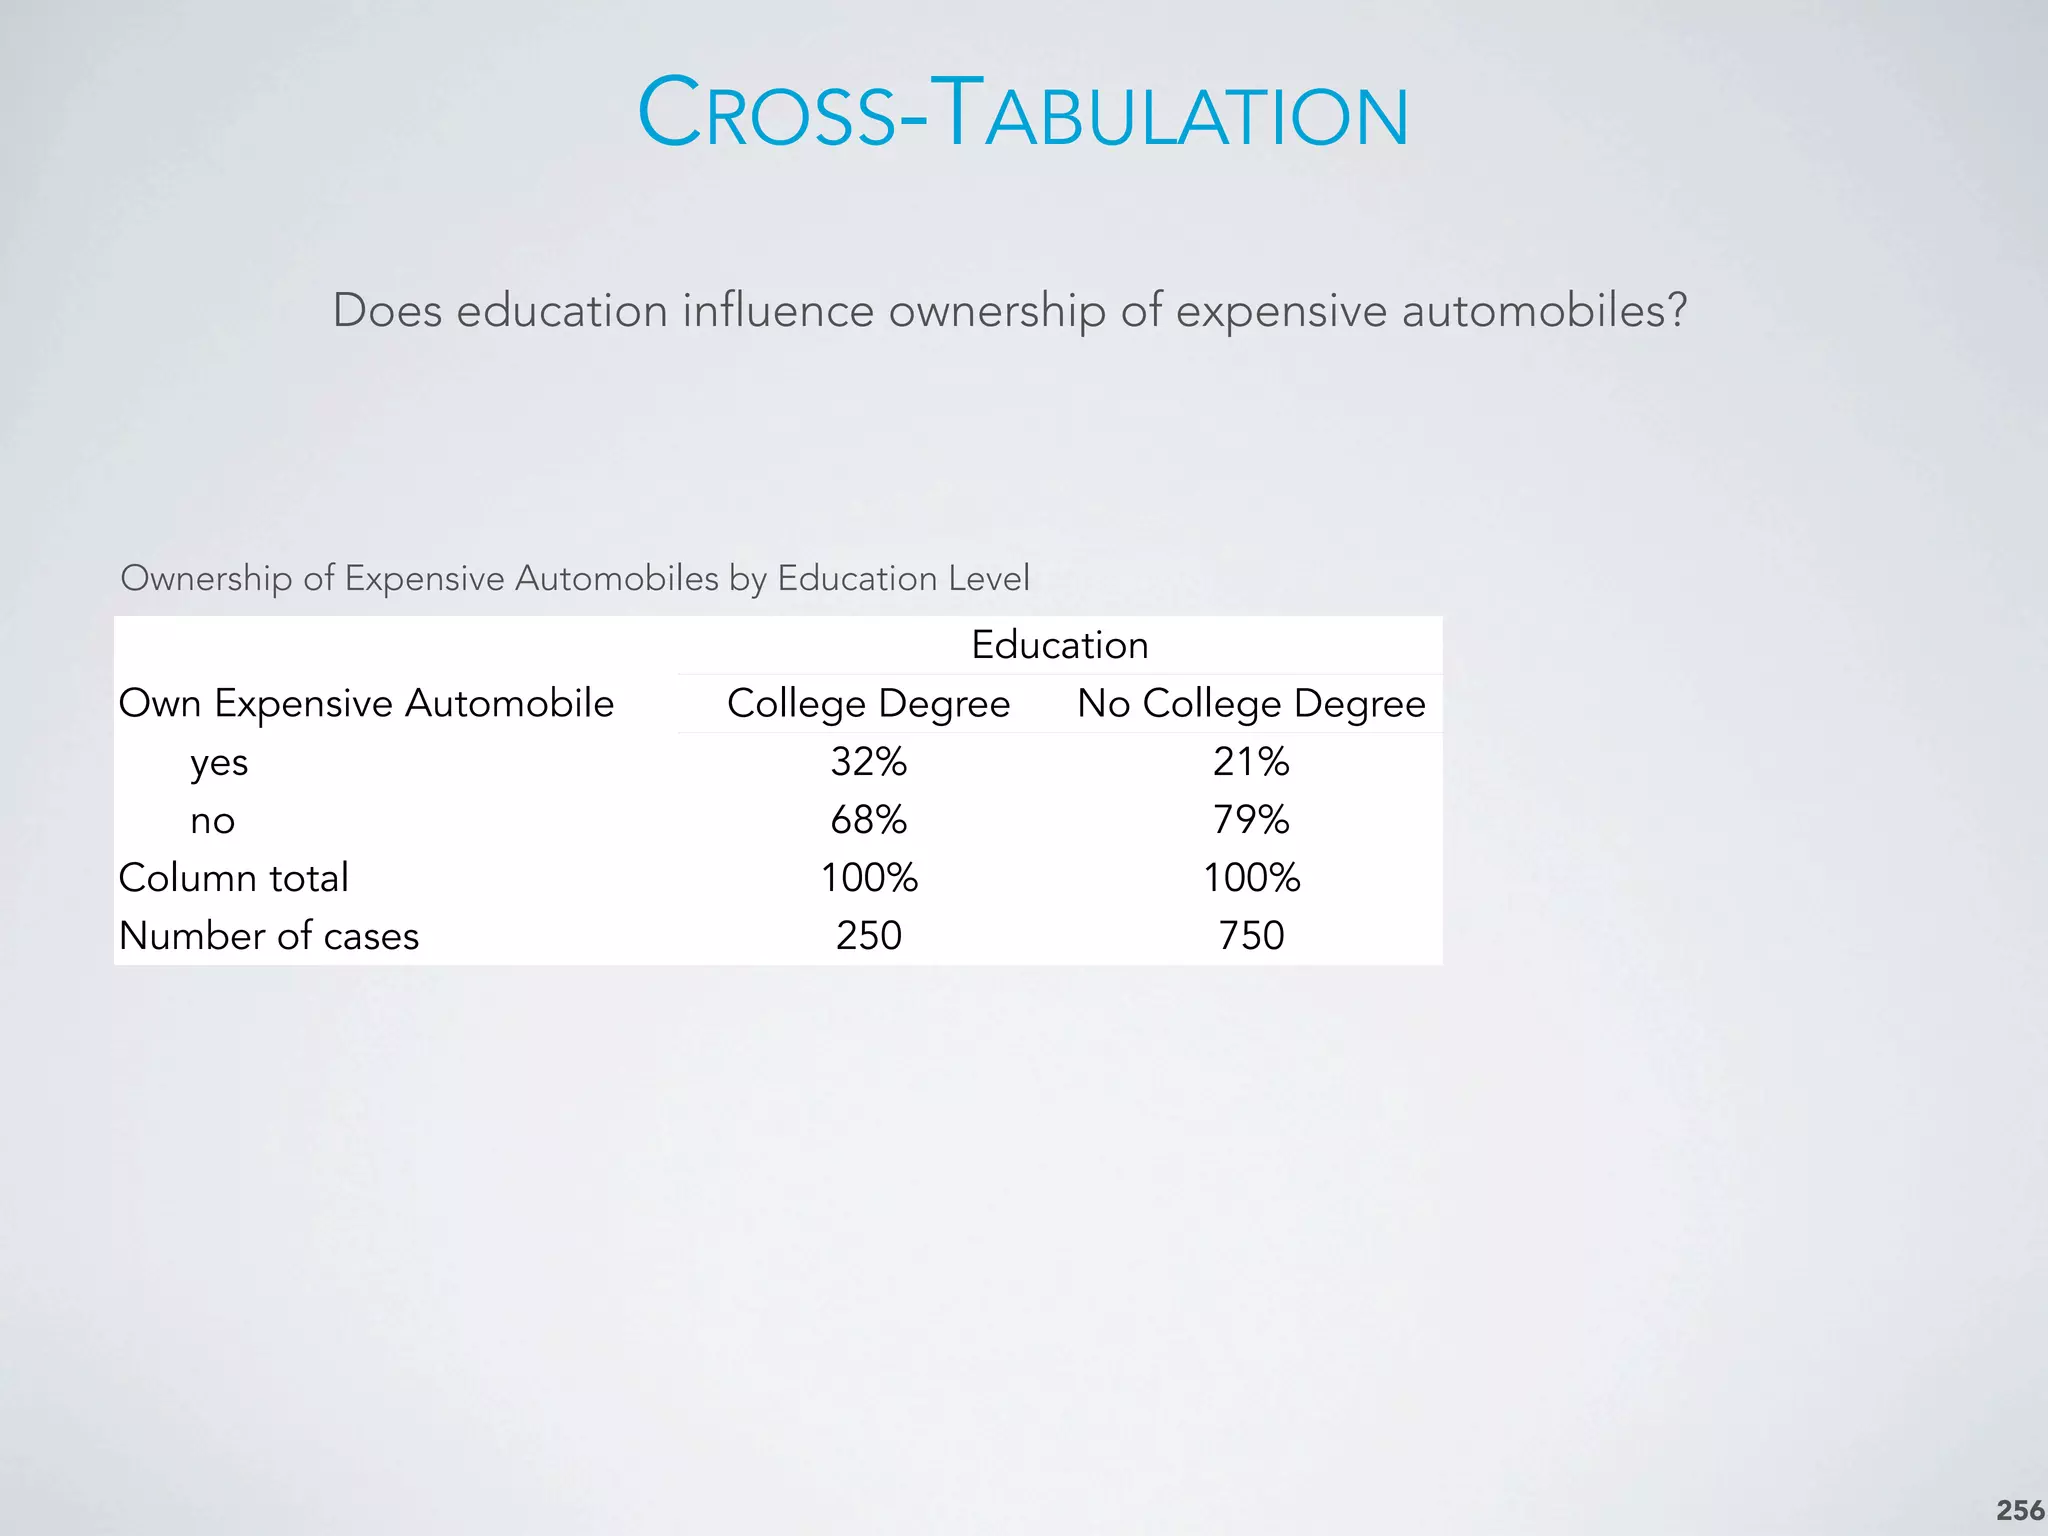
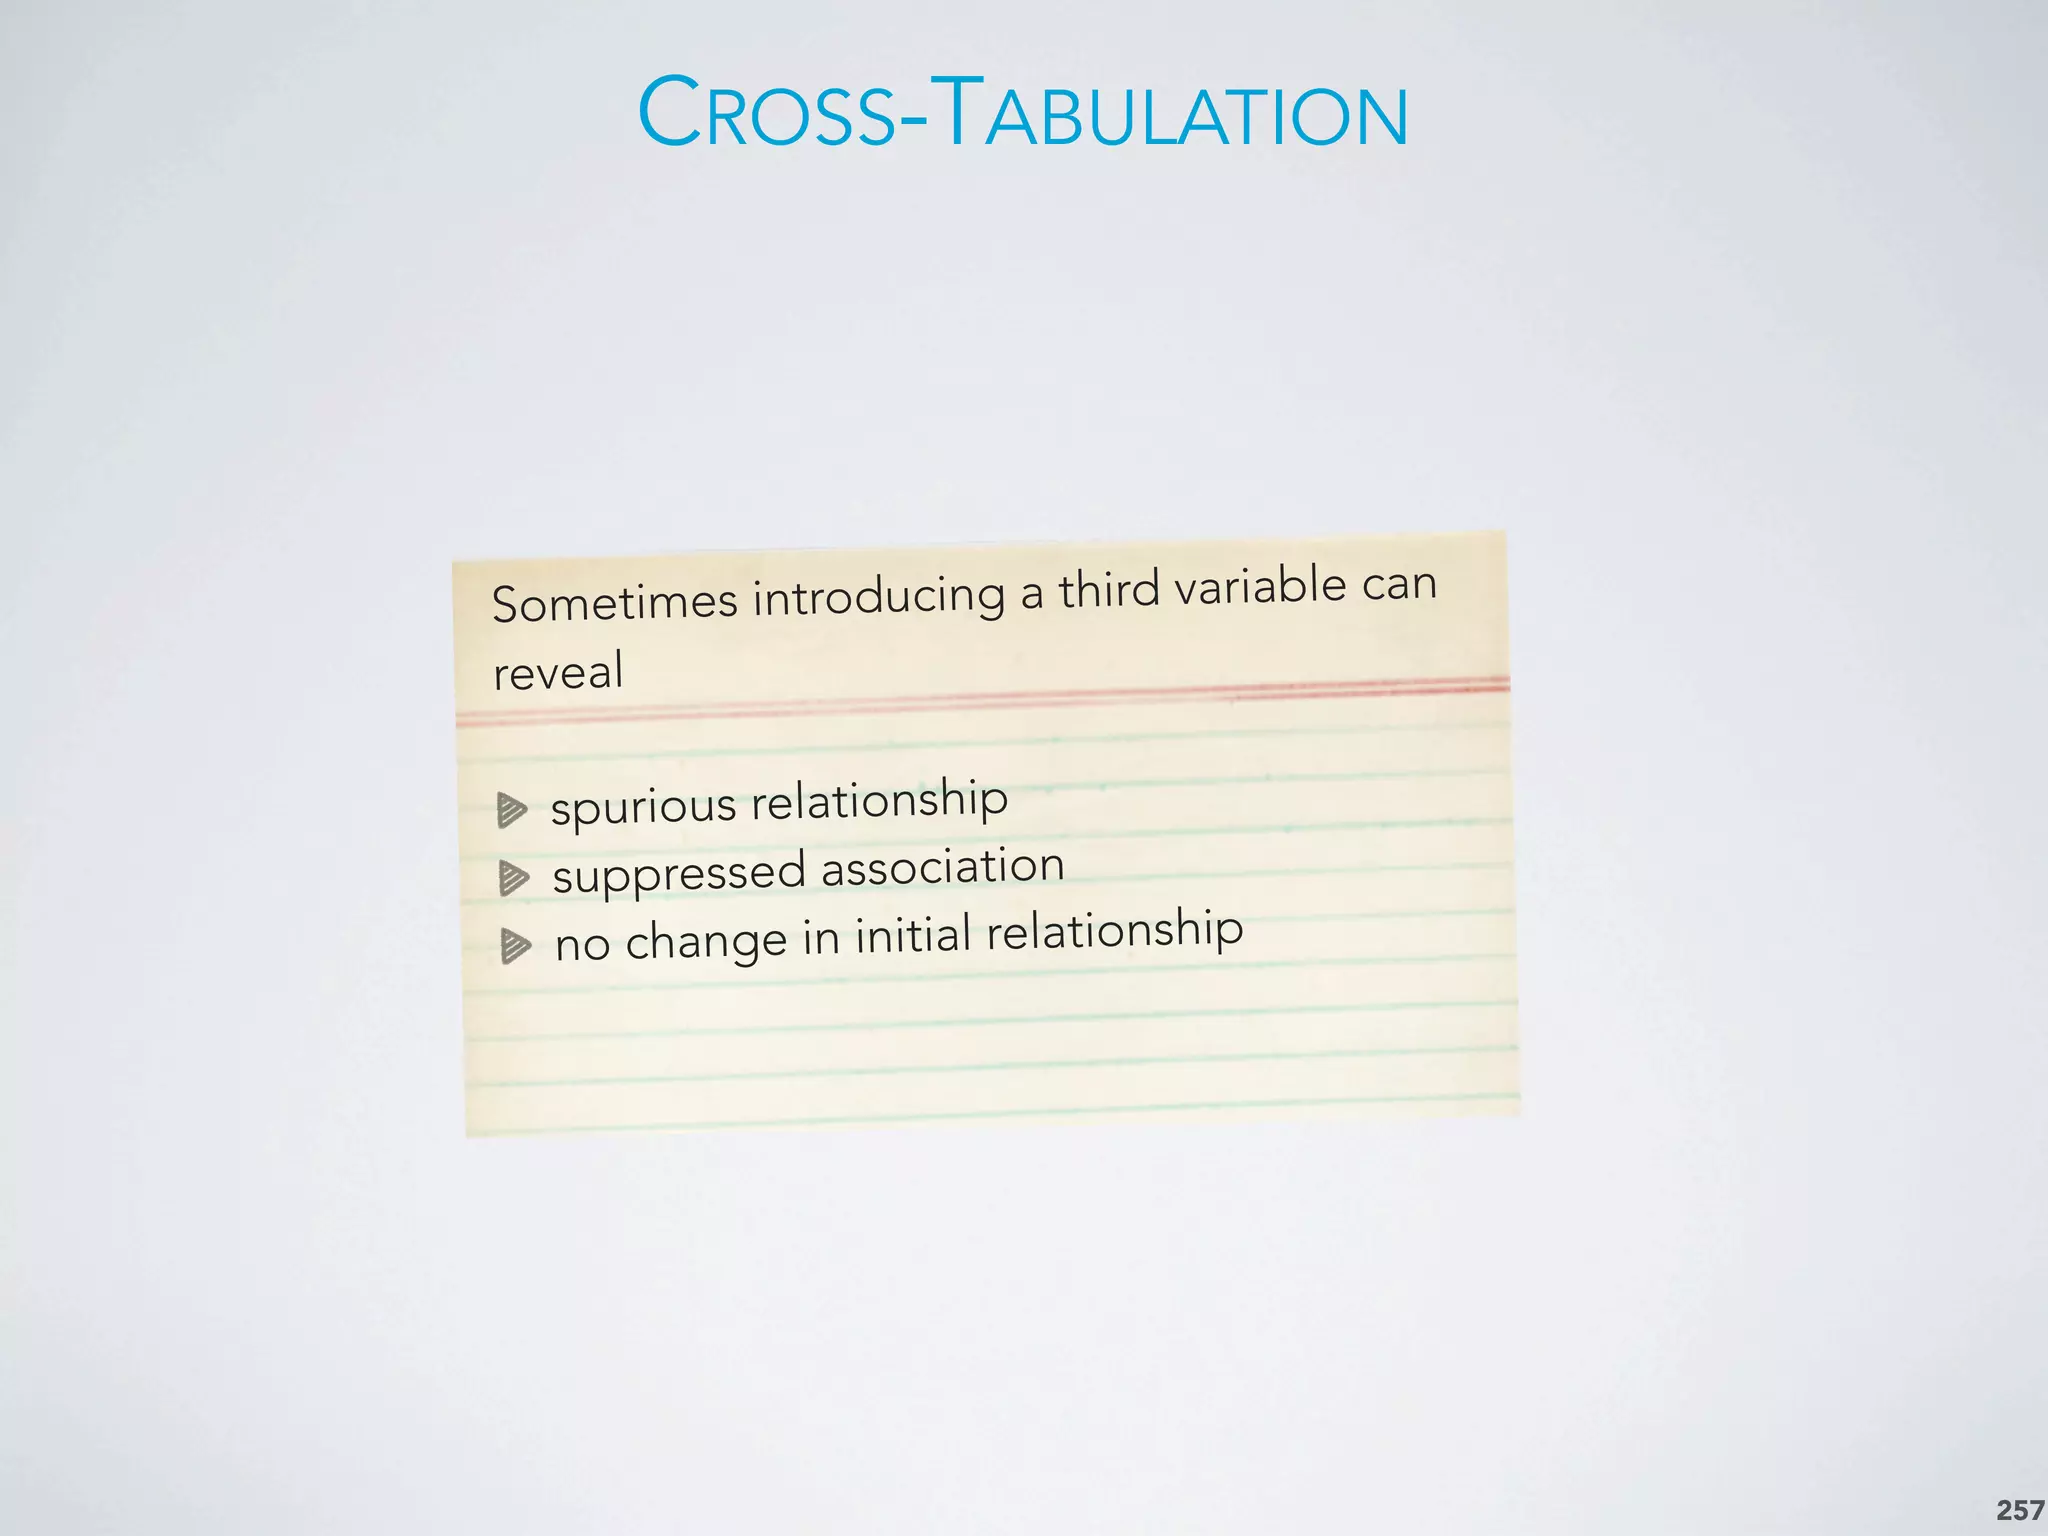
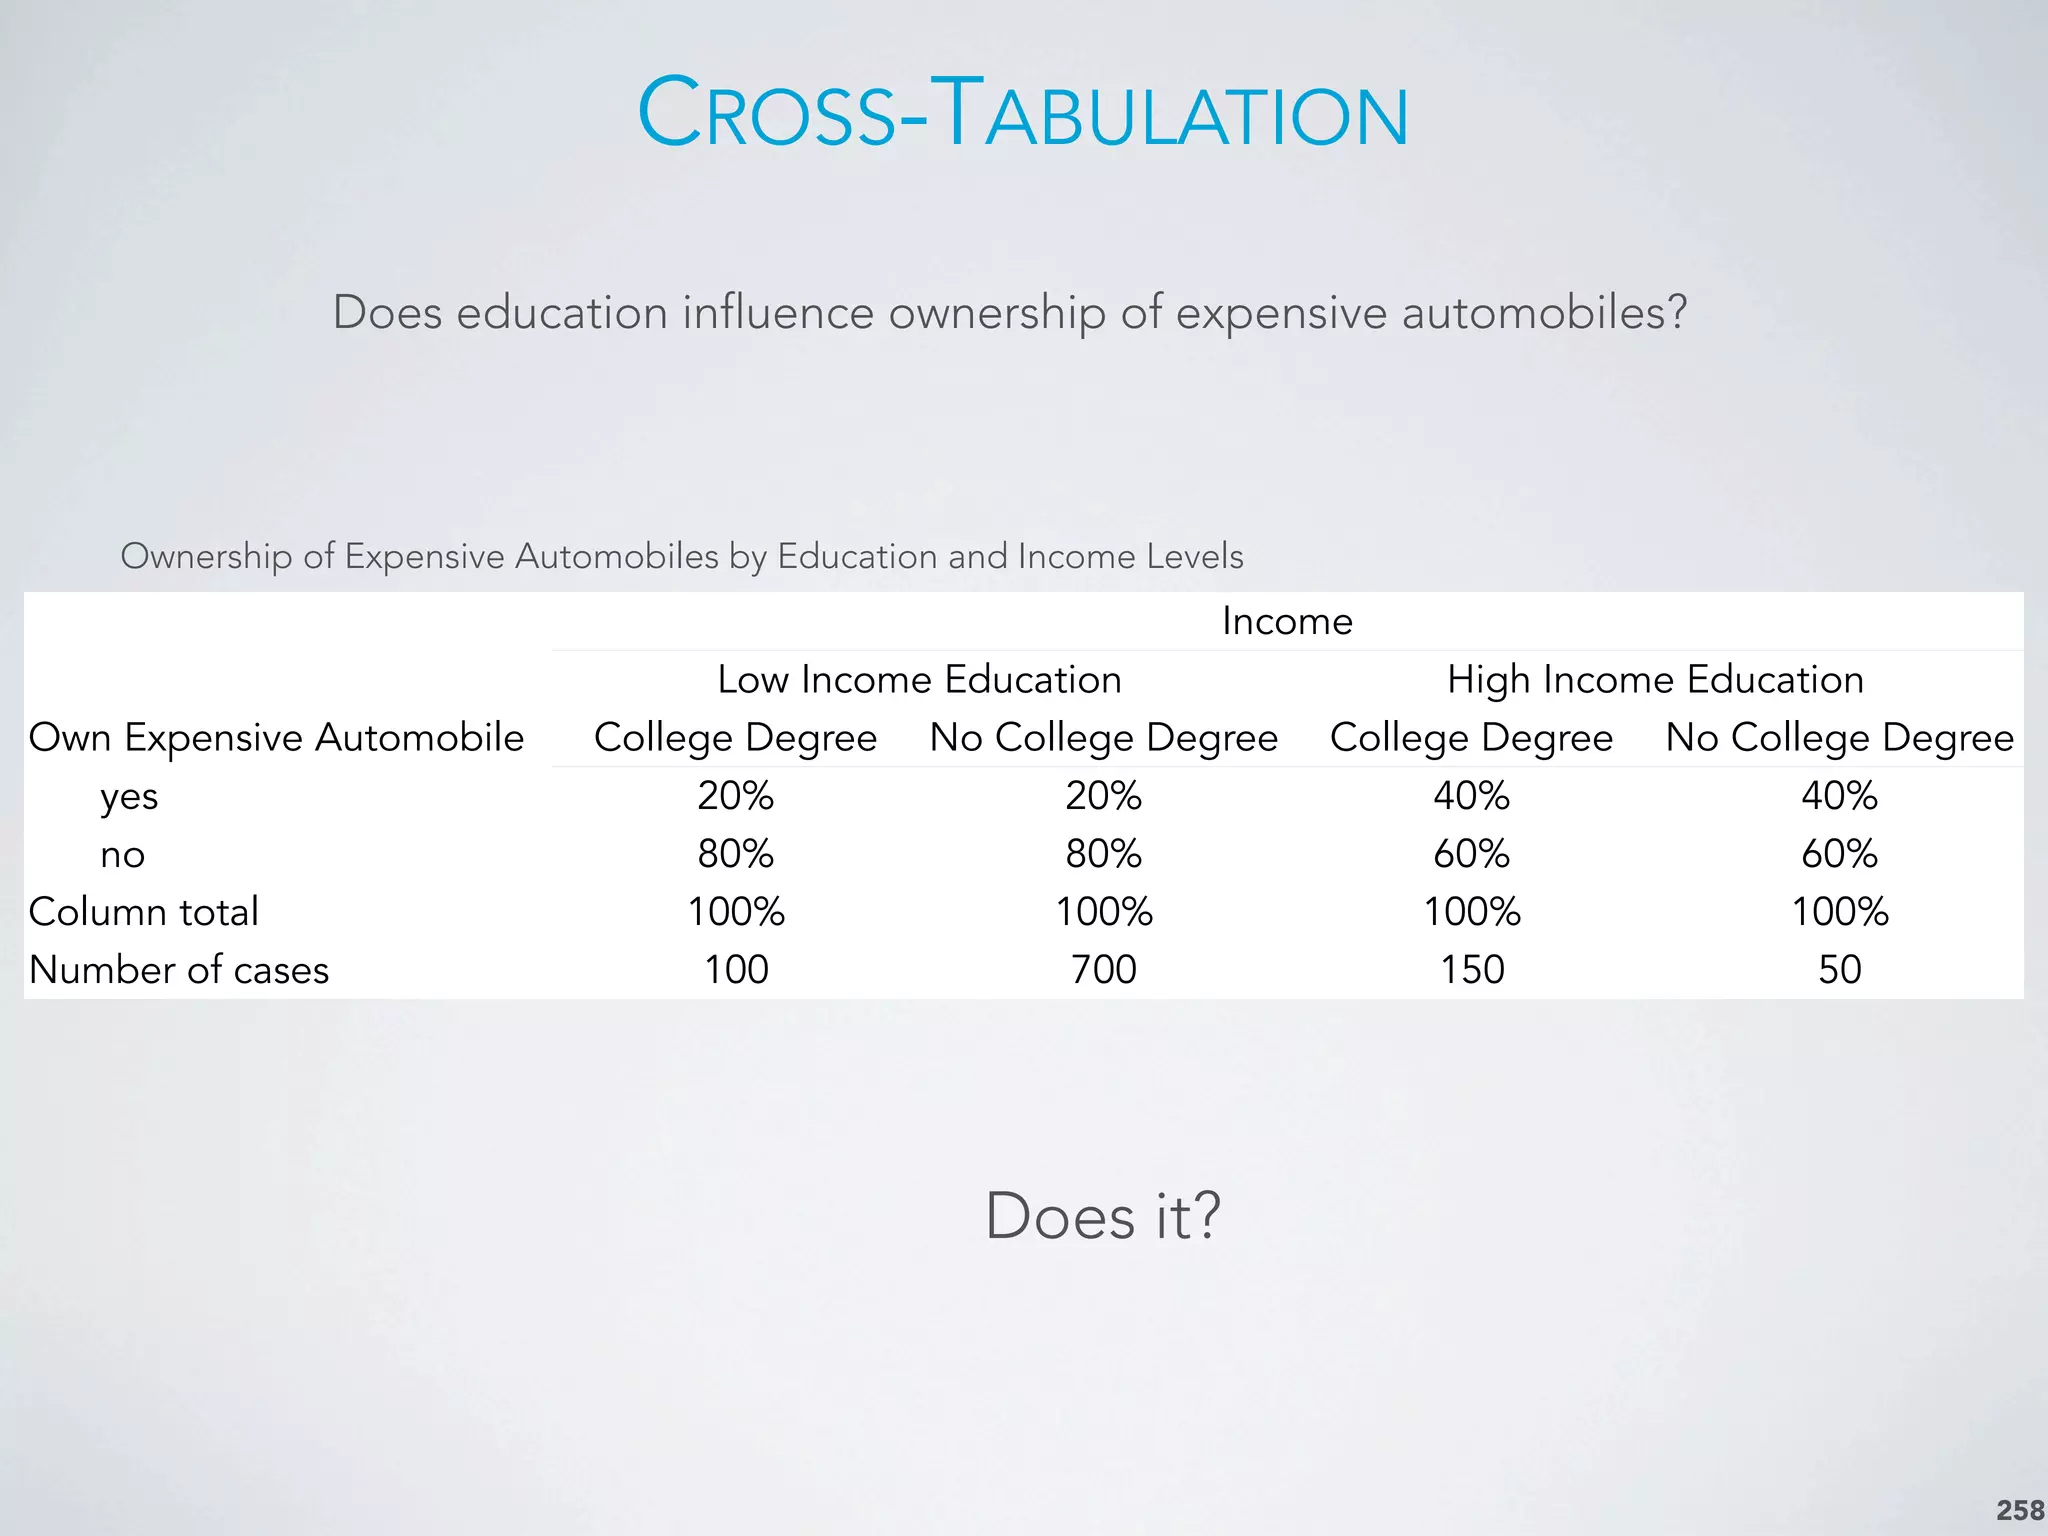
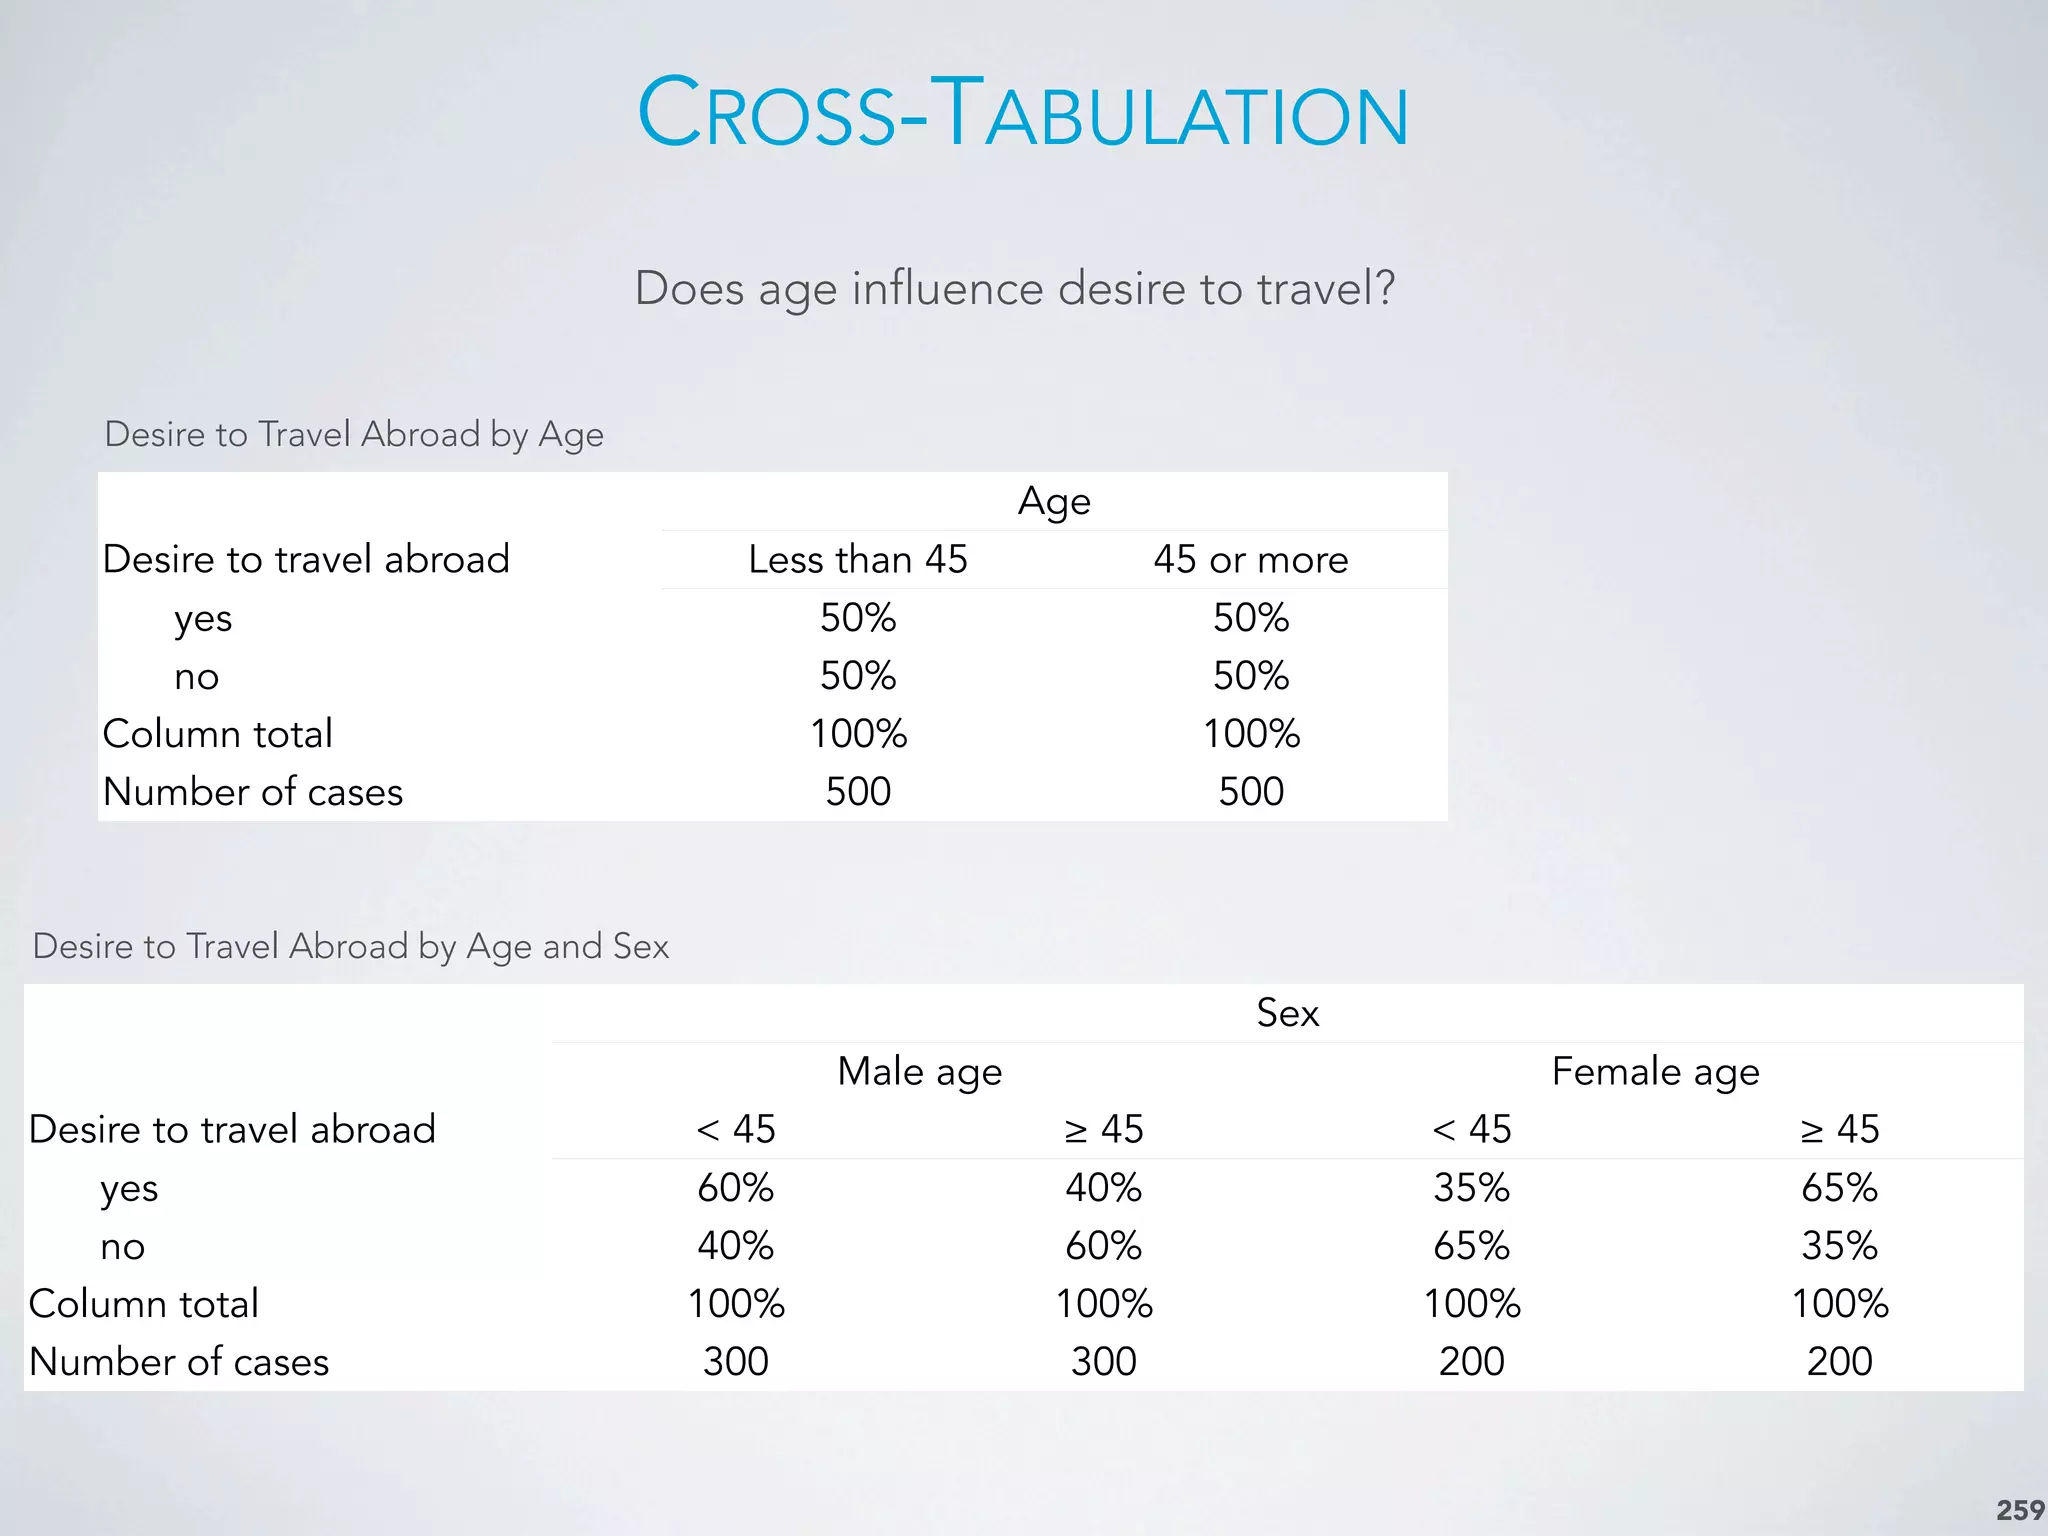
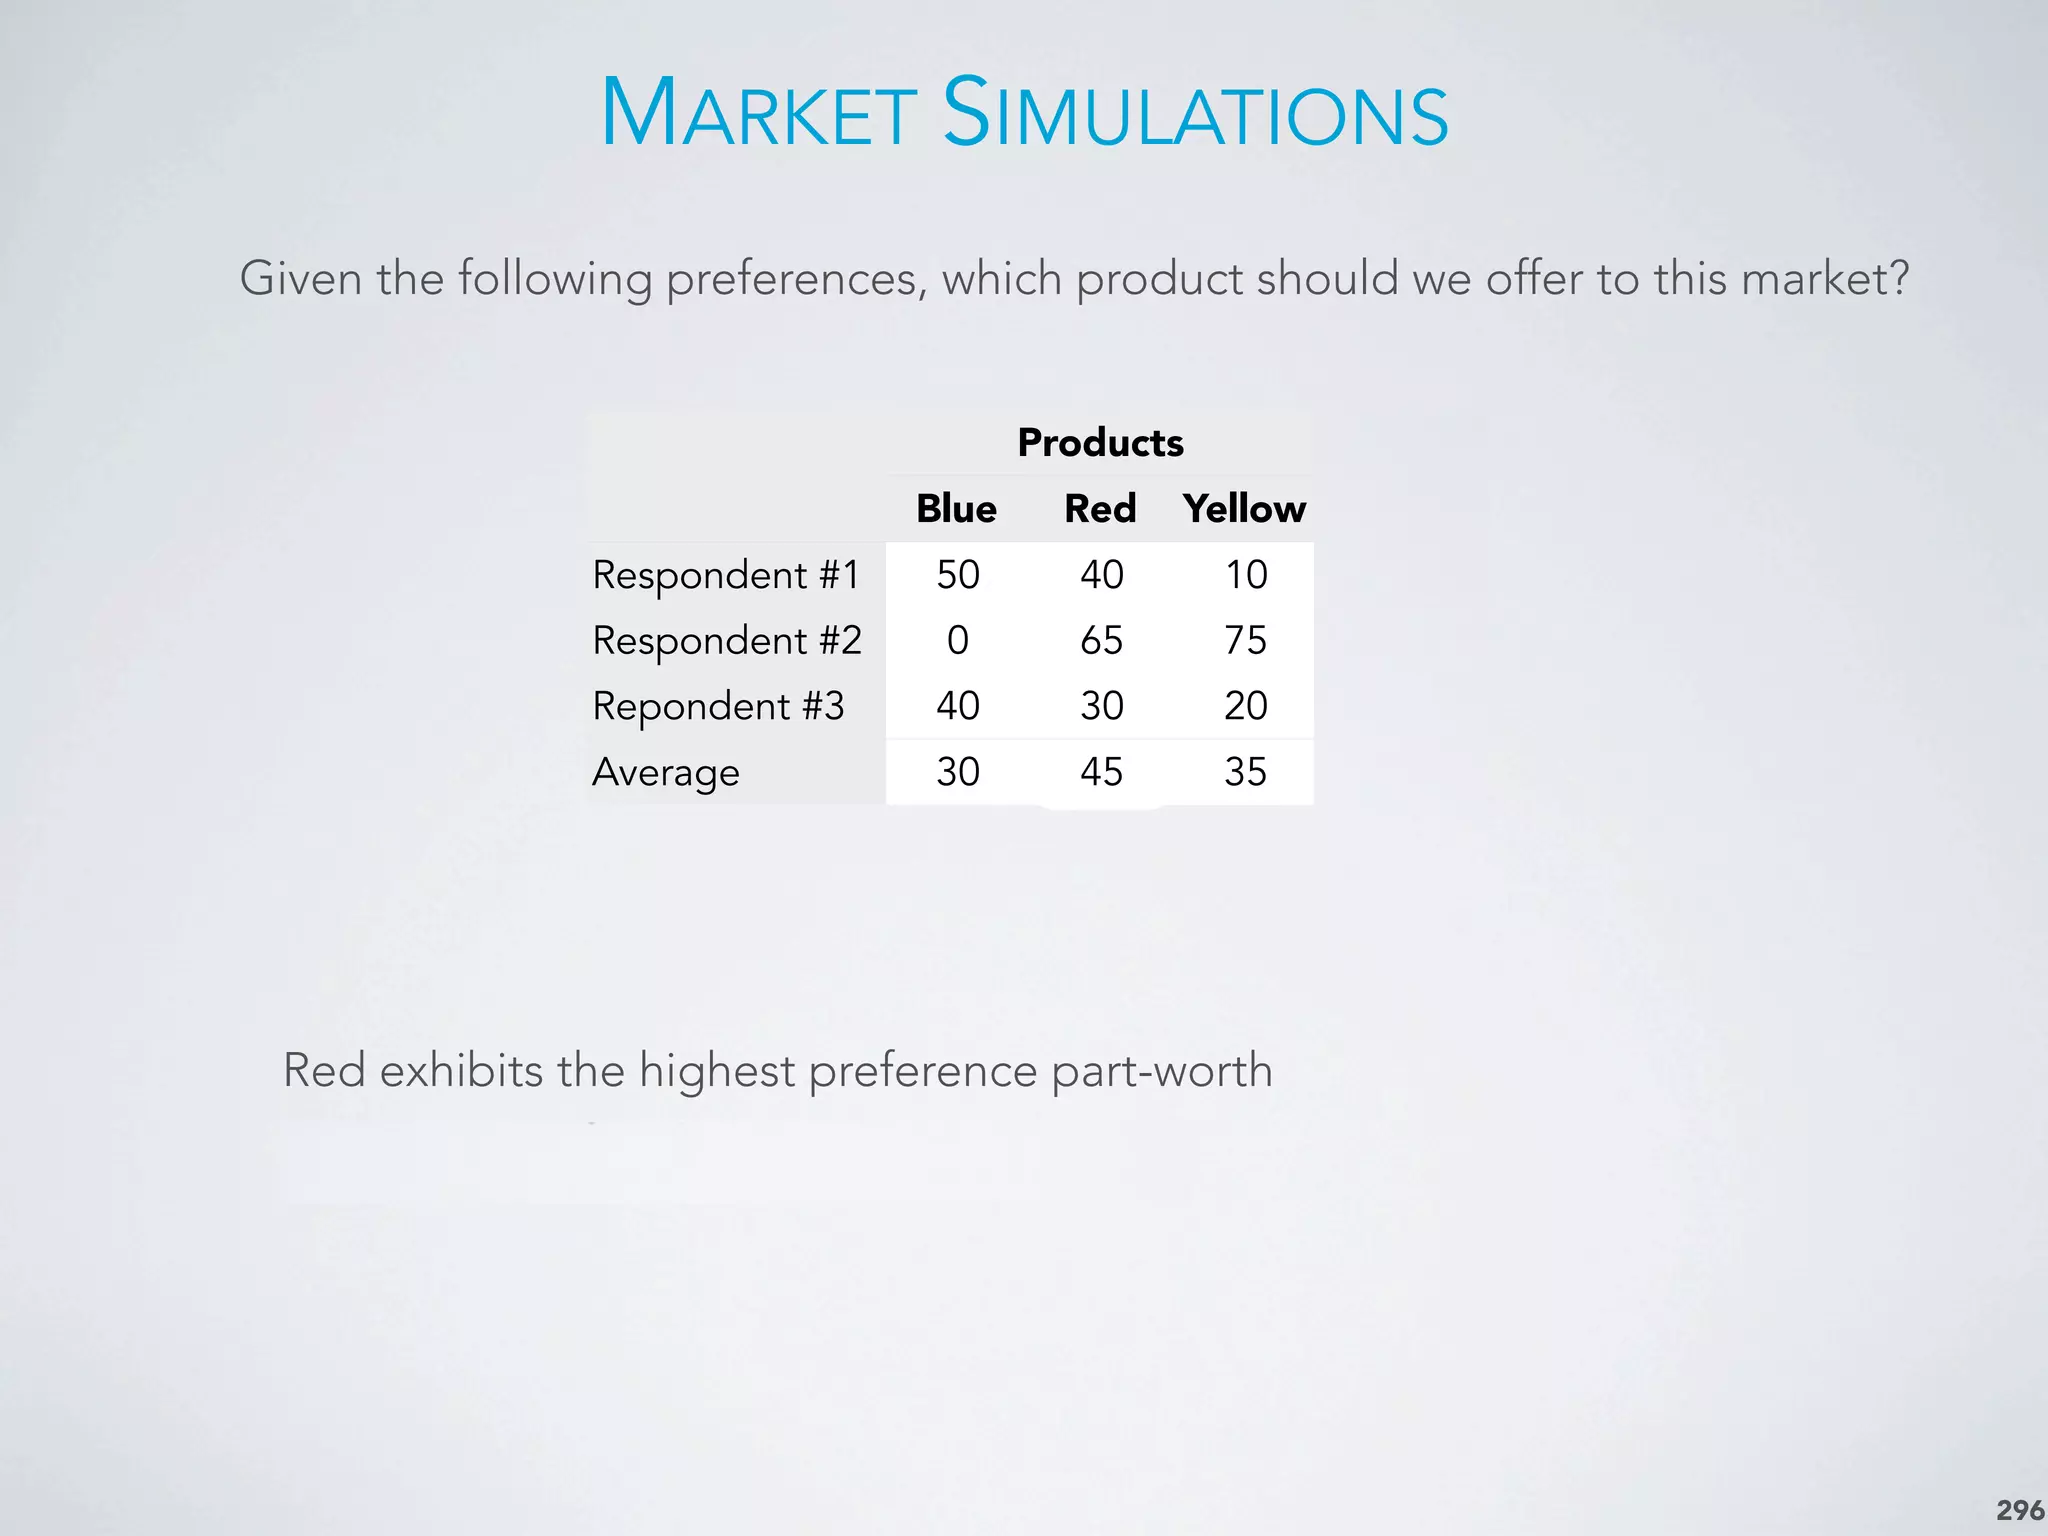


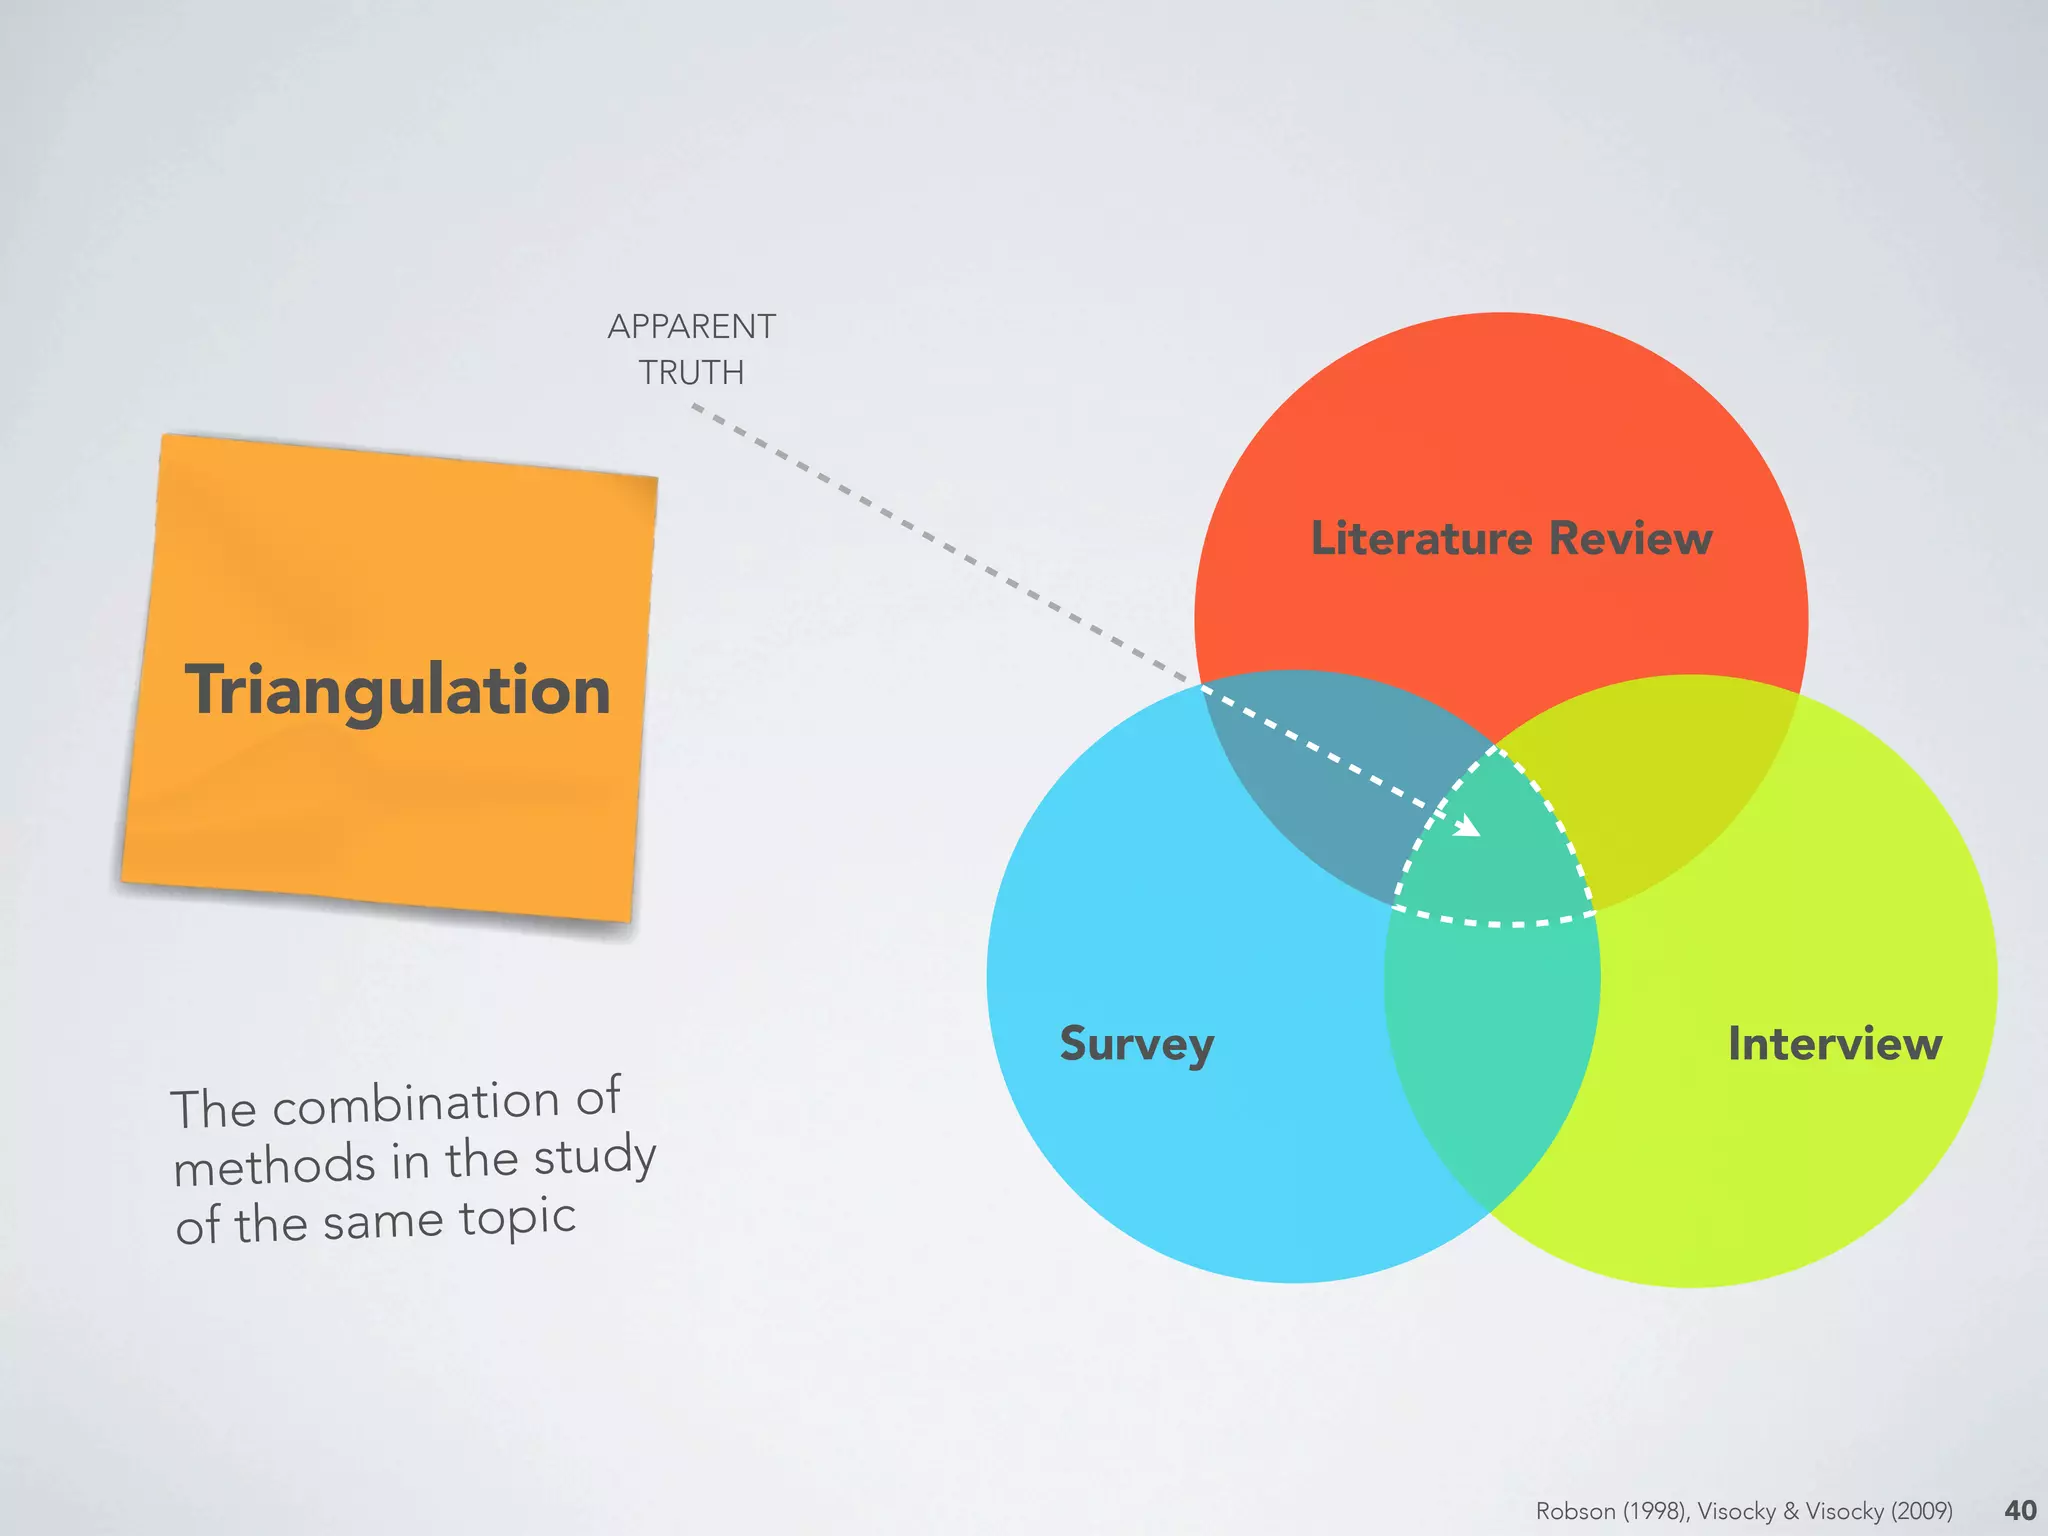
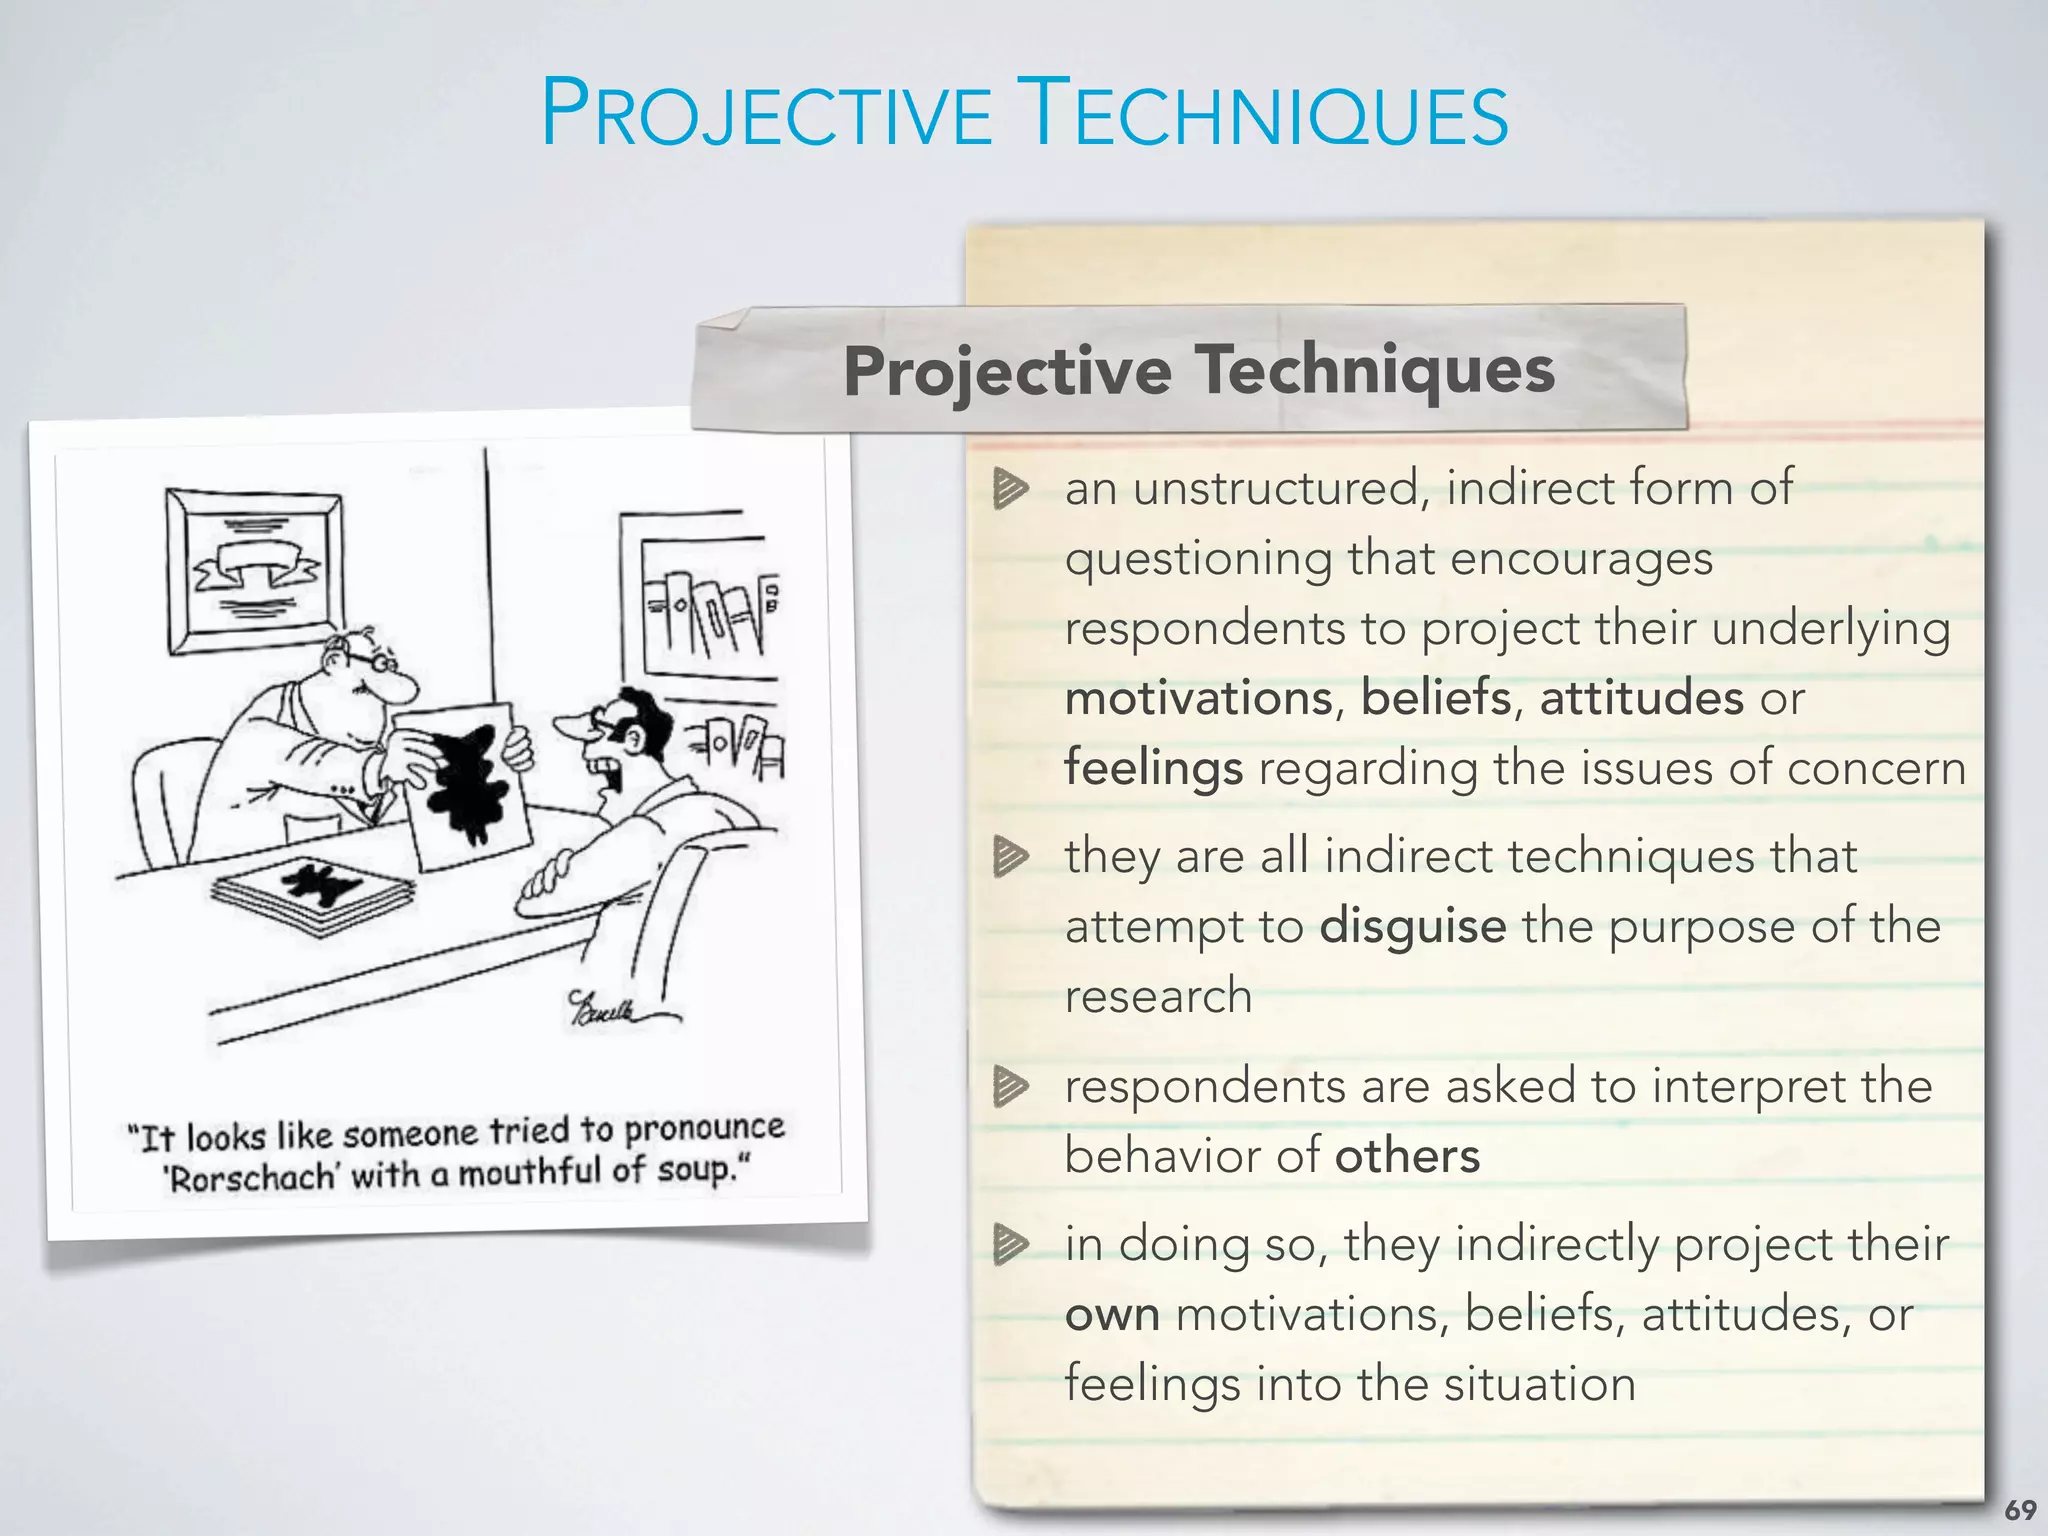
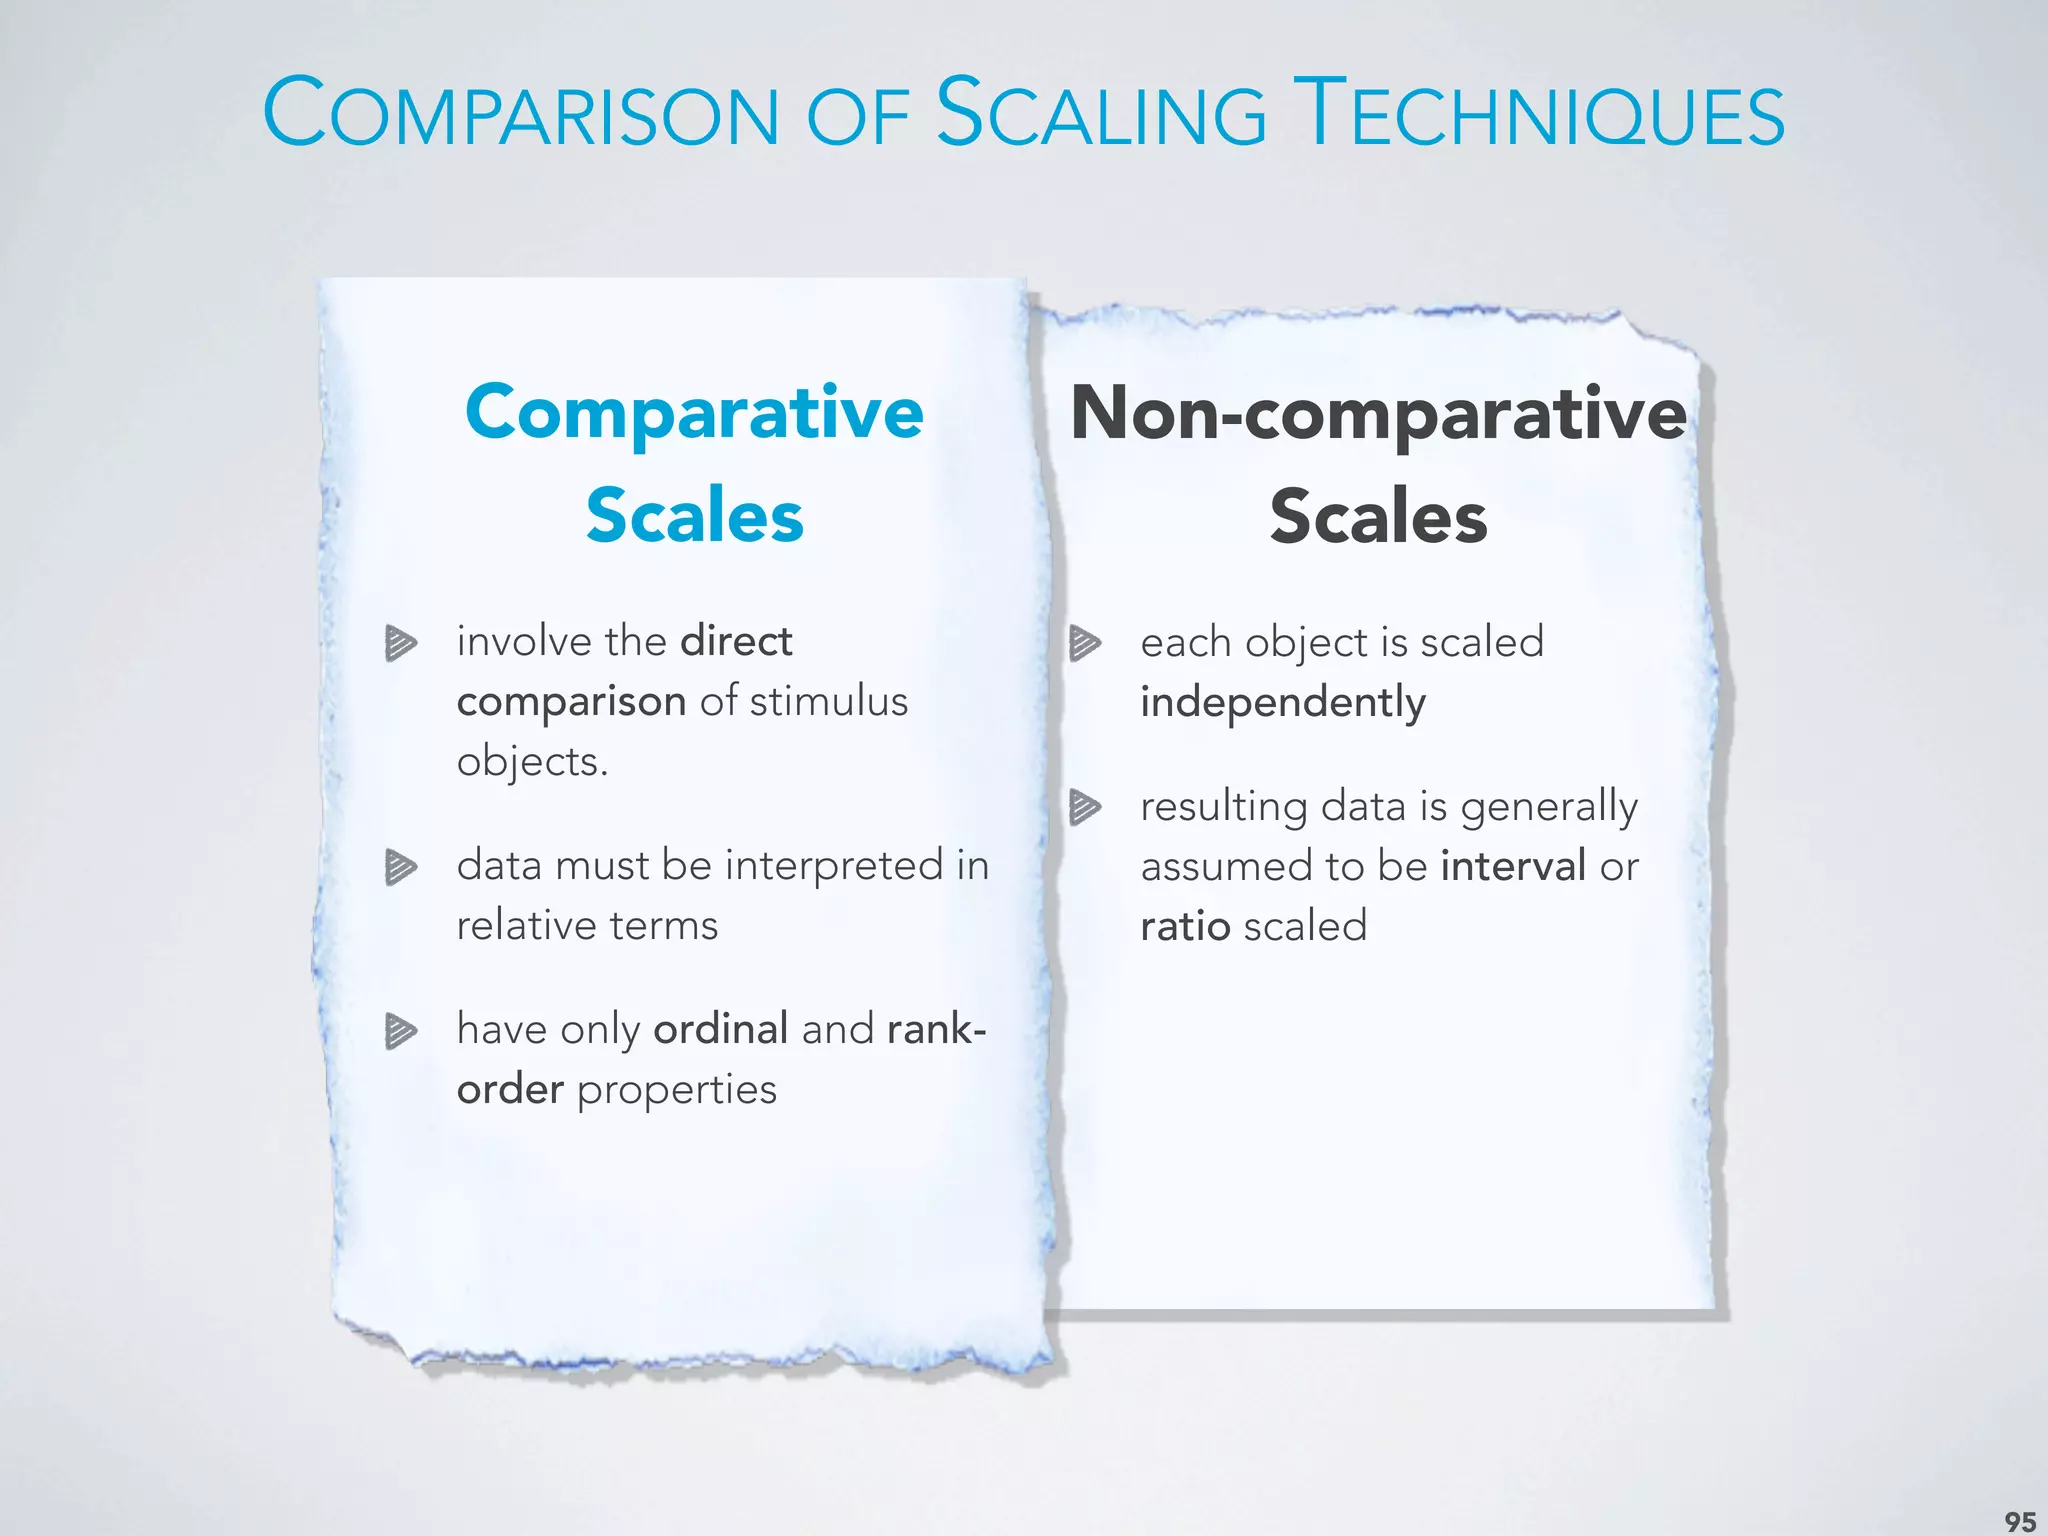
The document outlines the significance of marketing research in managerial decision-making, emphasizing its role in preventing costly marketing mistakes. It covers various topics, including research methods, types of data, qualitative and quantitative approaches, and practical applications of market analysis. Key case studies illustrate the consequences of neglecting research, showcasing the importance of understanding consumer behavior and market dynamics.
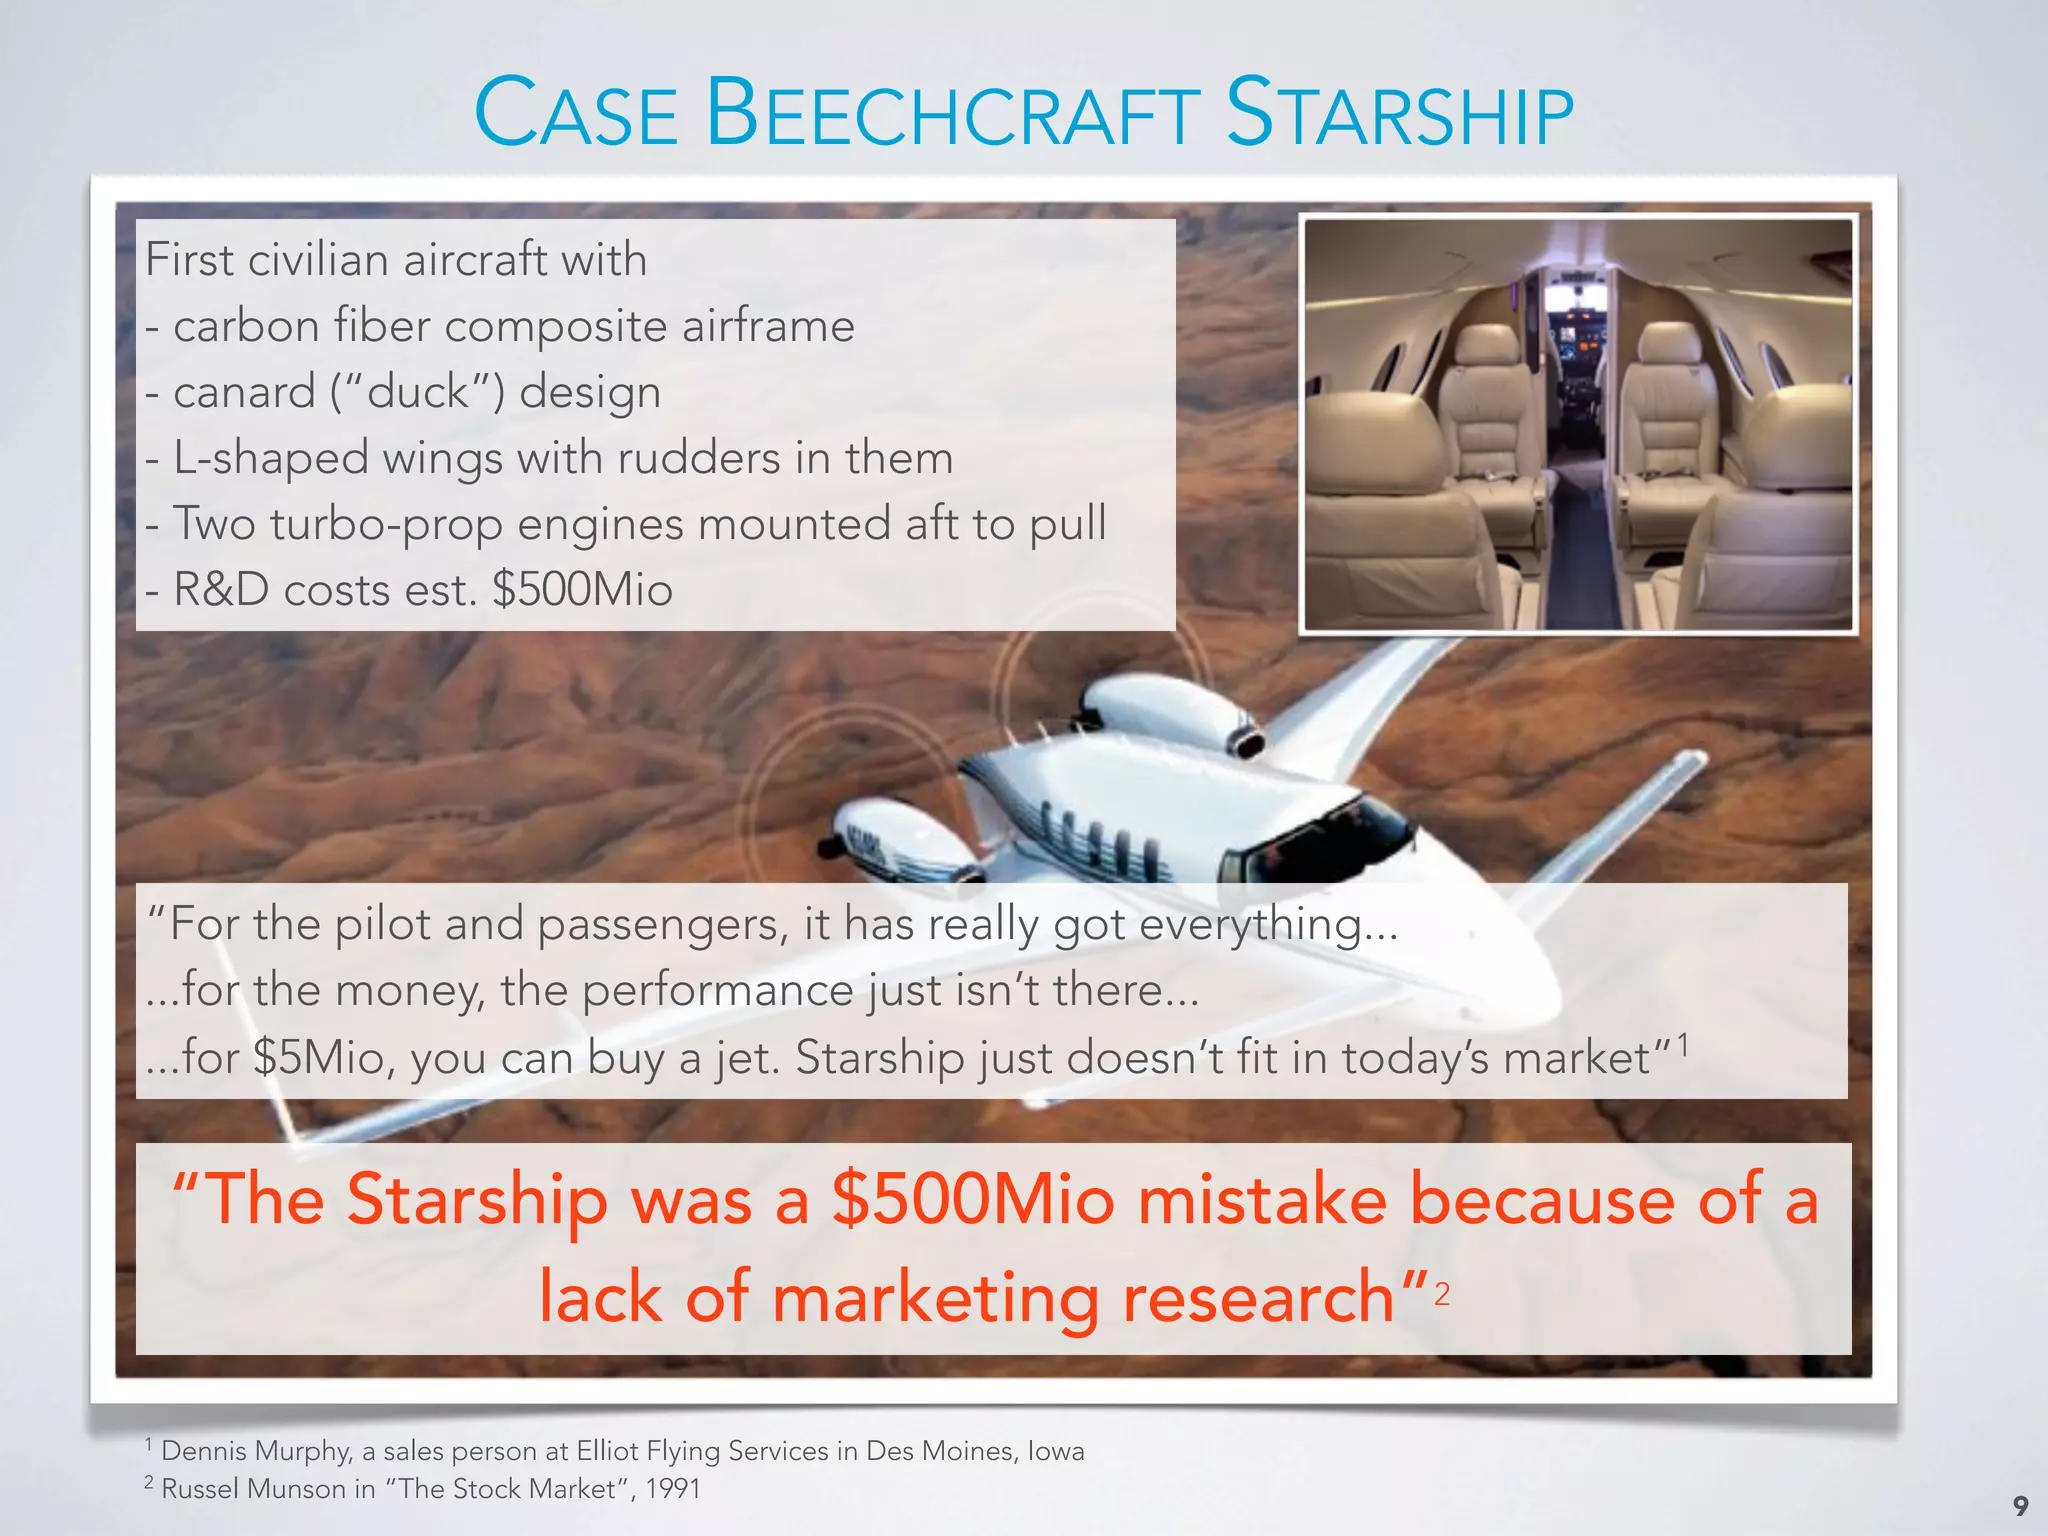
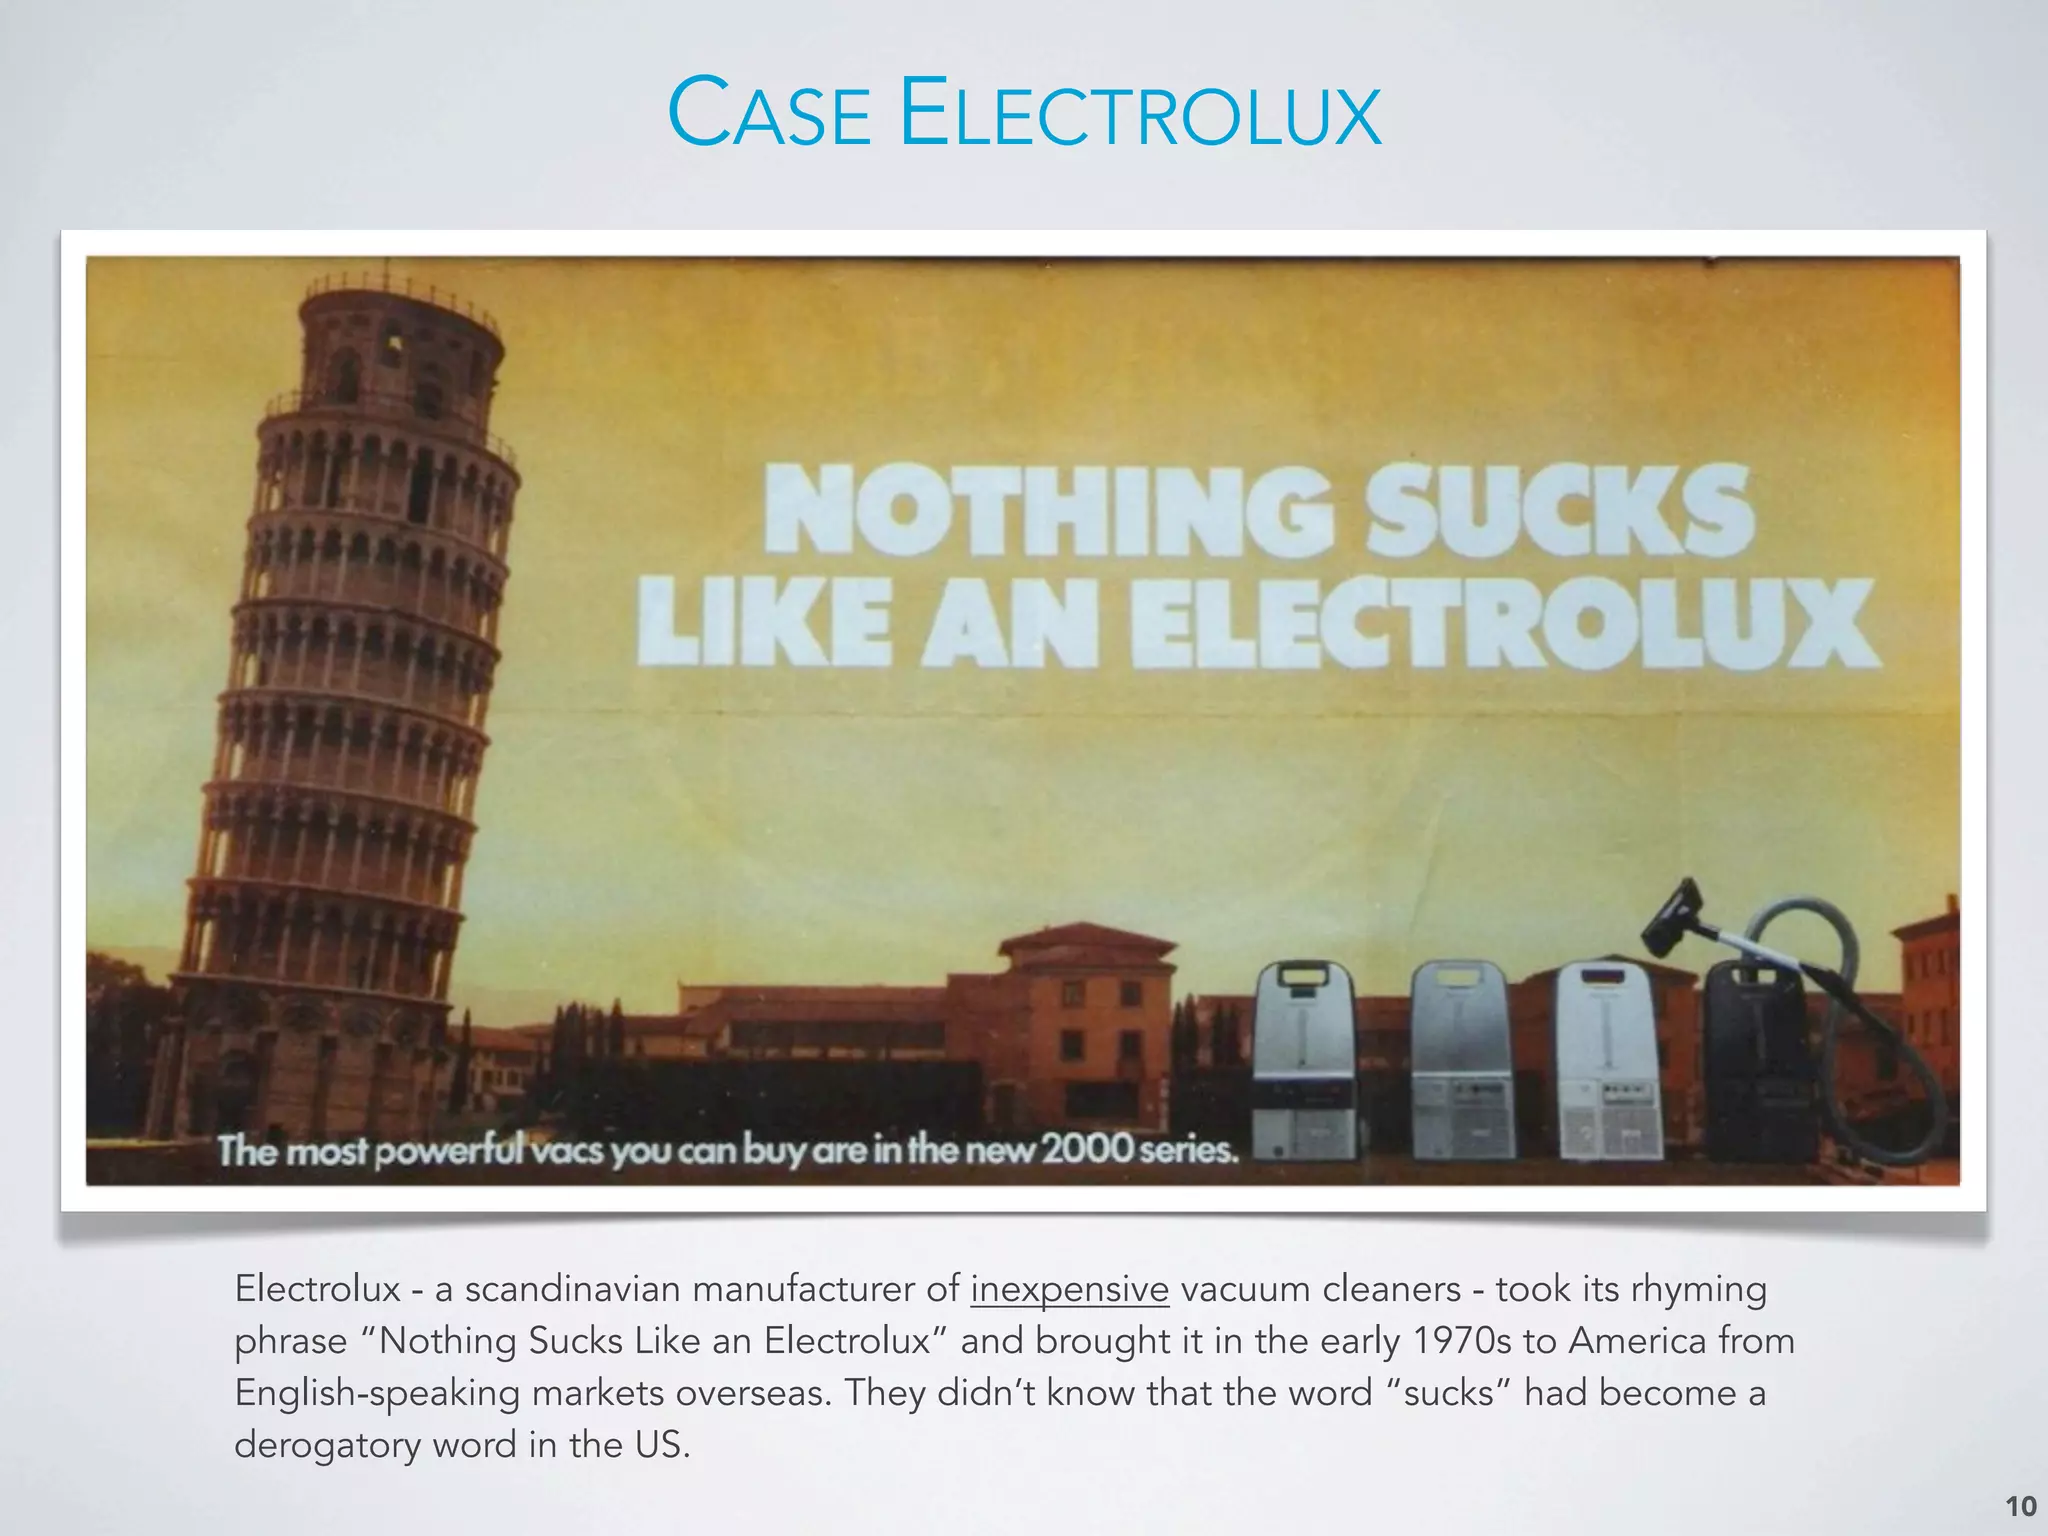
Introduction to marketing research, course objectives, and a detailed overview of topics covered.Examines failures like Beechcraft Starship and Electrolux due to lack of marketing research, emphasizing the importance of effective research.
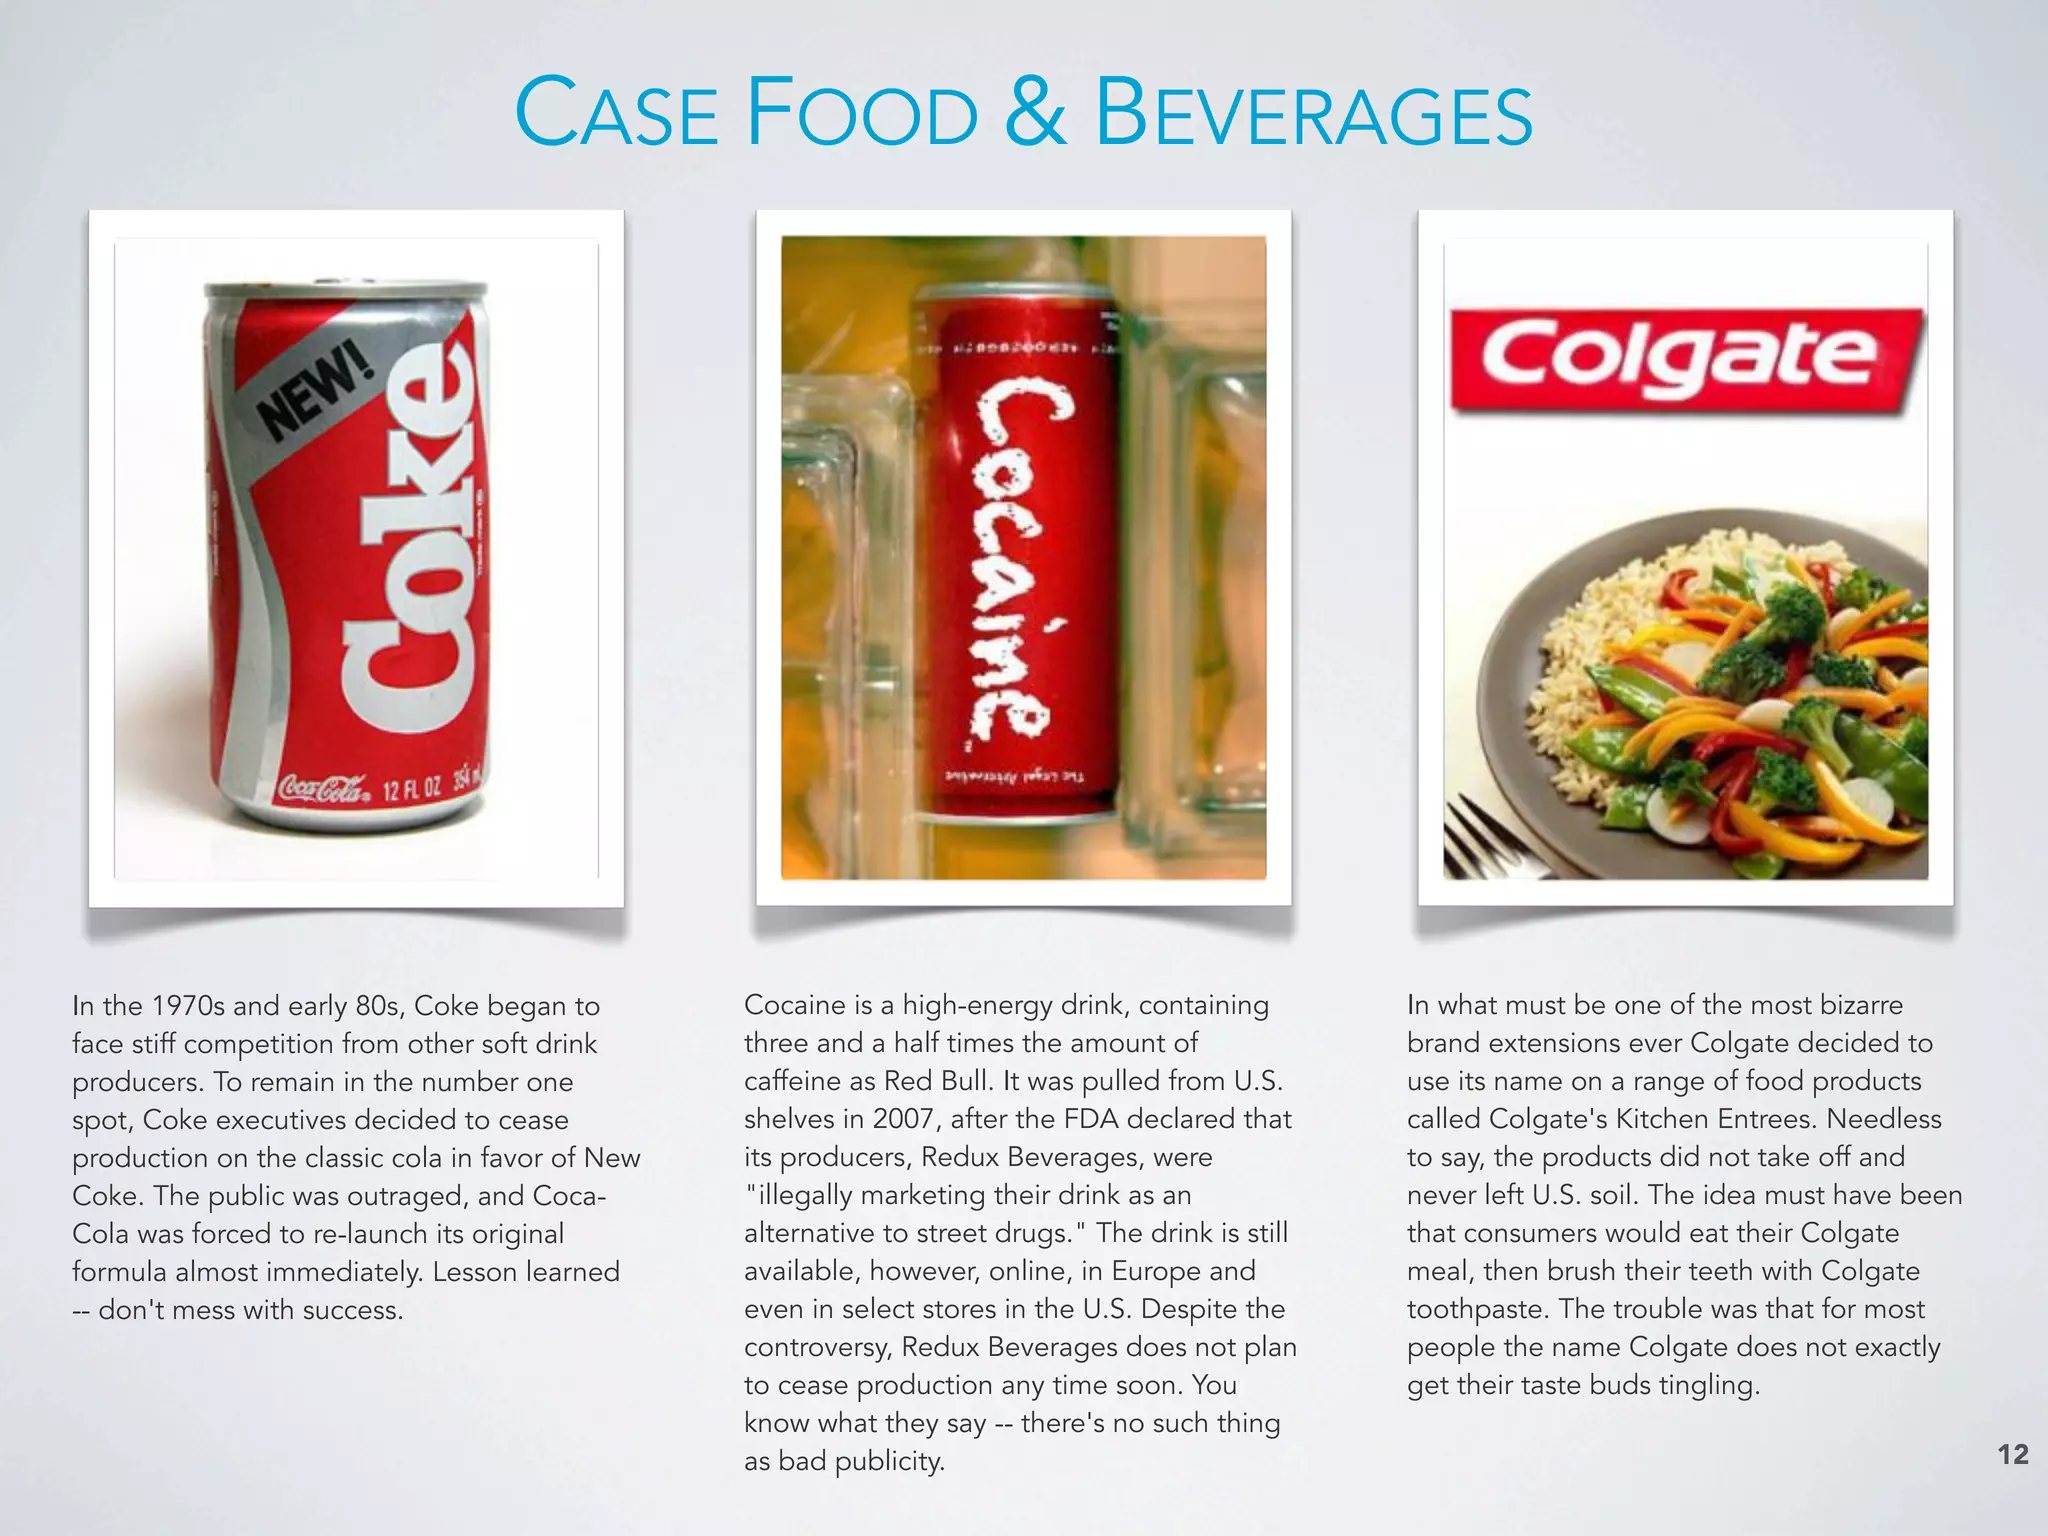
Statistics on marketing errors and failures, highlighting the critical need for comprehensive marketing research.
Explanation of marketing definitions, concepts, orientation, and the marketing mix (4 P's and beyond).
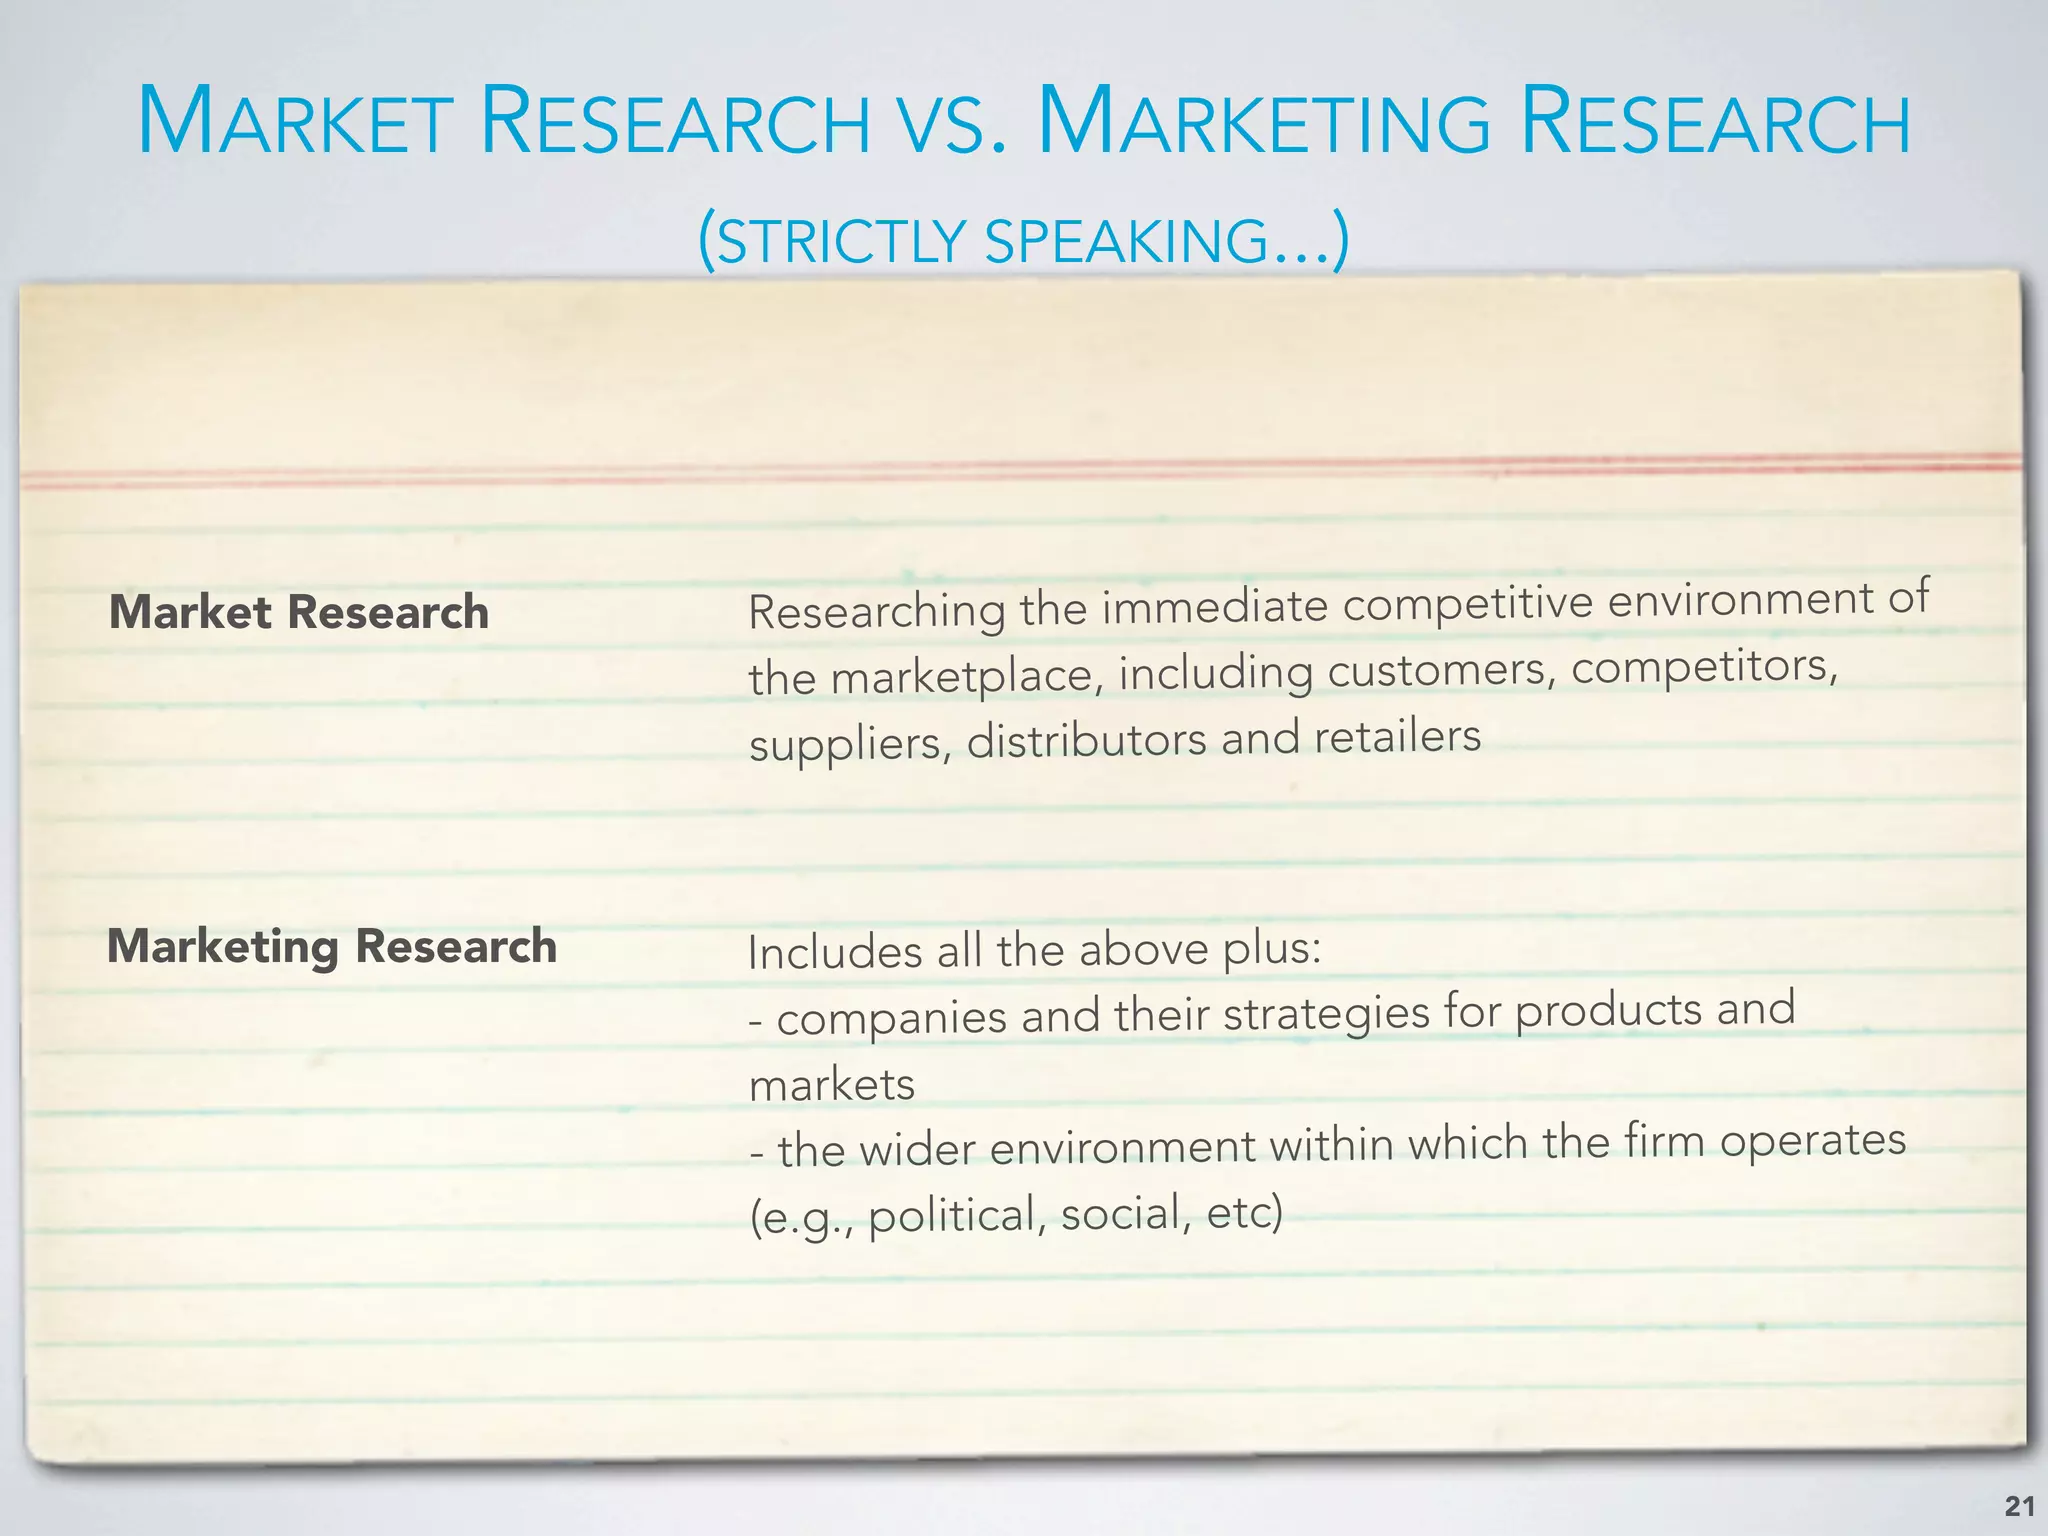
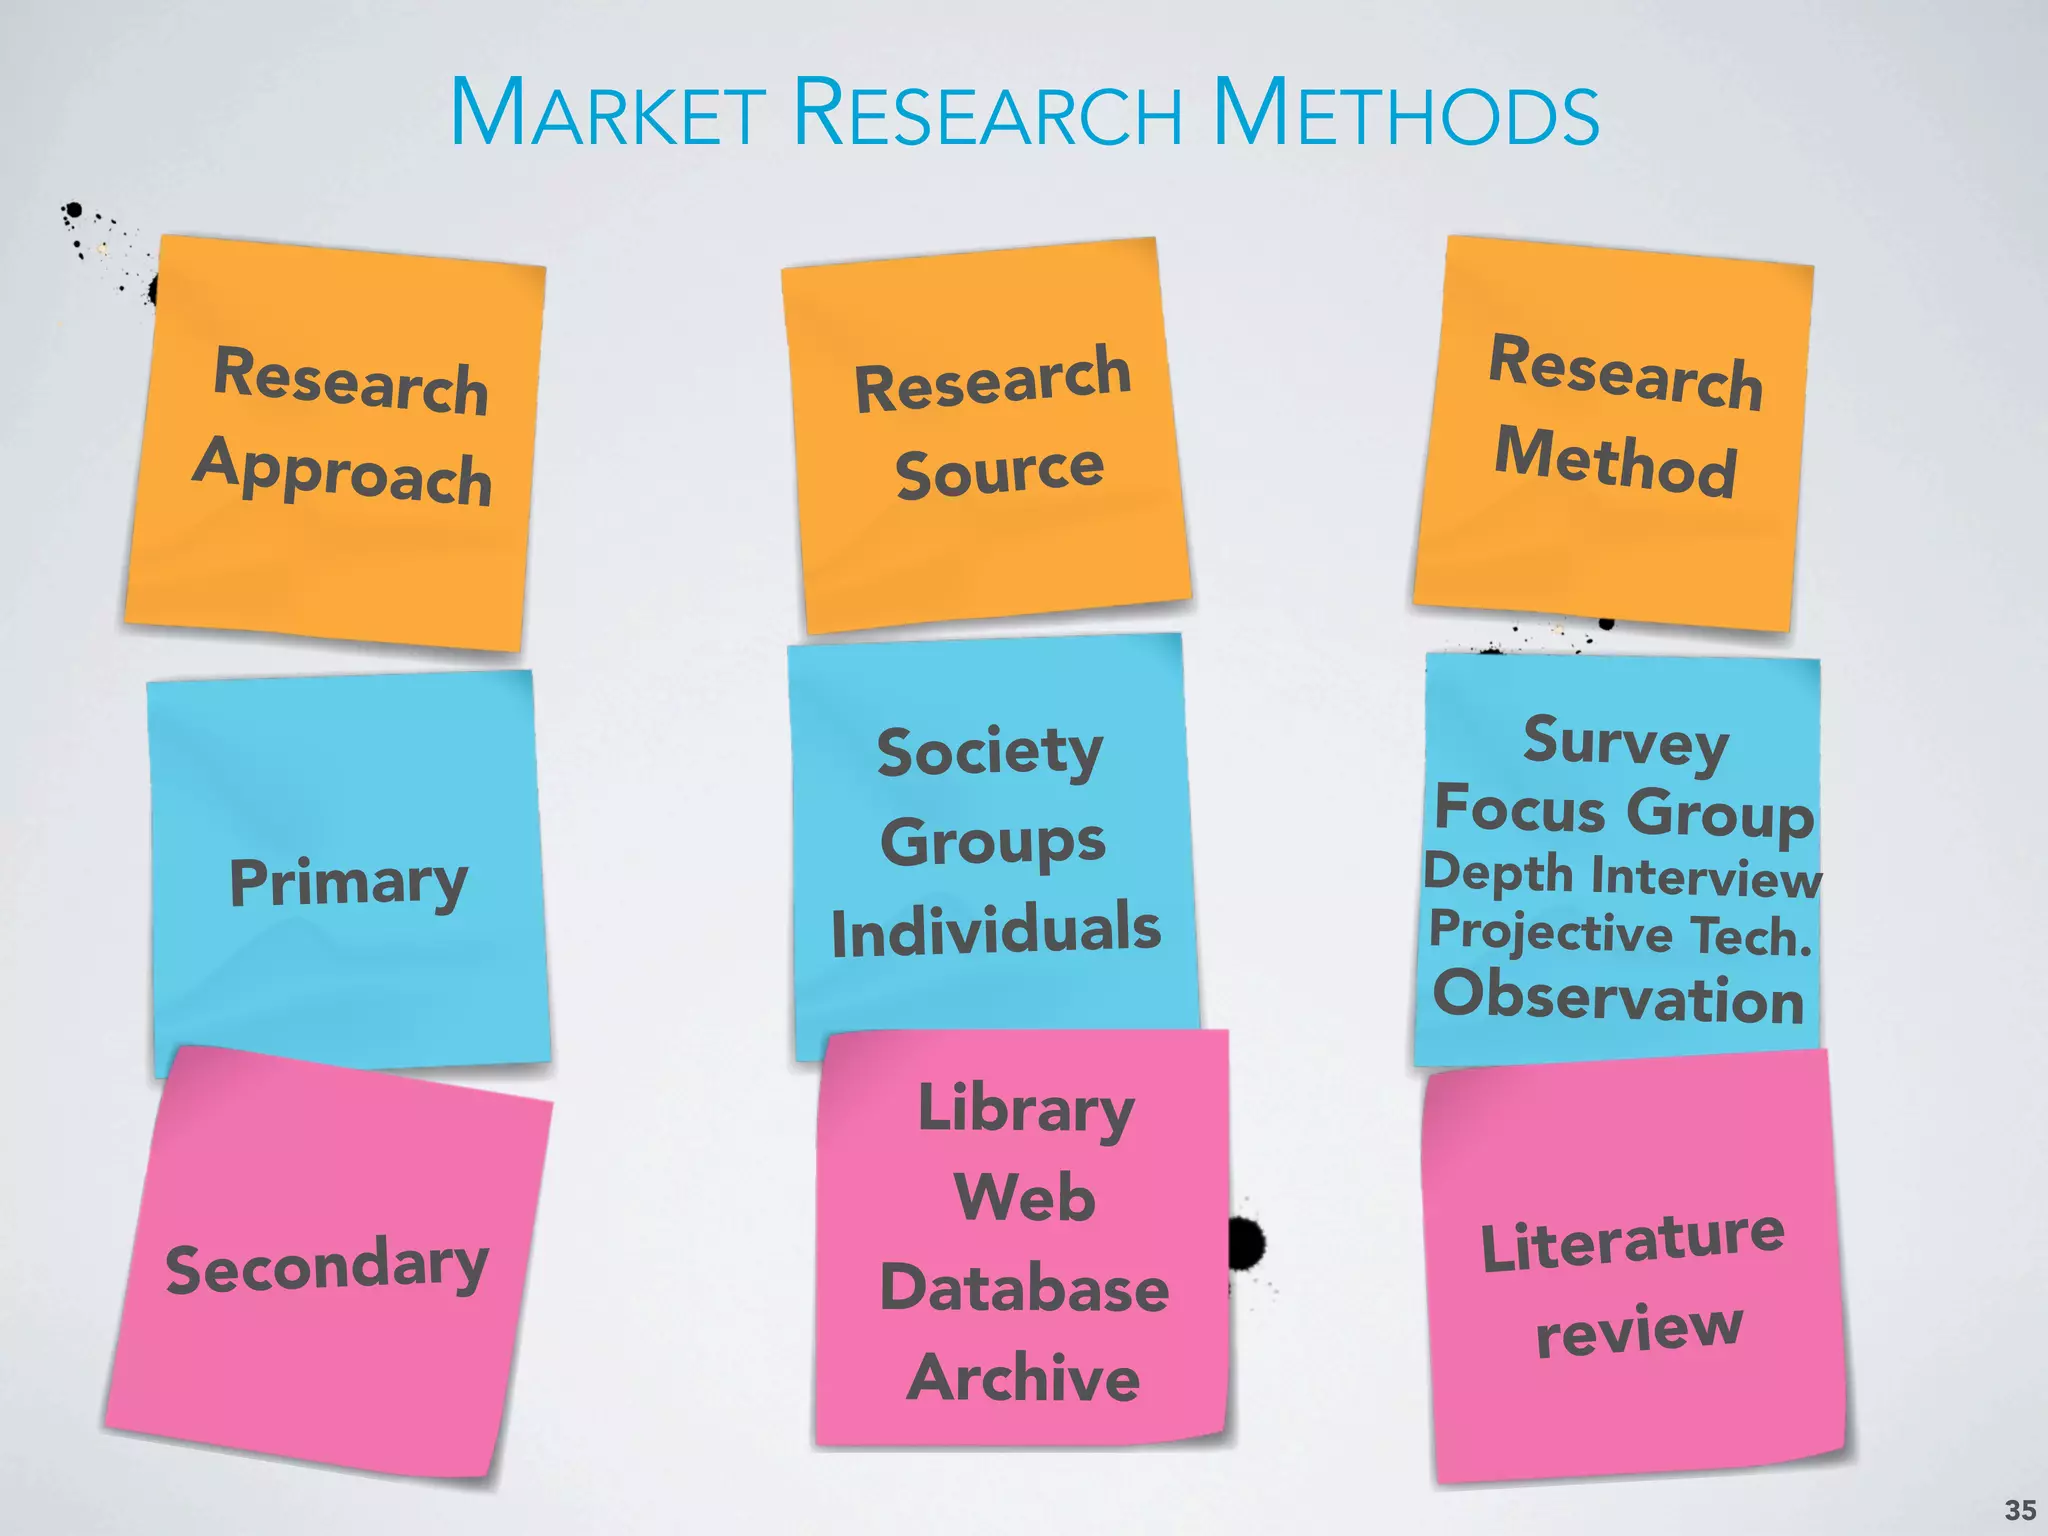
Definition and importance of marketing research vs. market research, outlining types of research activities.
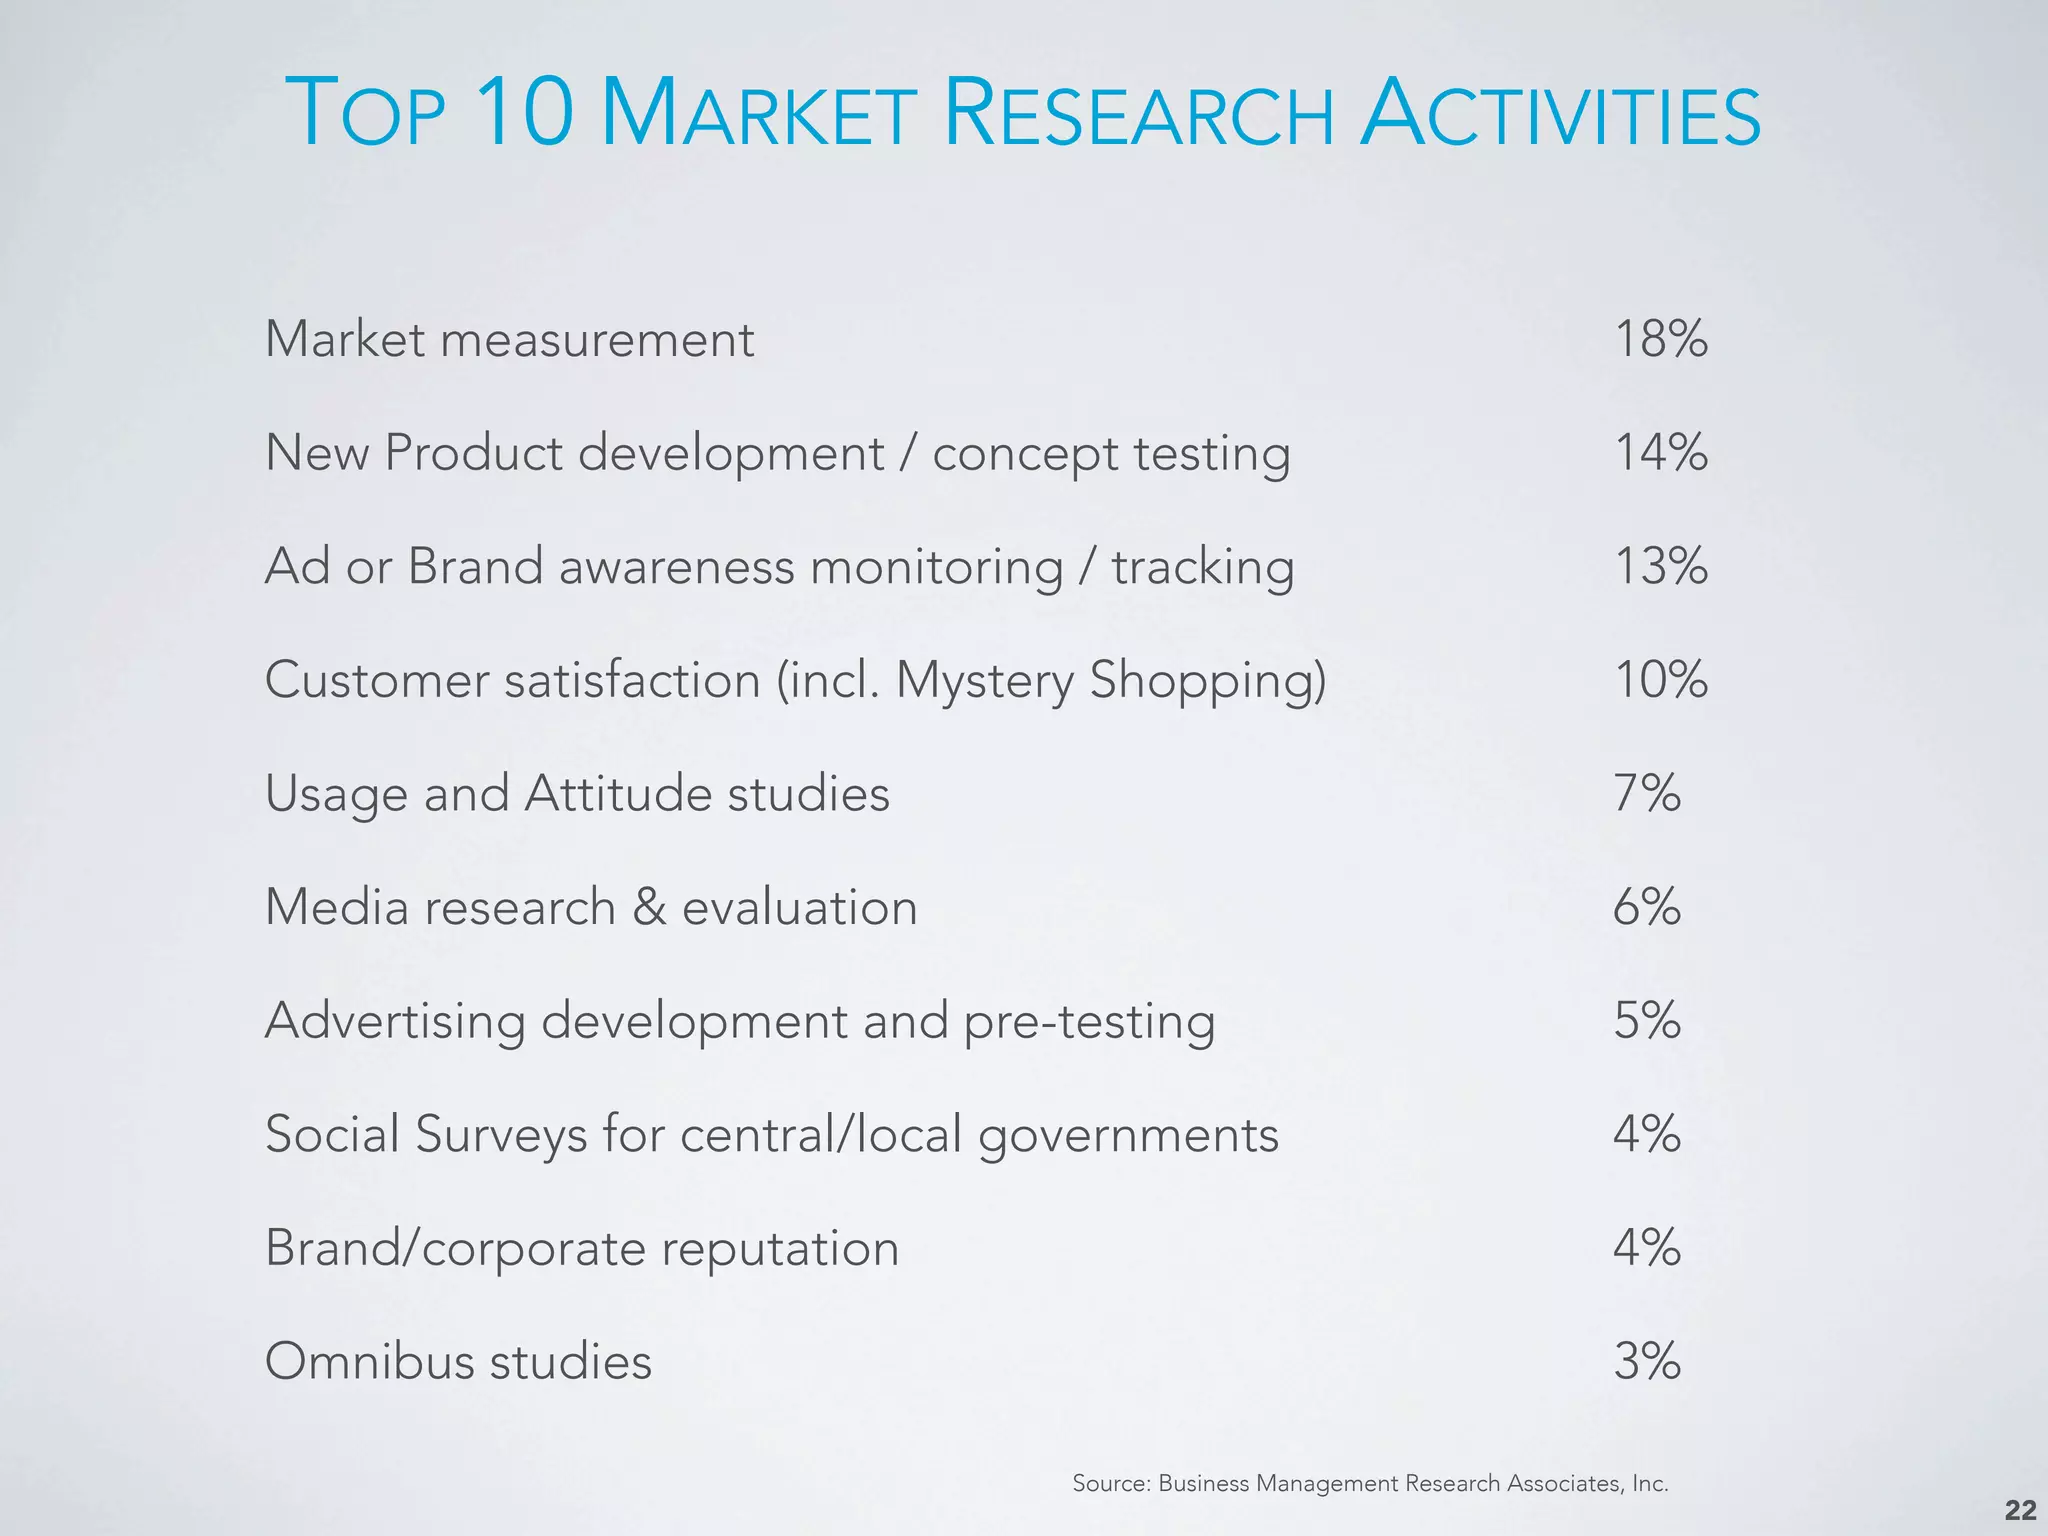
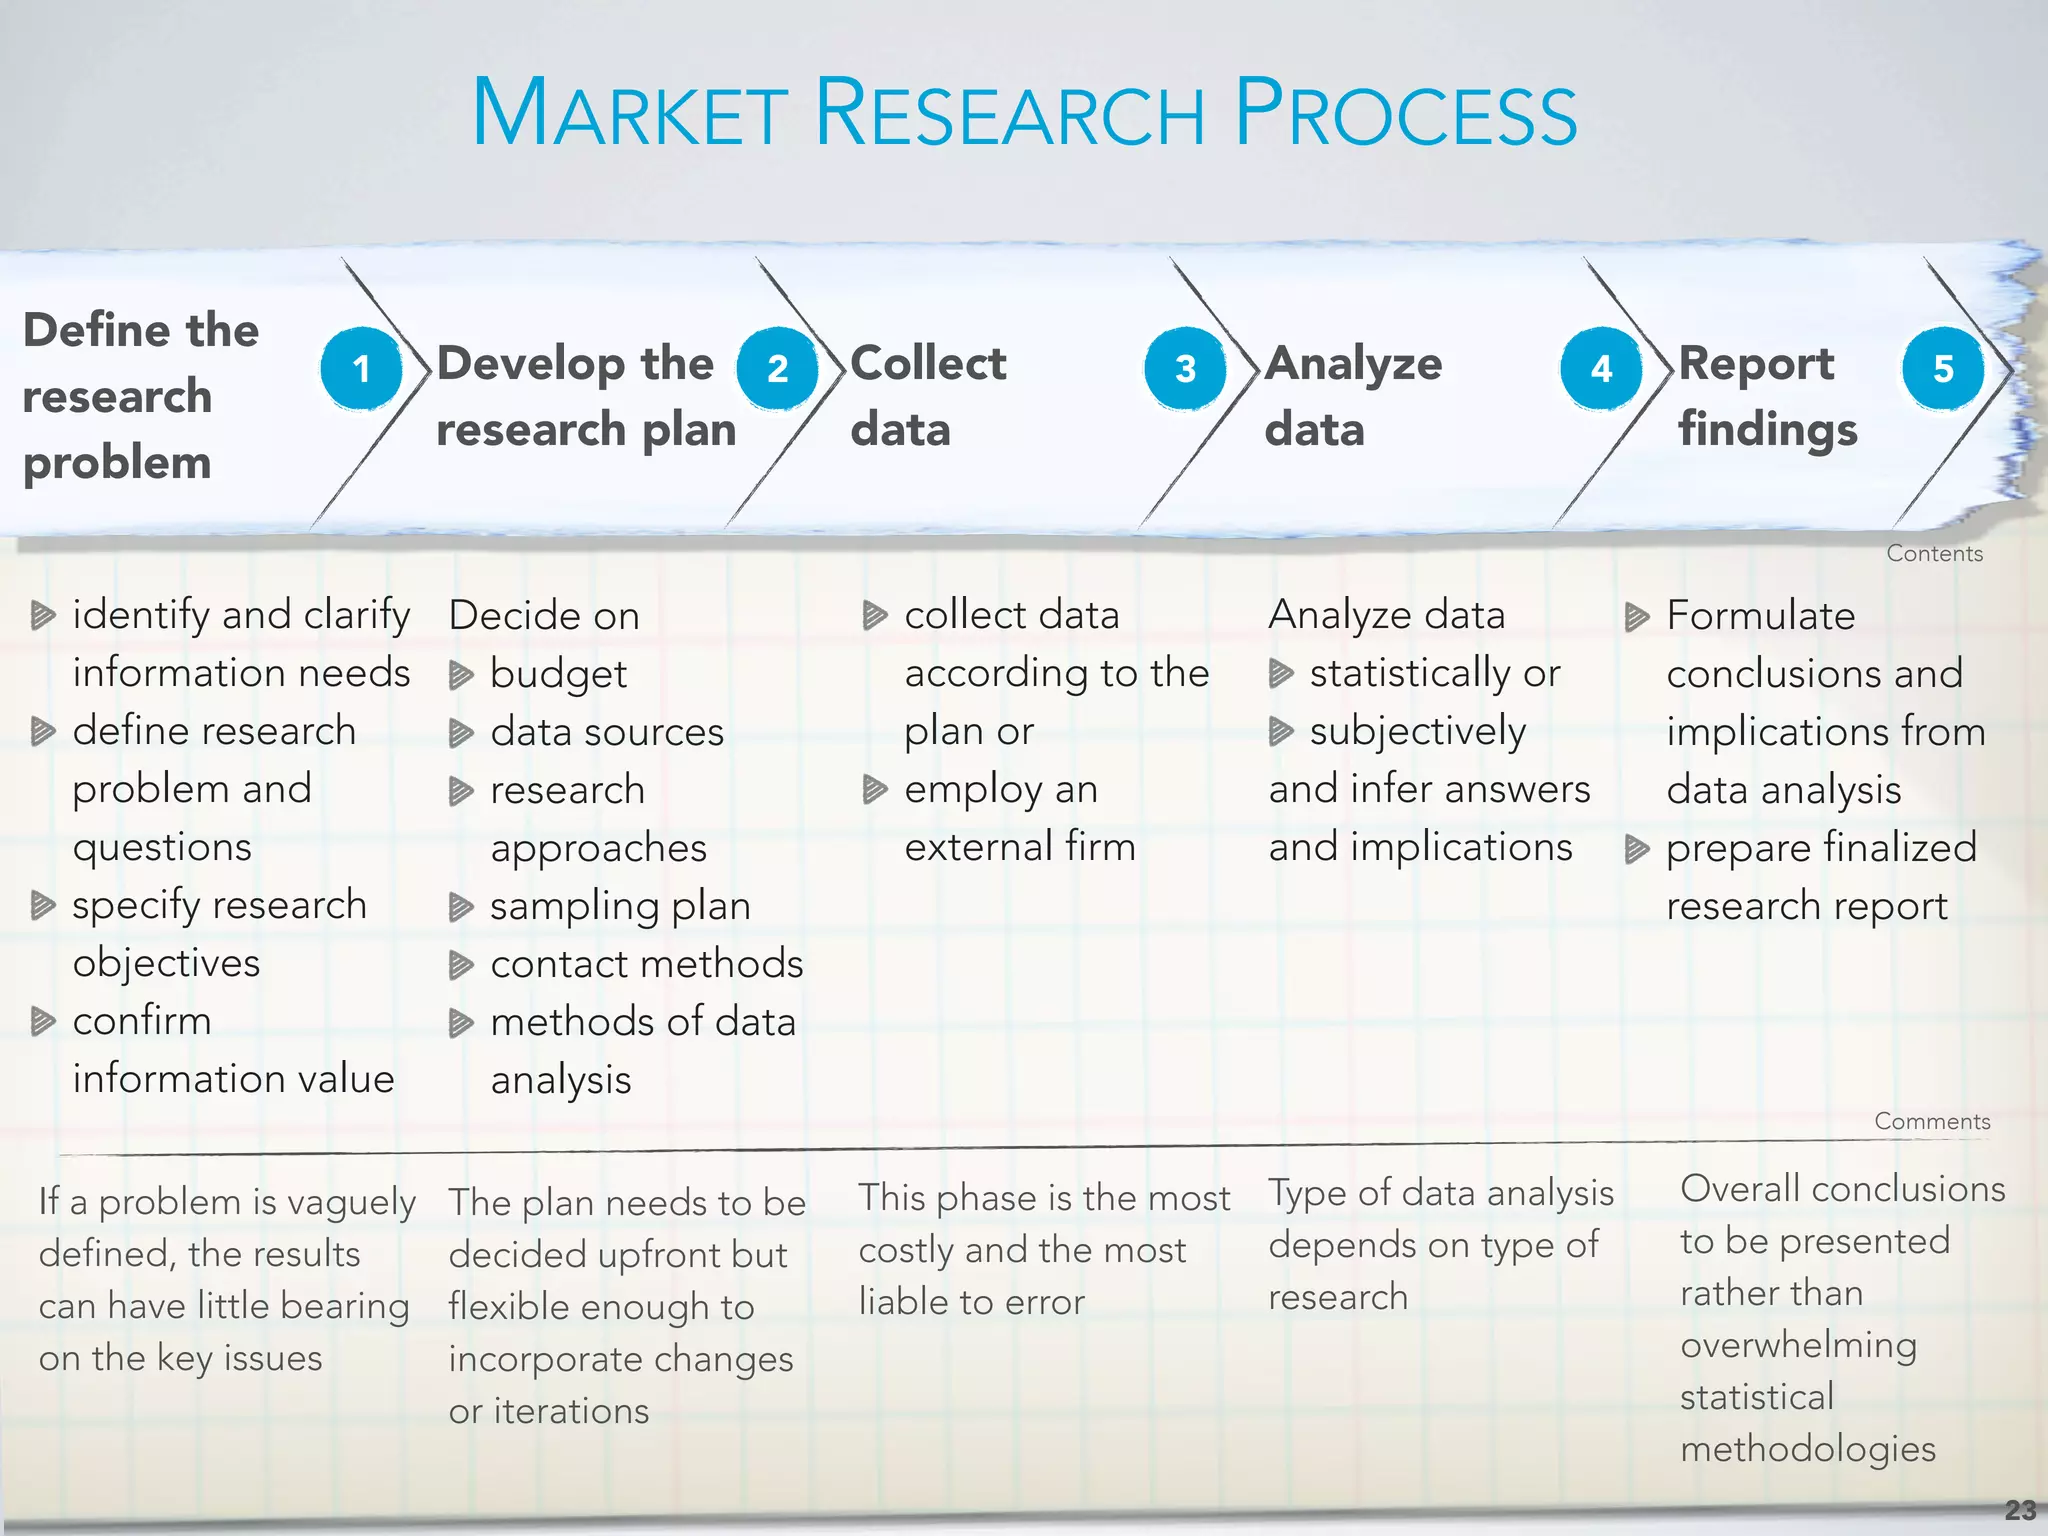
Common market research activities and a detailed overview of the research process from problem definition to reporting.
Categorization of market research into exploratory, descriptive, and causal types along with data sourcing.
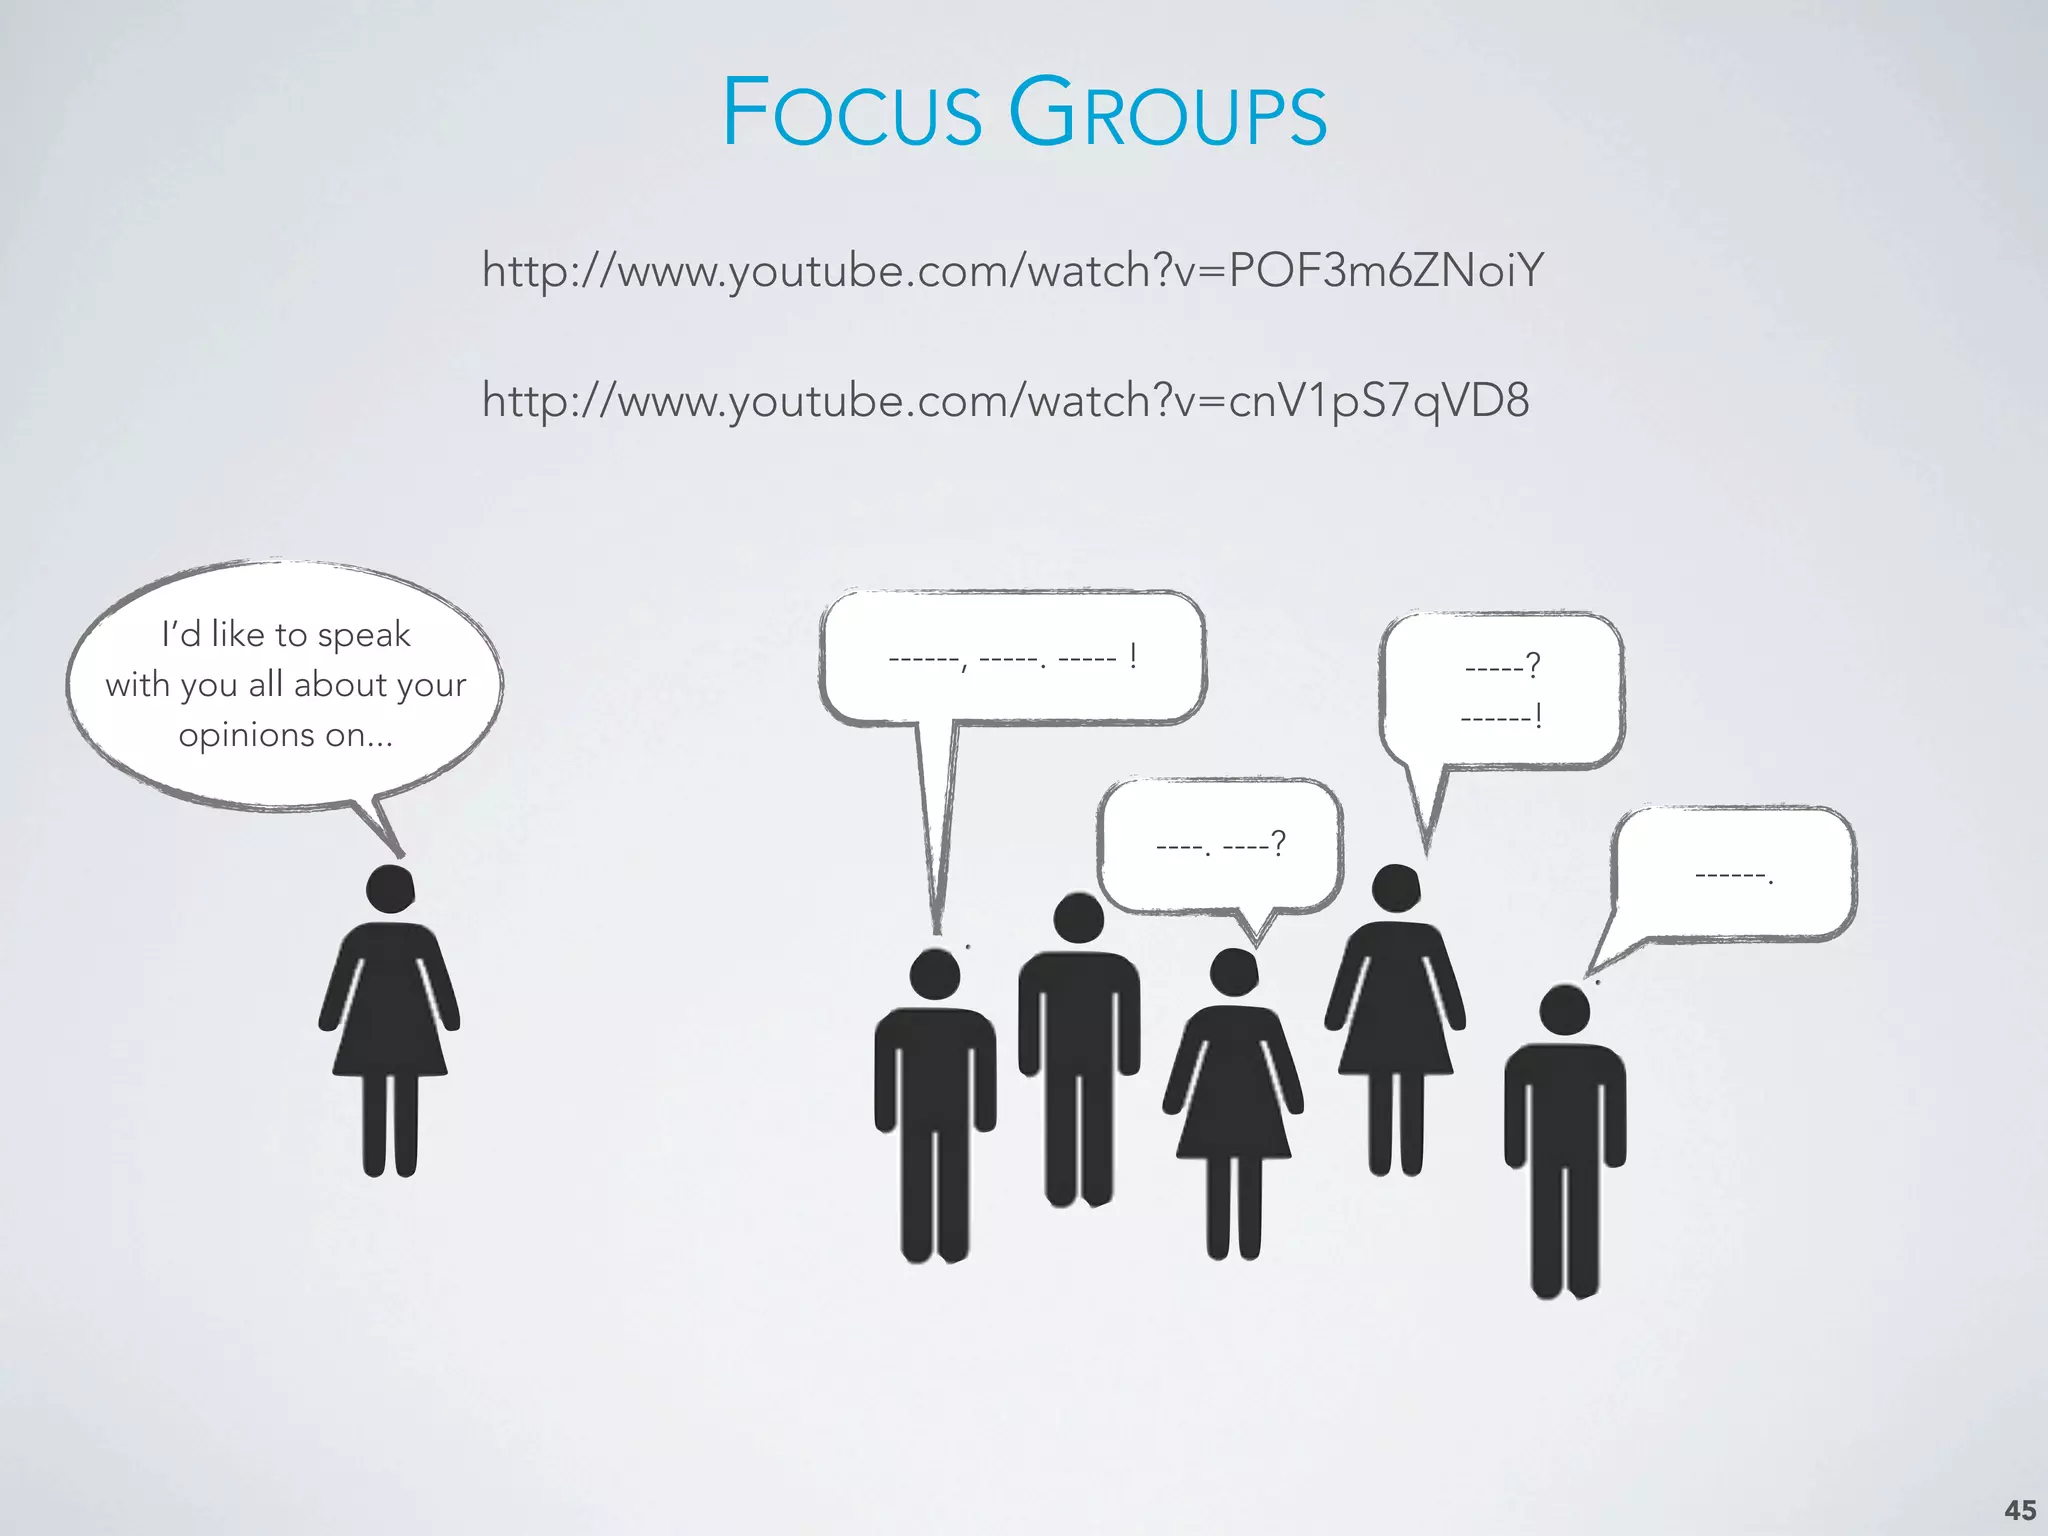
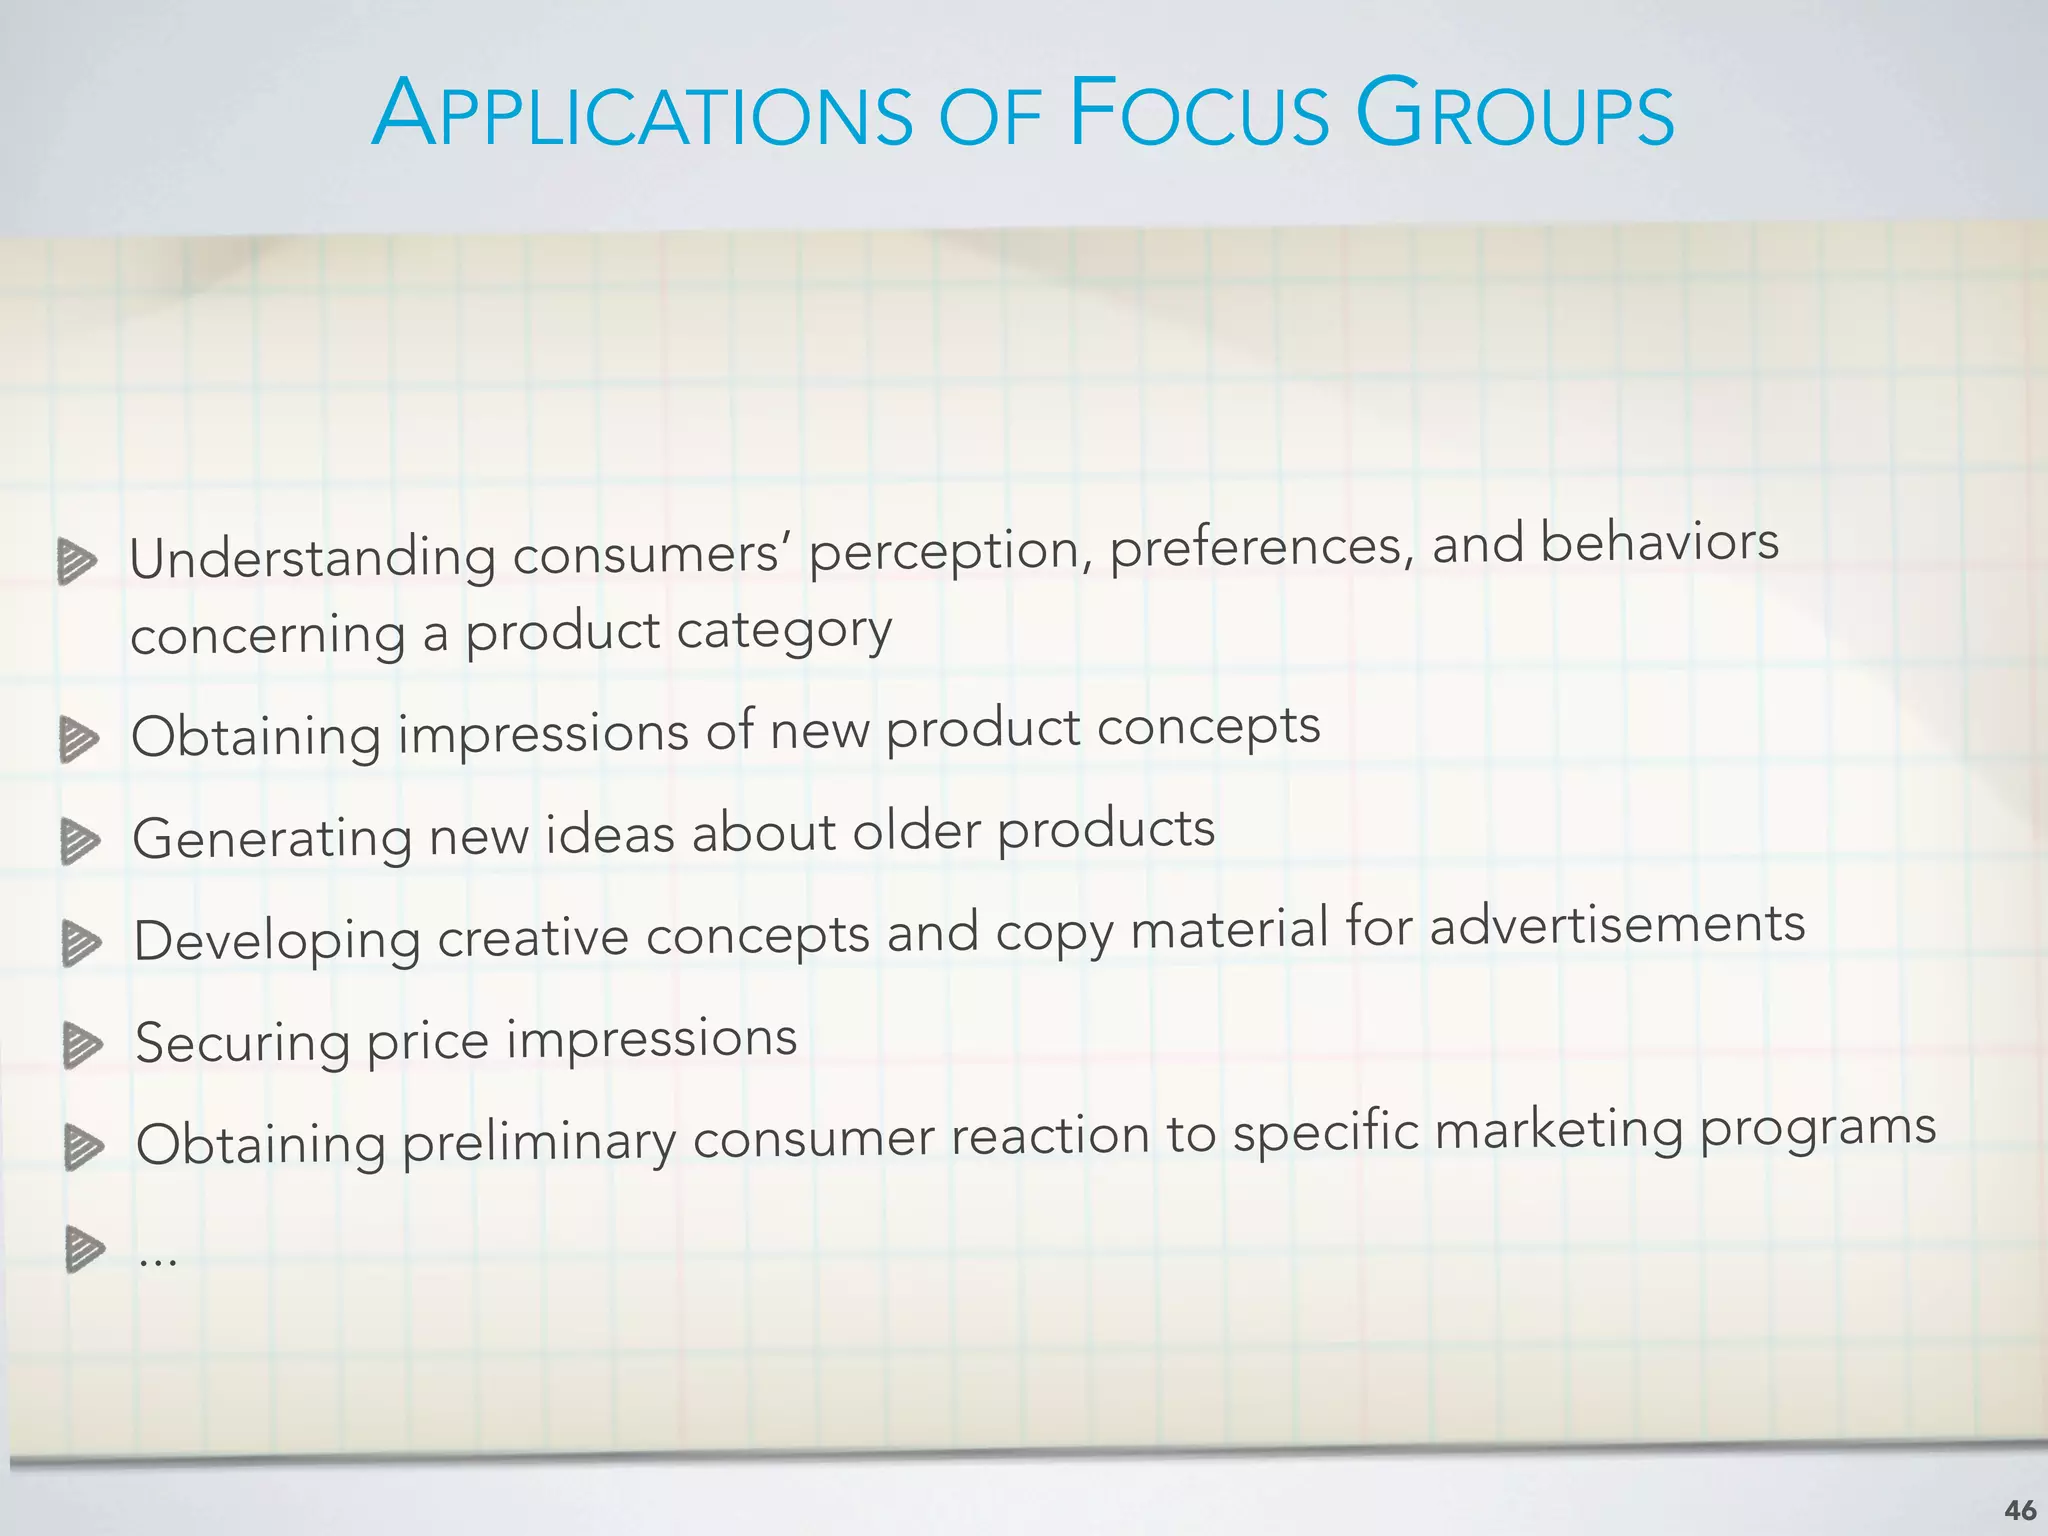
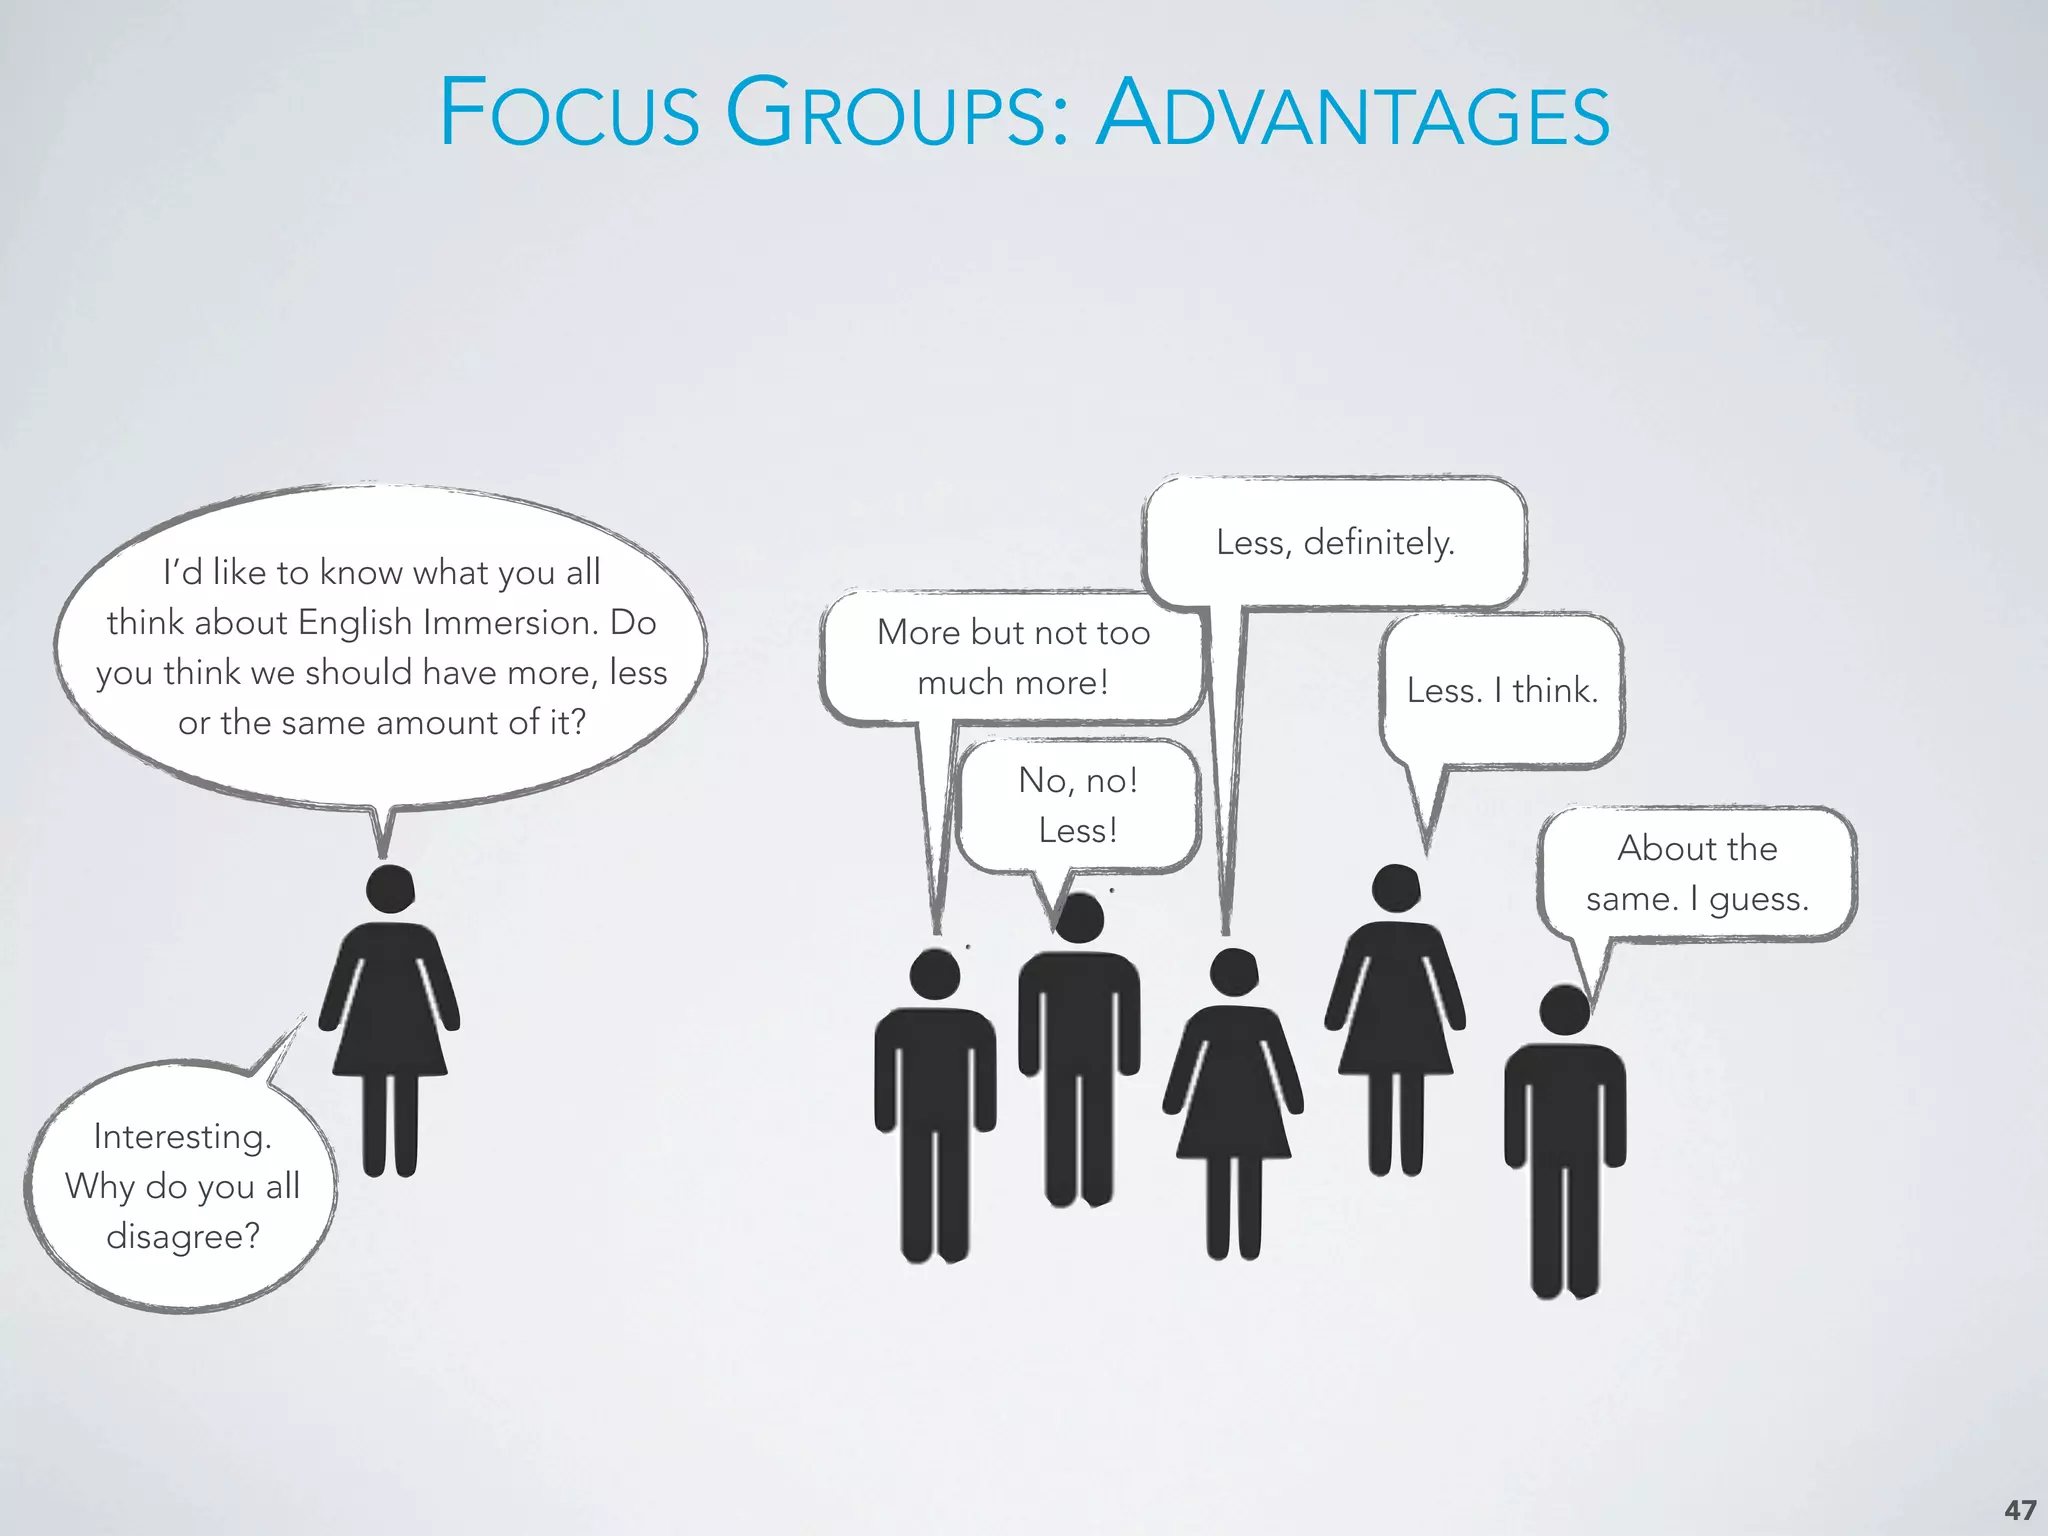
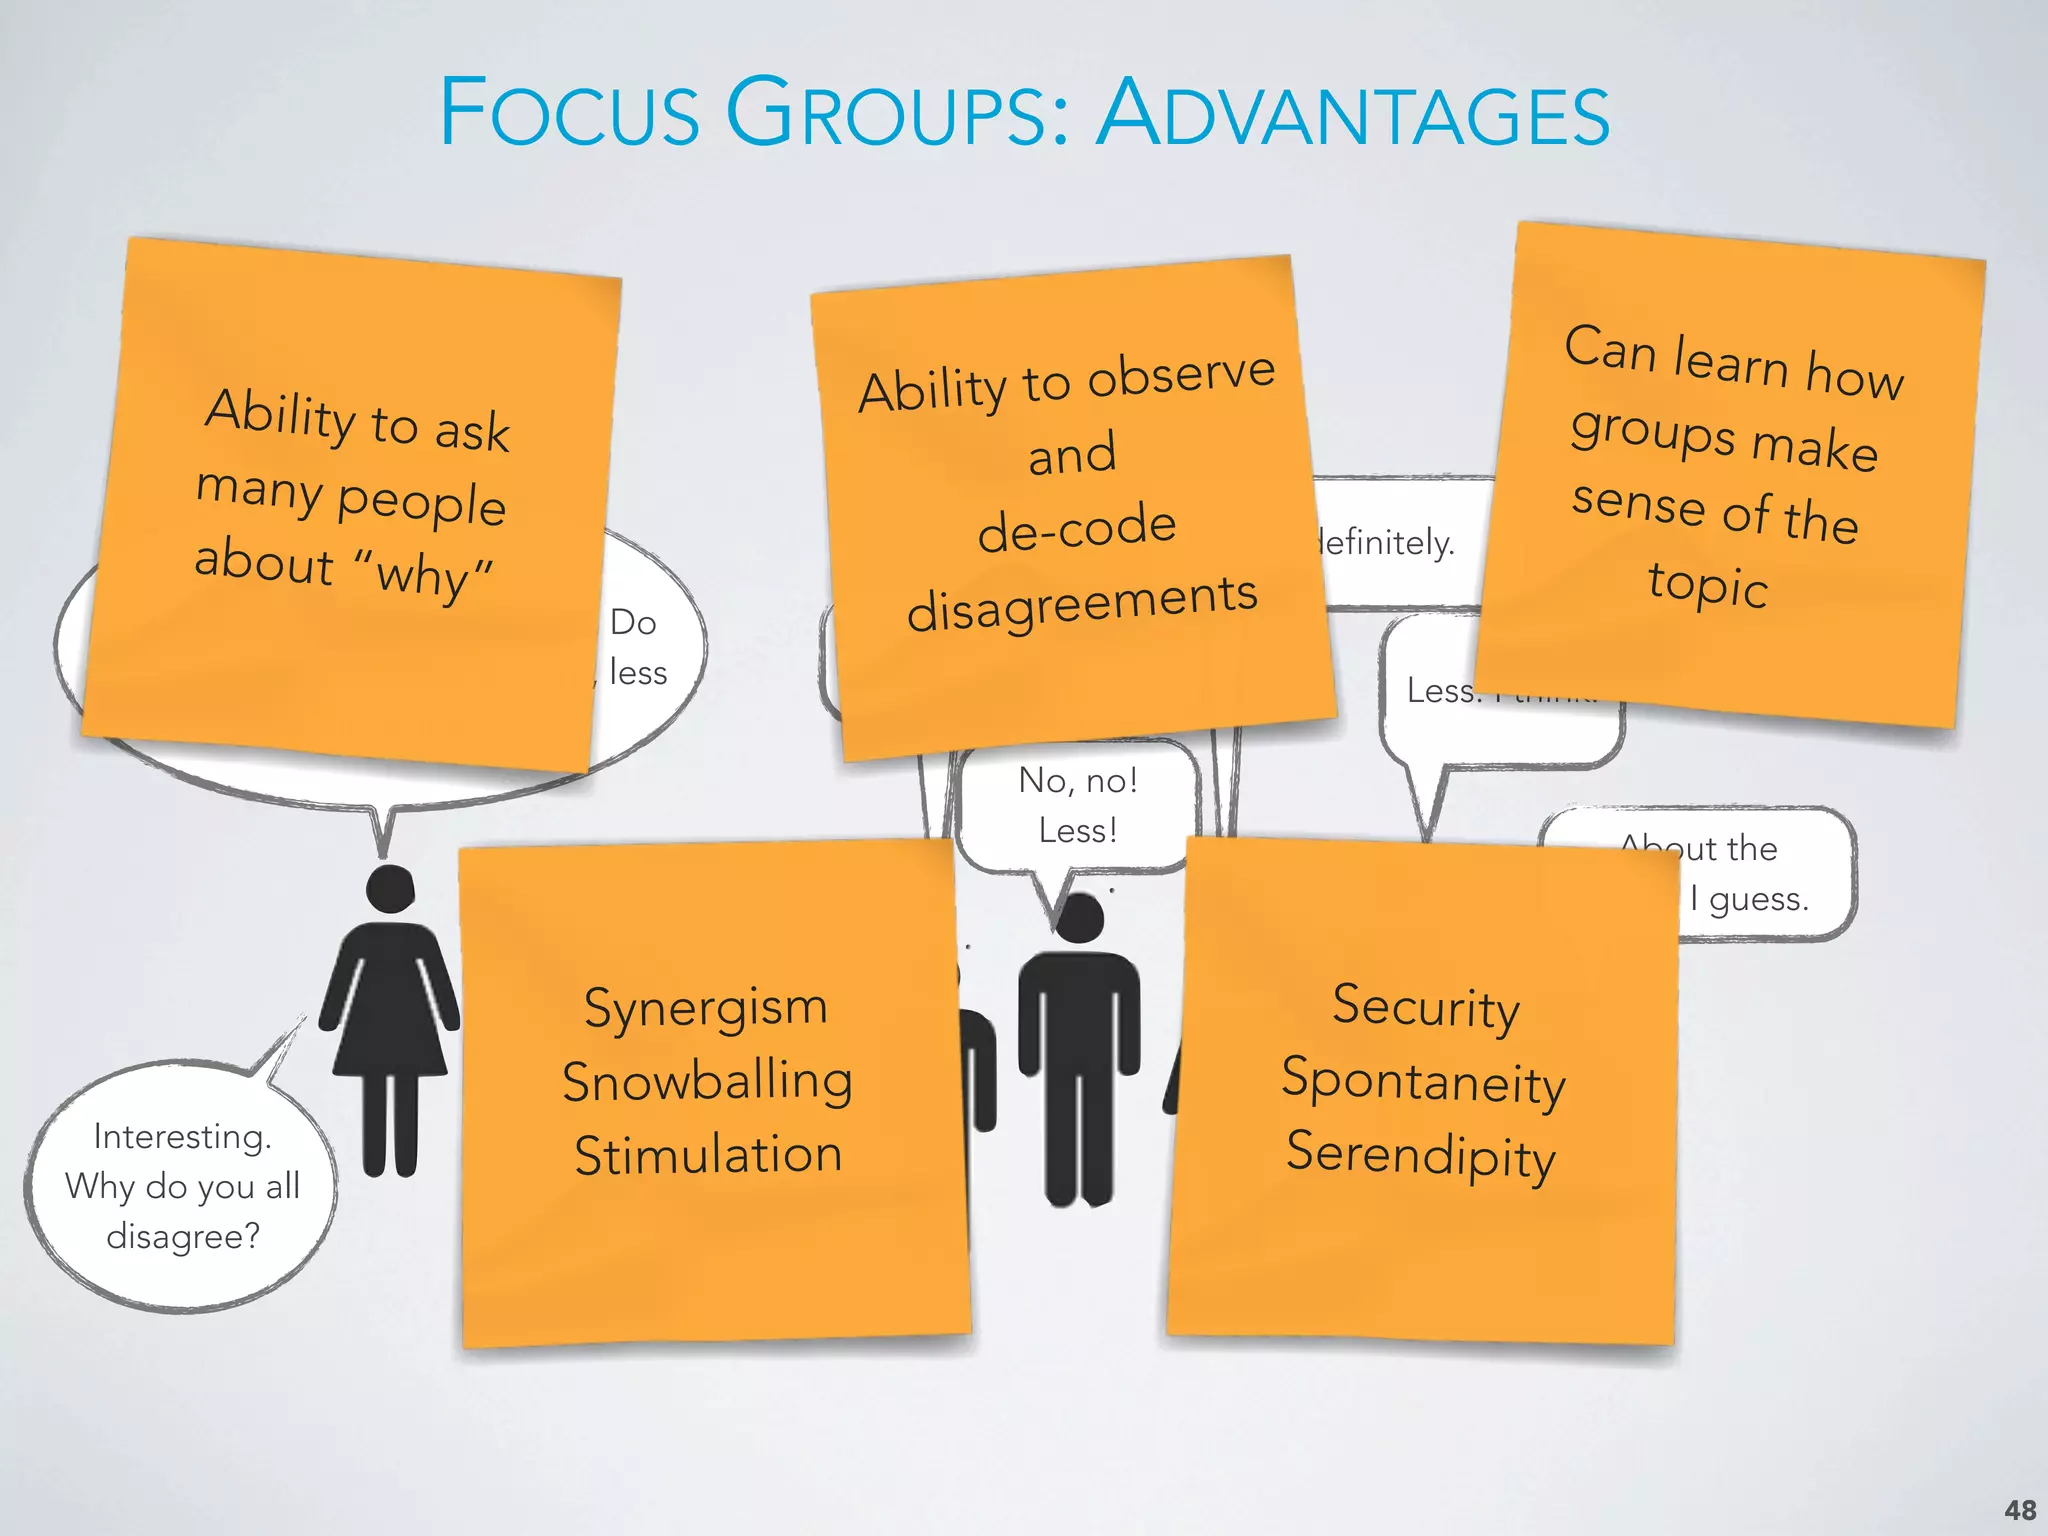
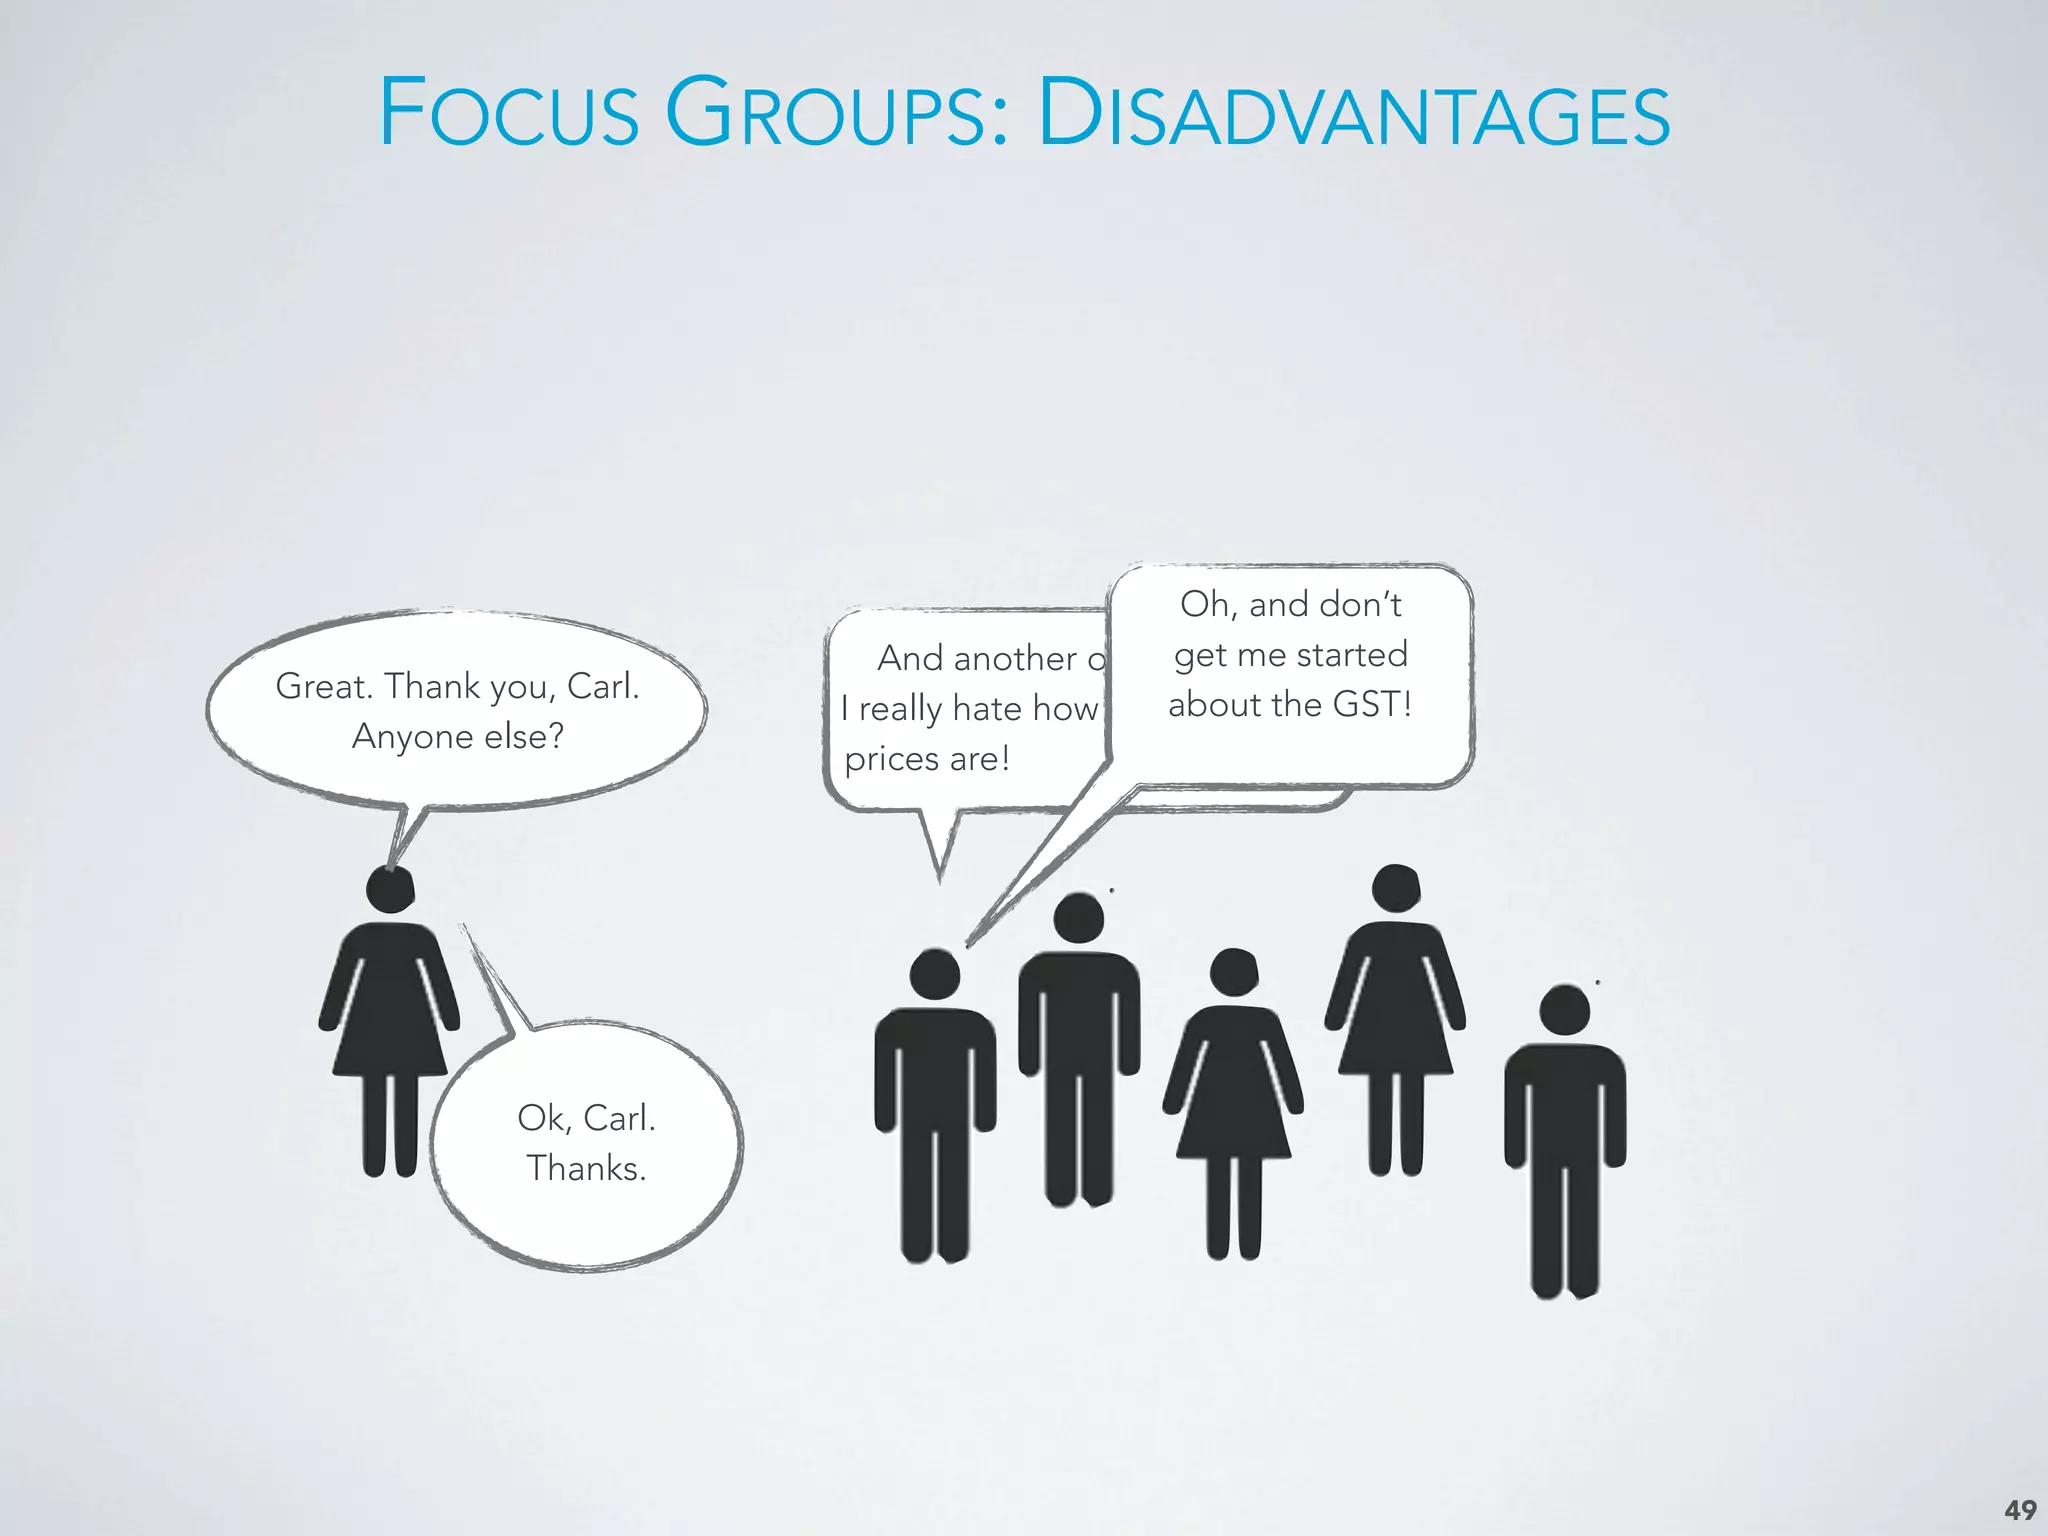
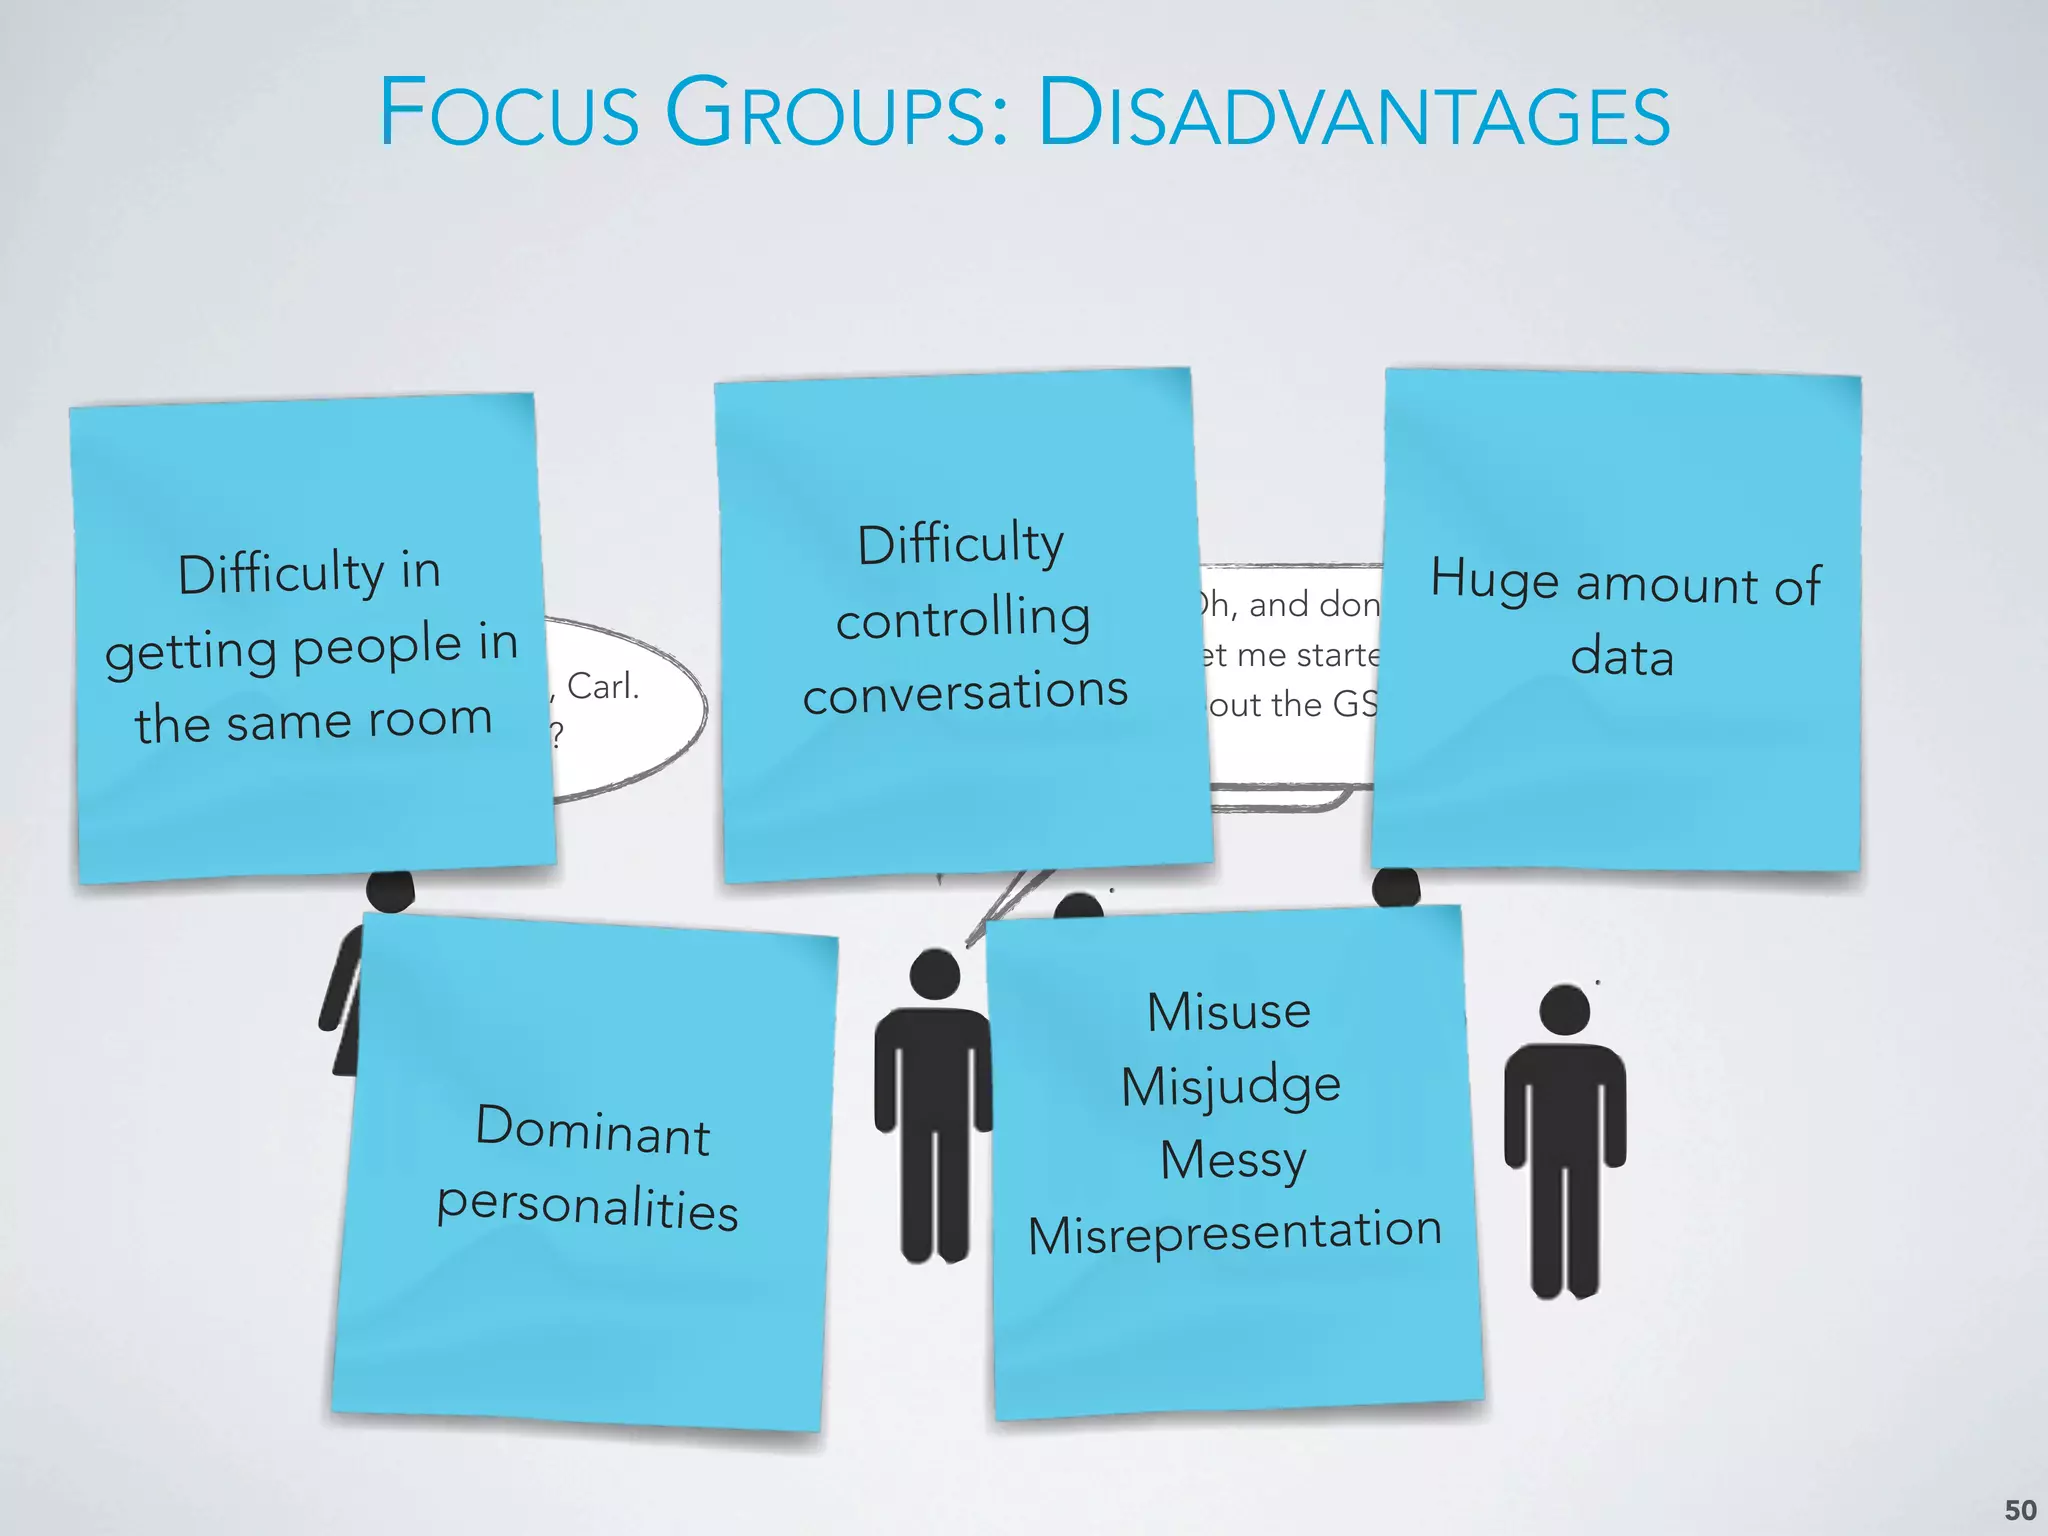
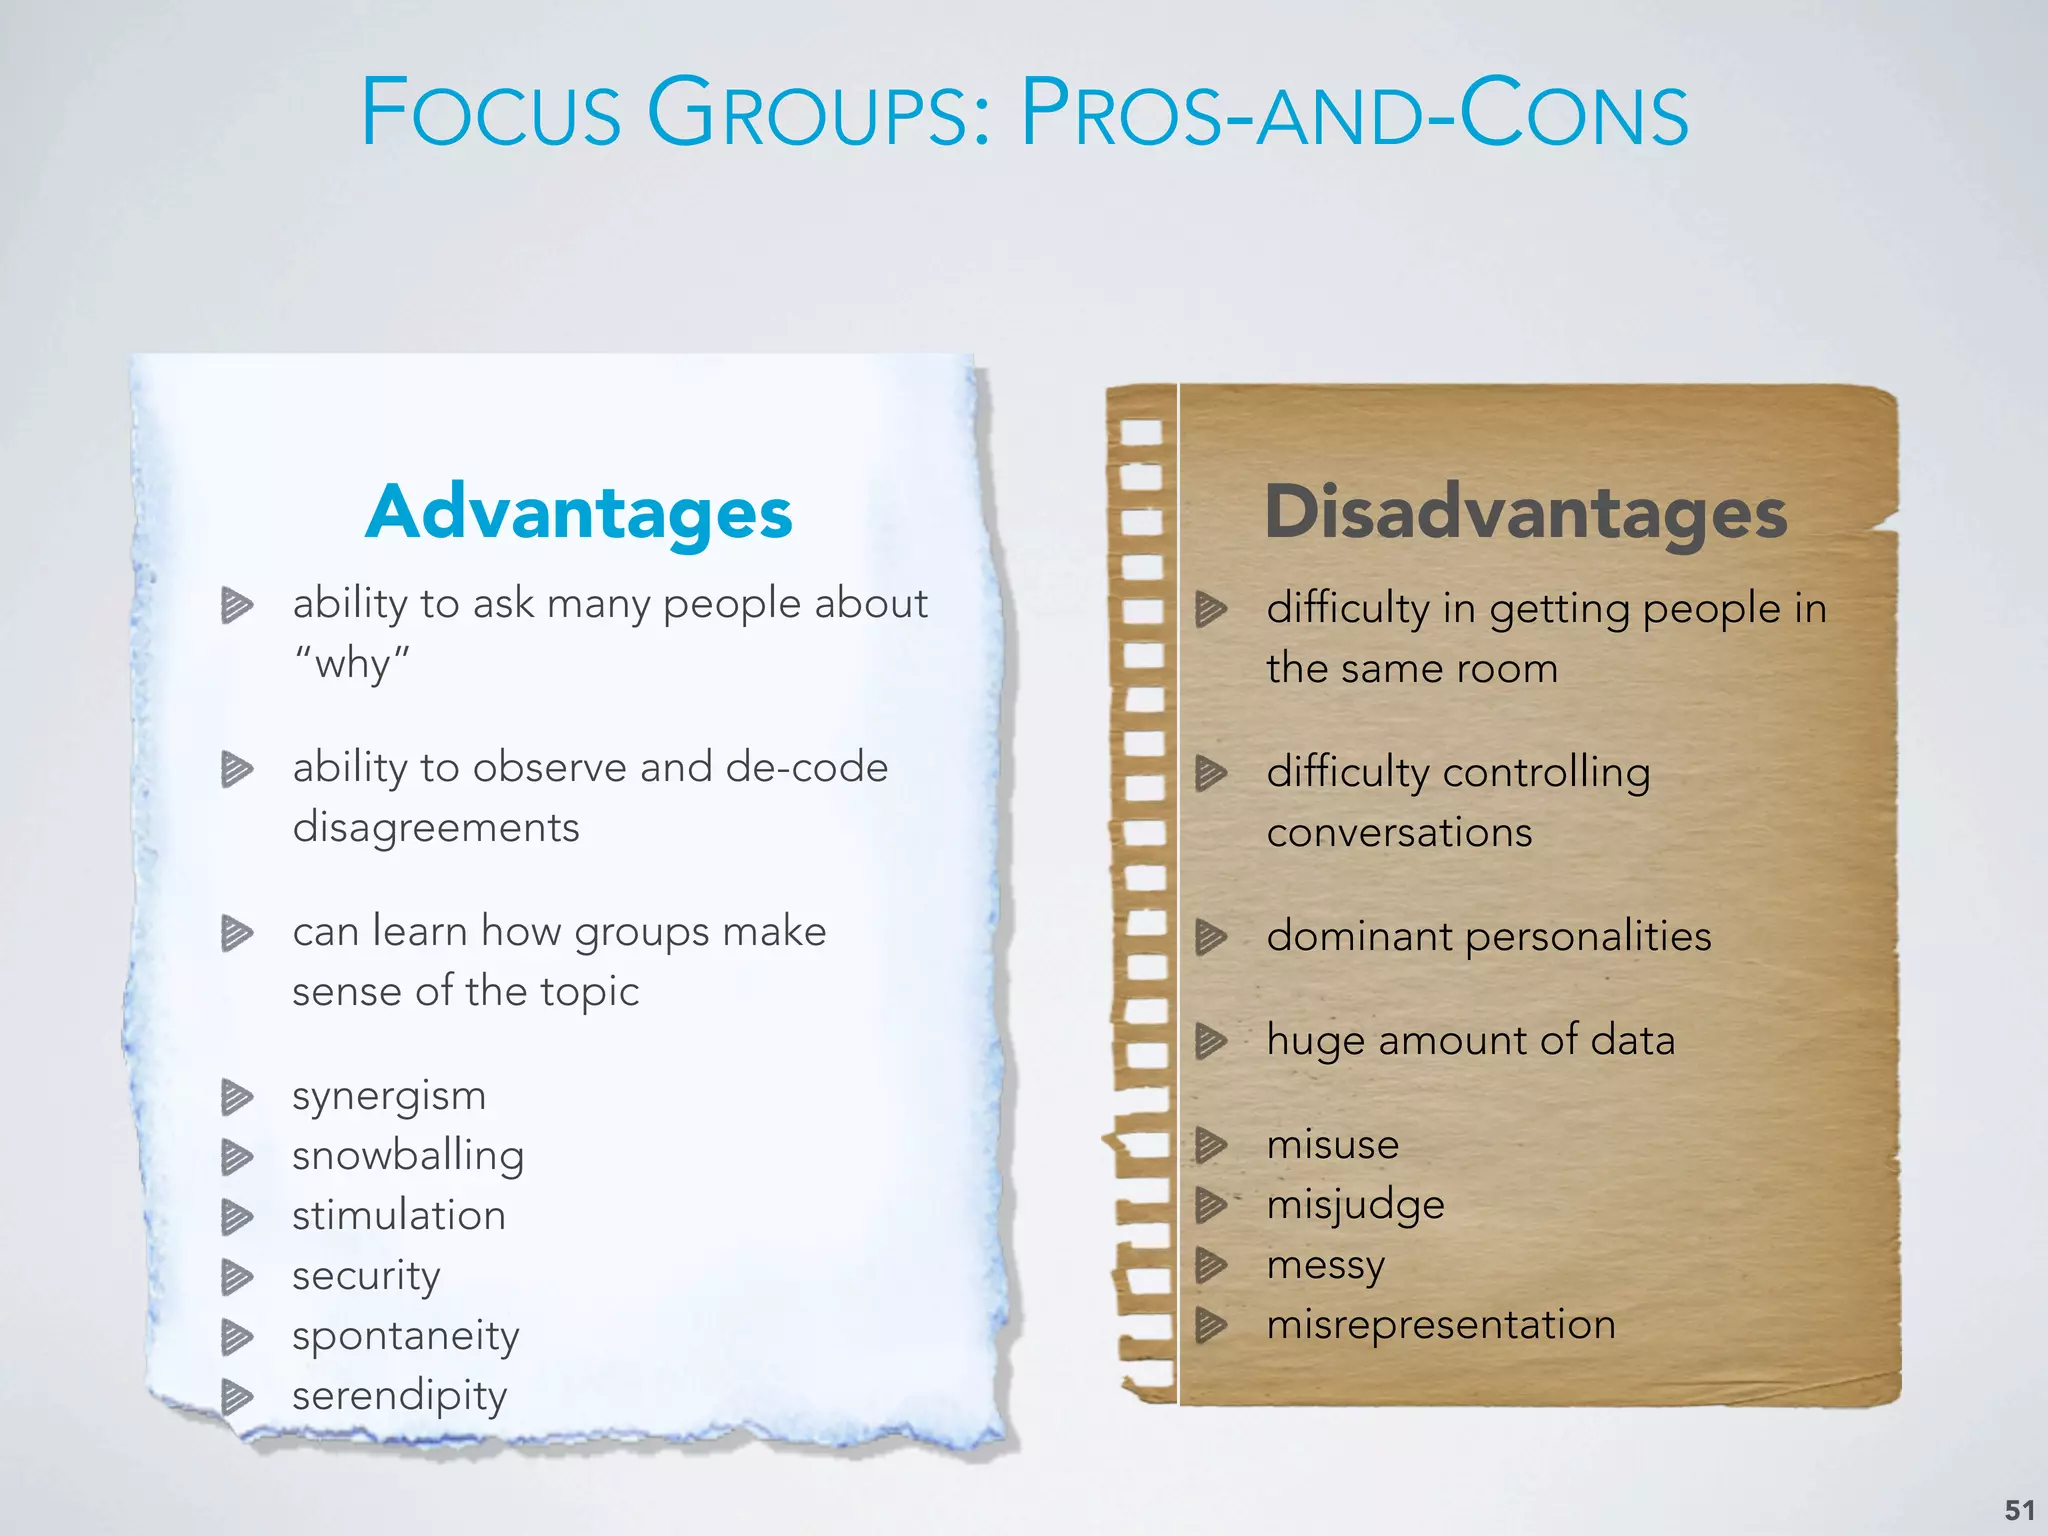
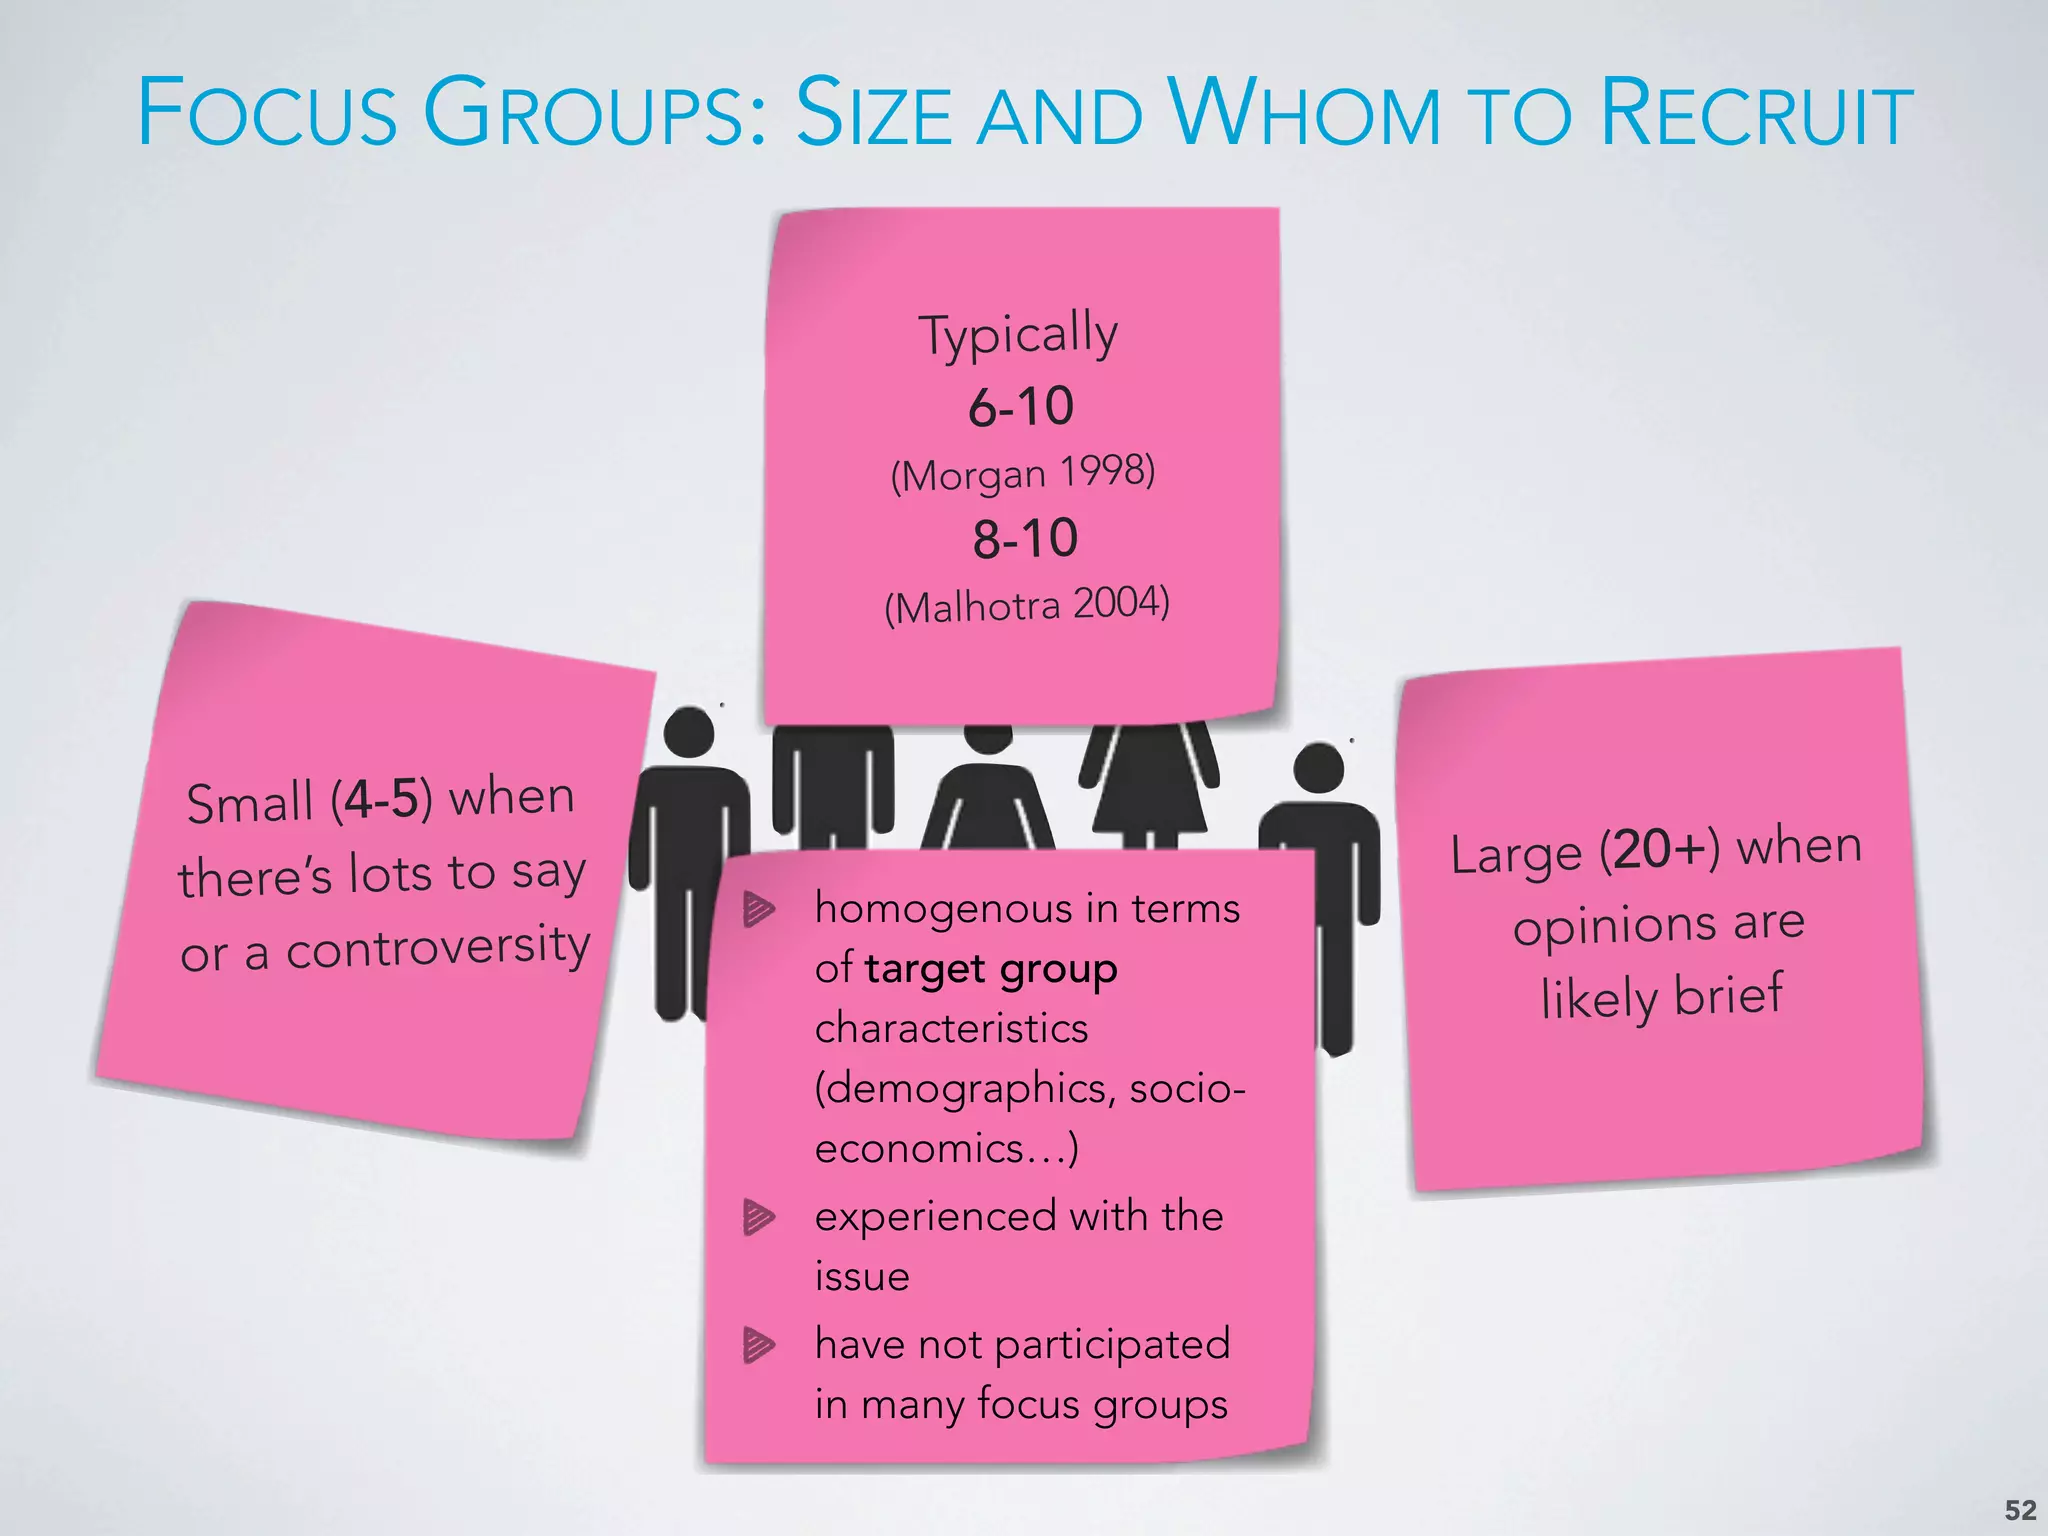
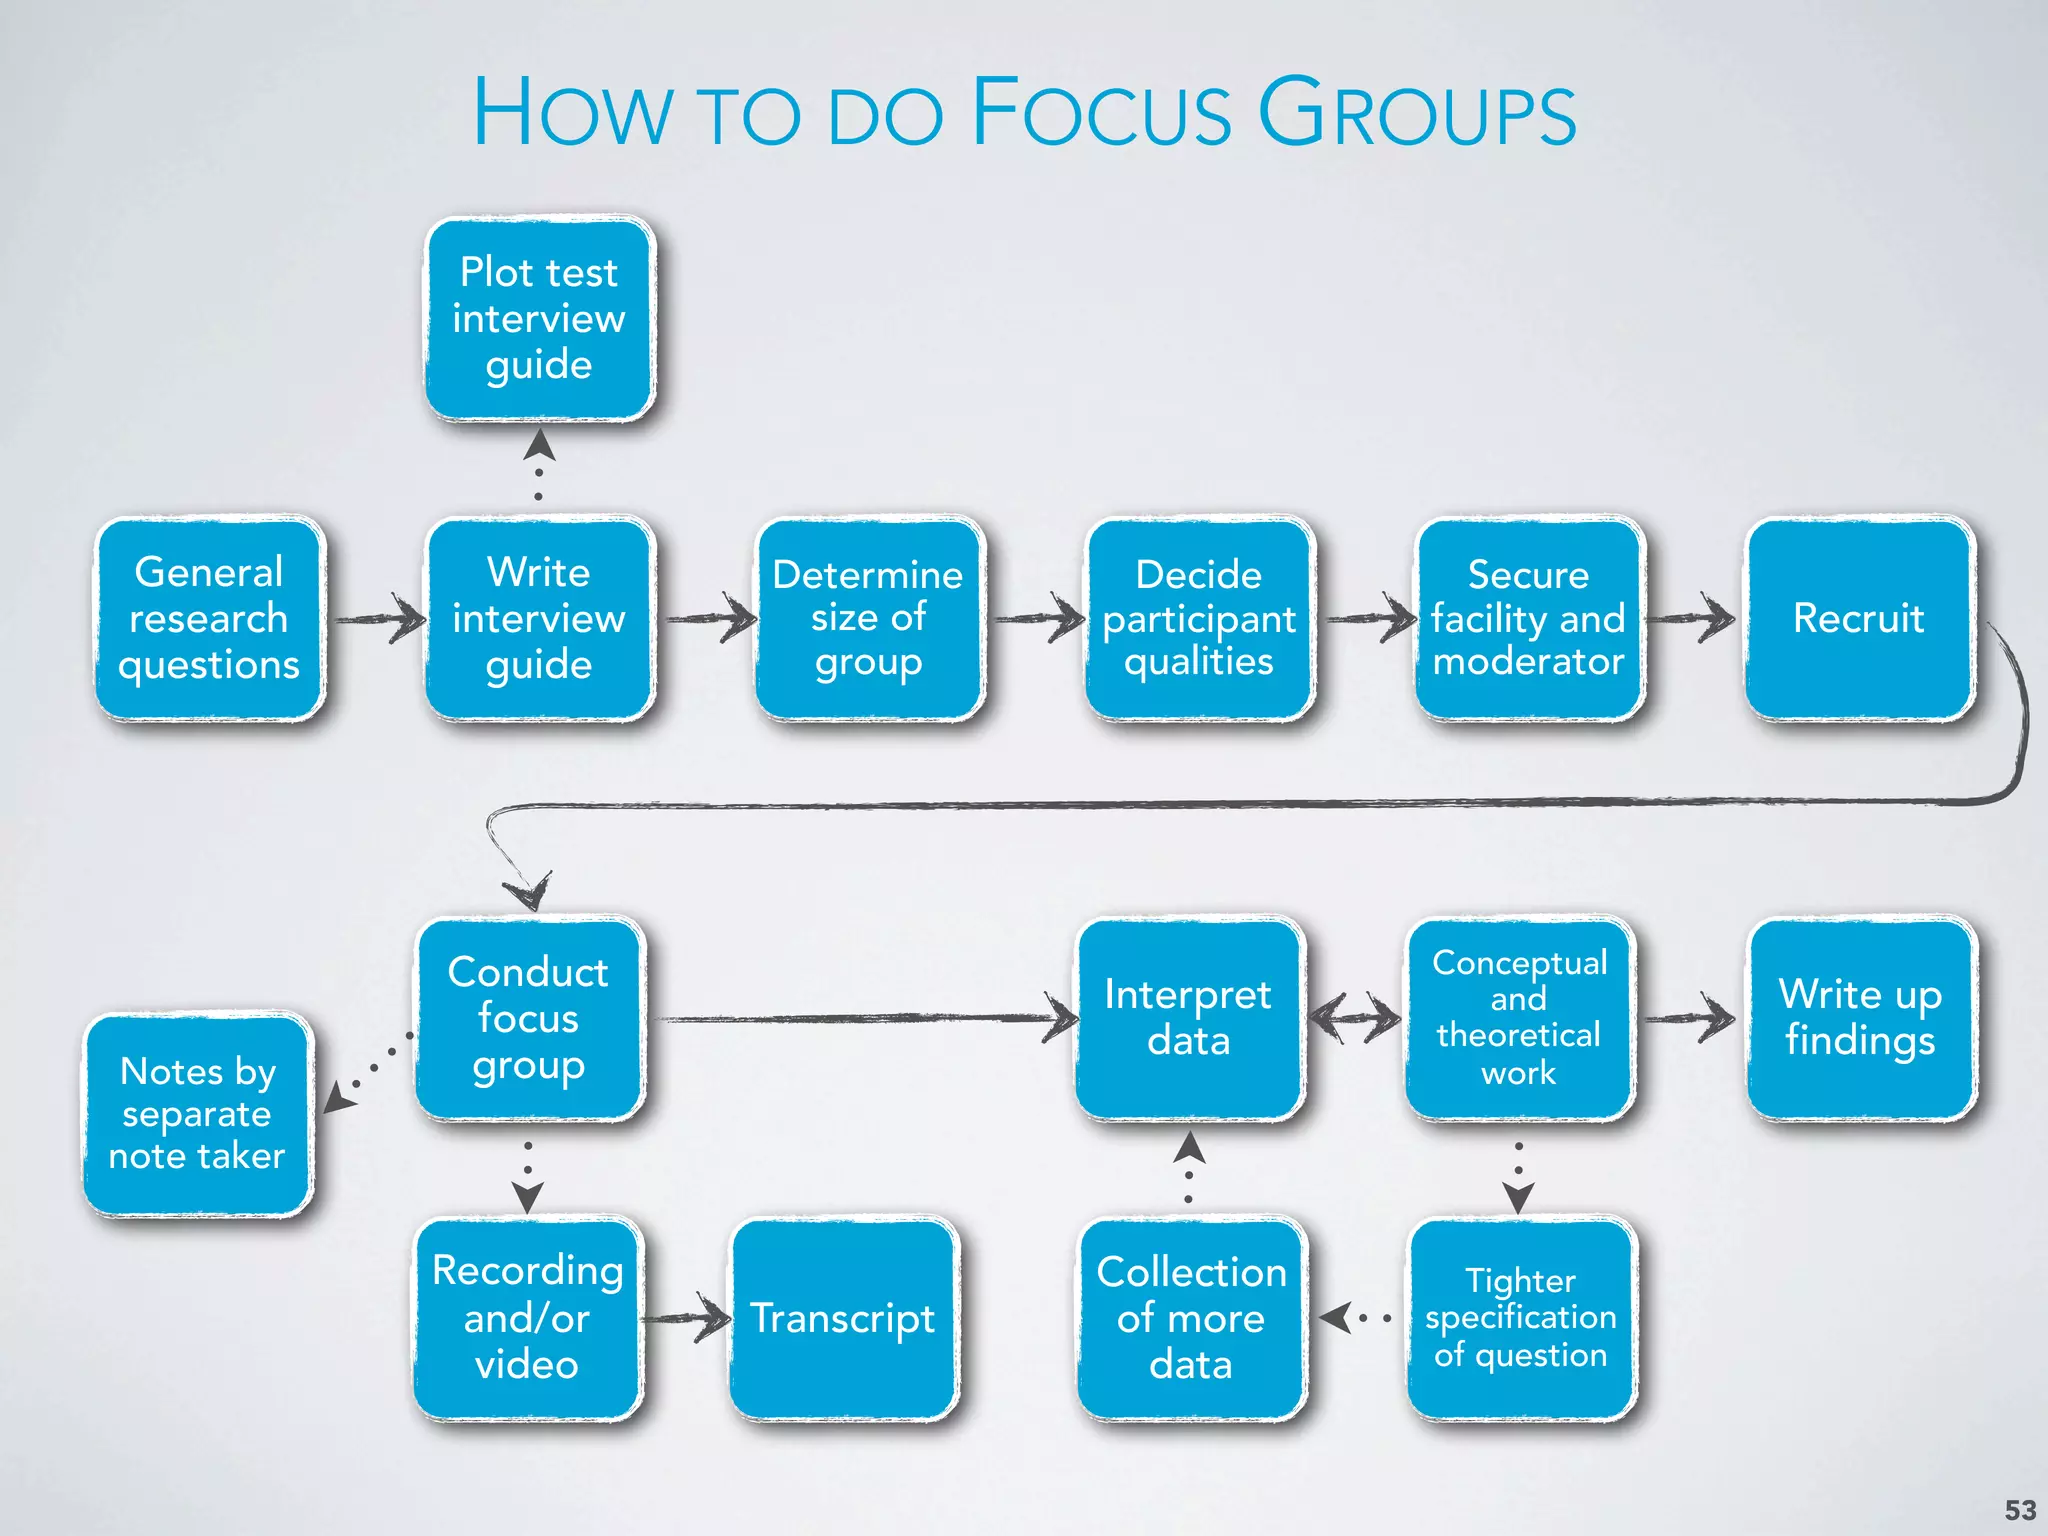
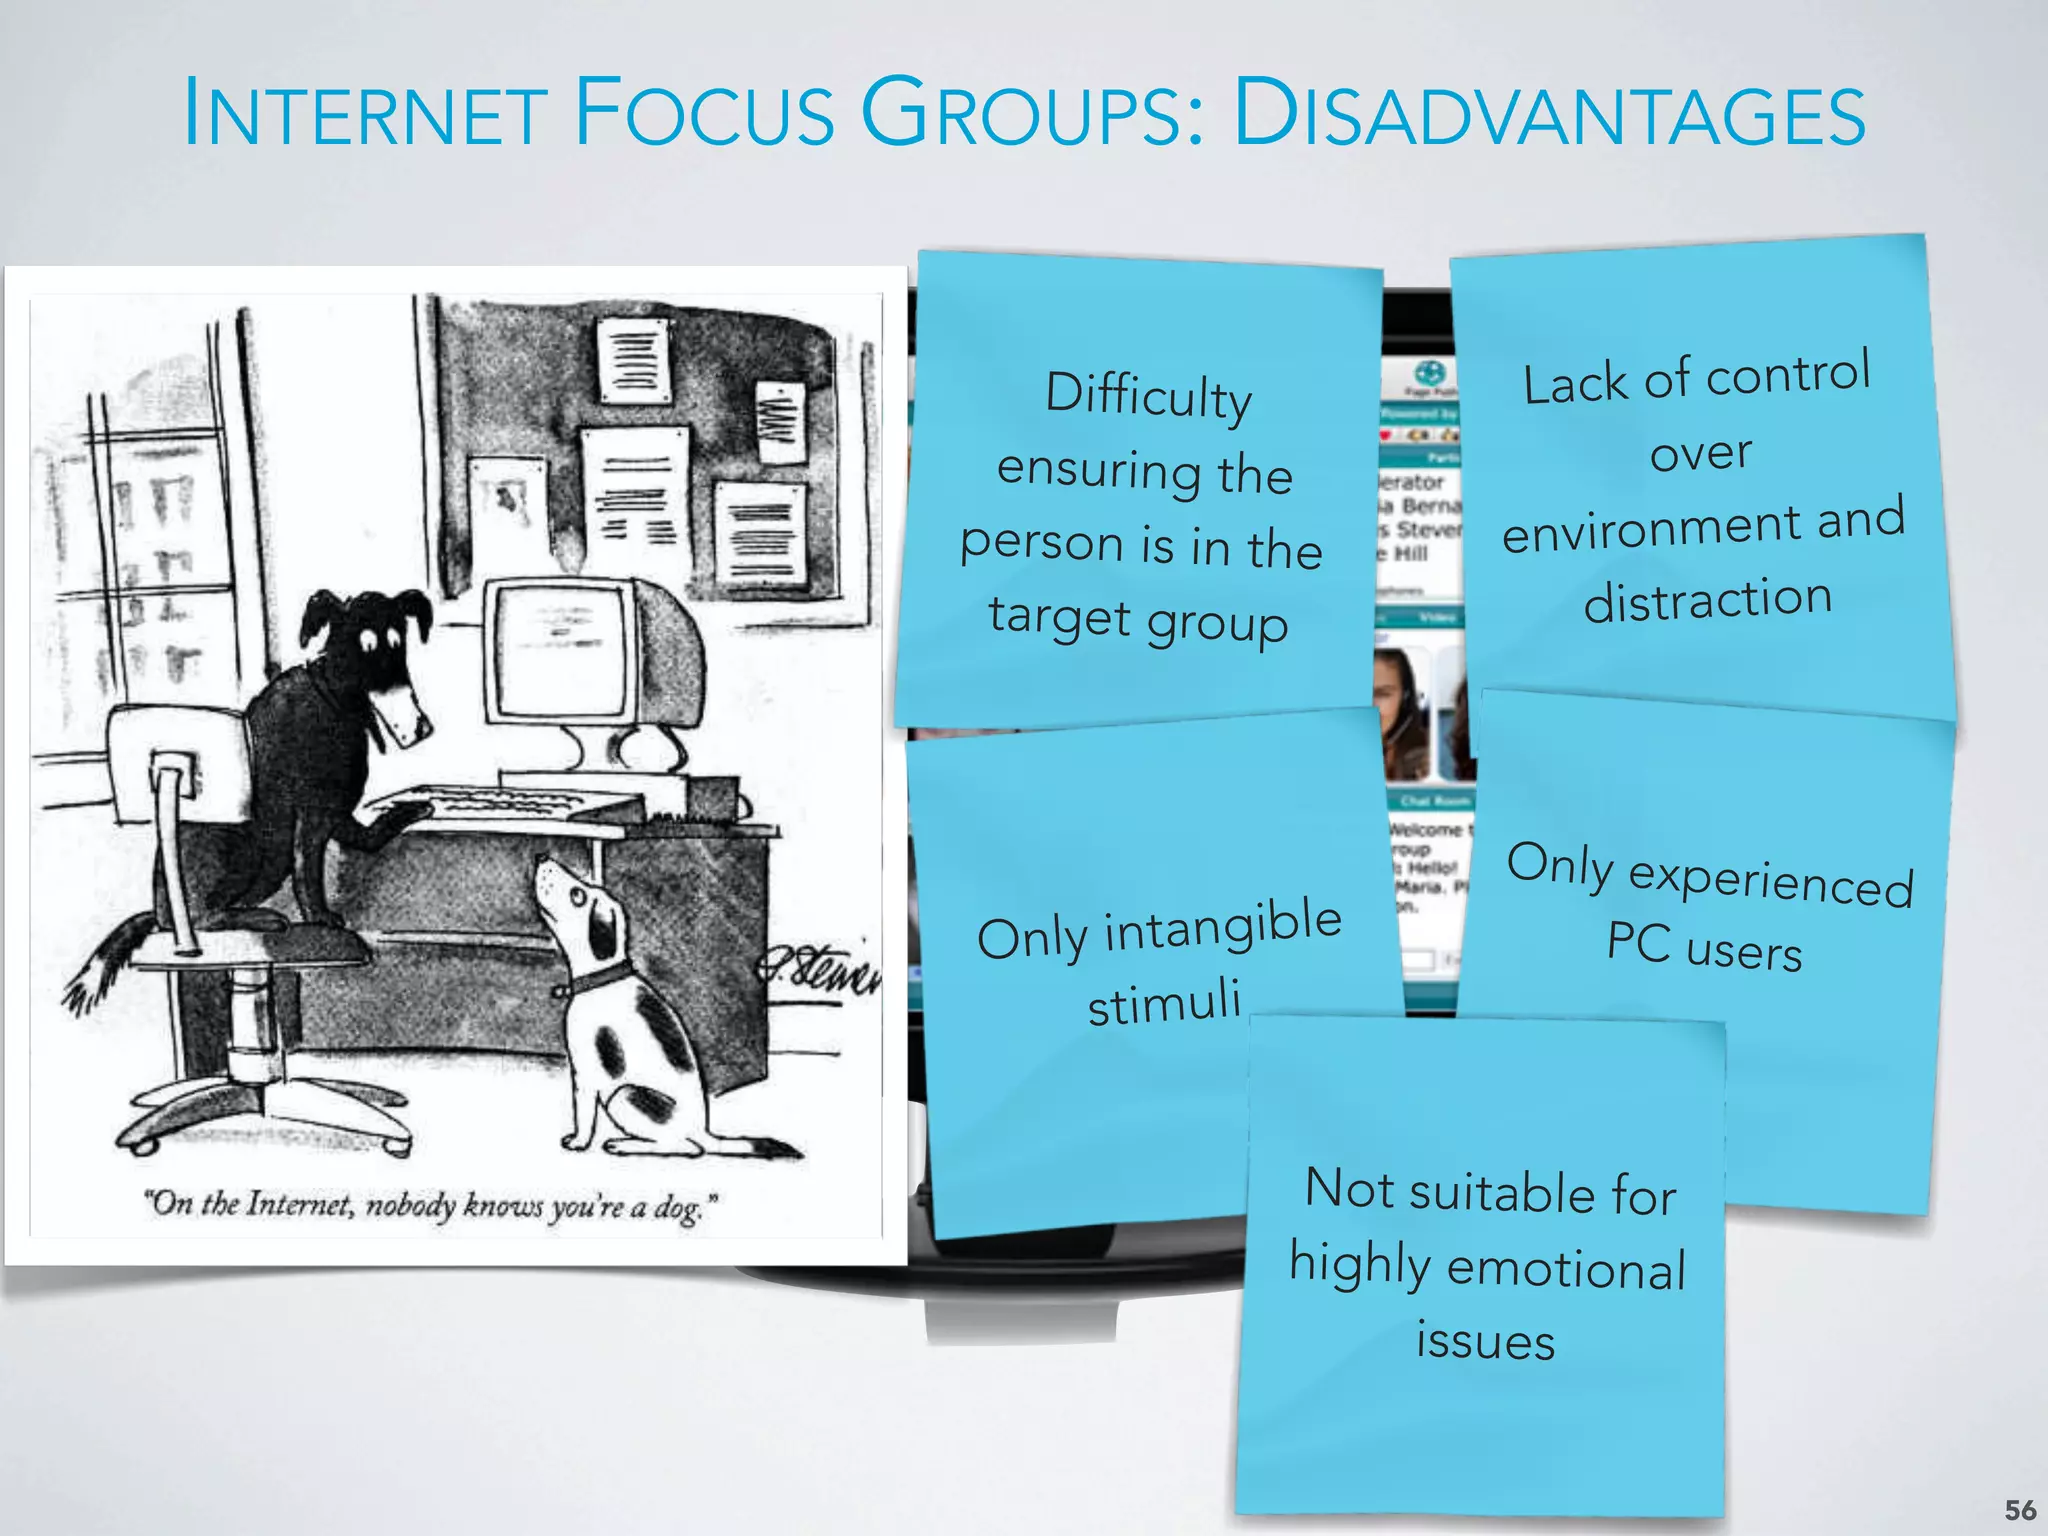
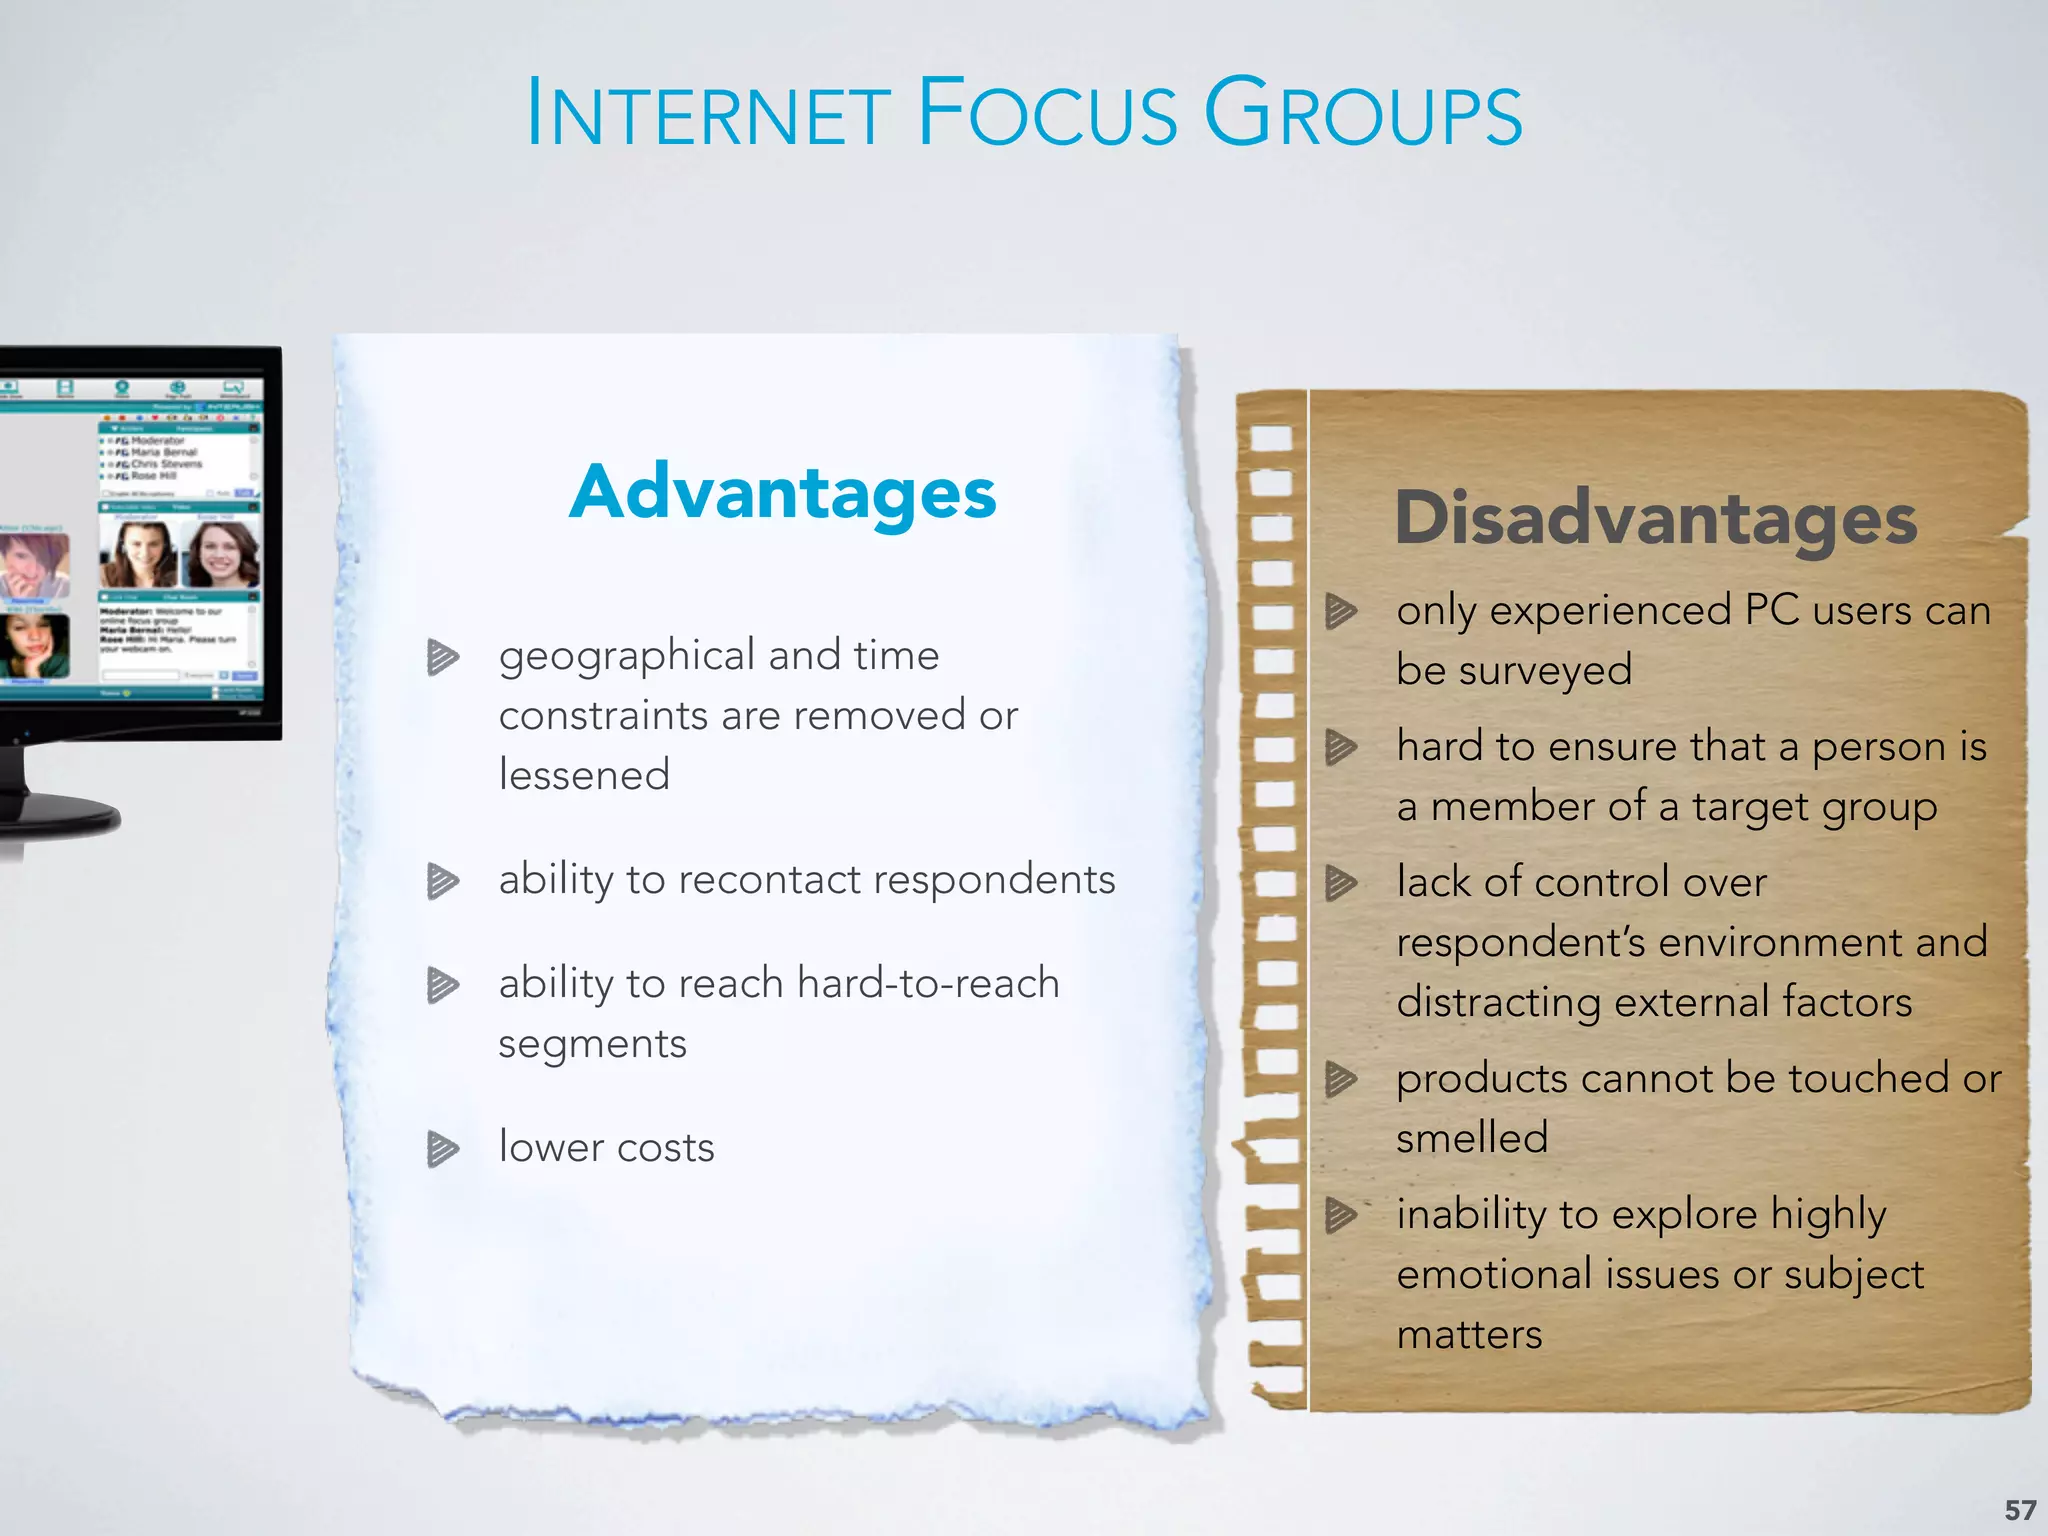
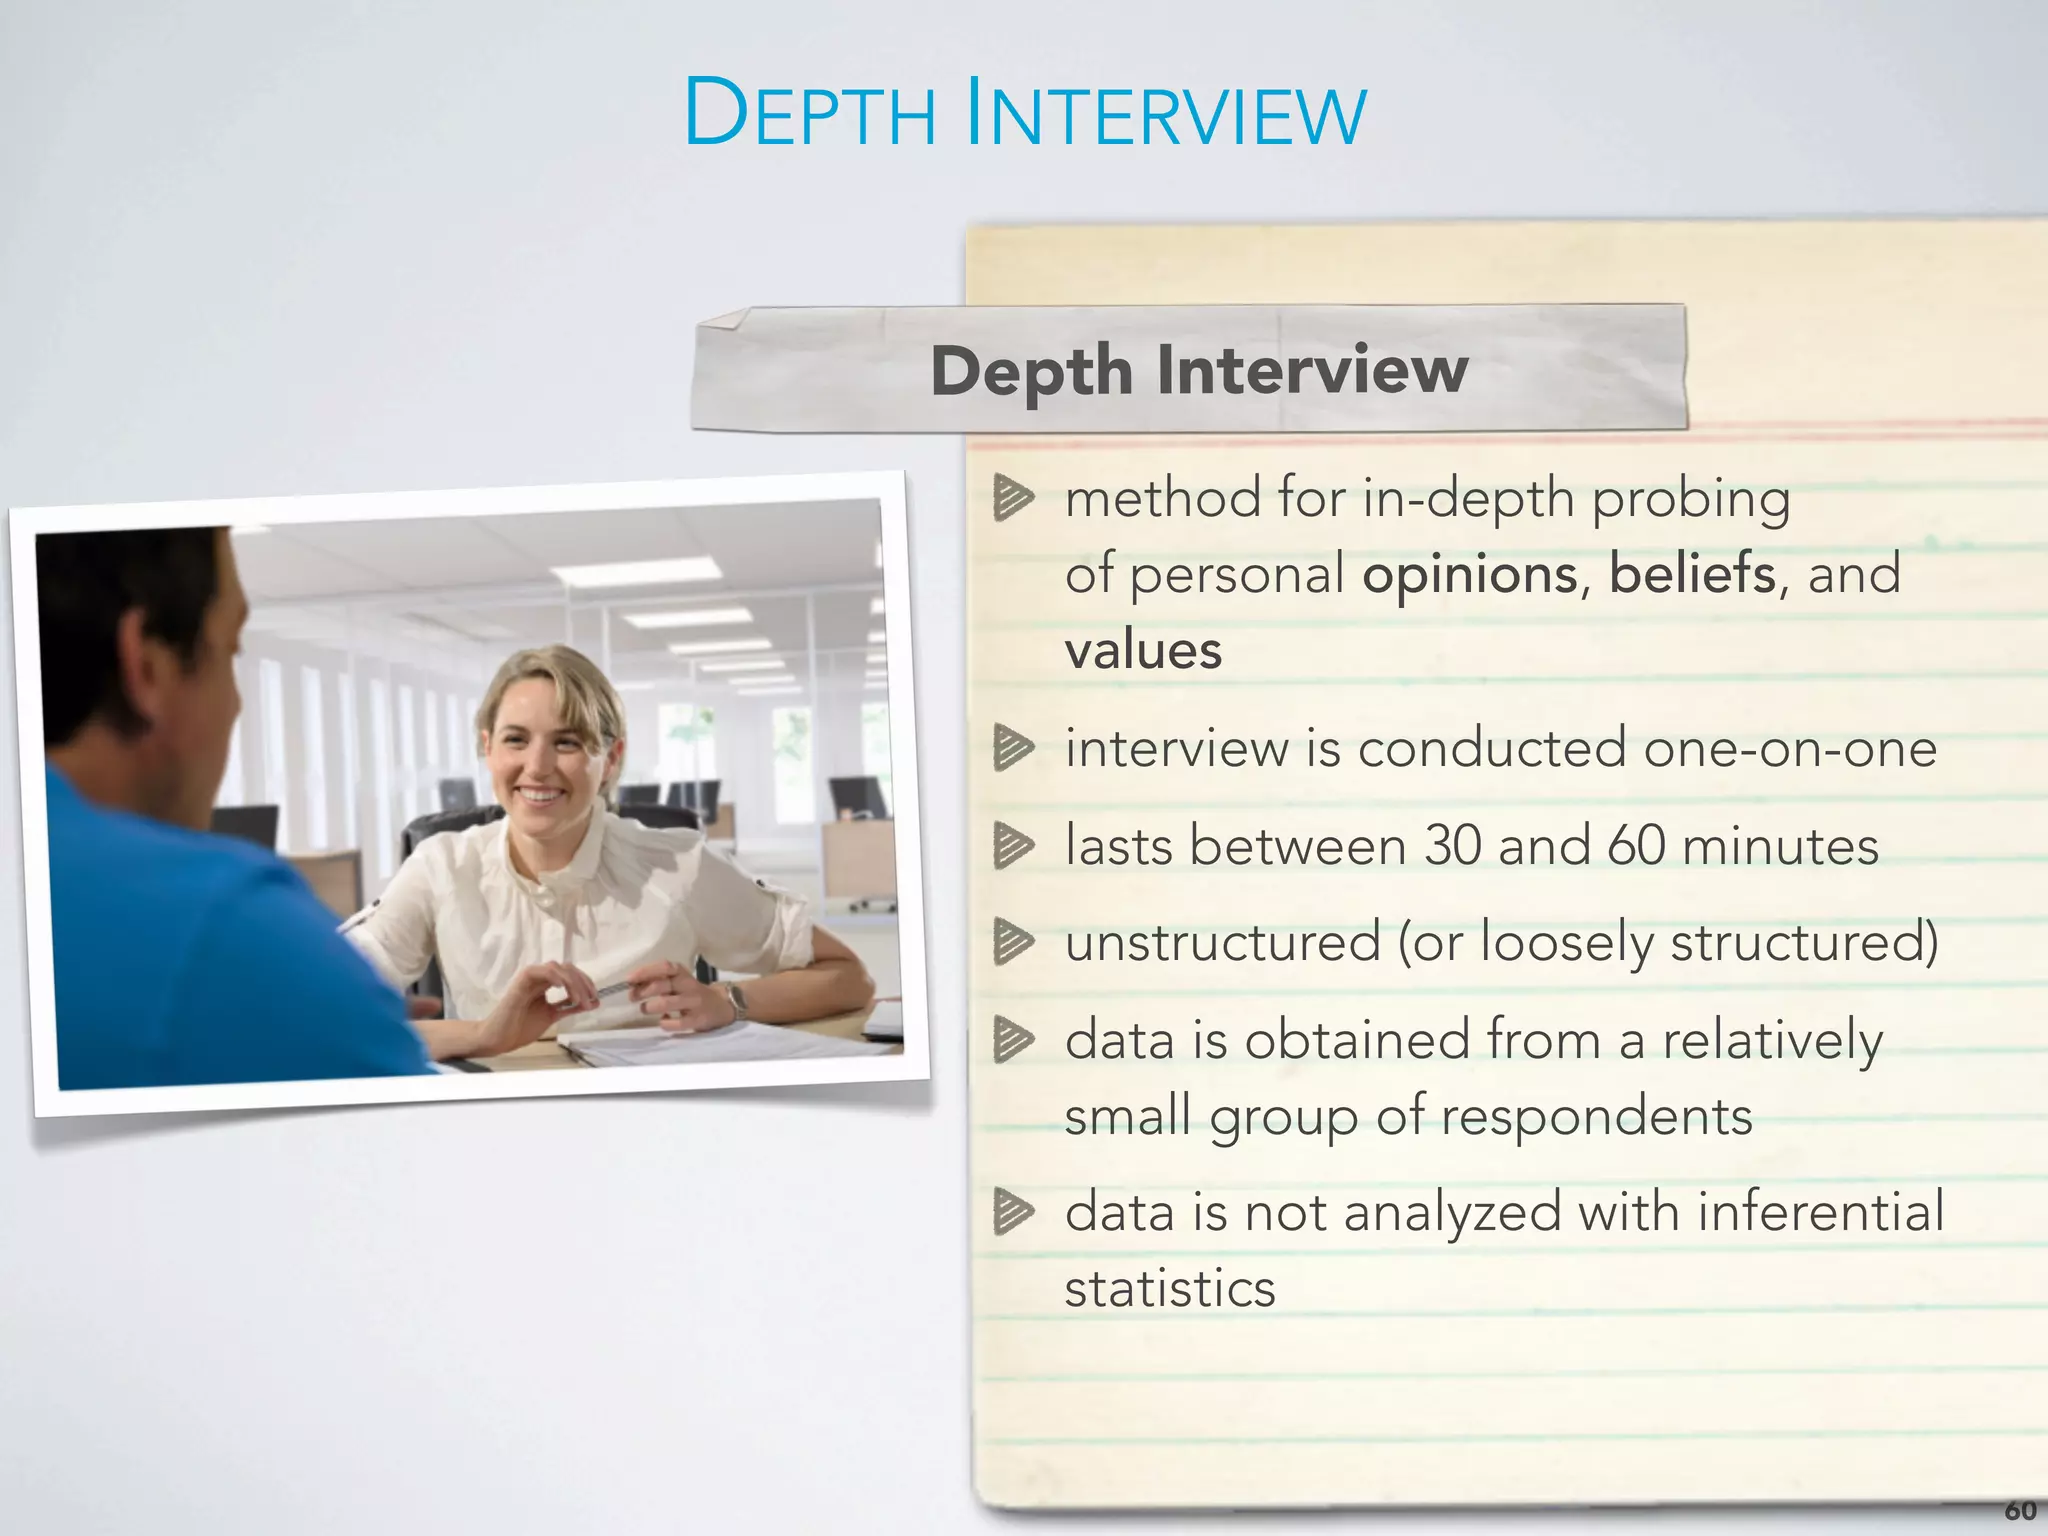
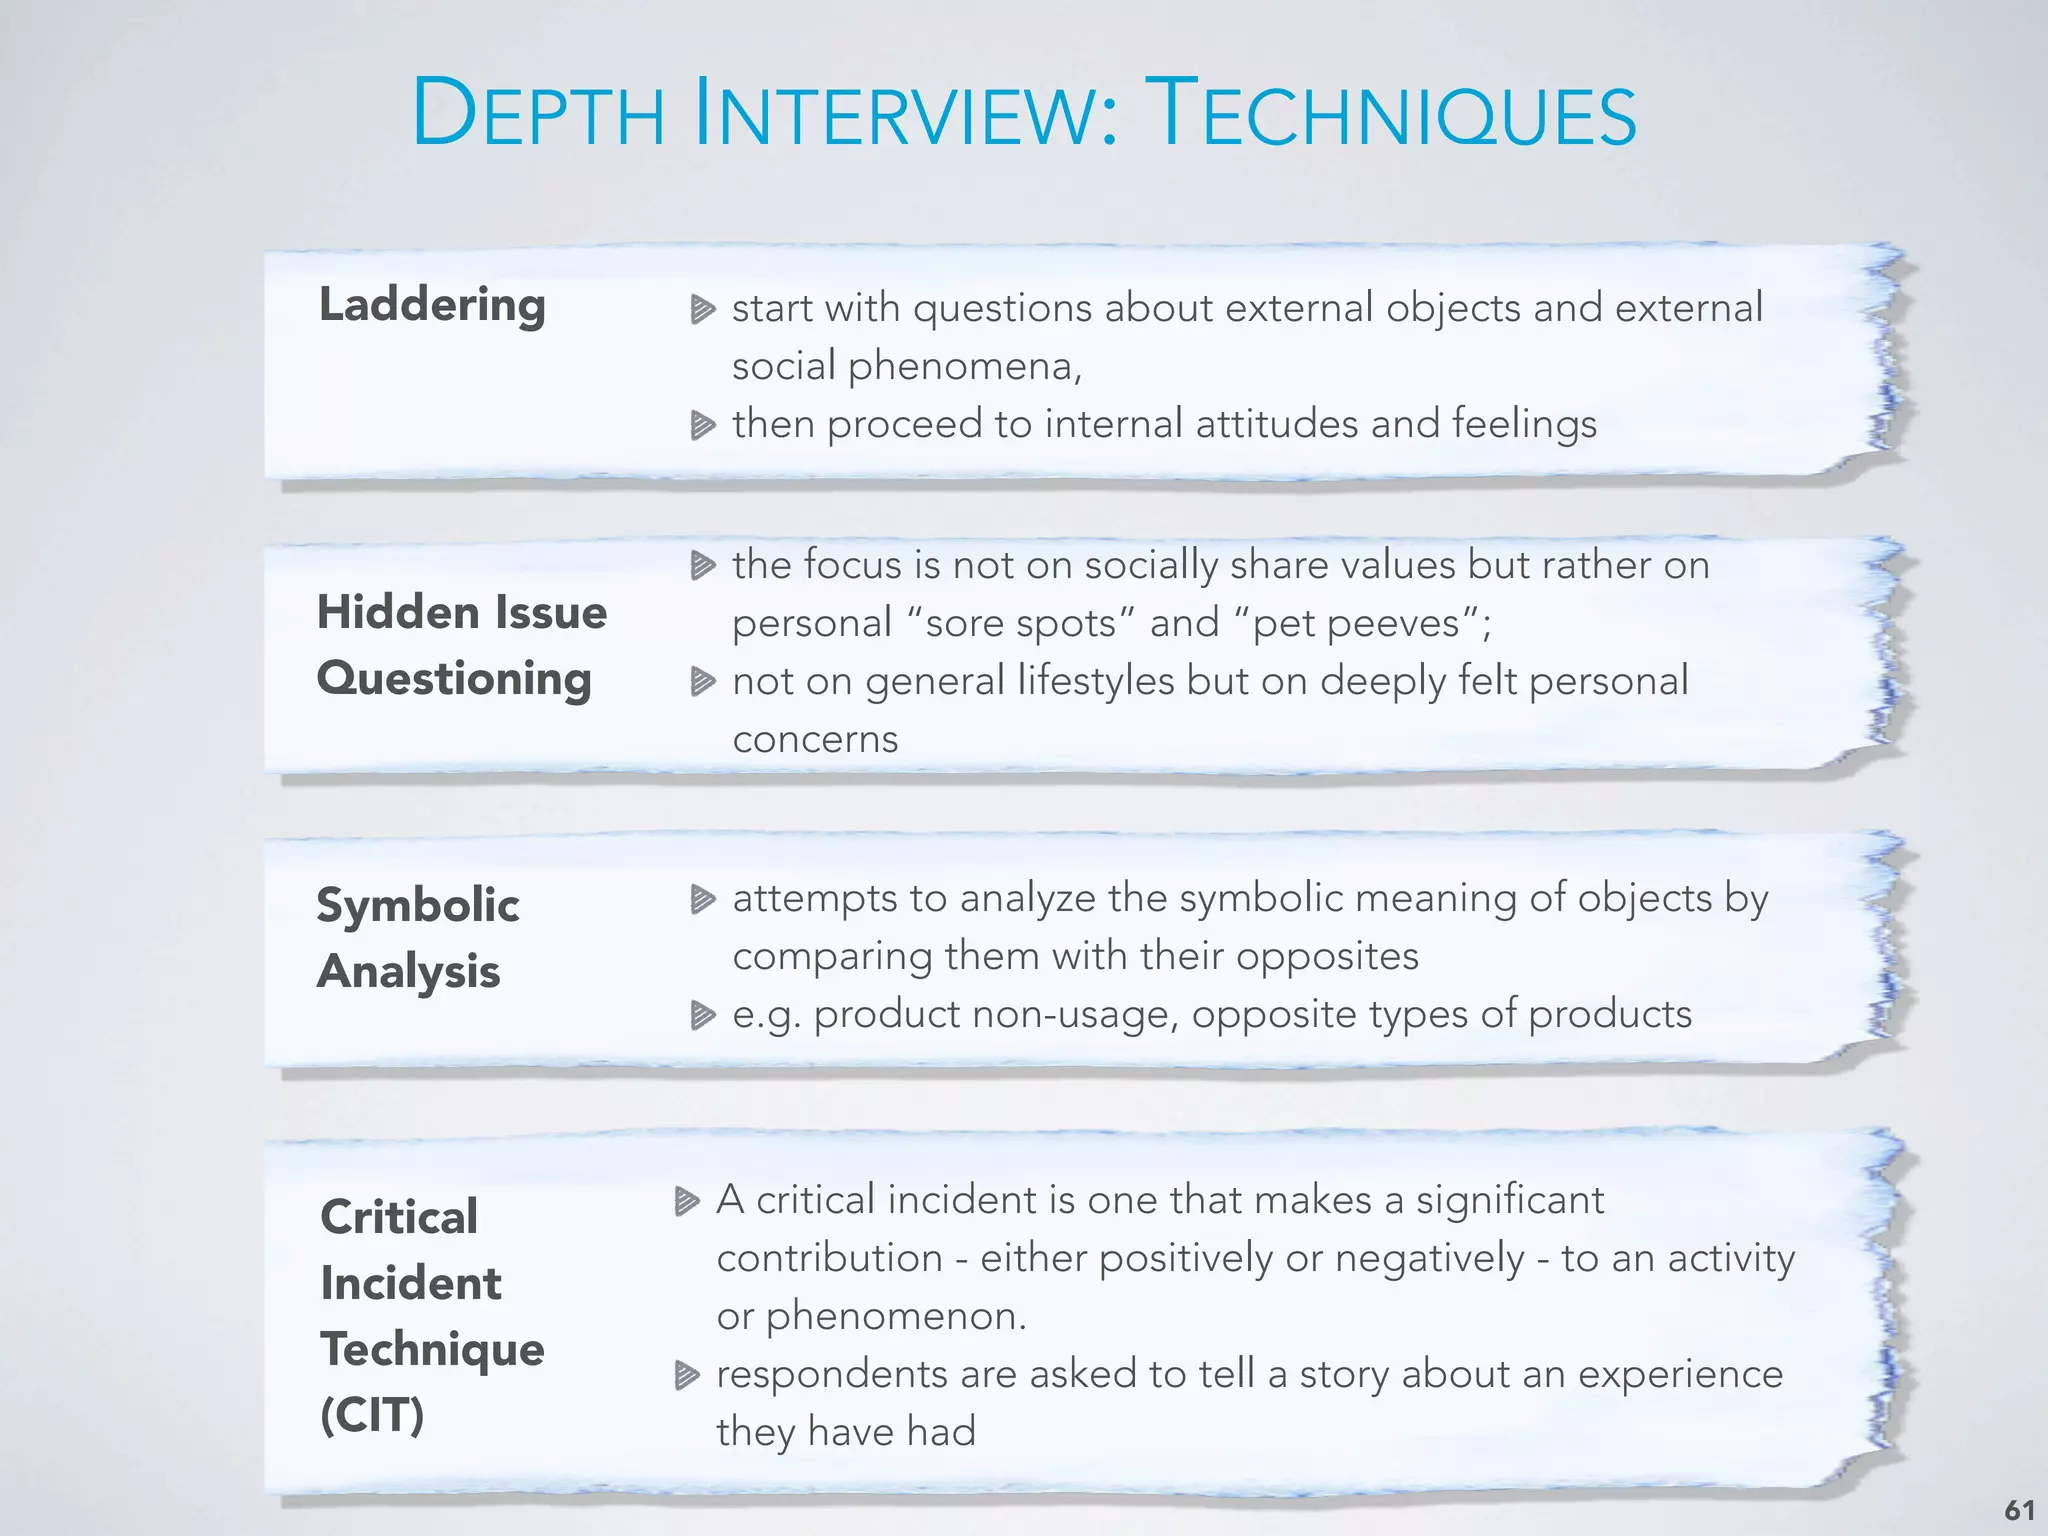
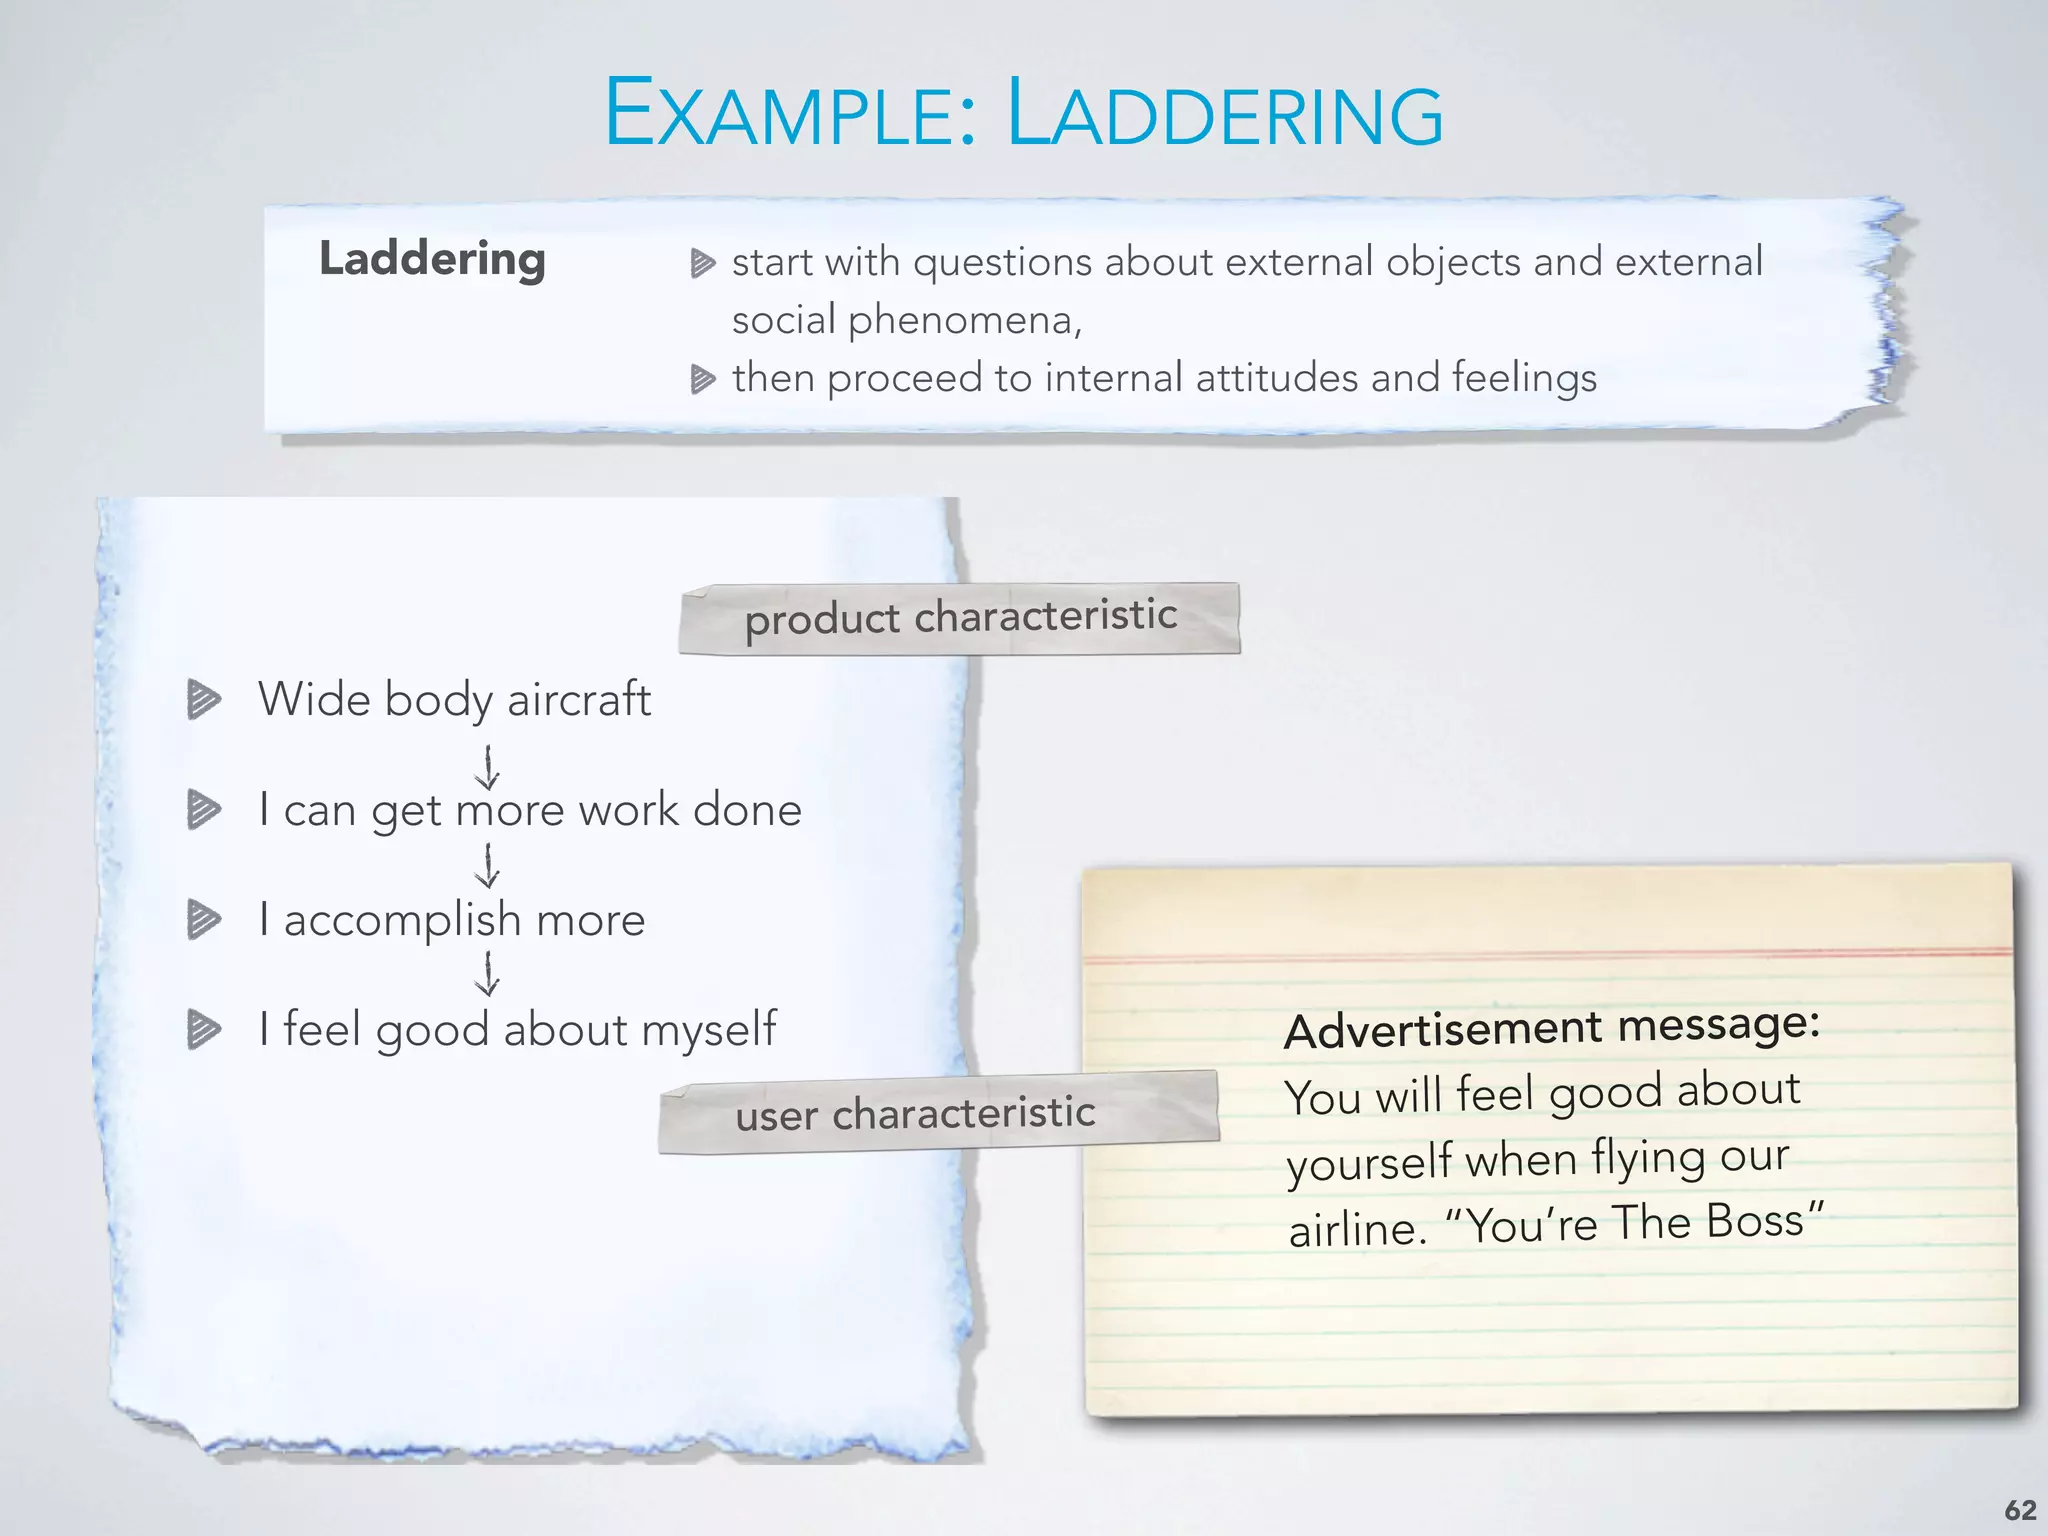
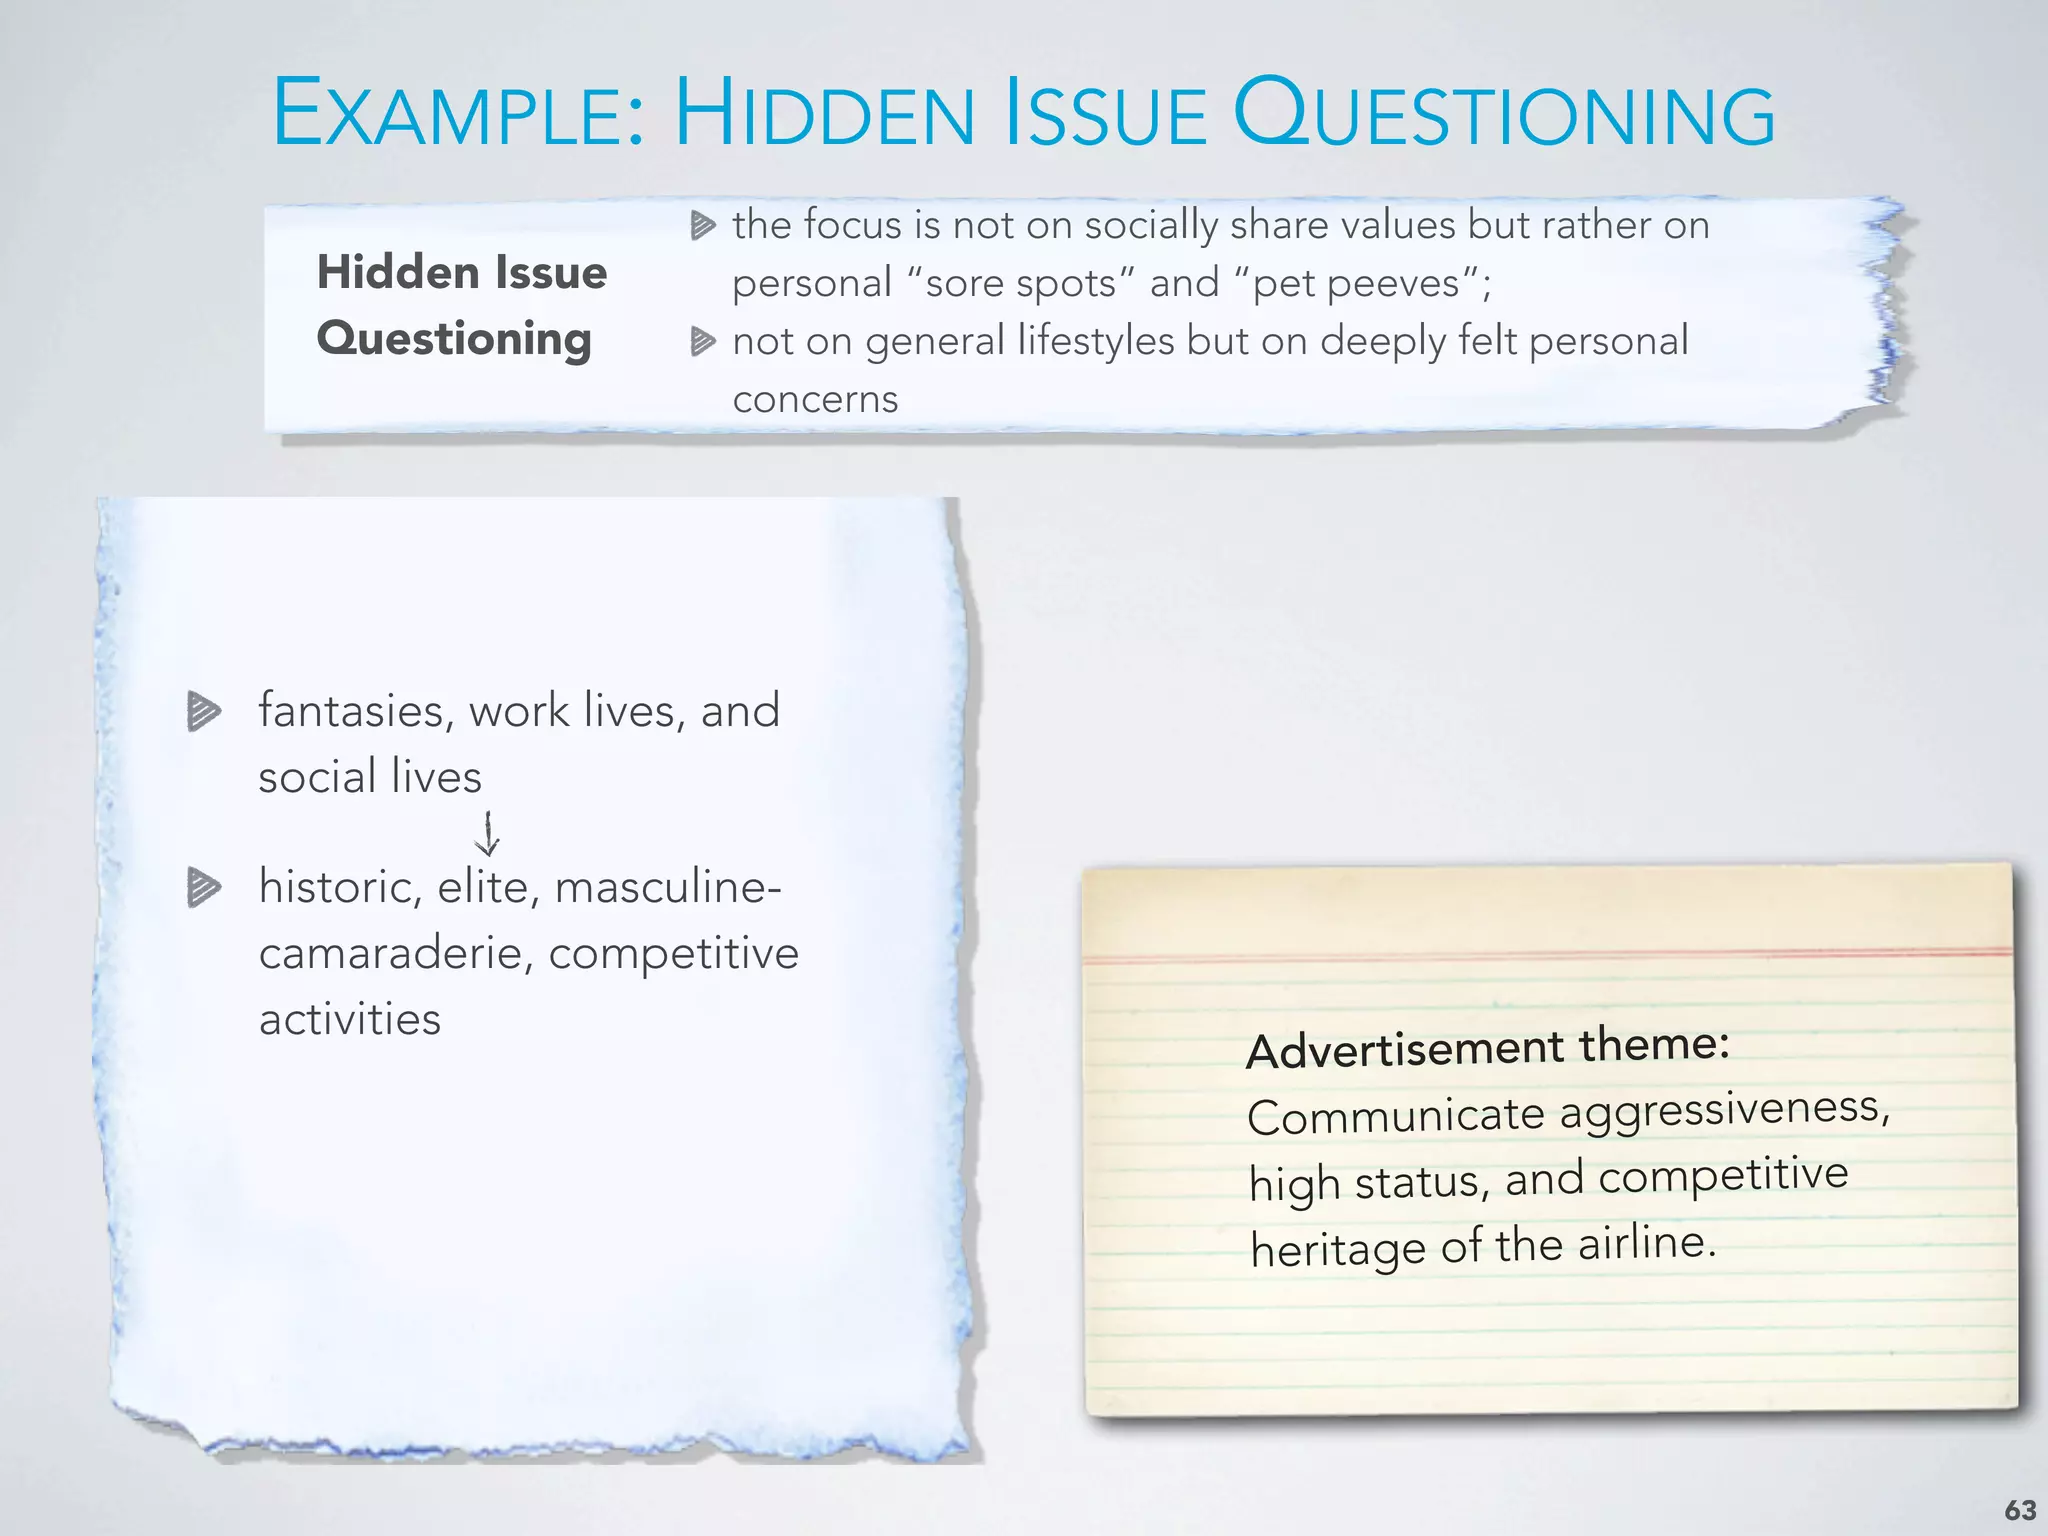
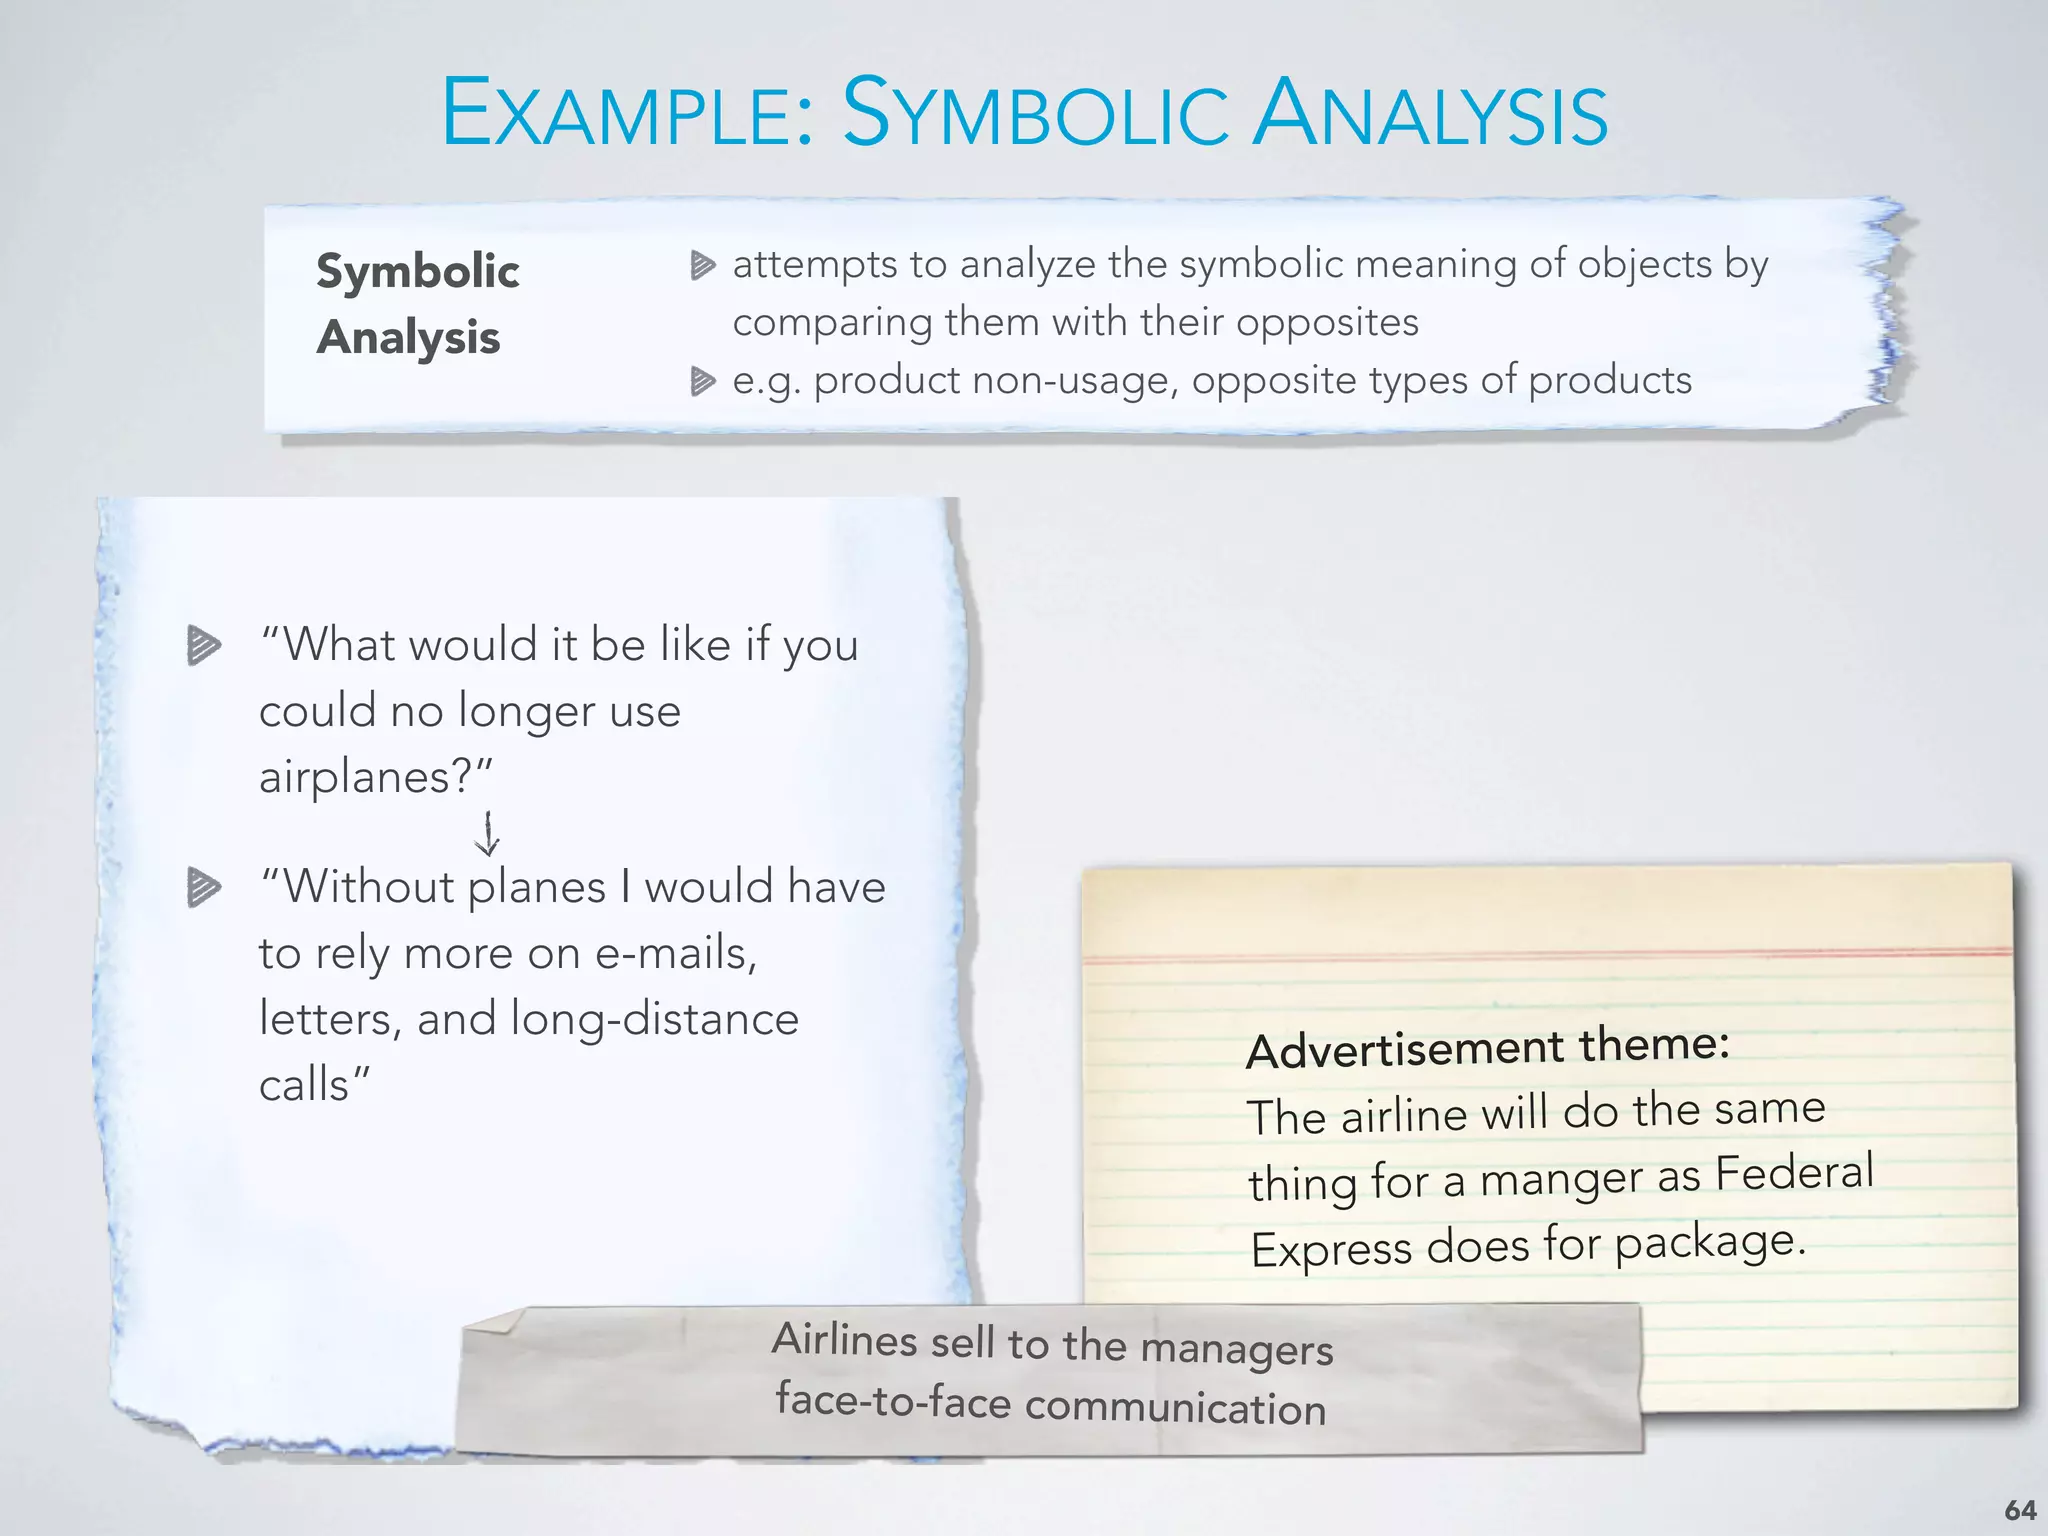
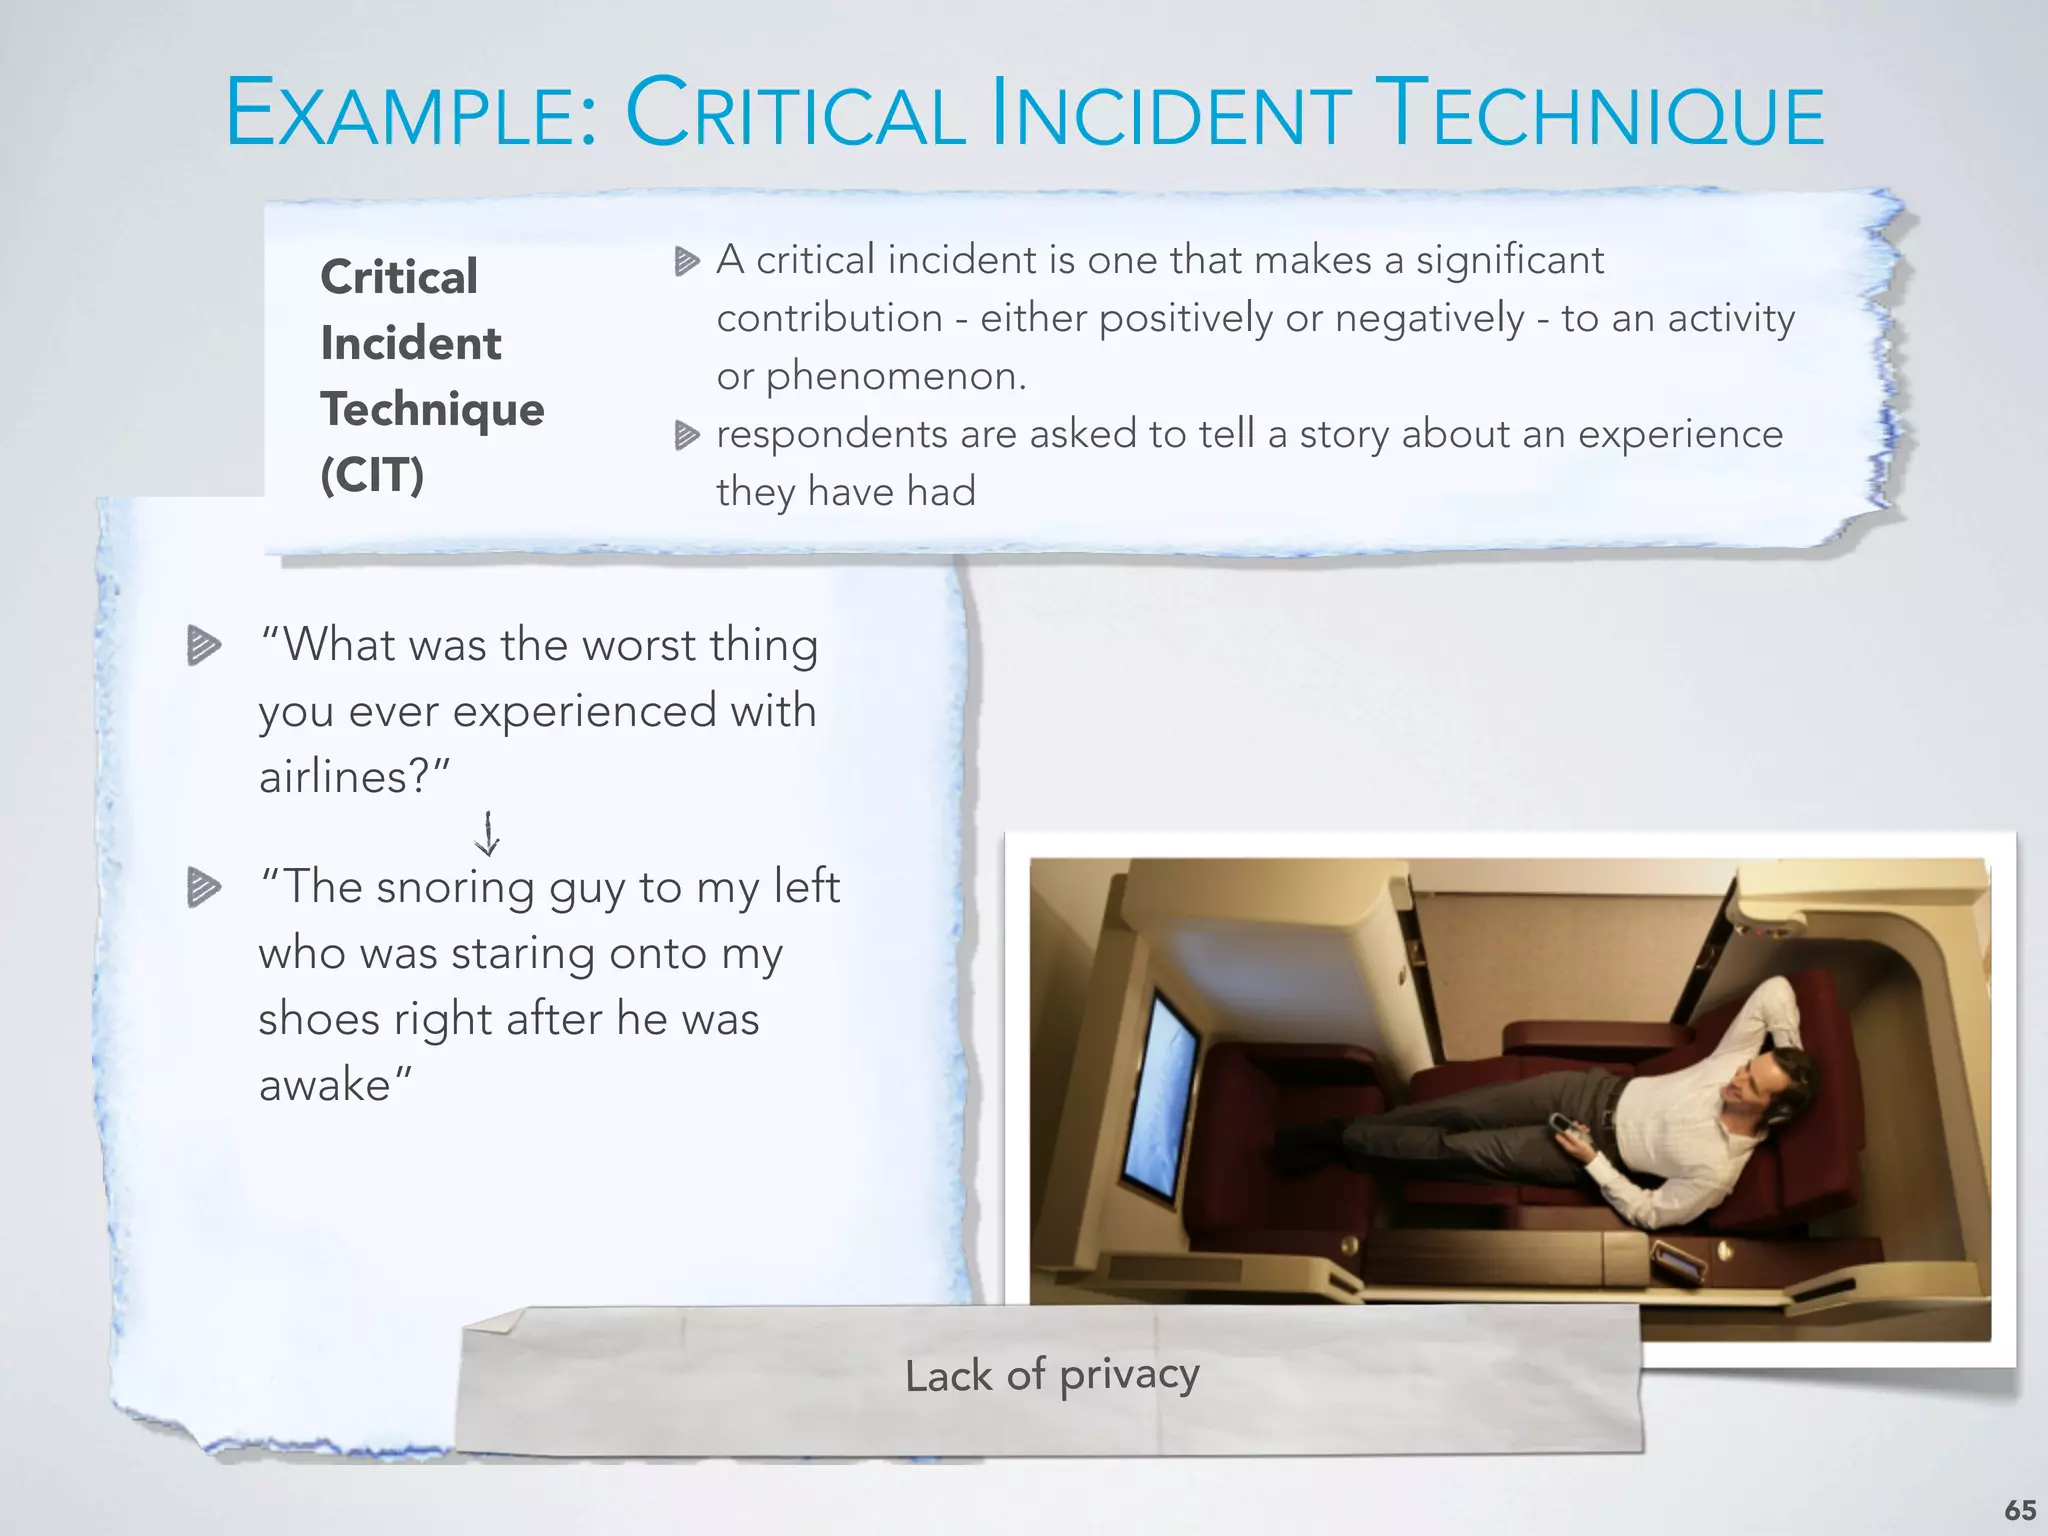
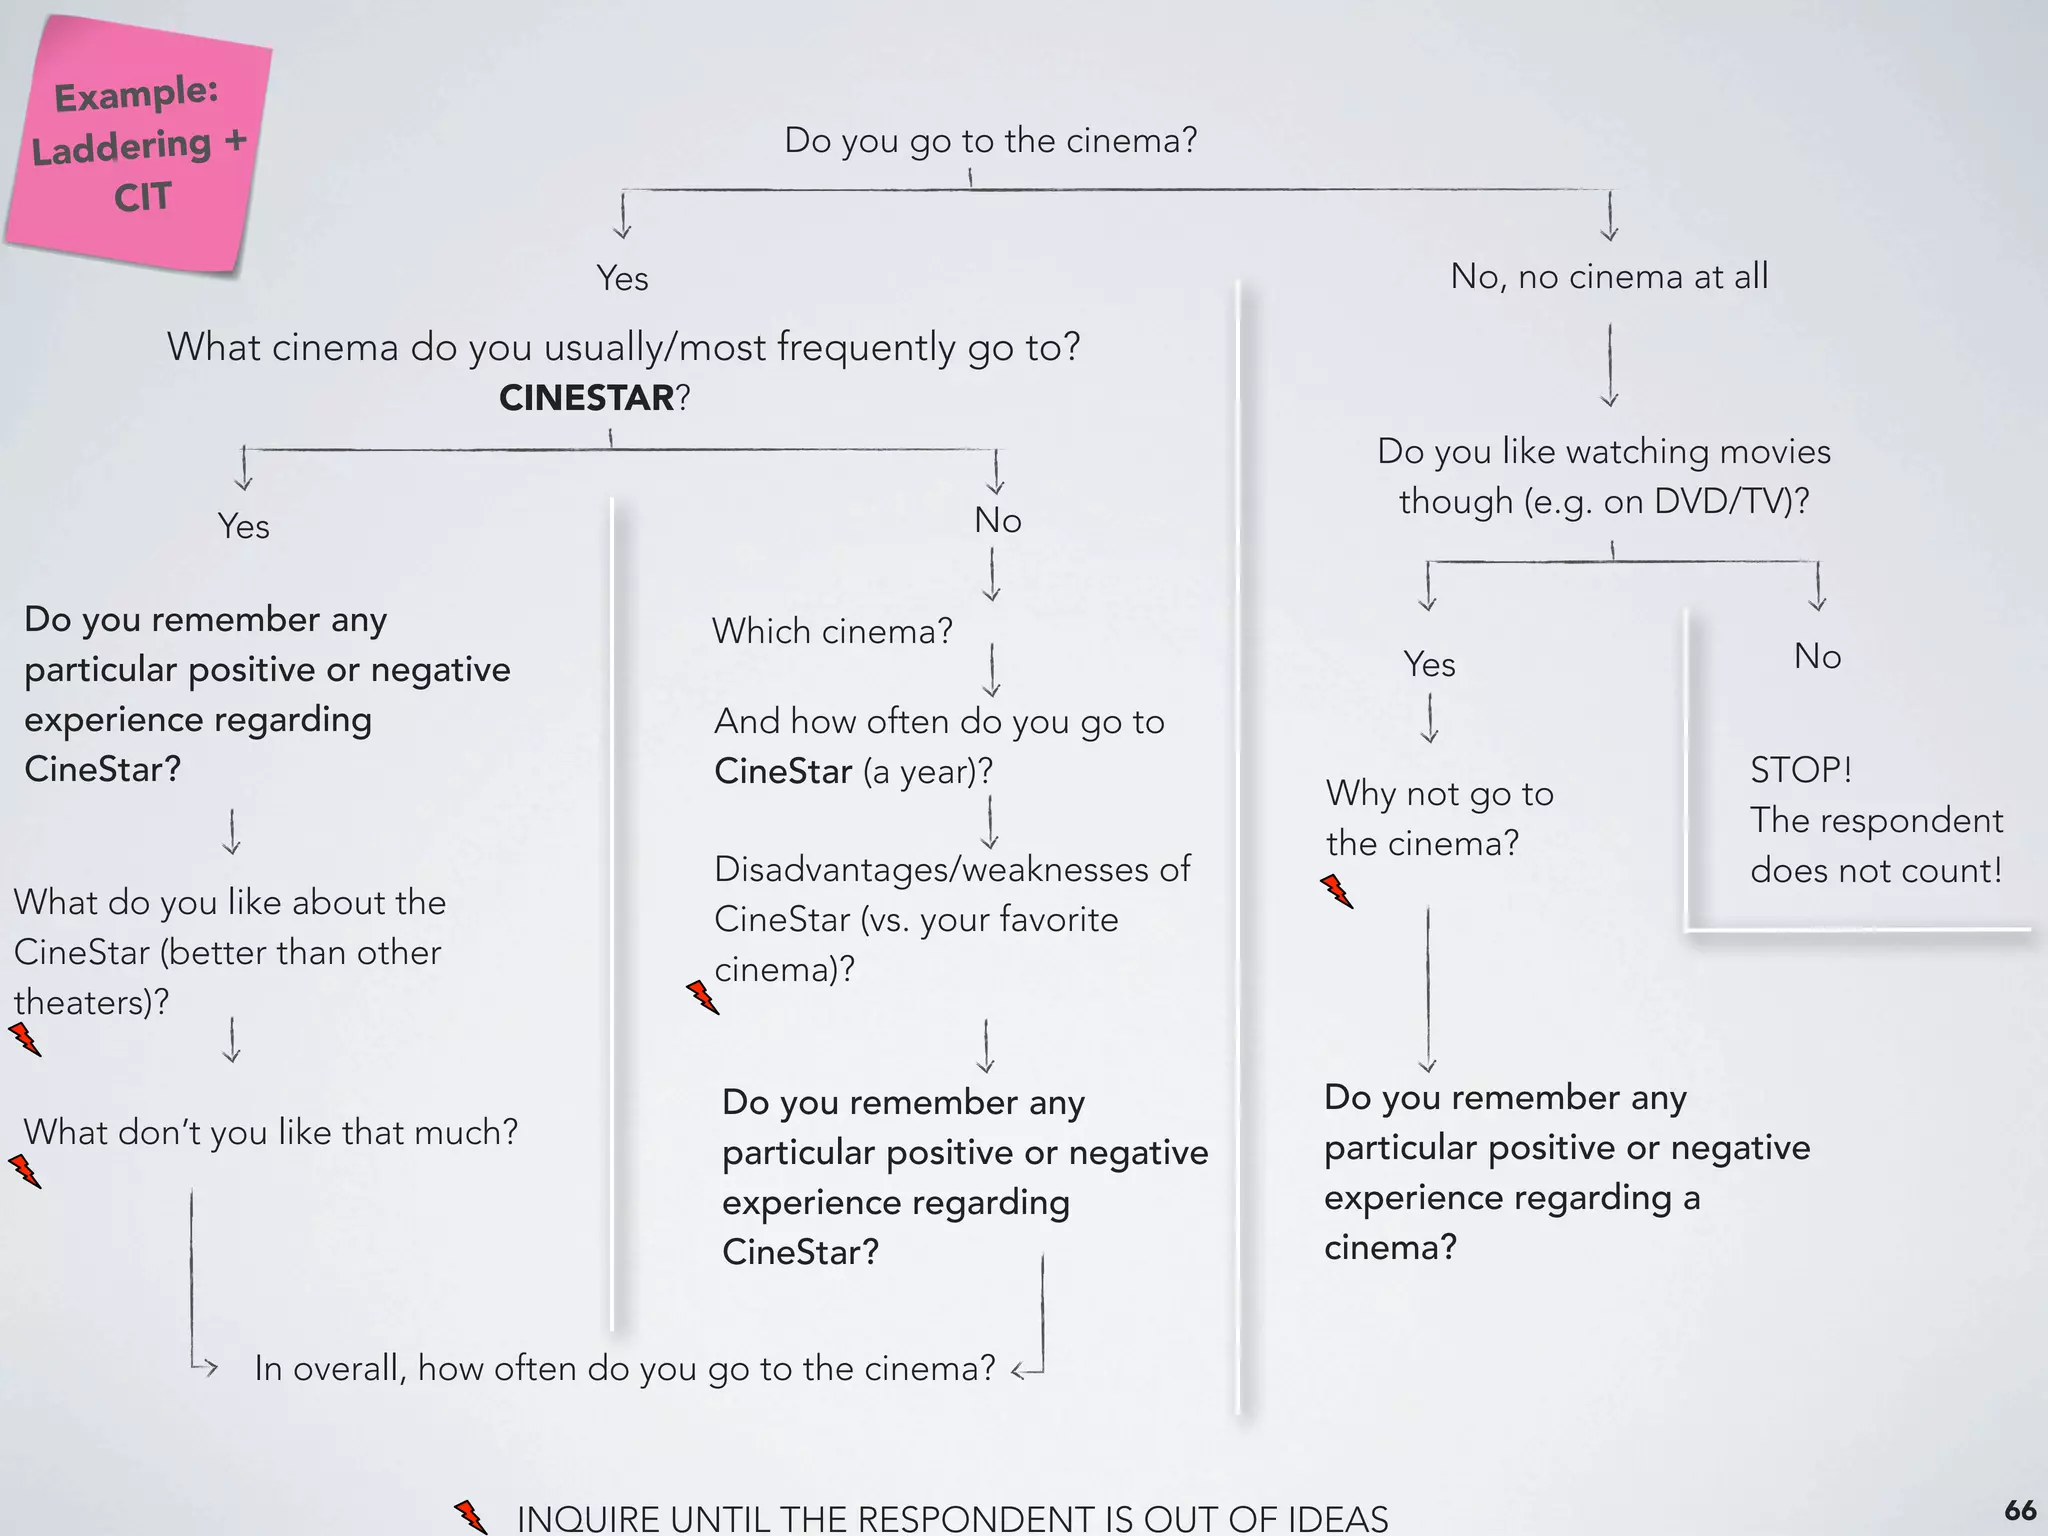
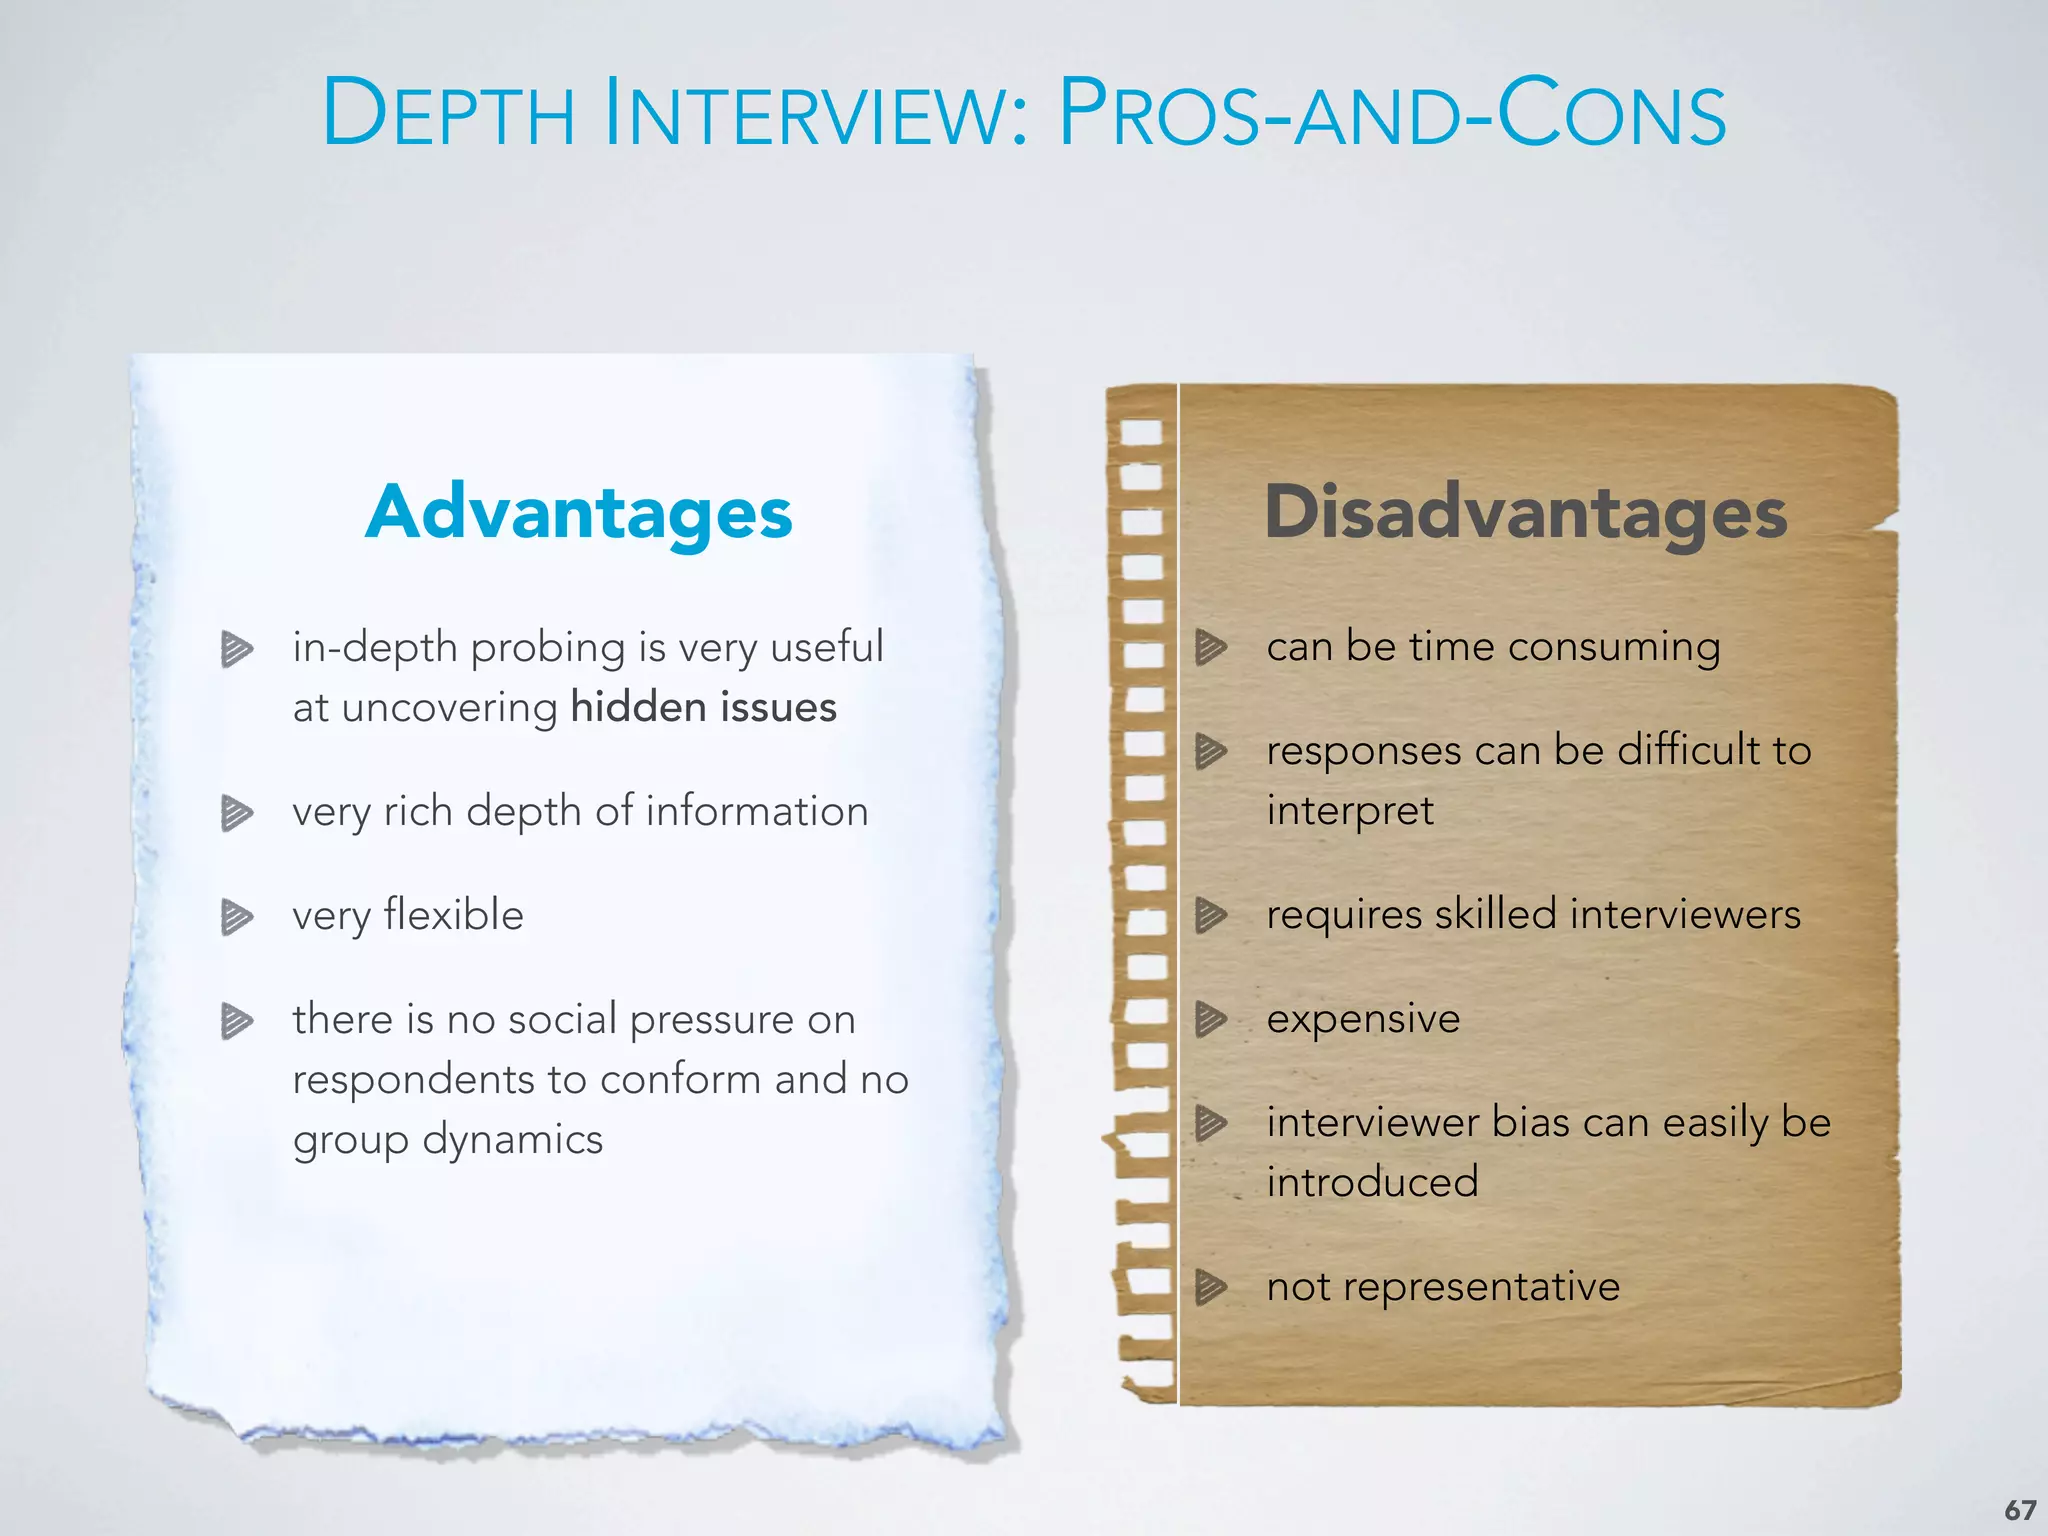
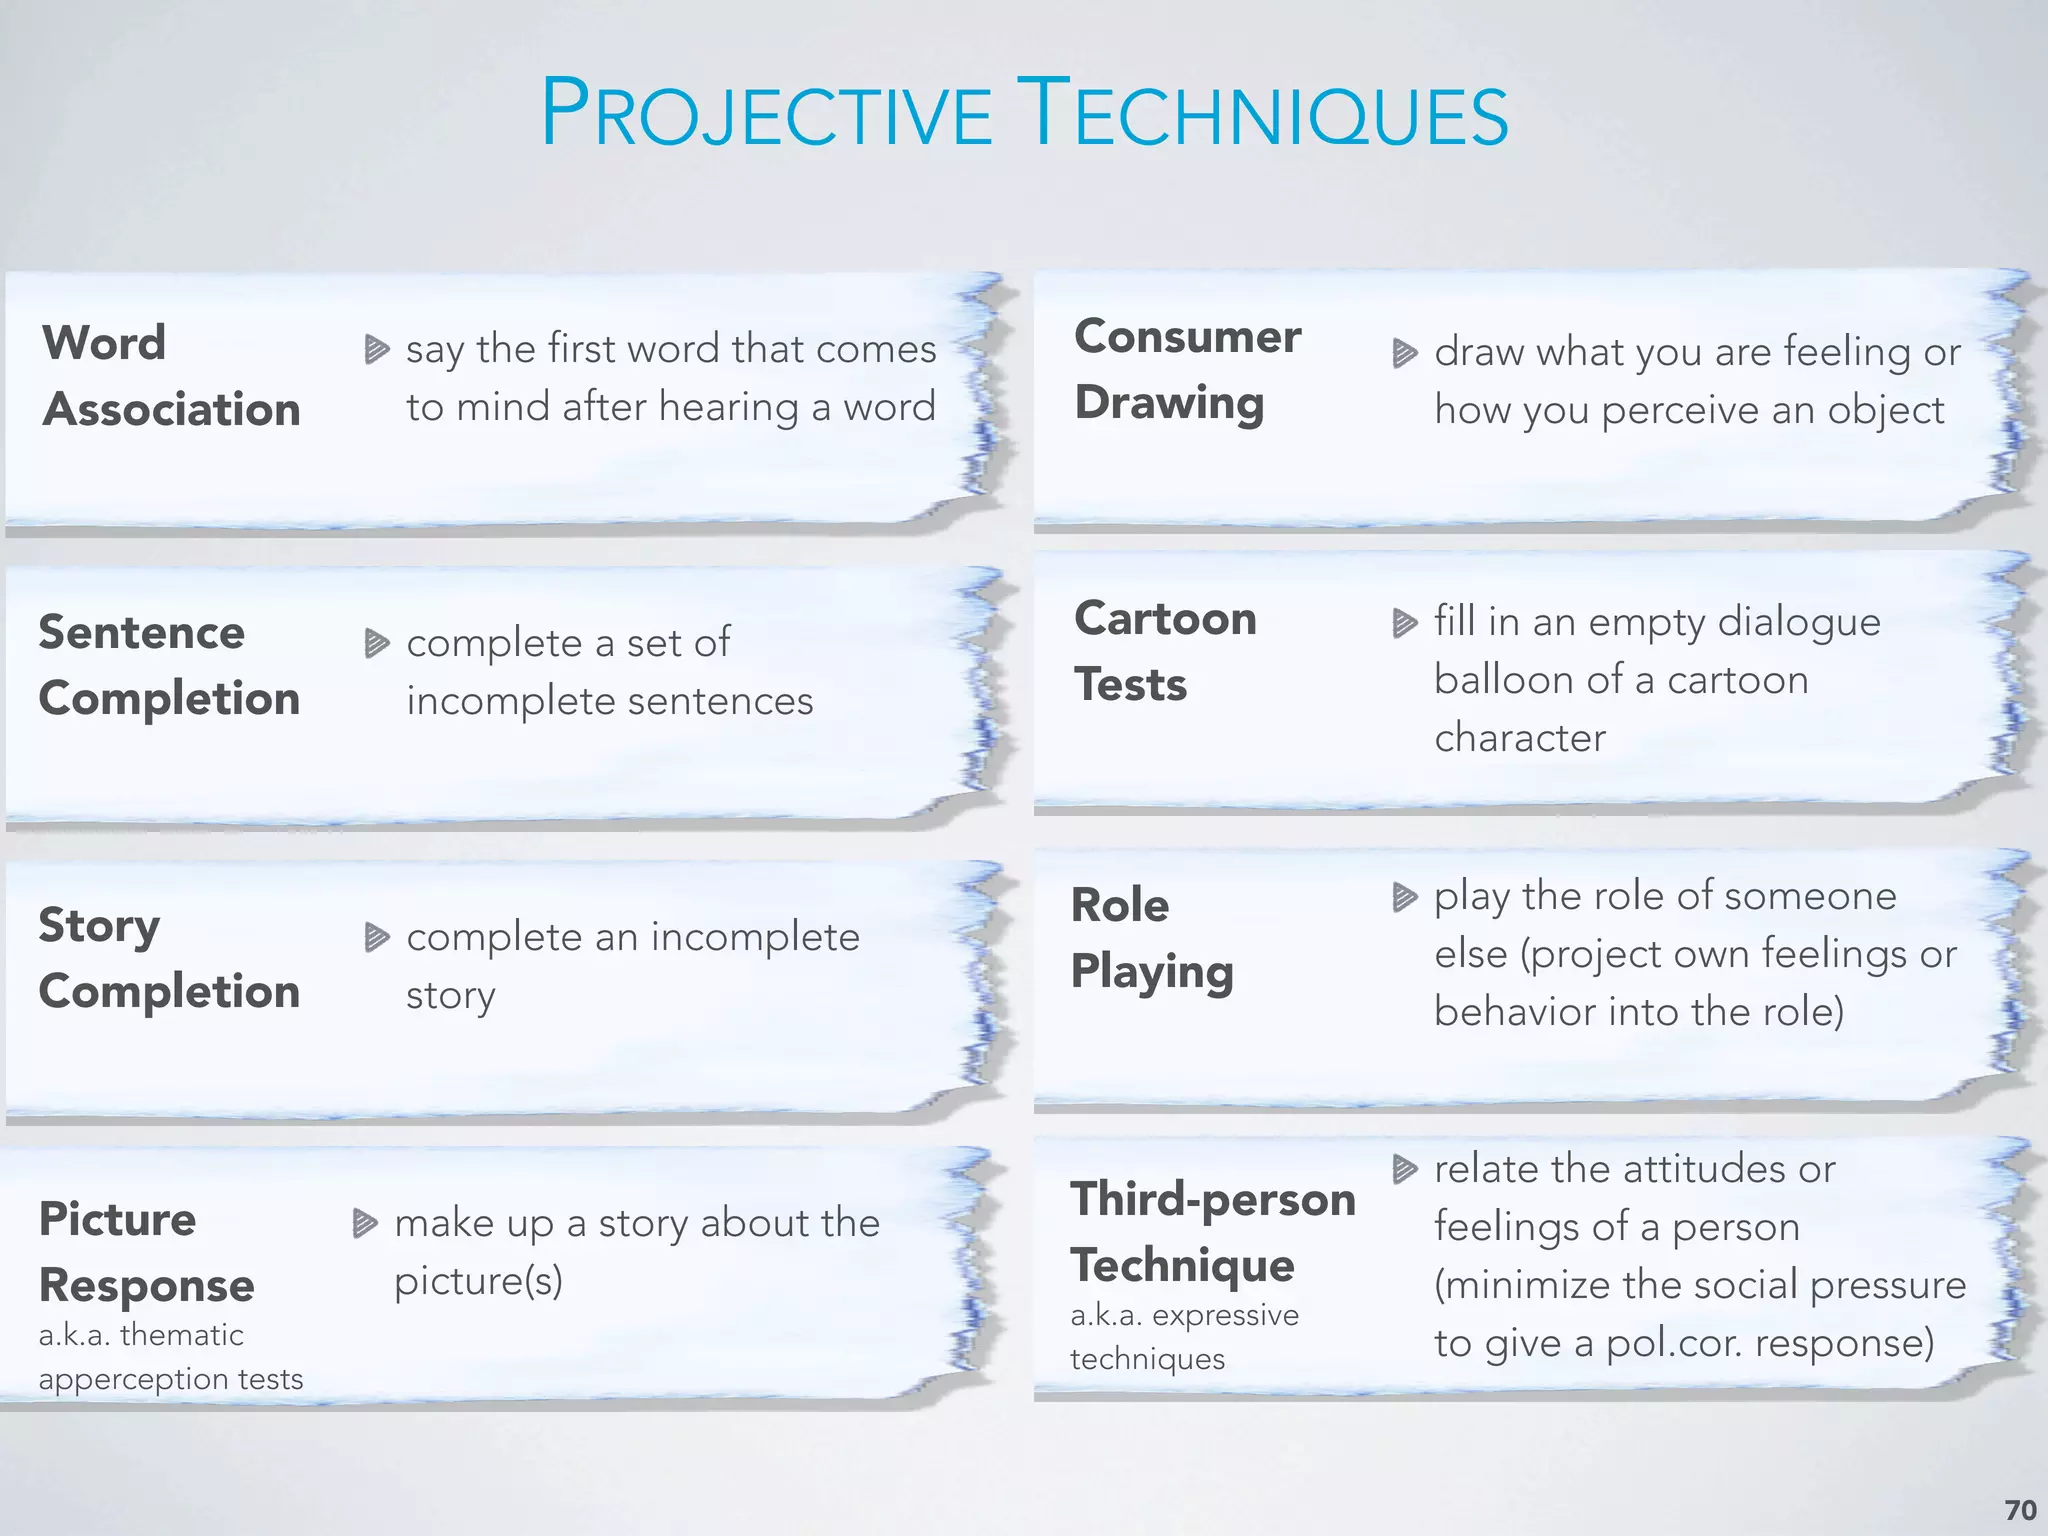
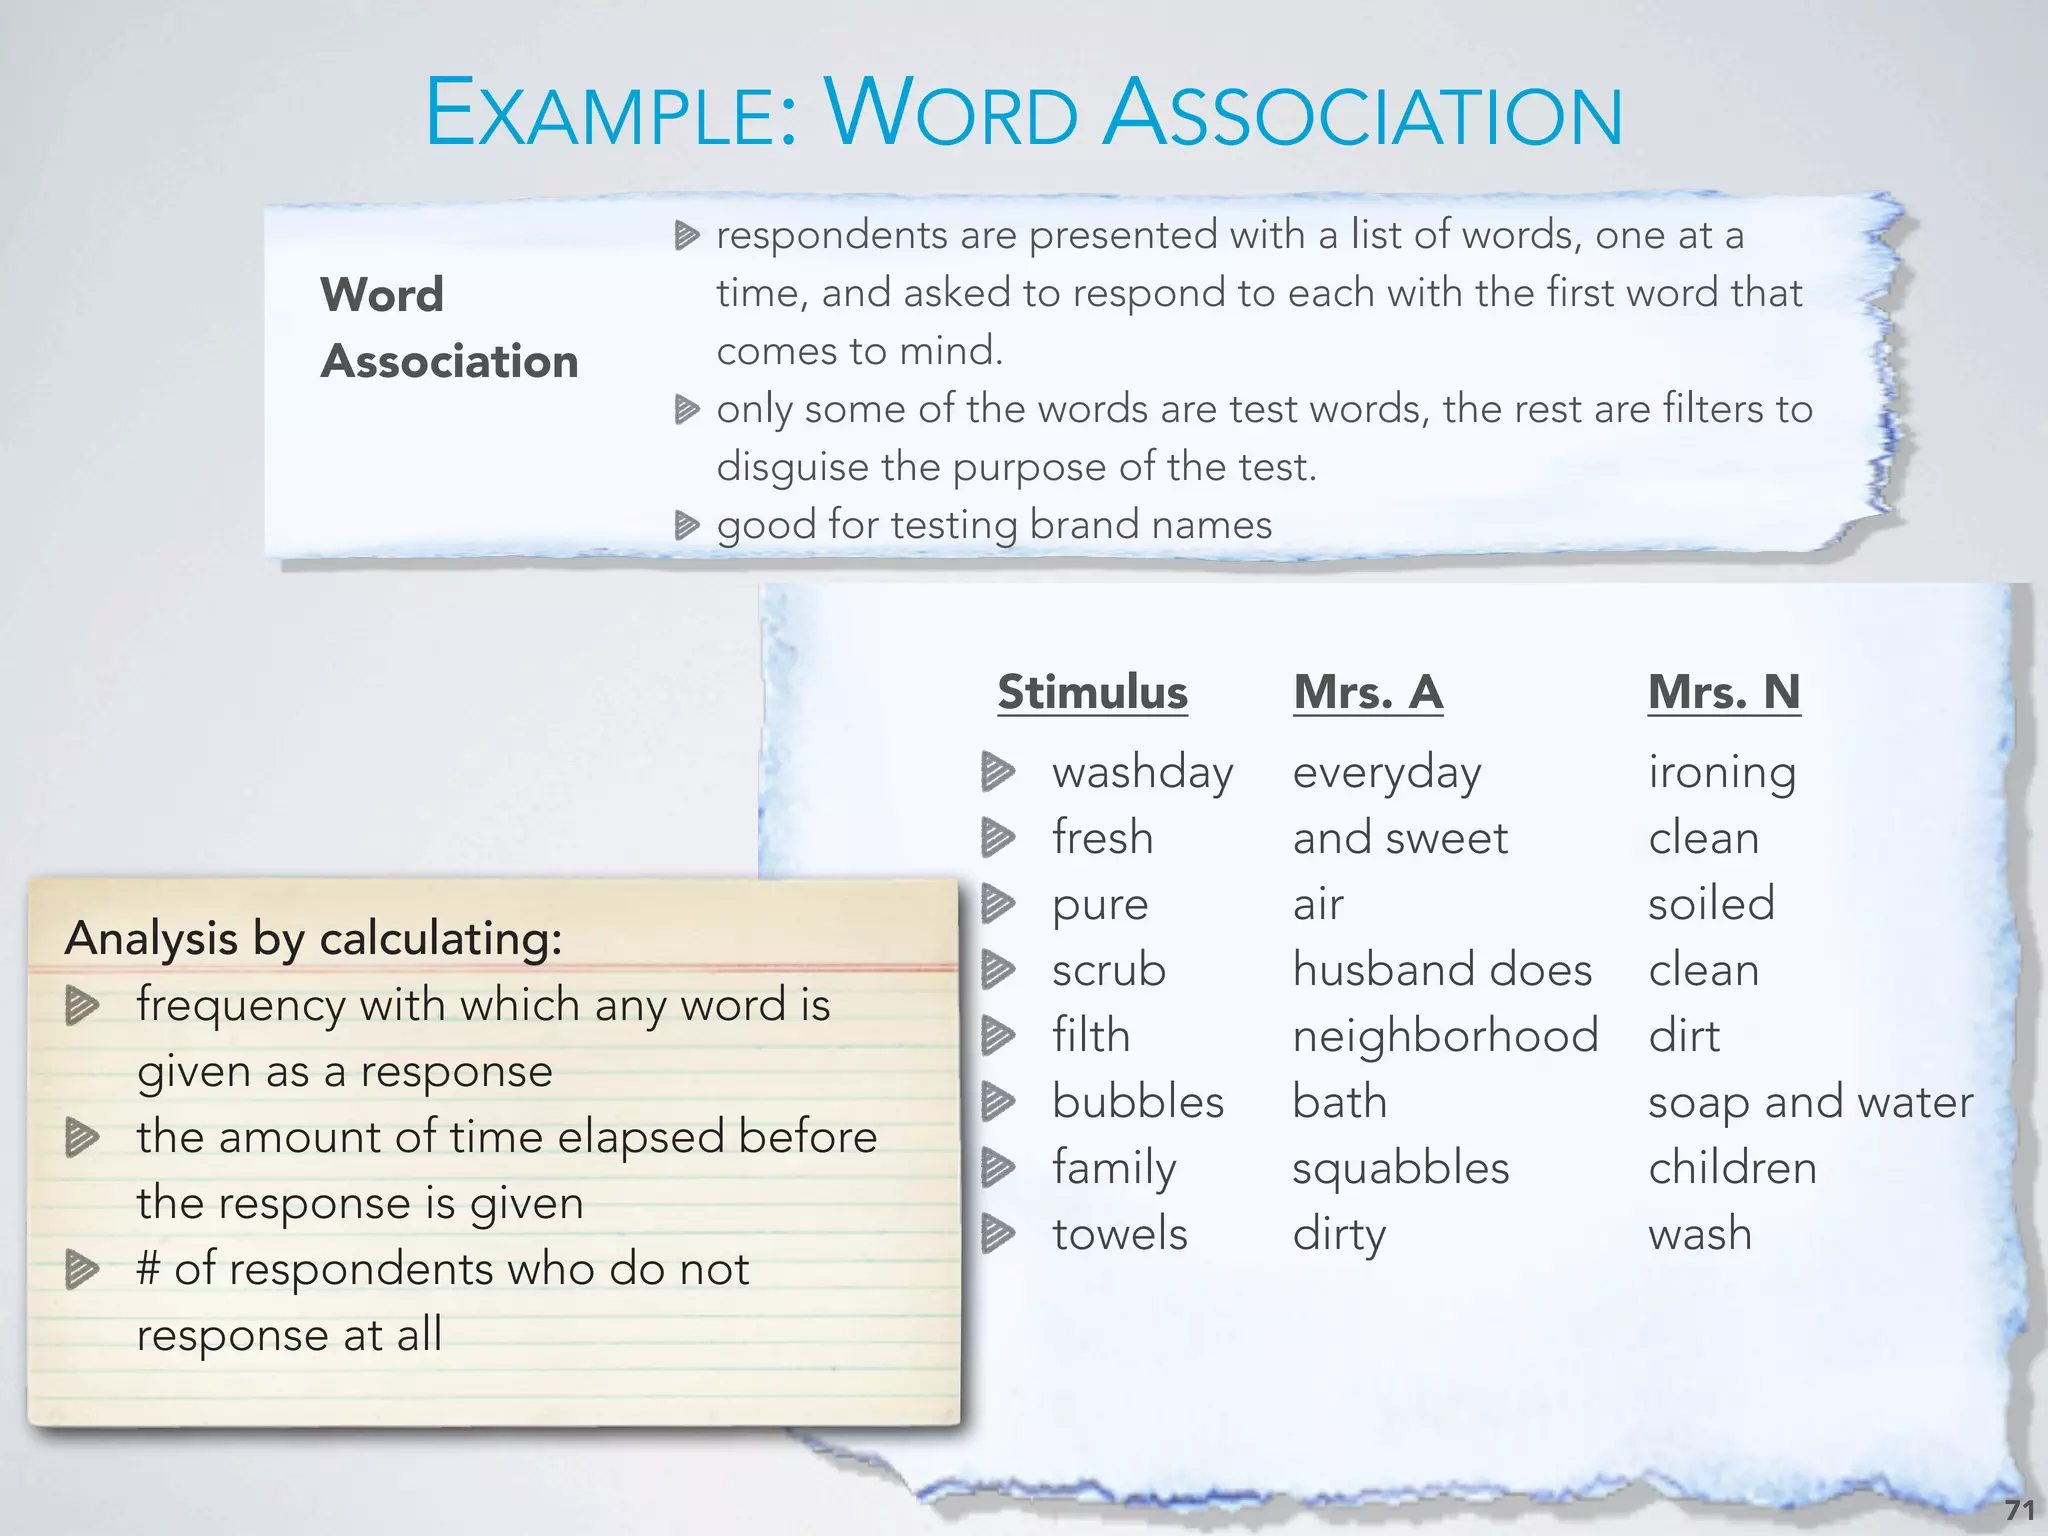
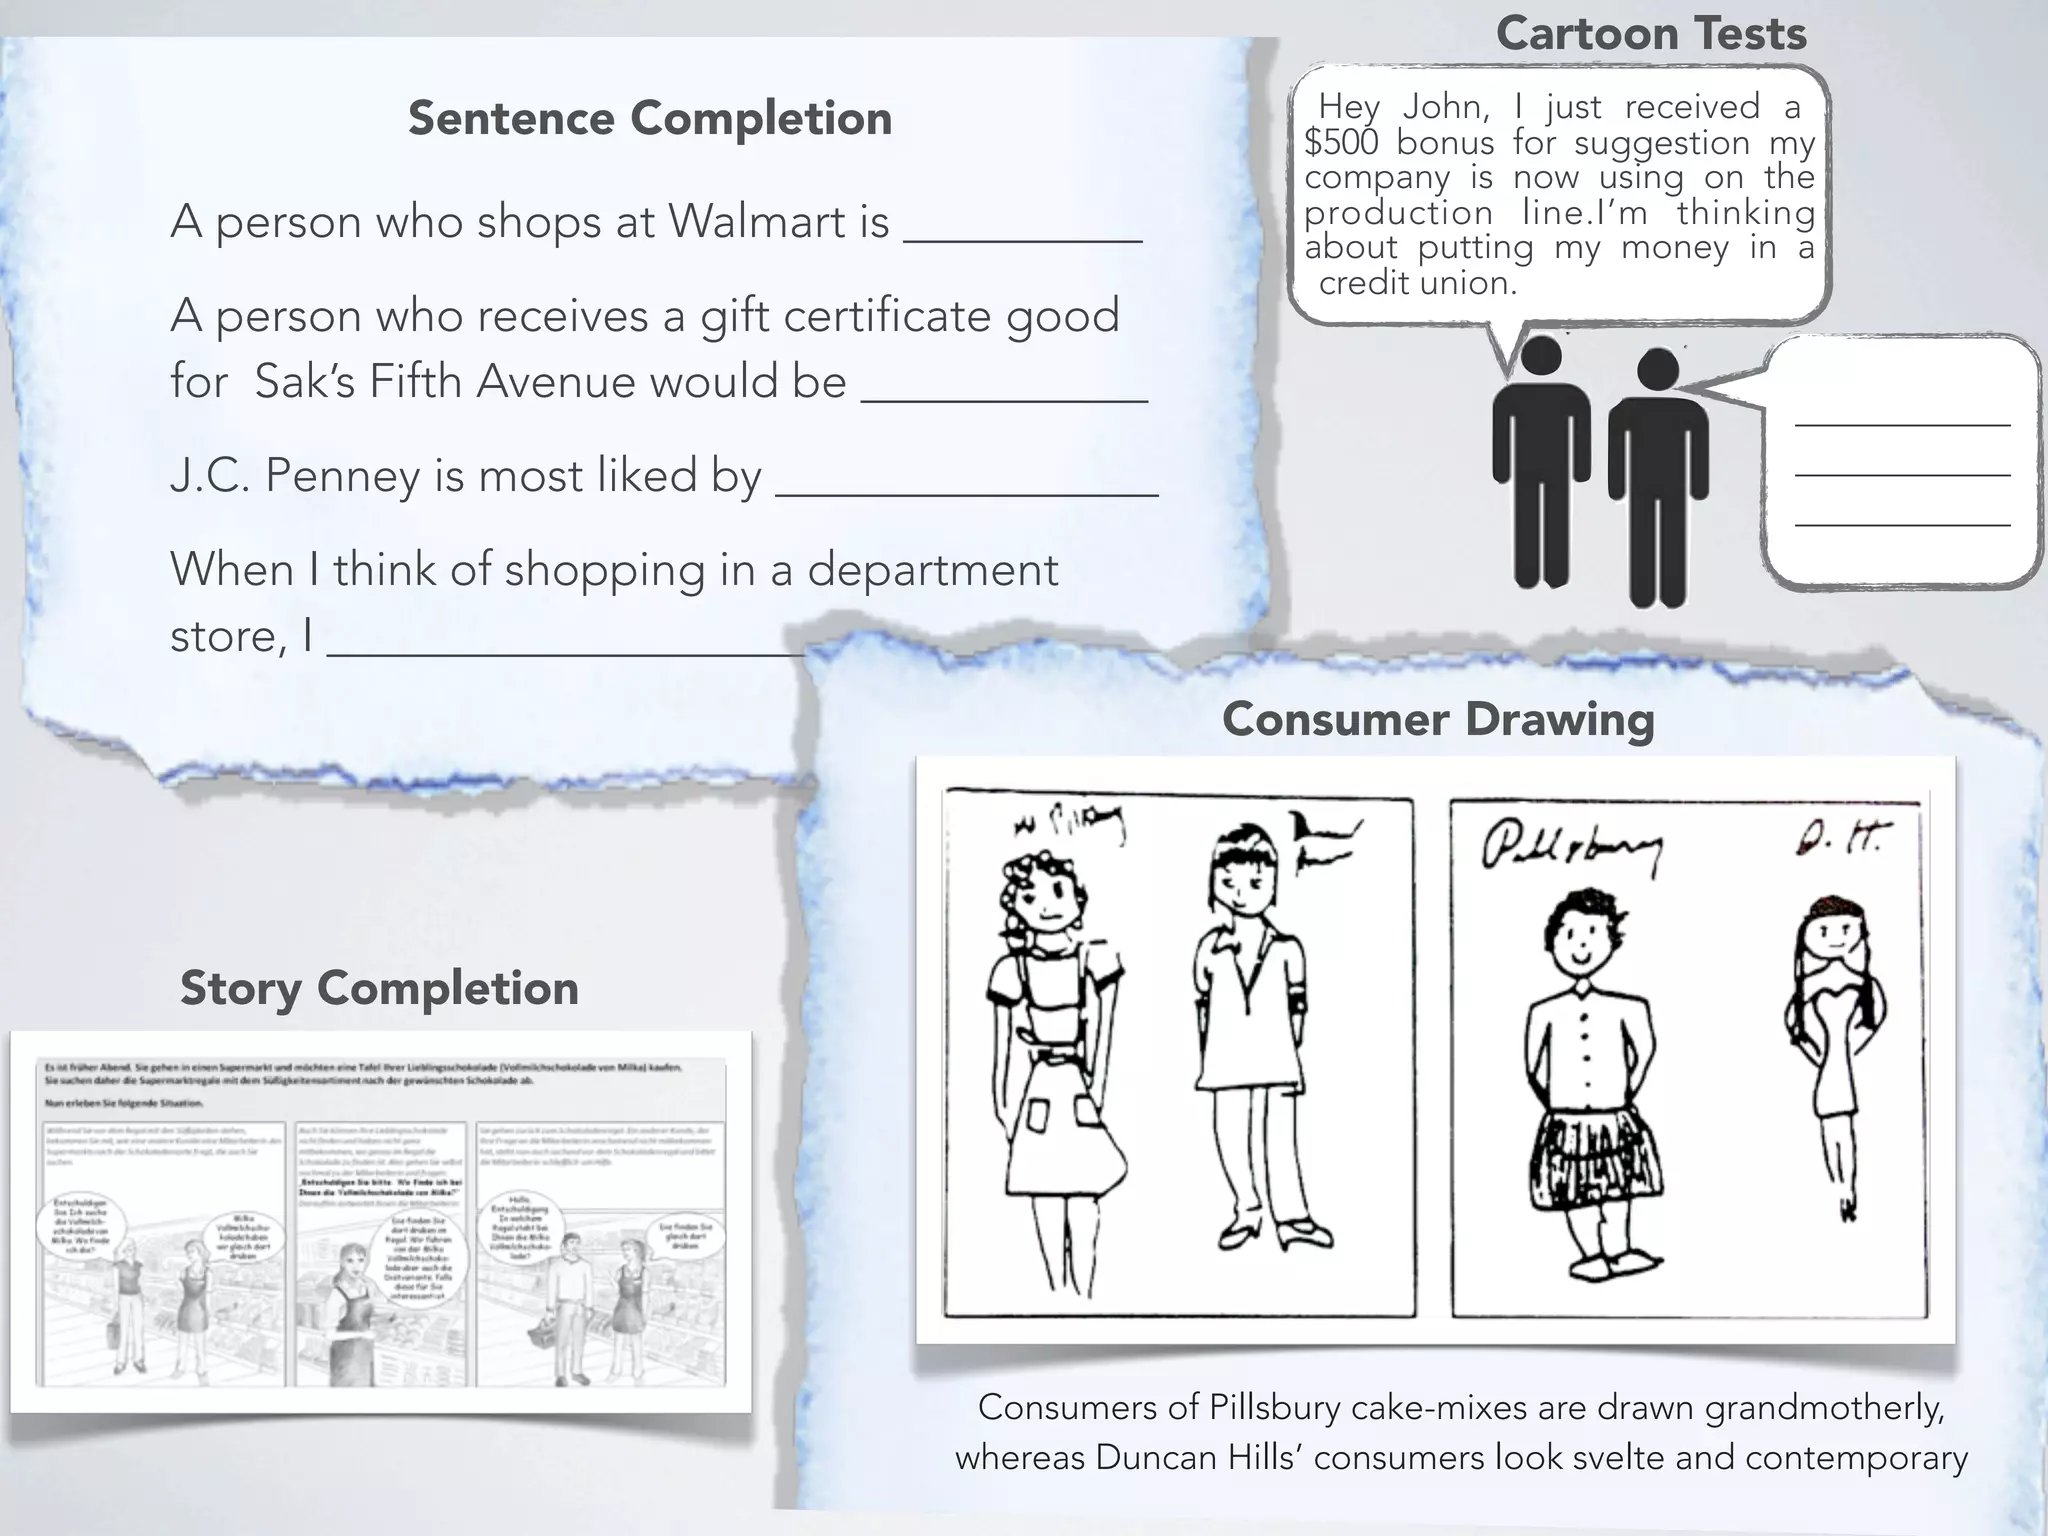
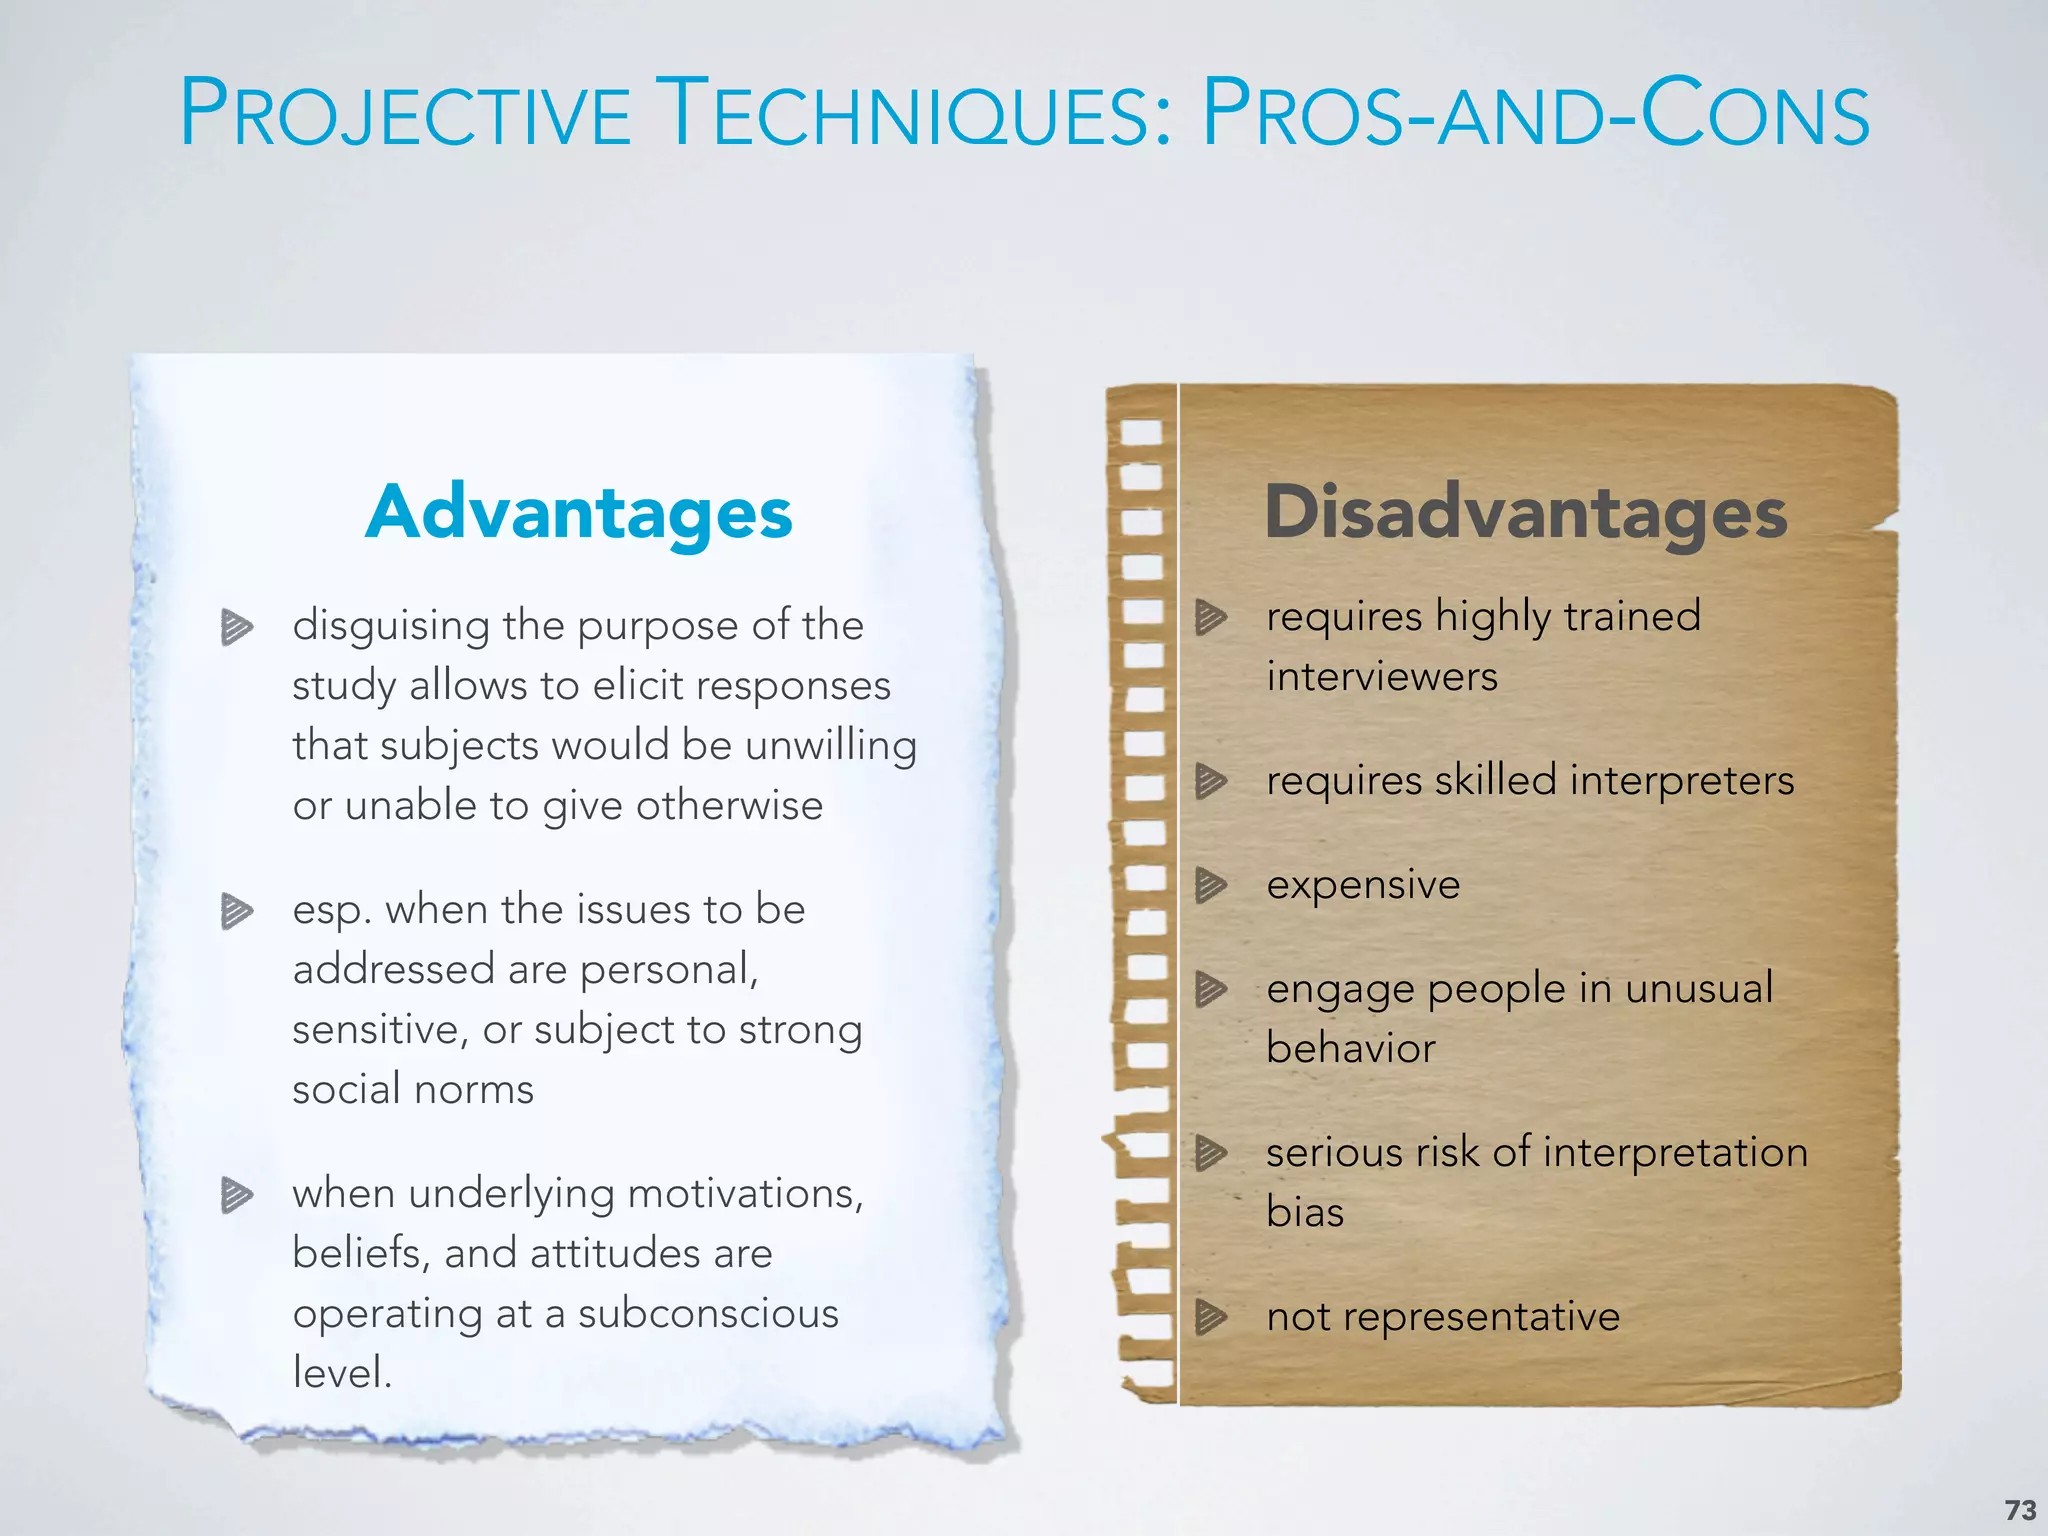
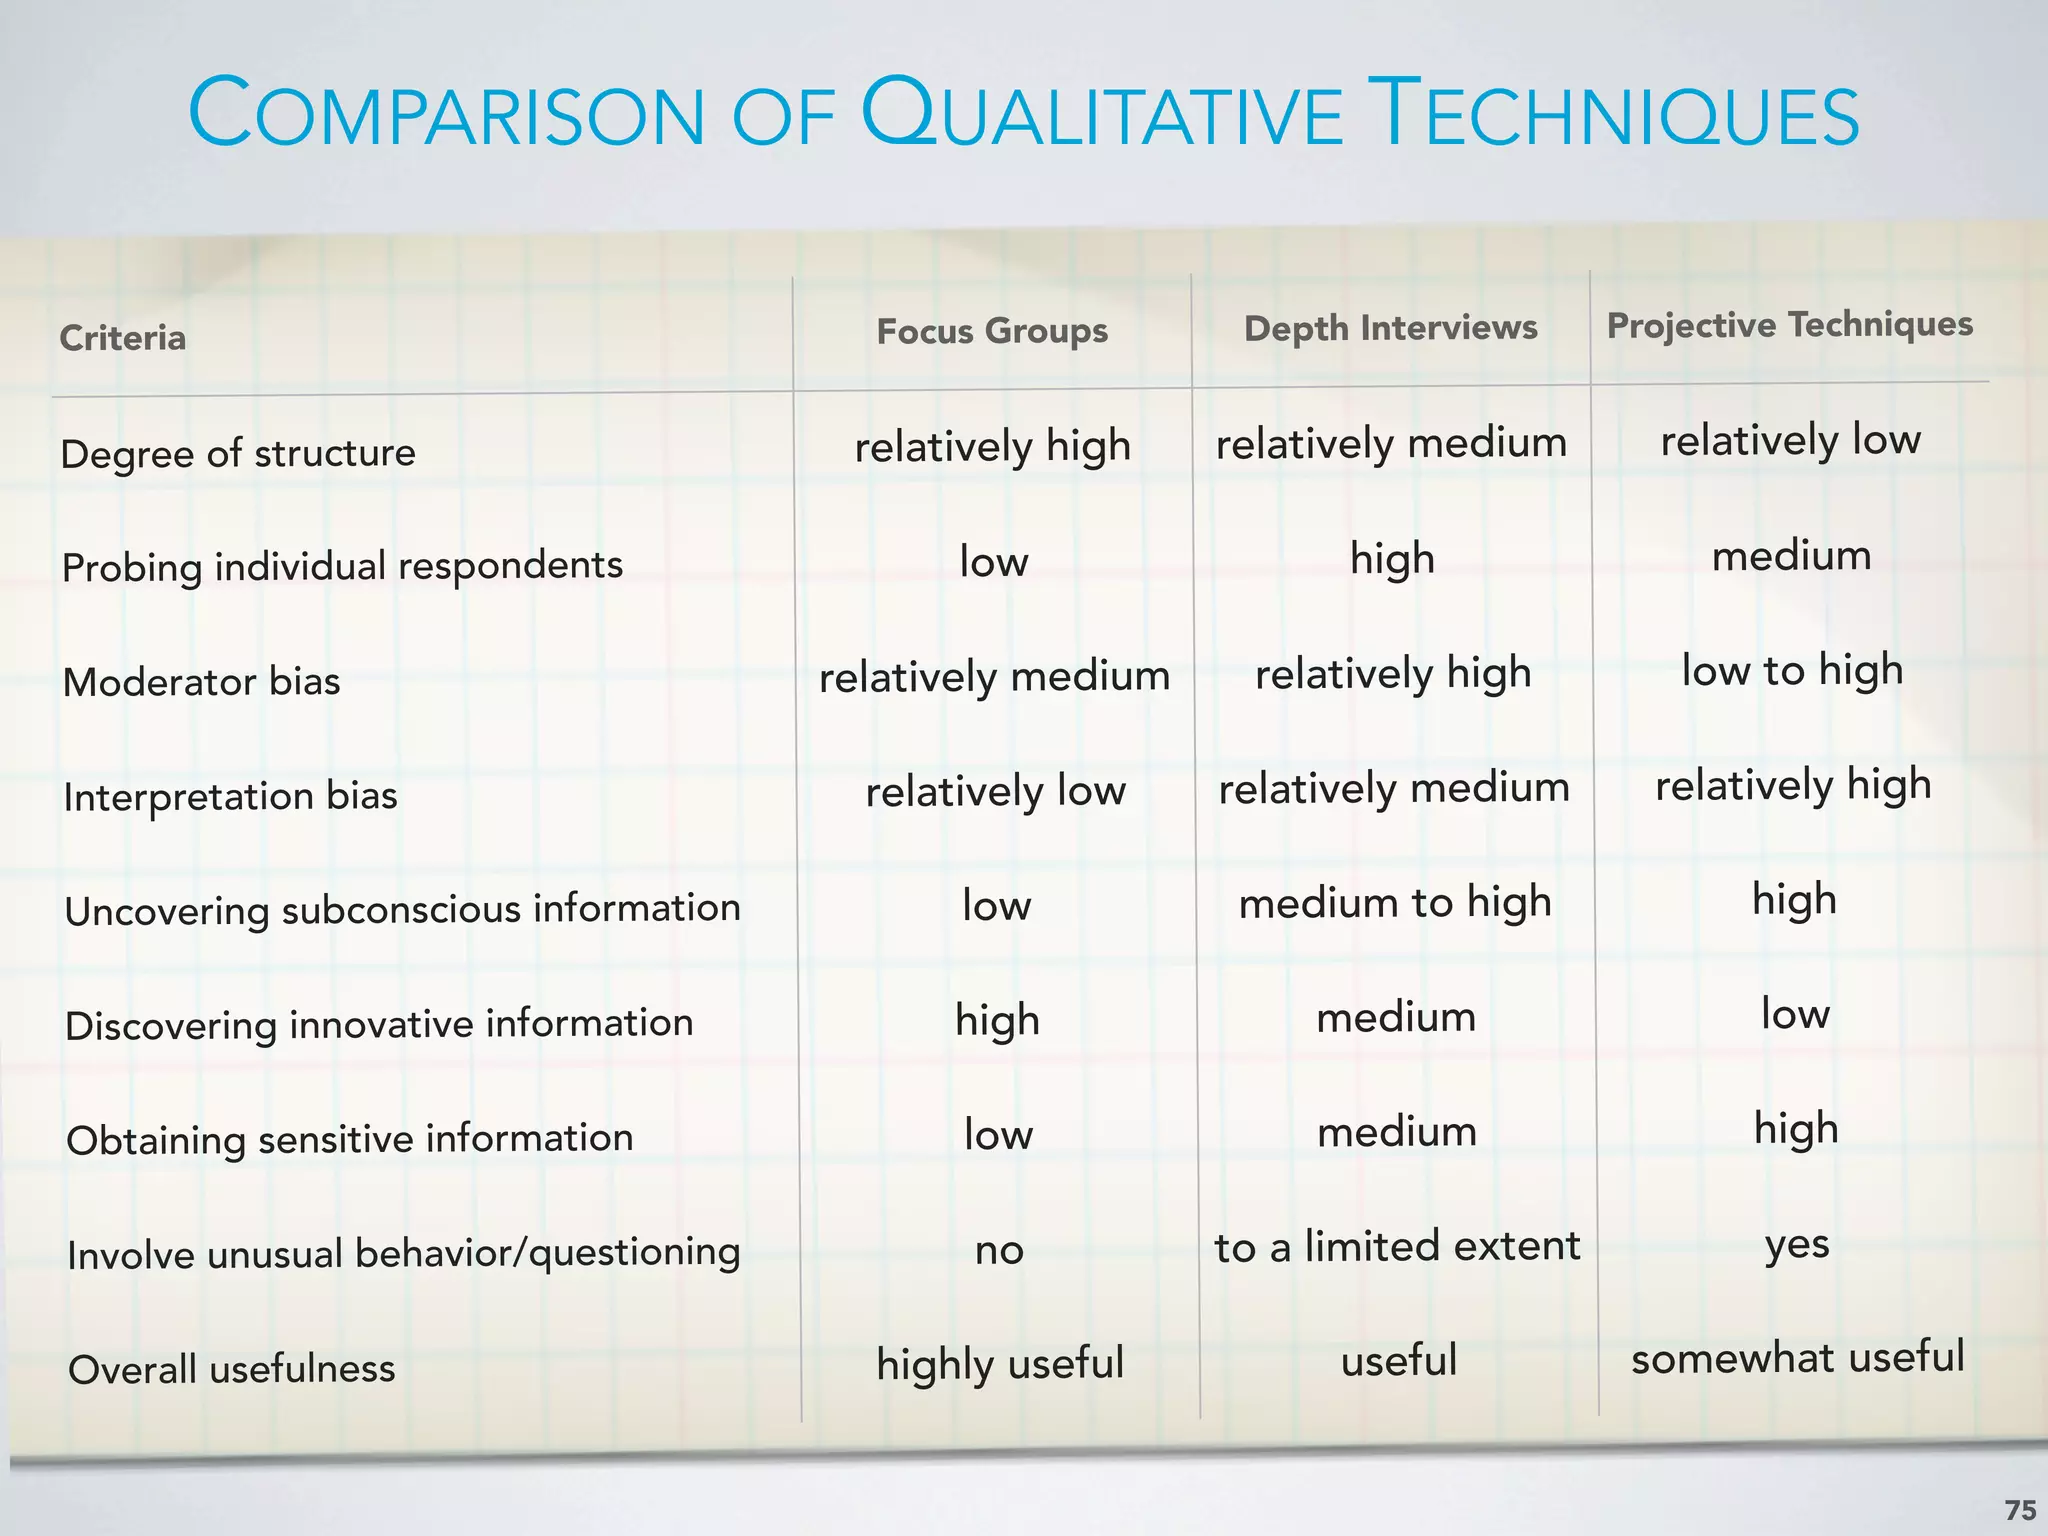
Focus groups, depth interviews, and projective techniques, including applications and advantages.
Depth interviews as a method for in-depth probing and understanding consumer behavior and attitudes.
Methods like word association and thematic apperception are used to understand deeper consumer motivations.
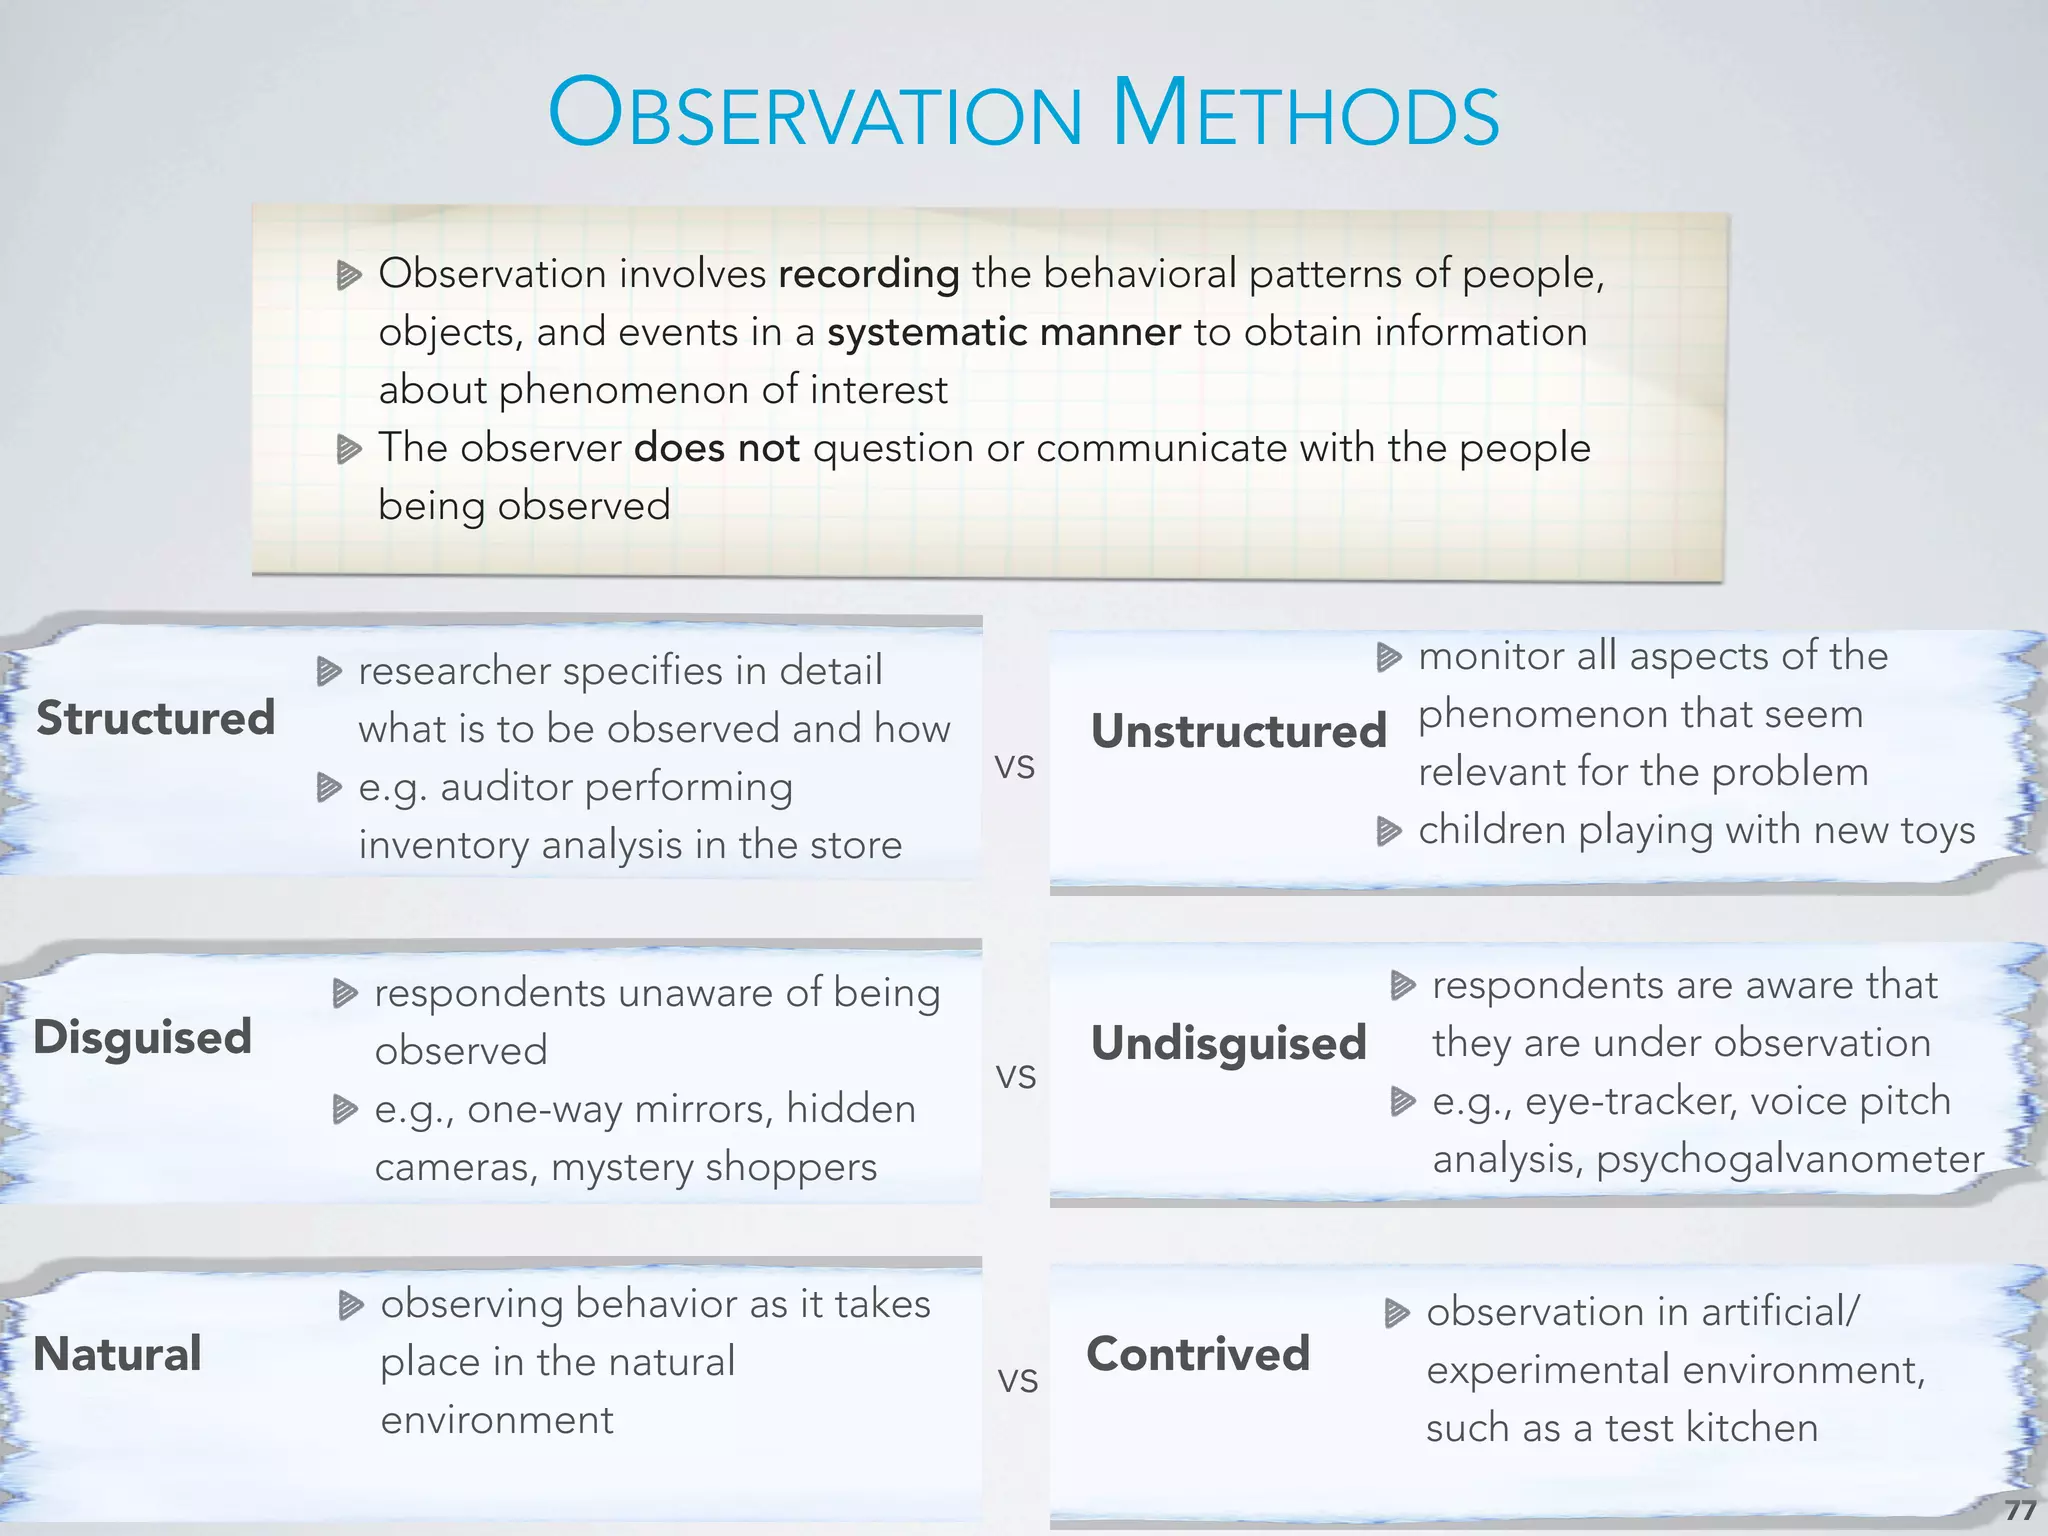
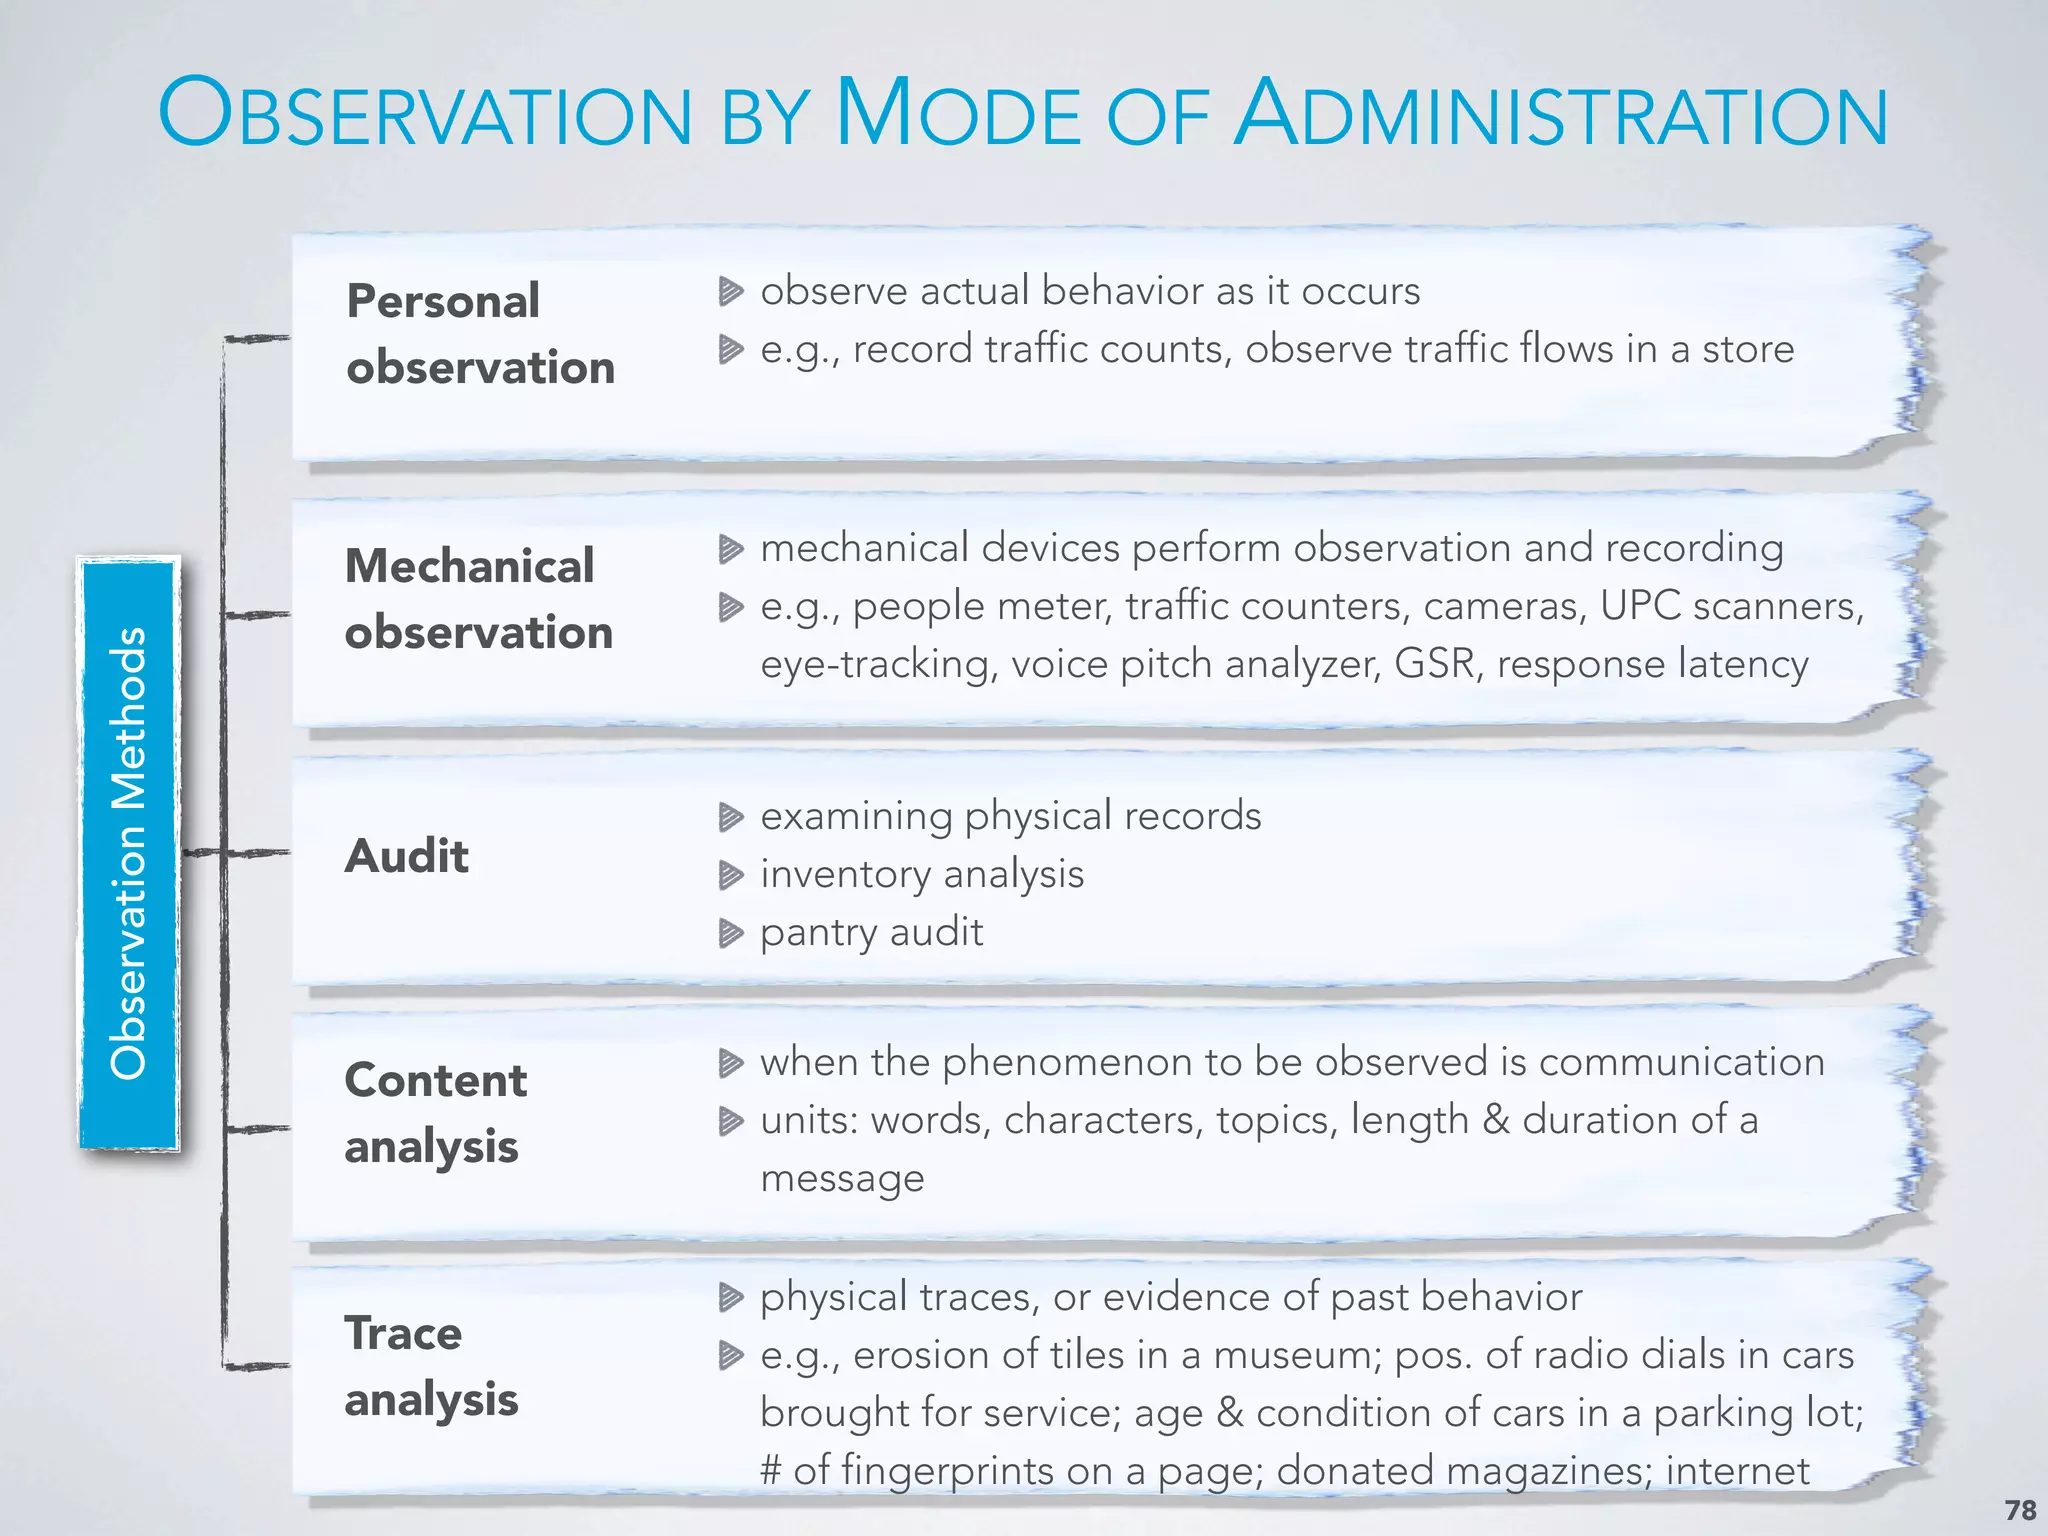
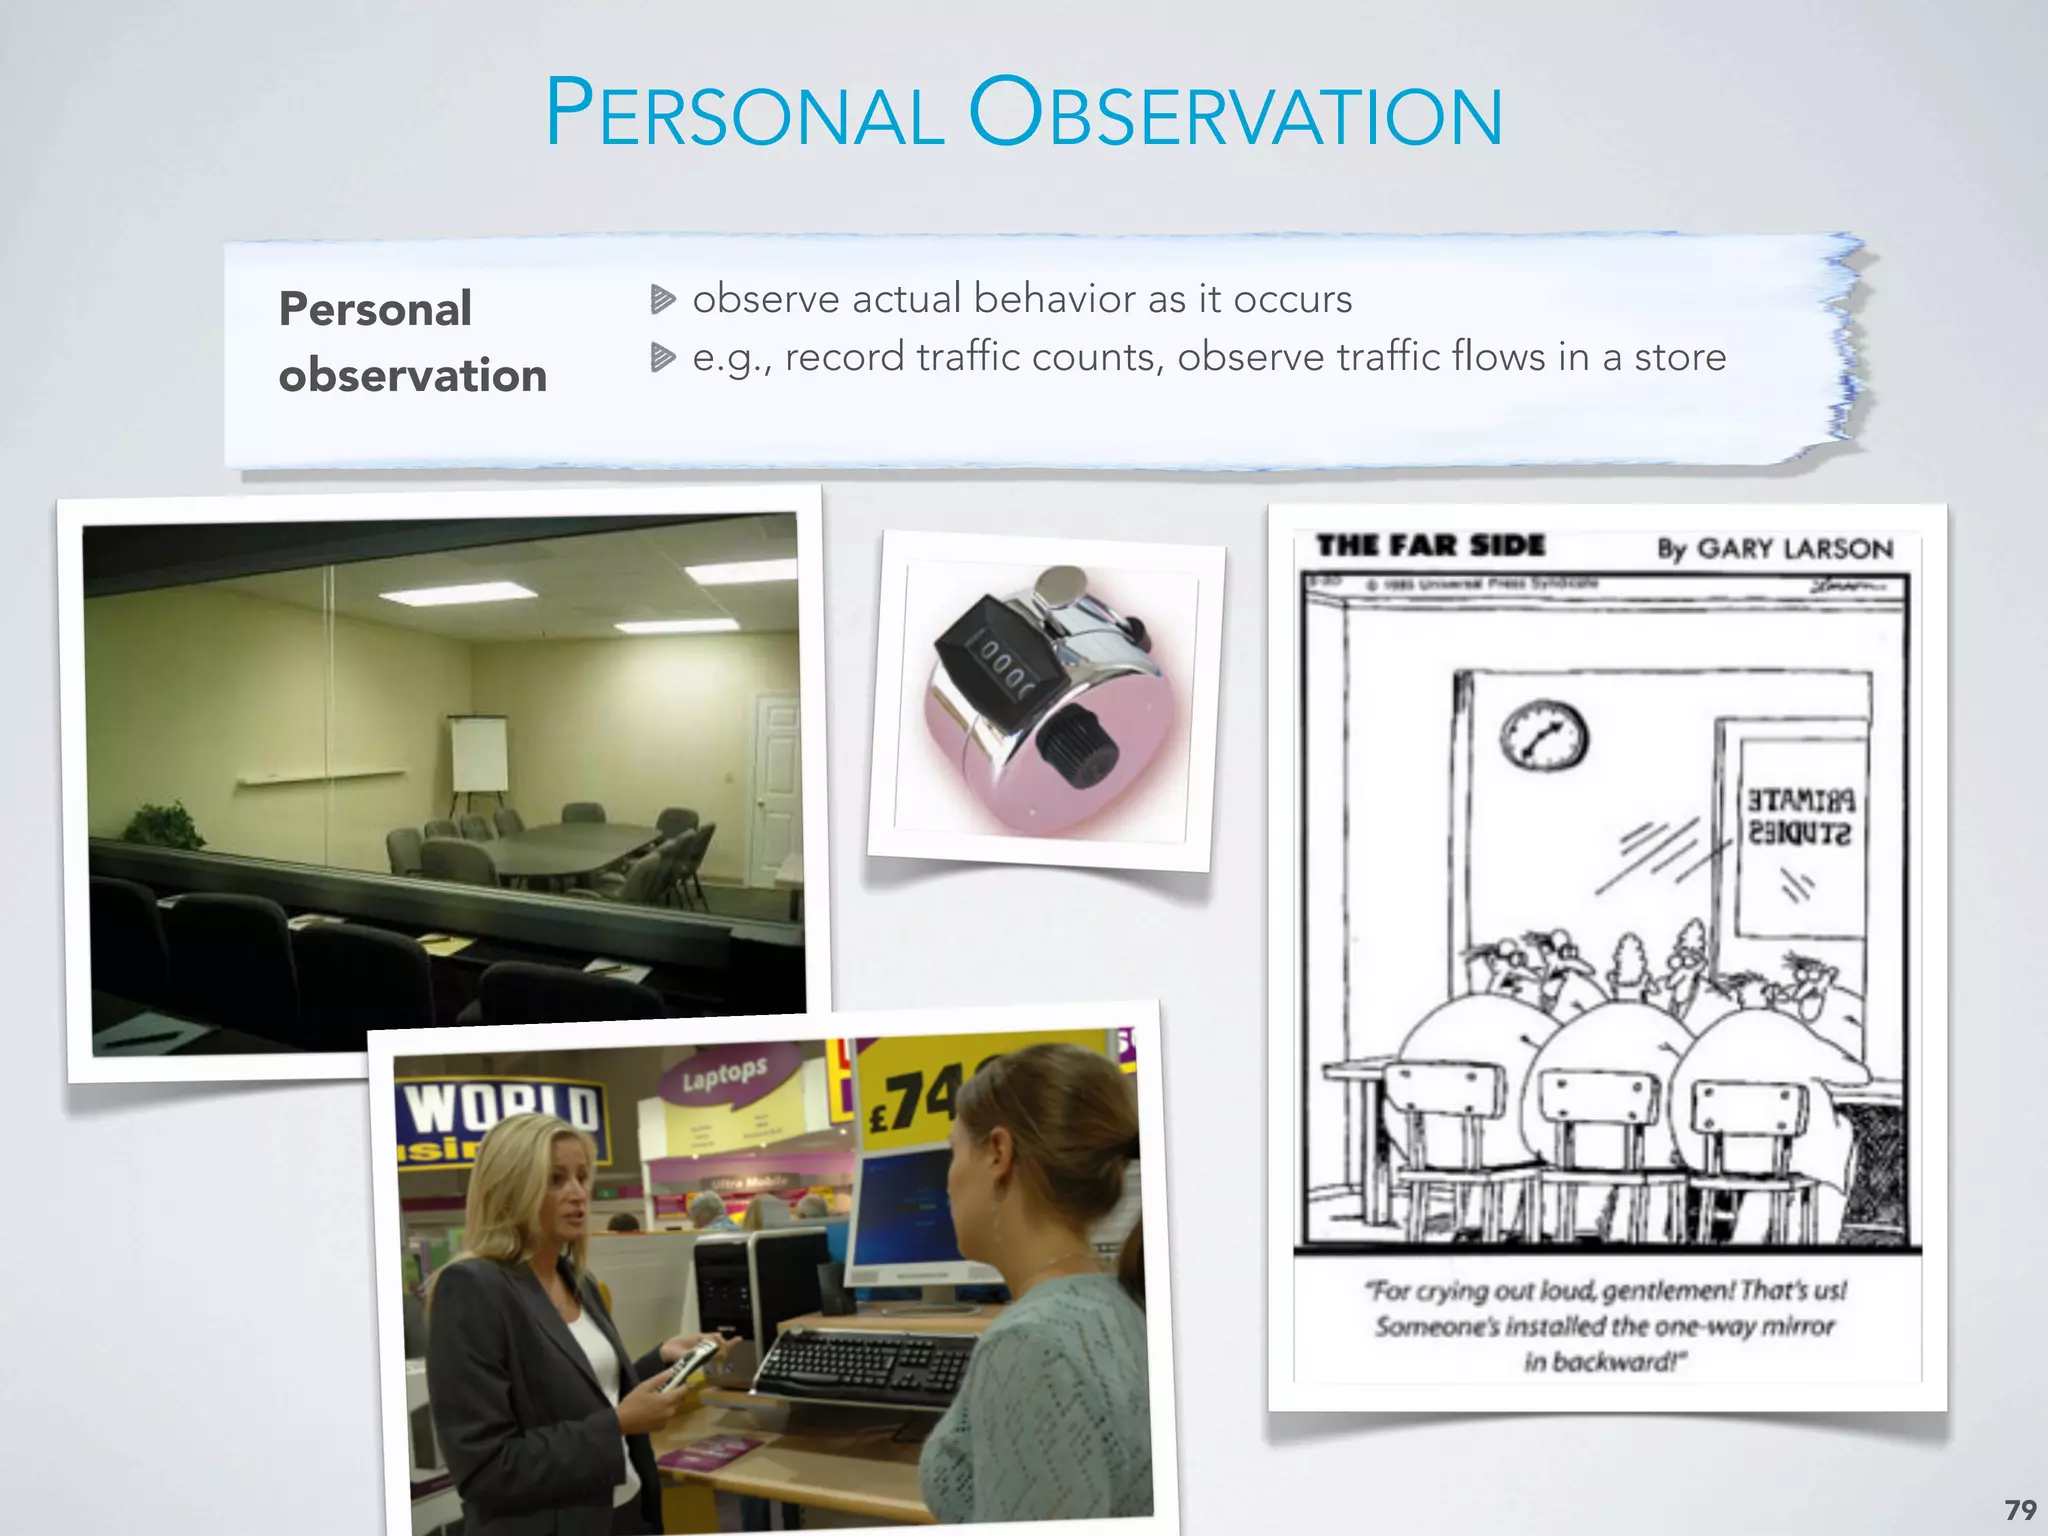
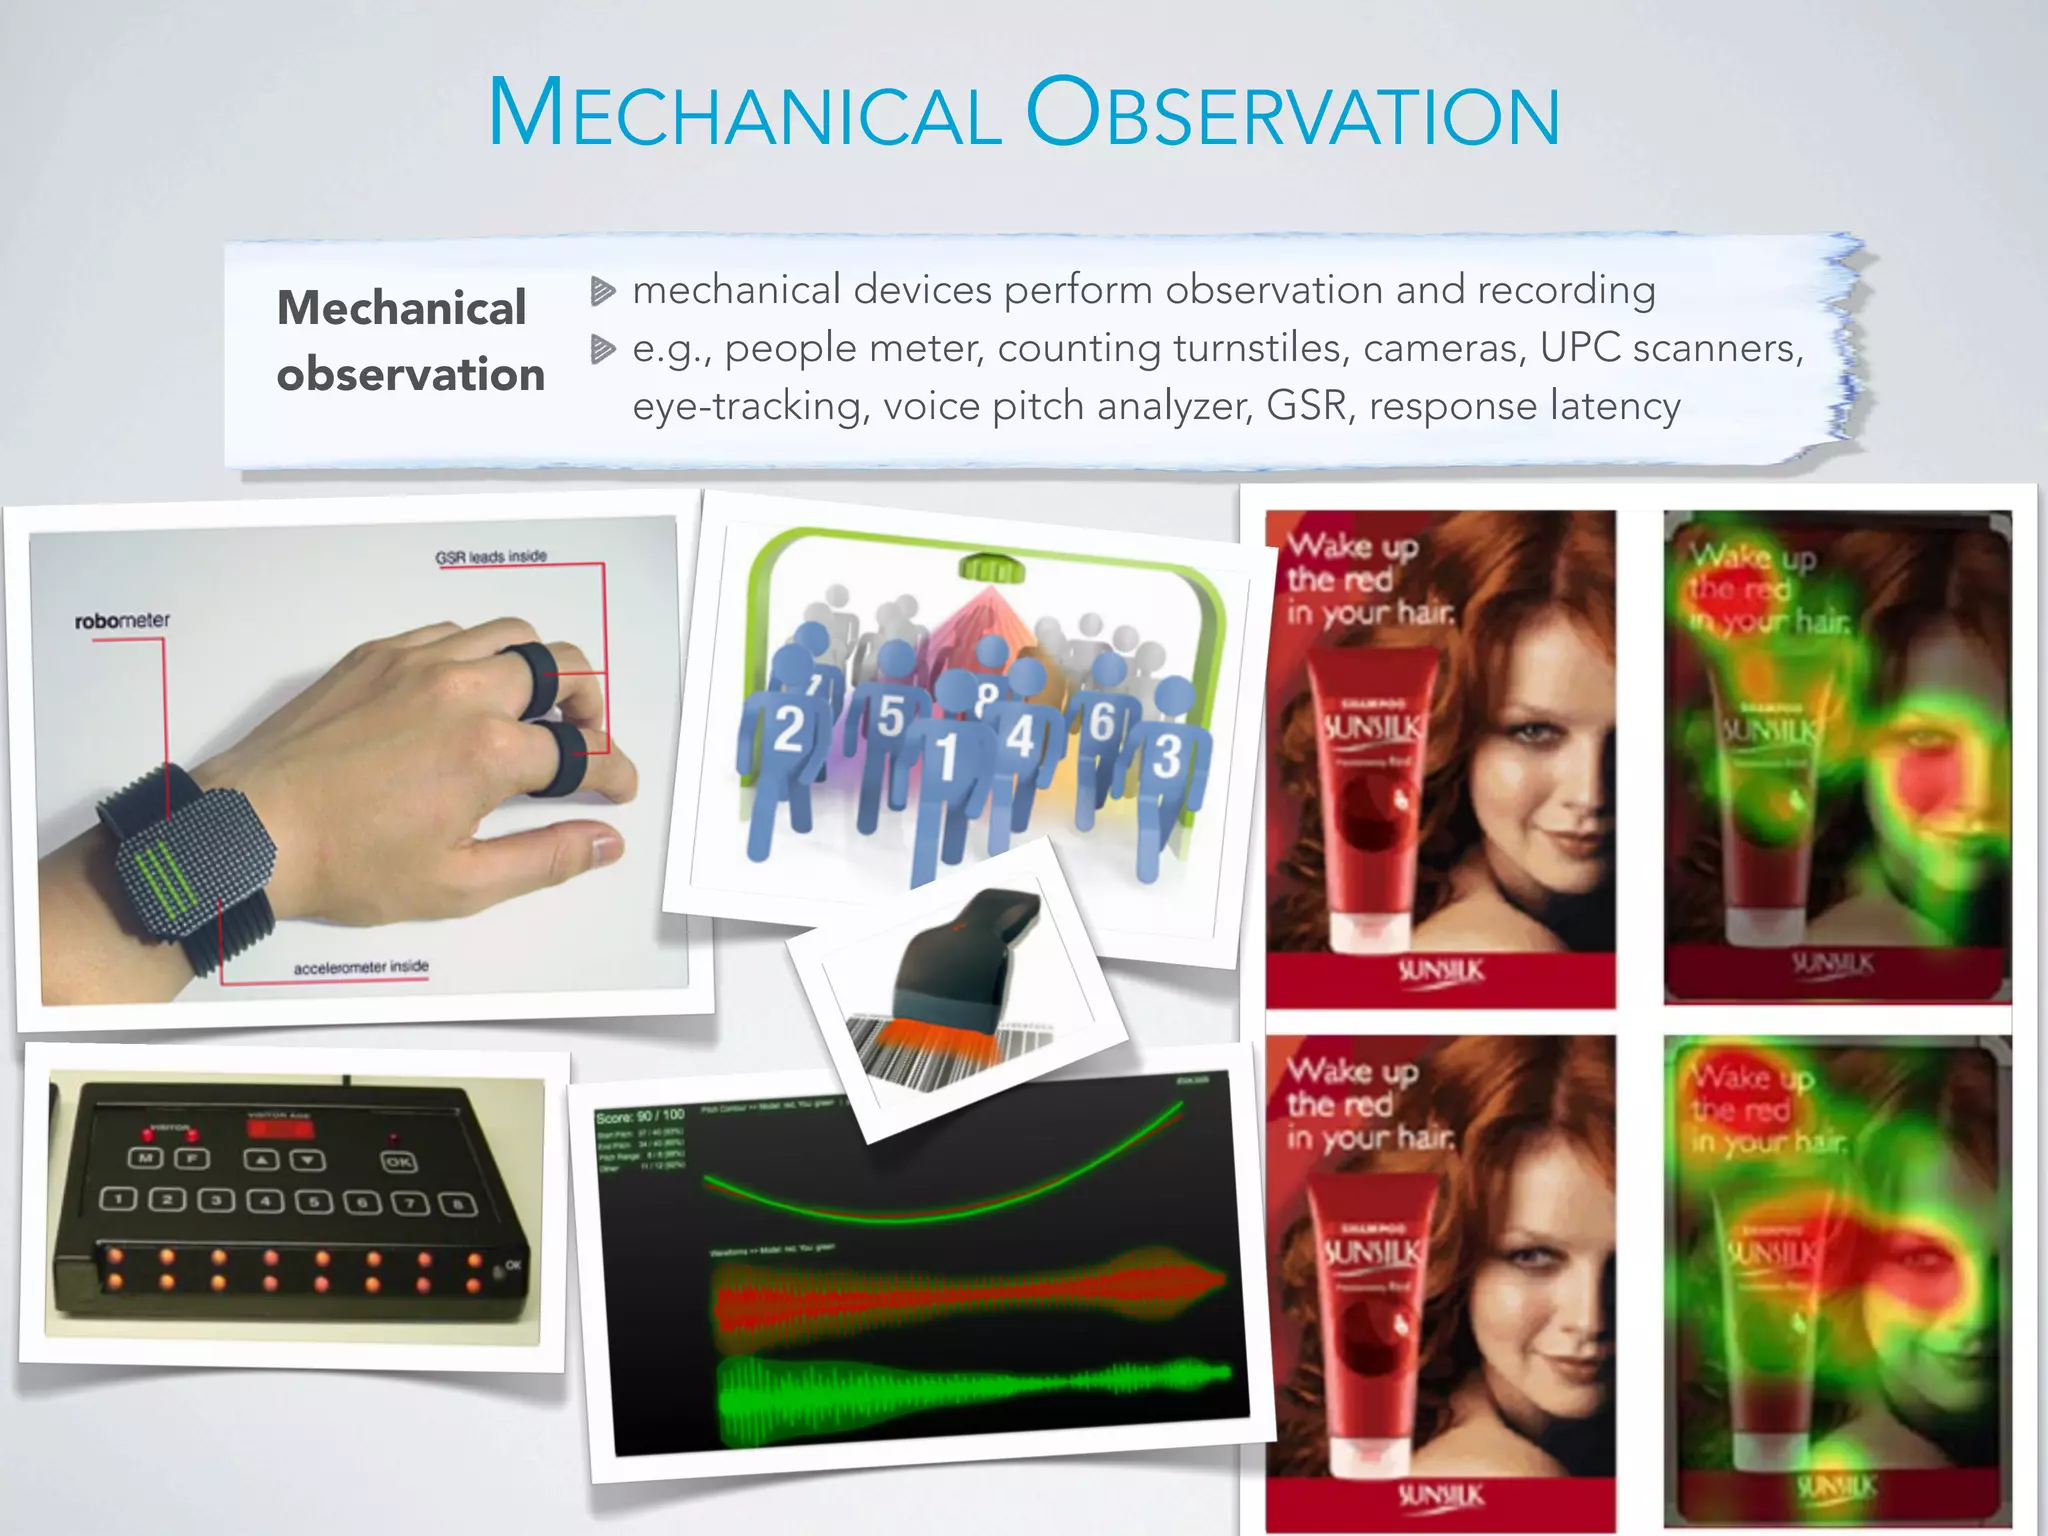
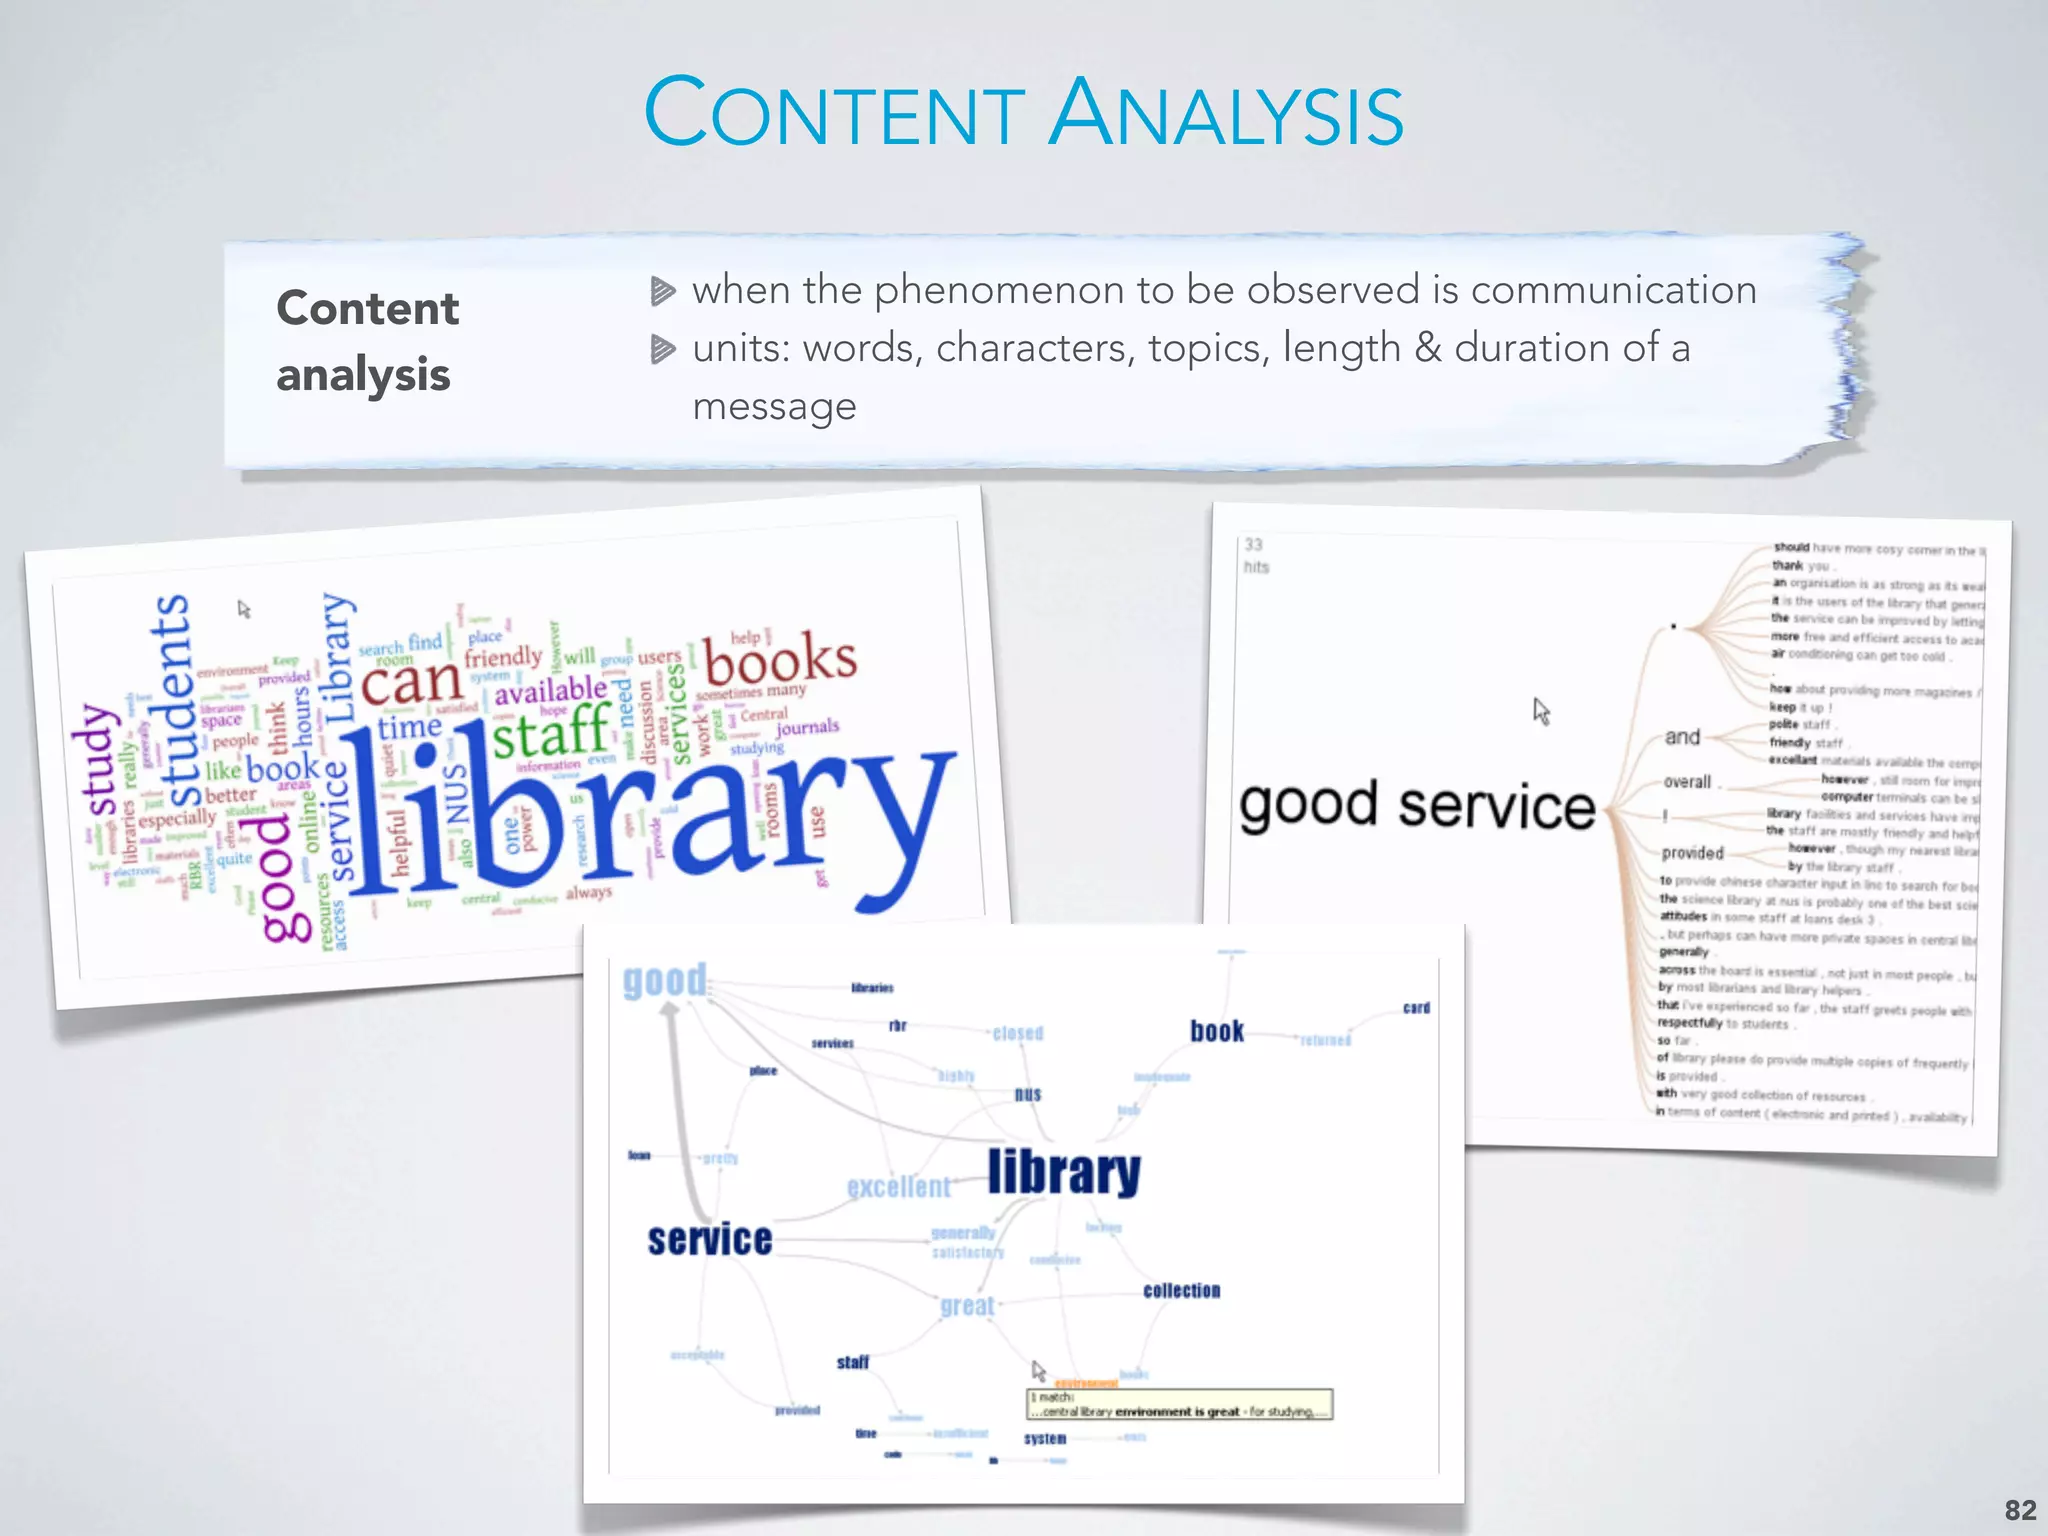
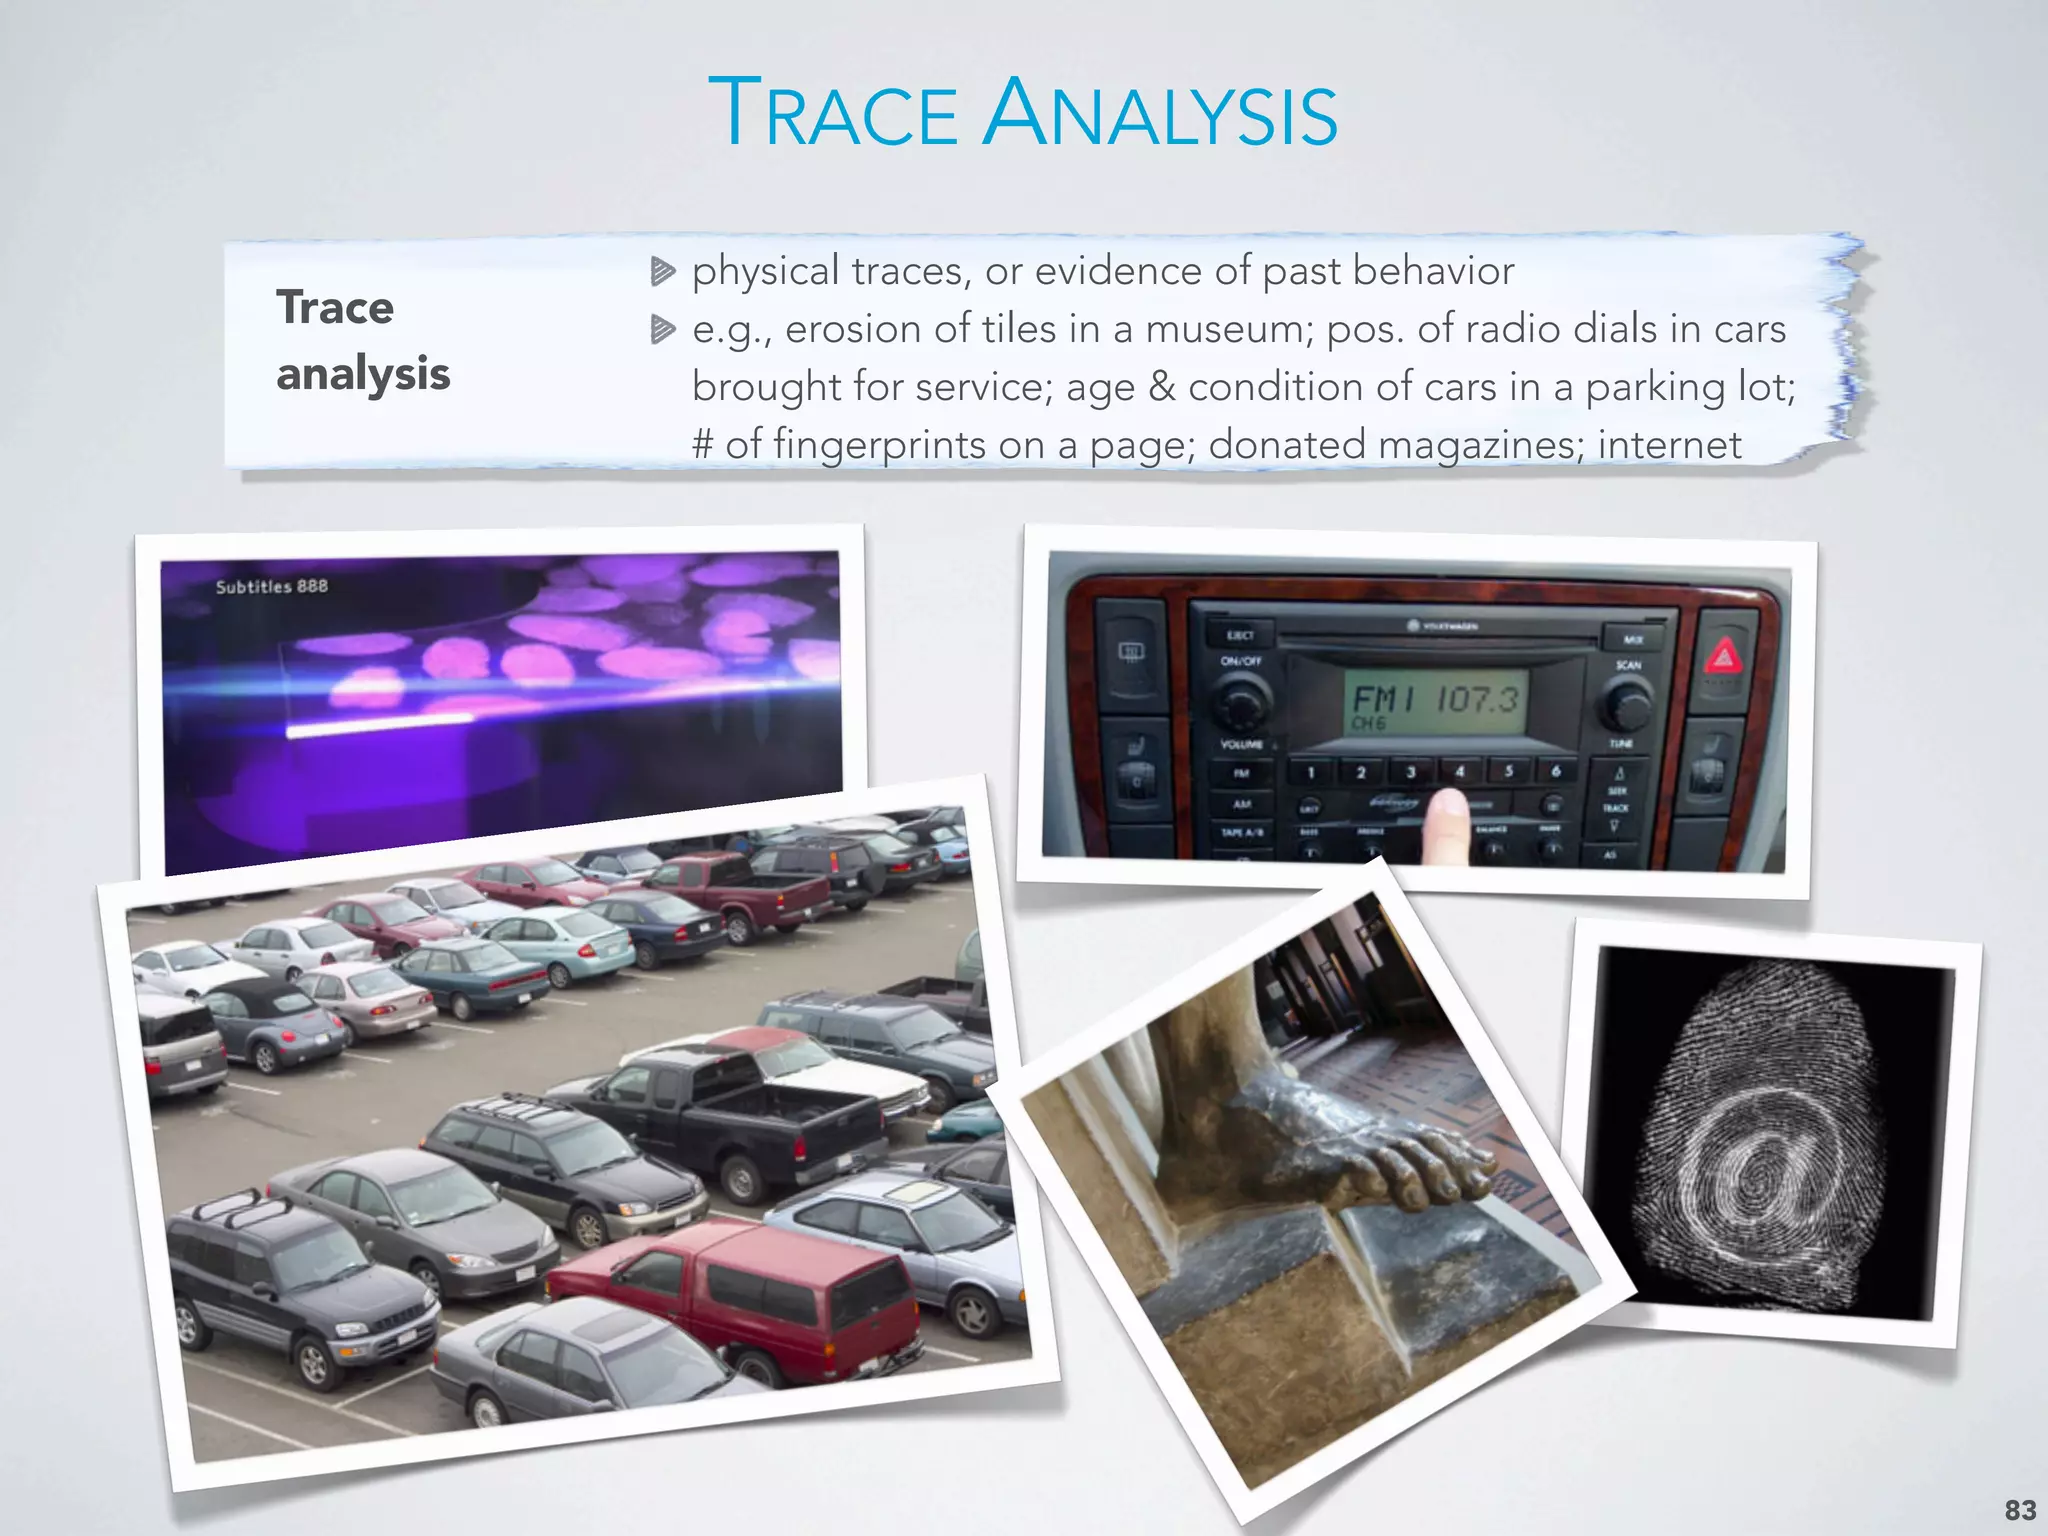
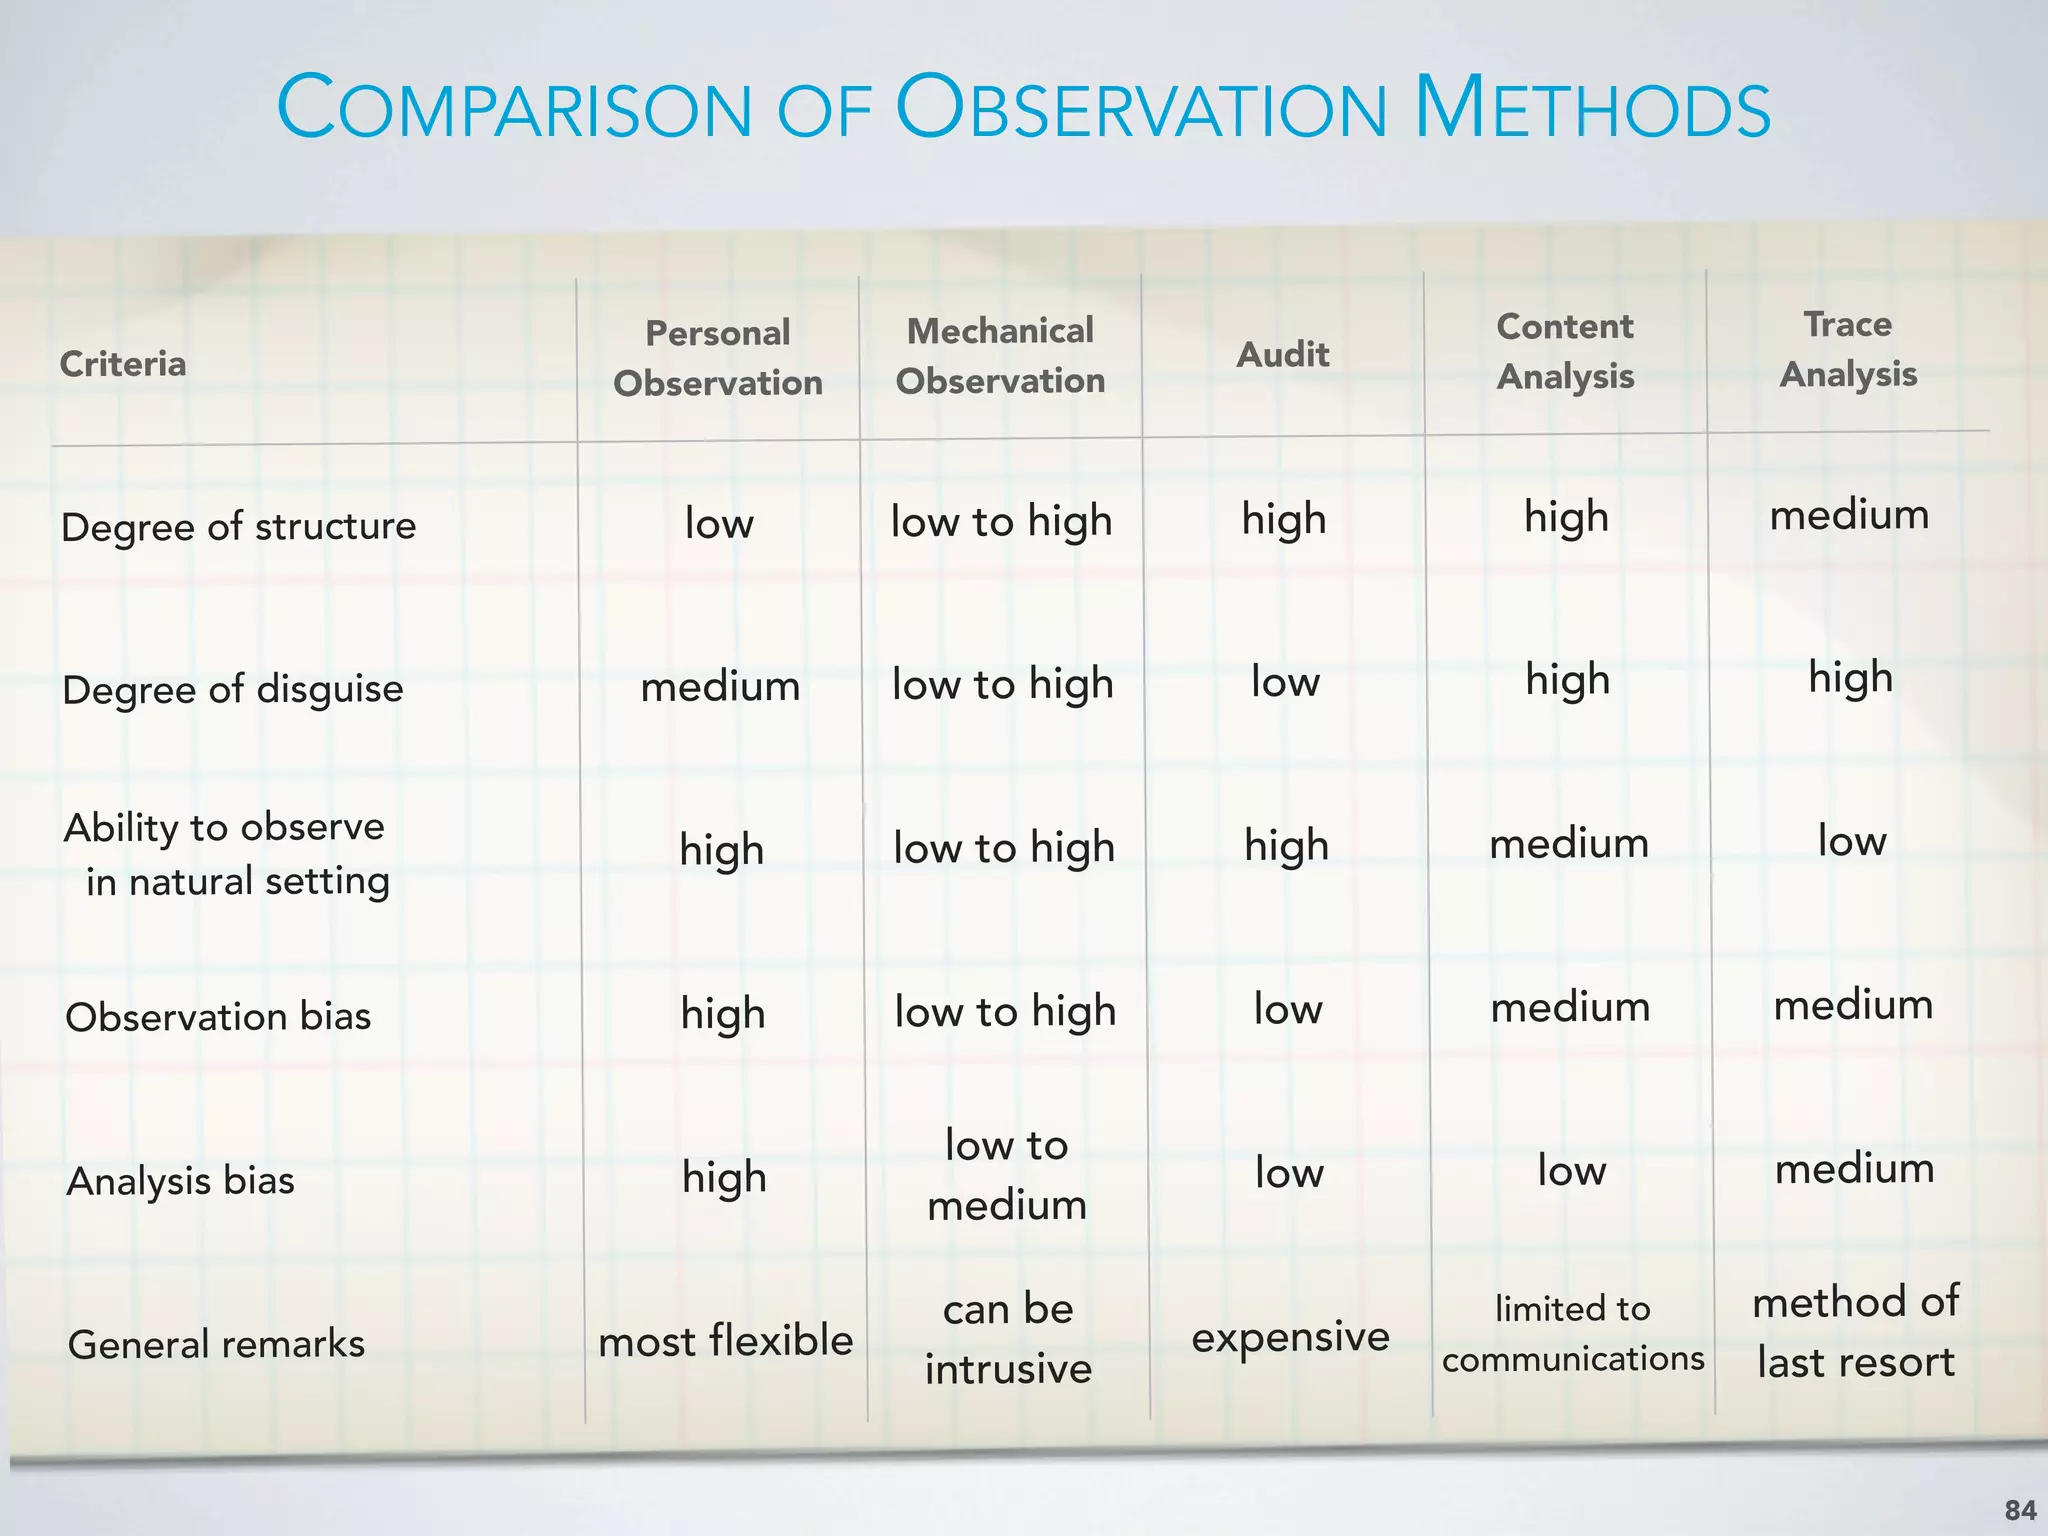
Detailed overview of various observation methods used in market research, distinguishing types and their applications.
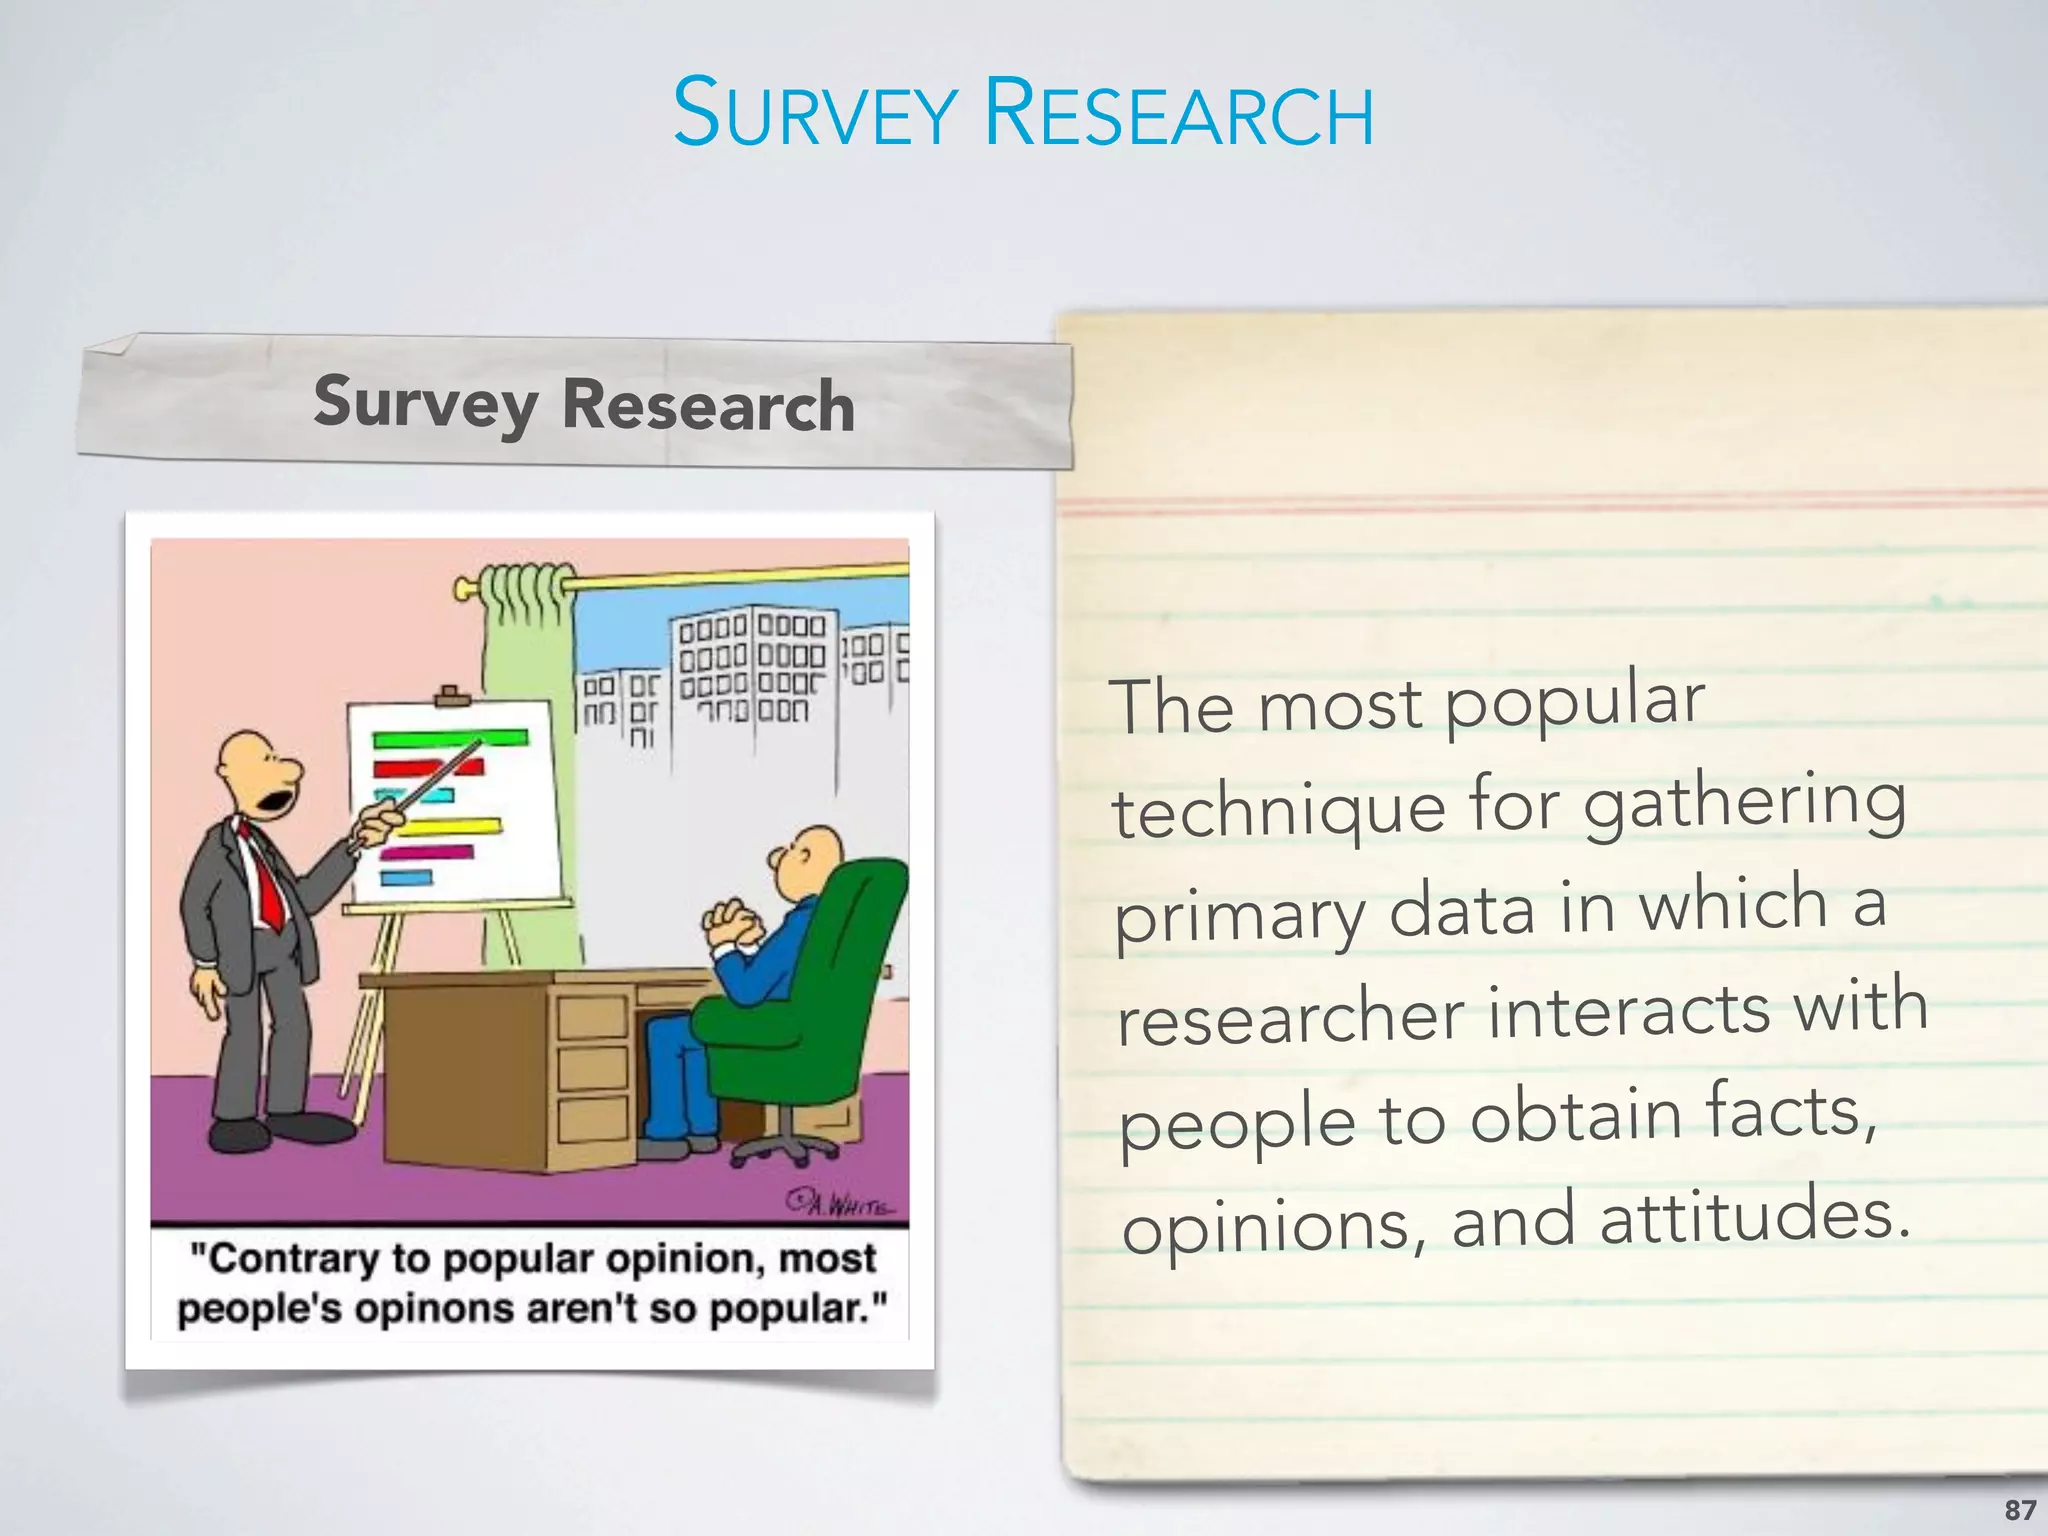
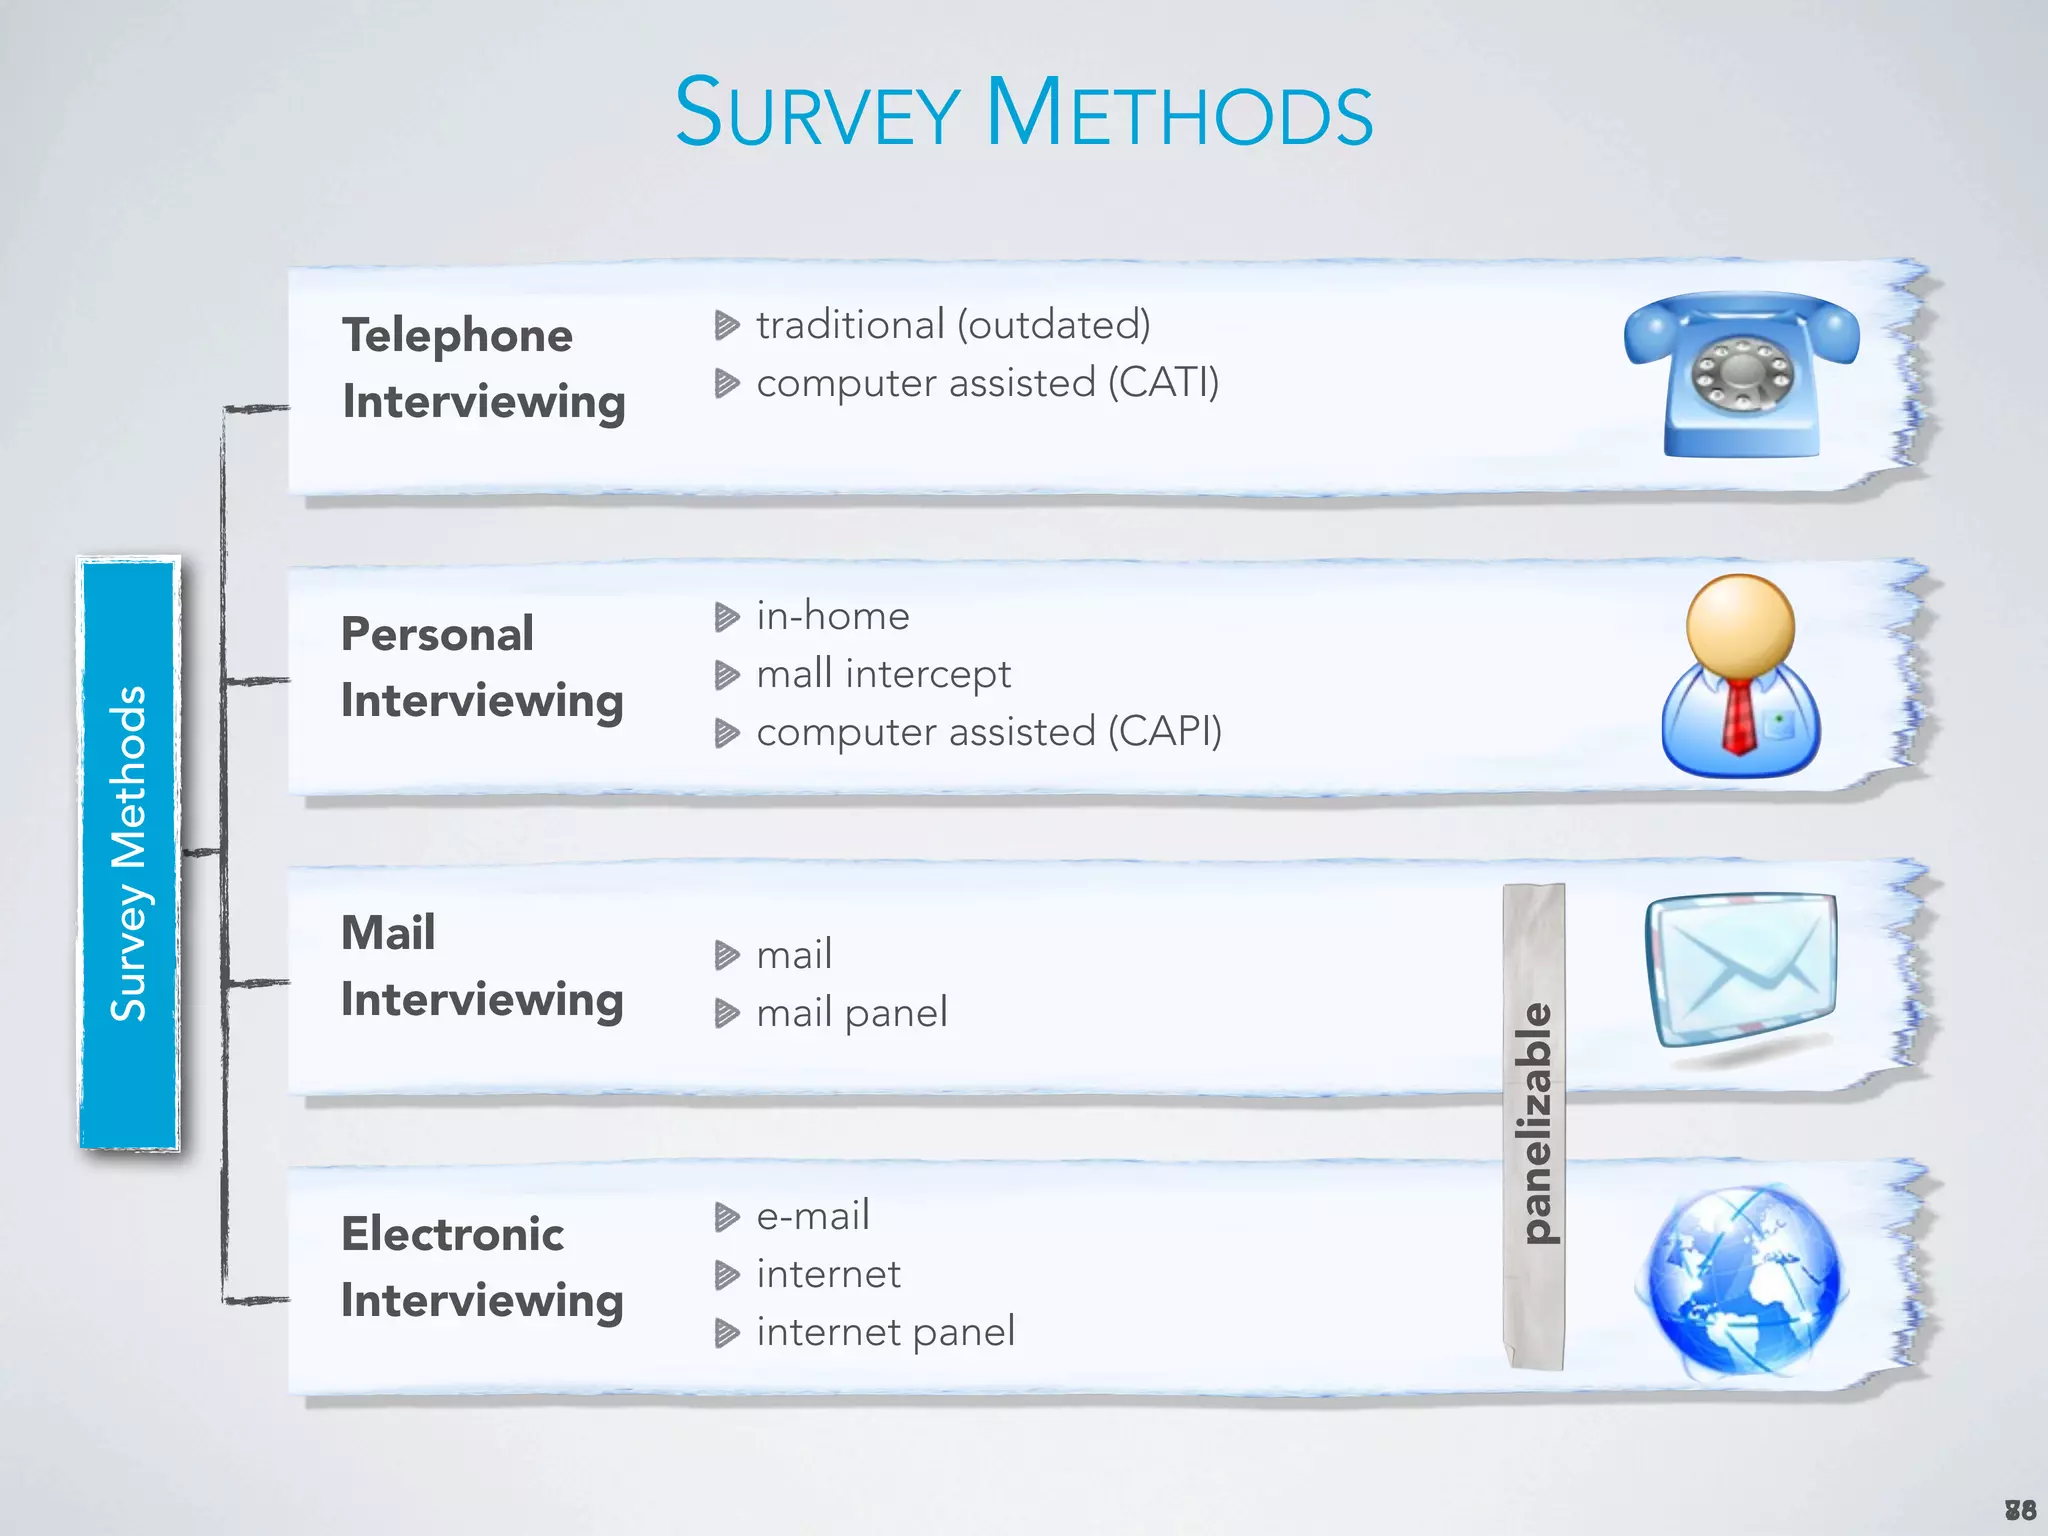
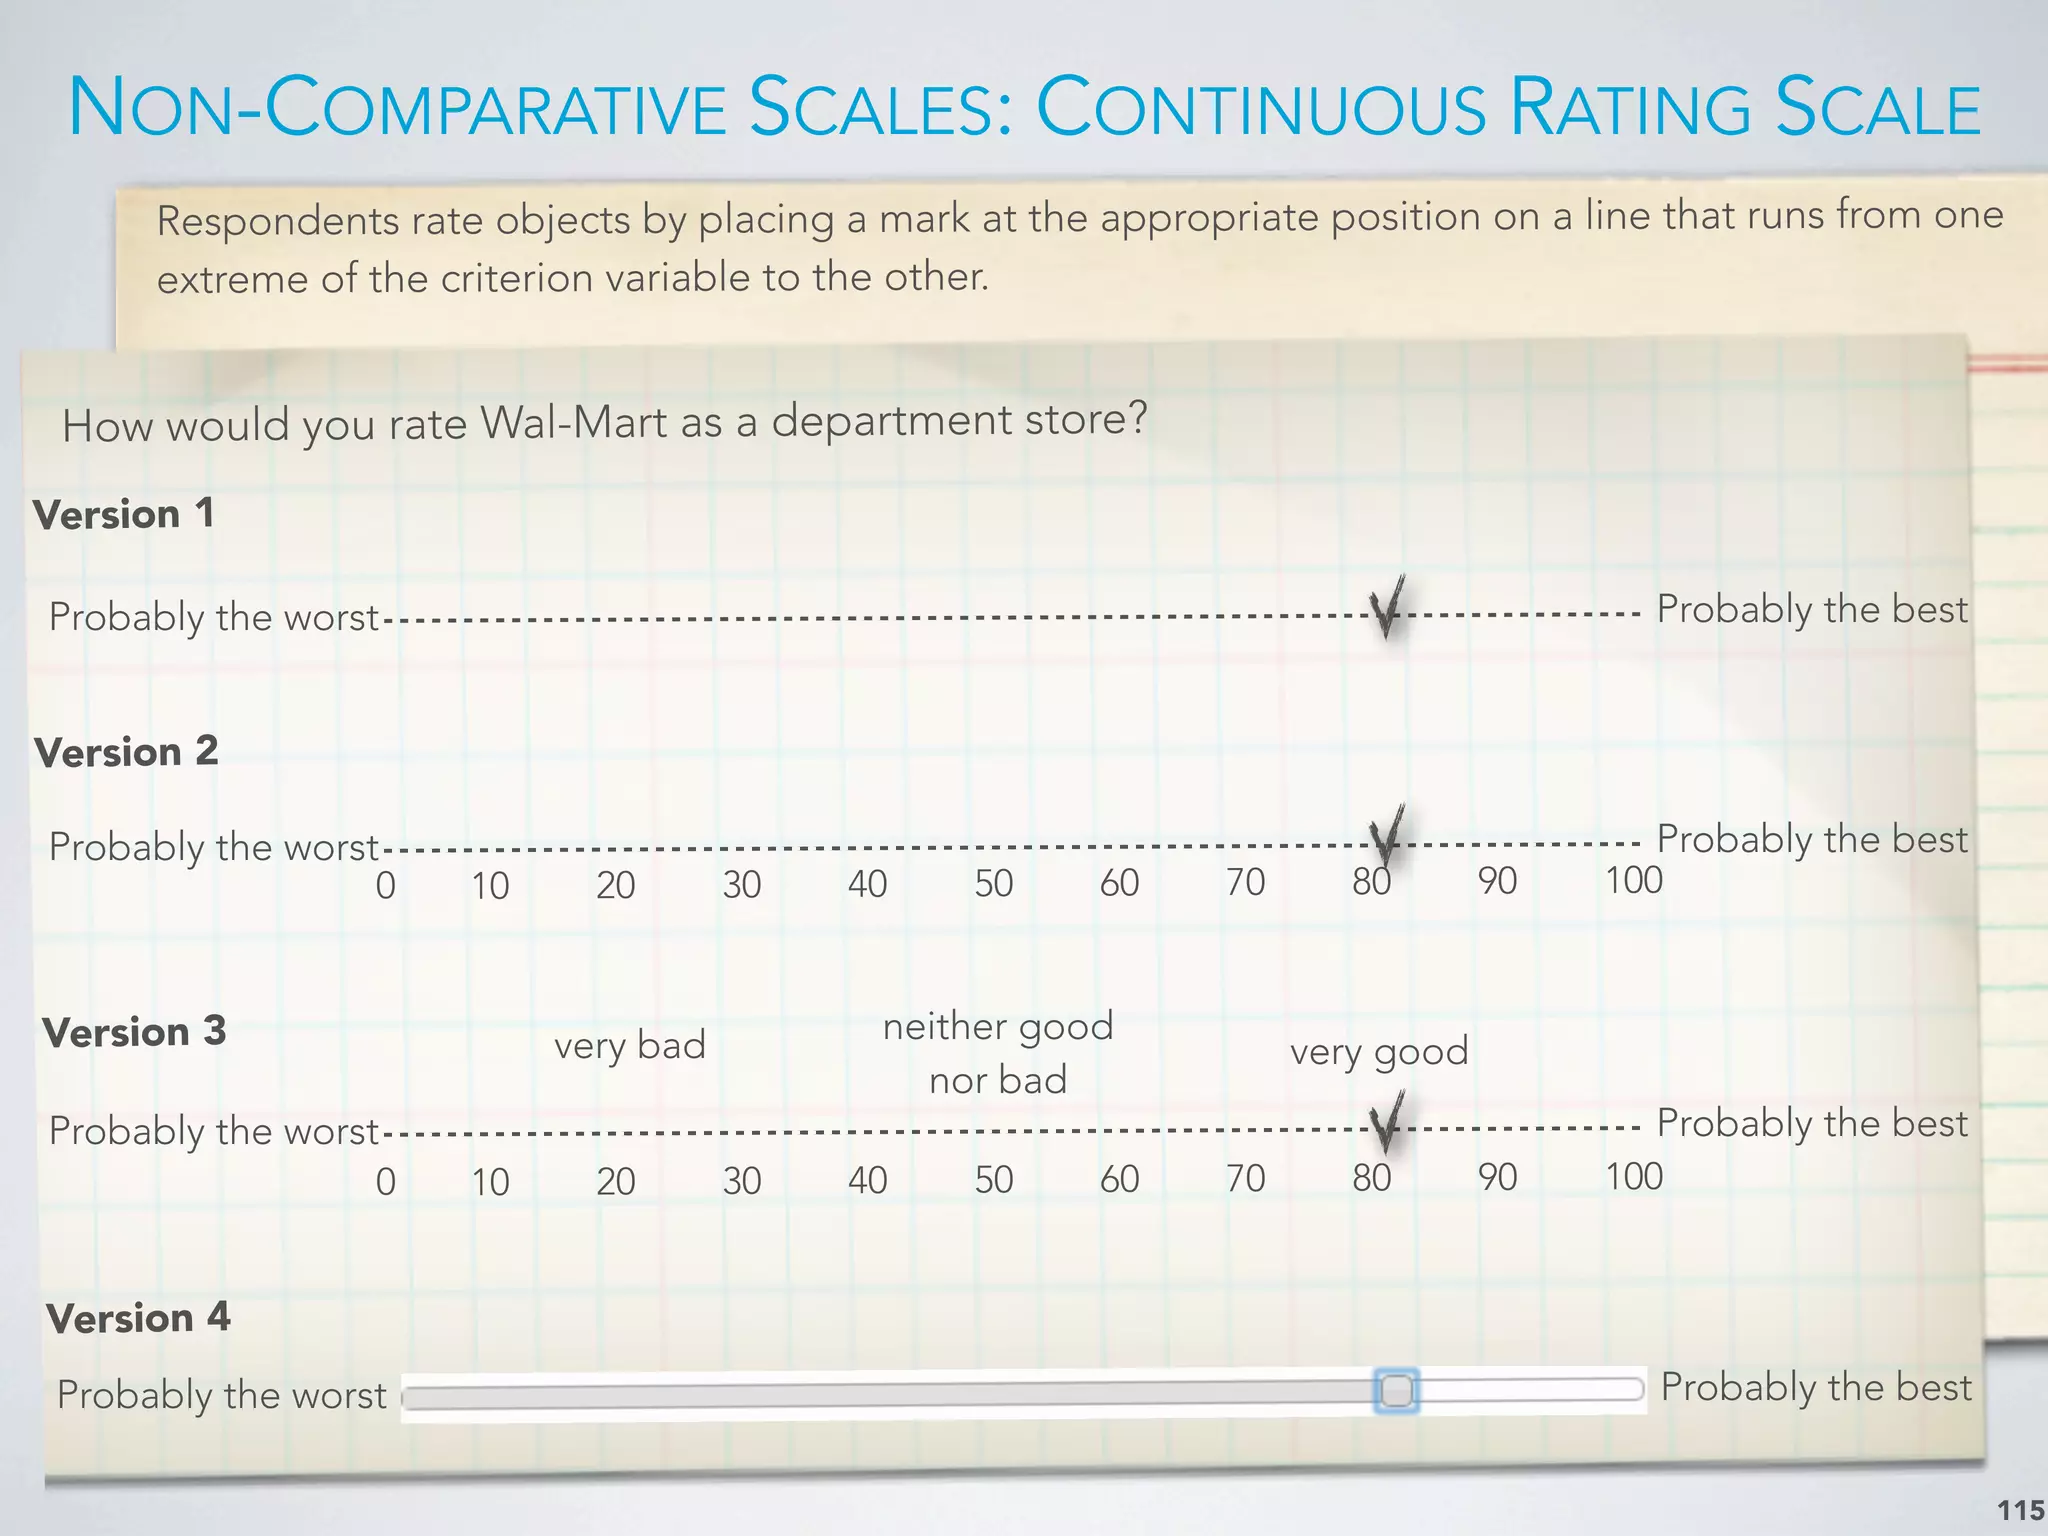
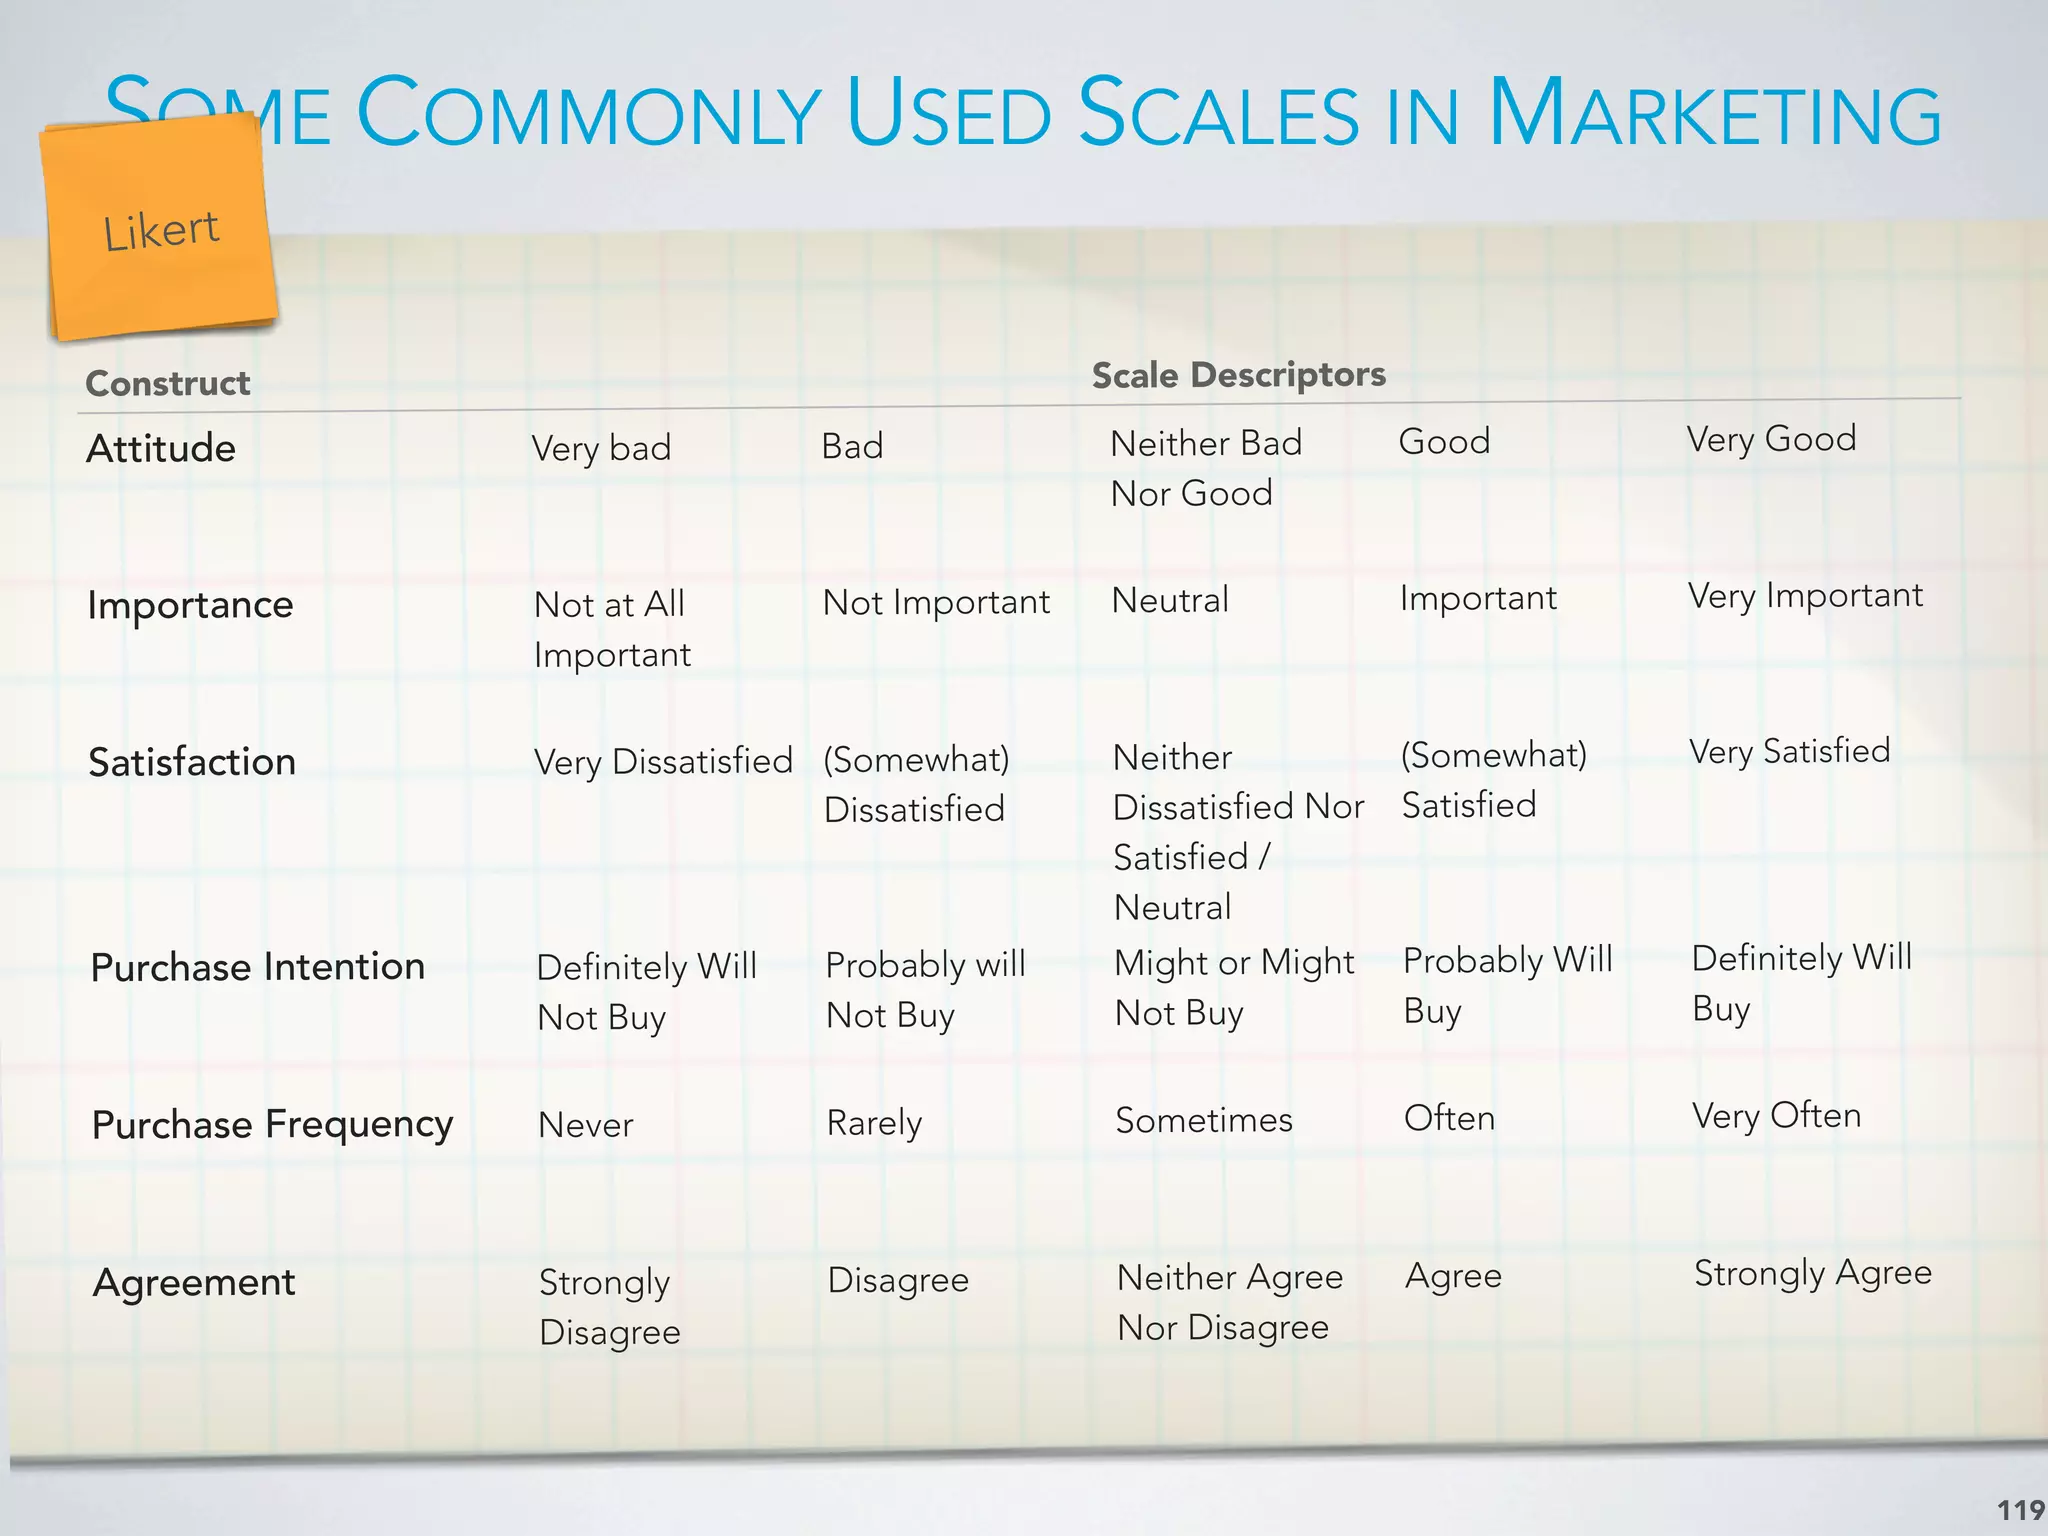
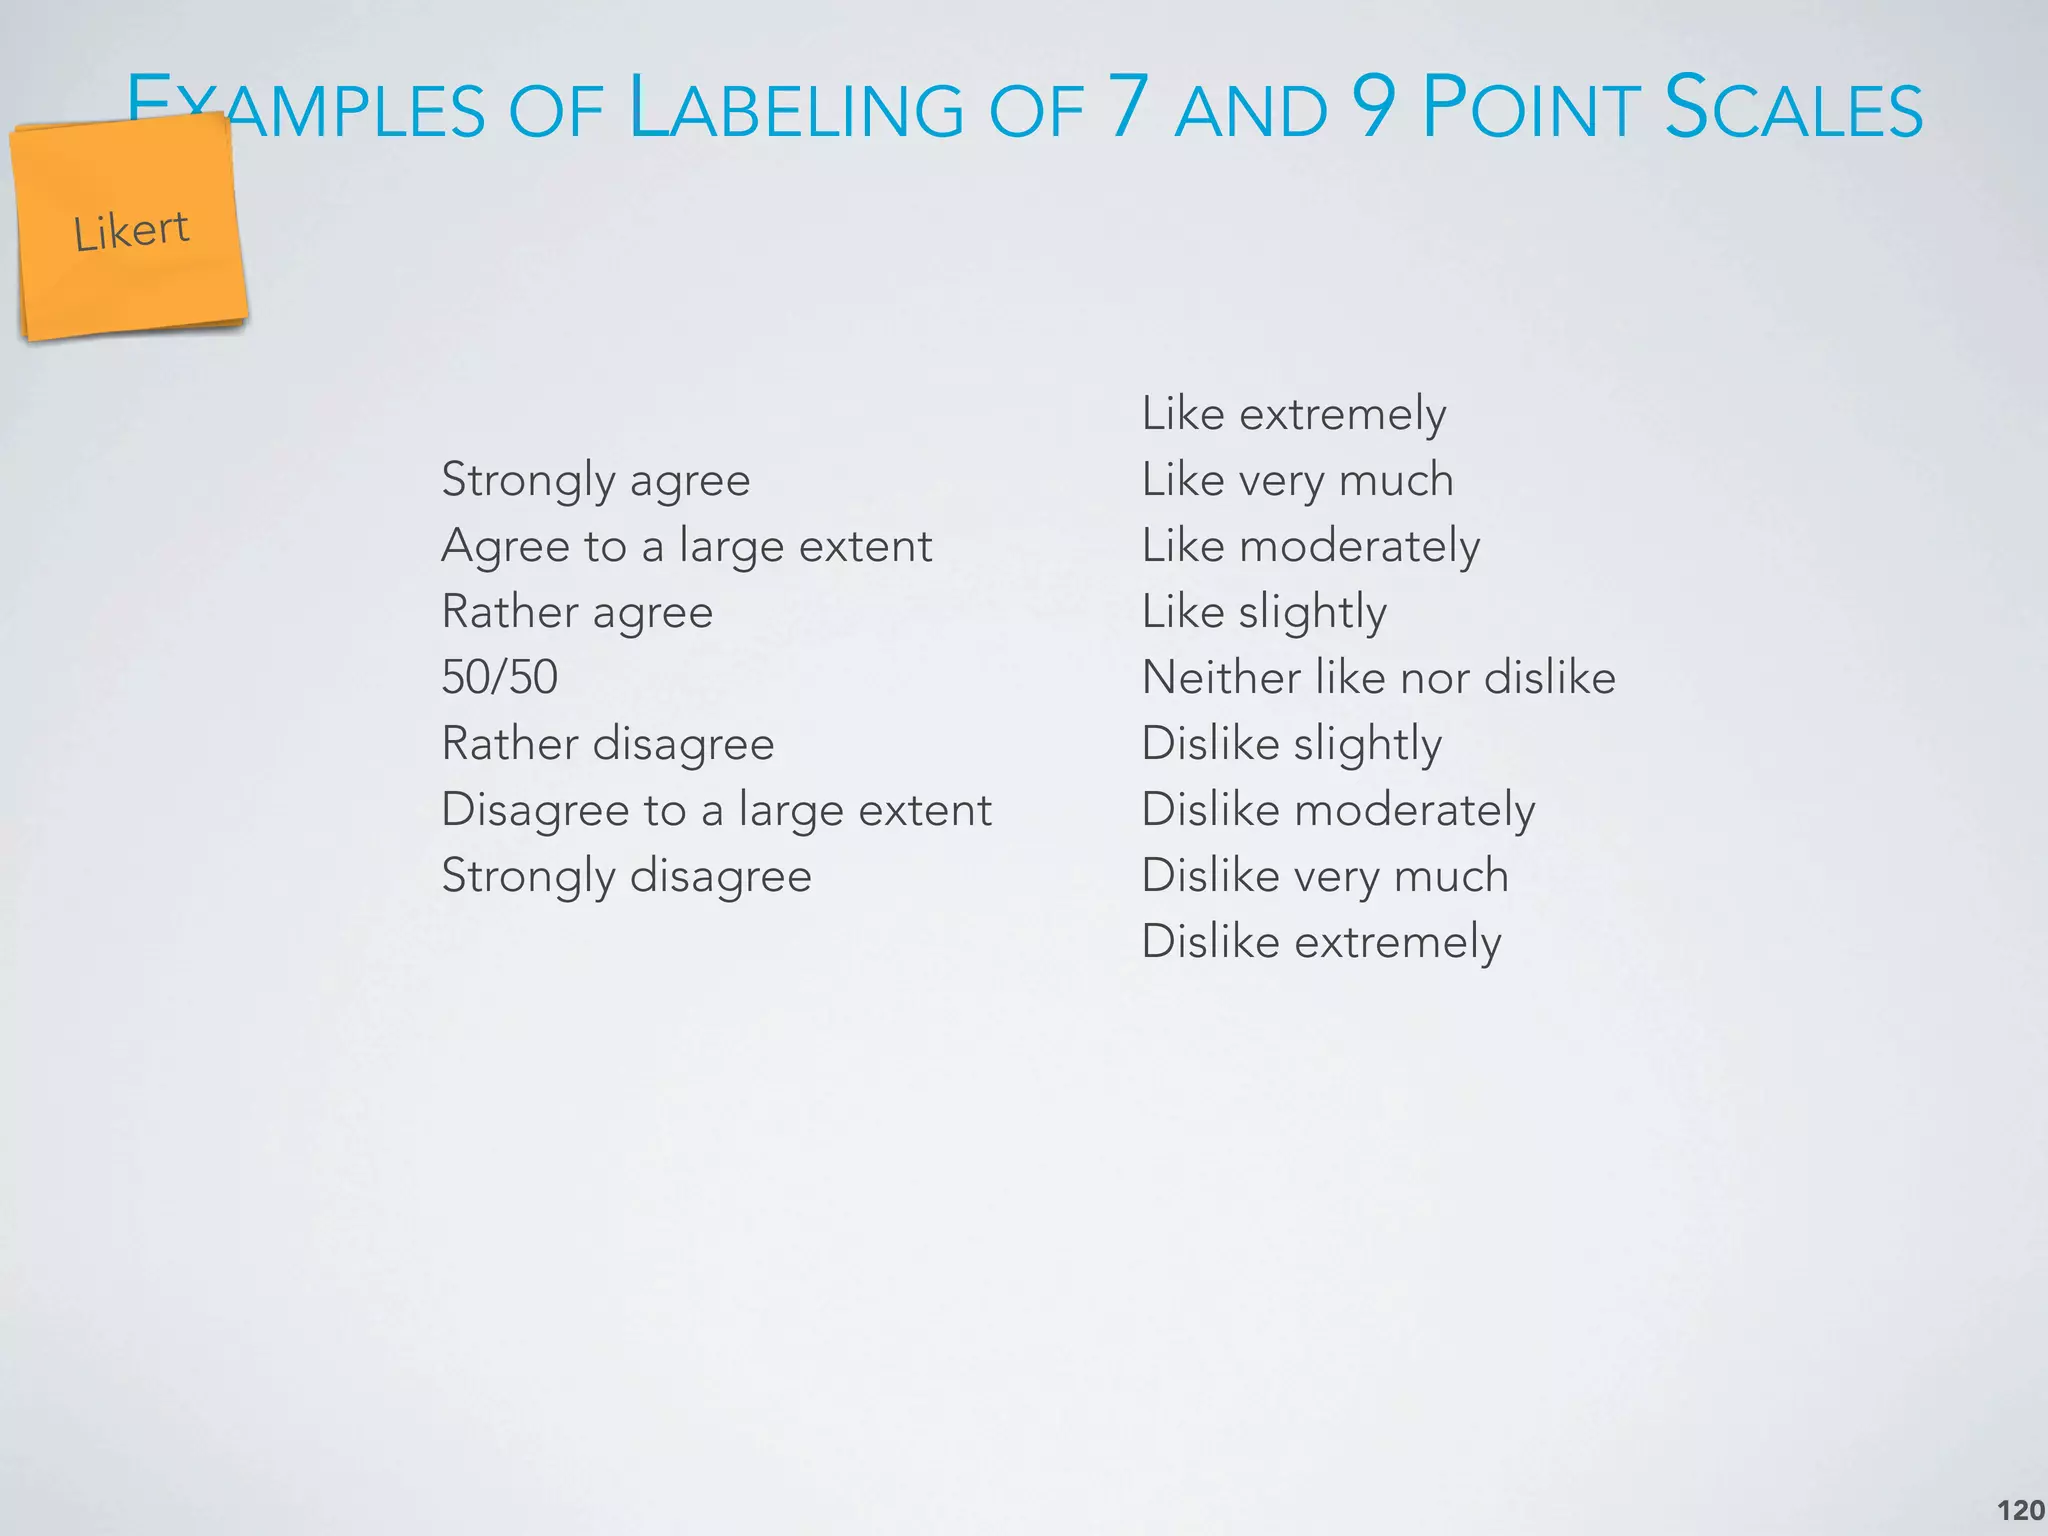
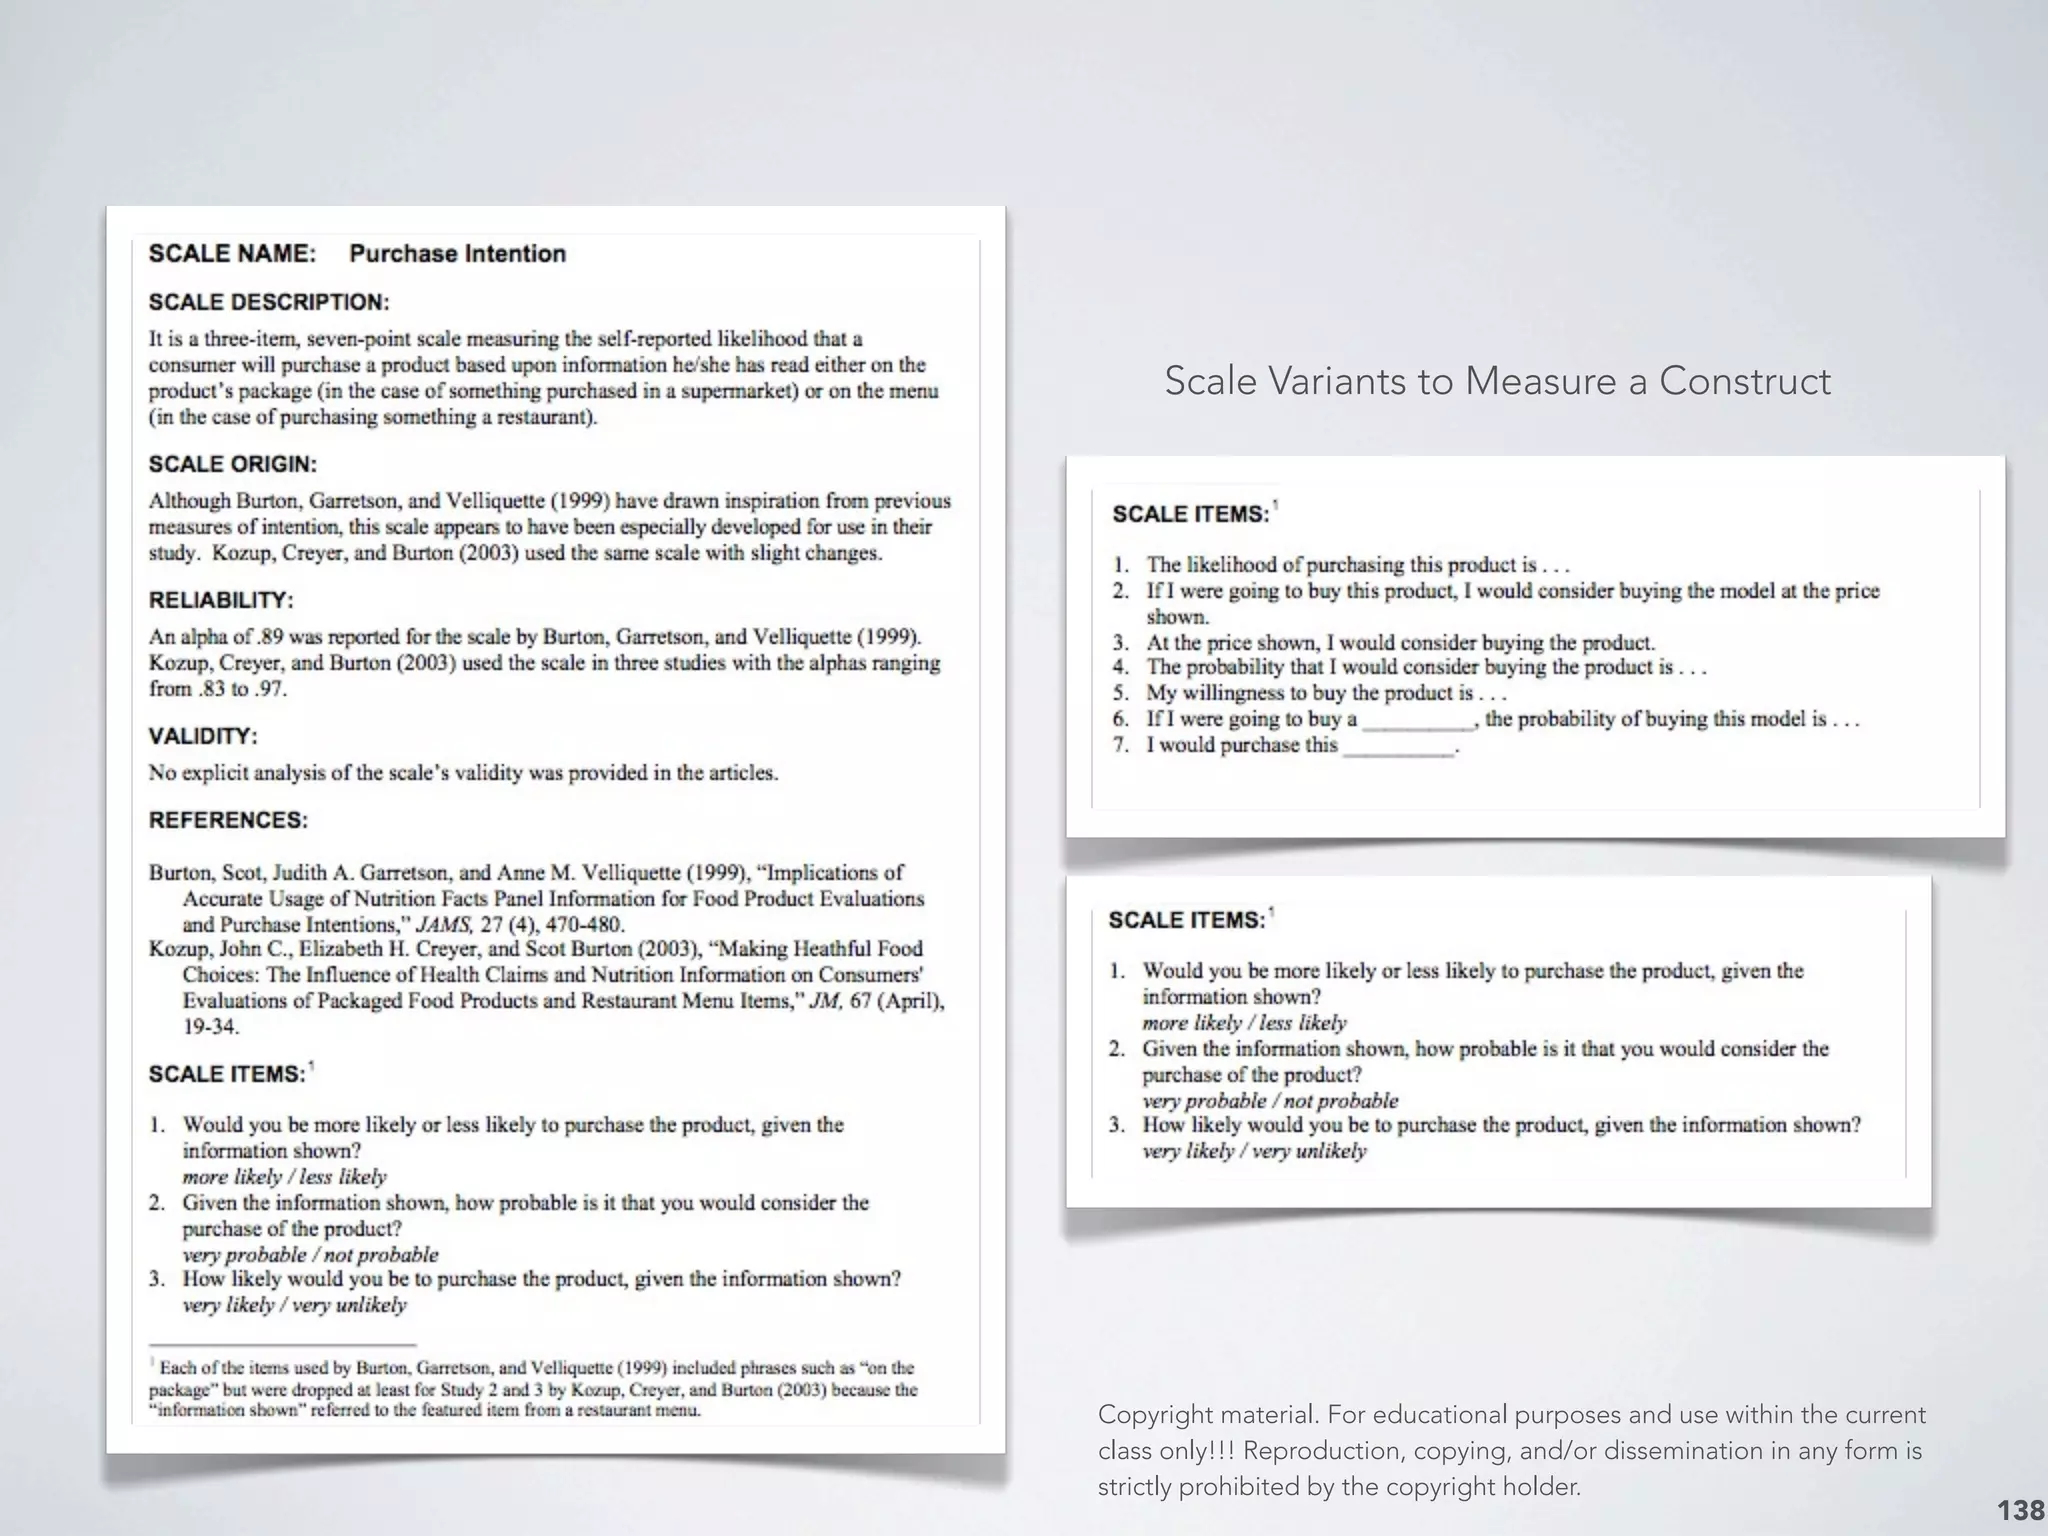
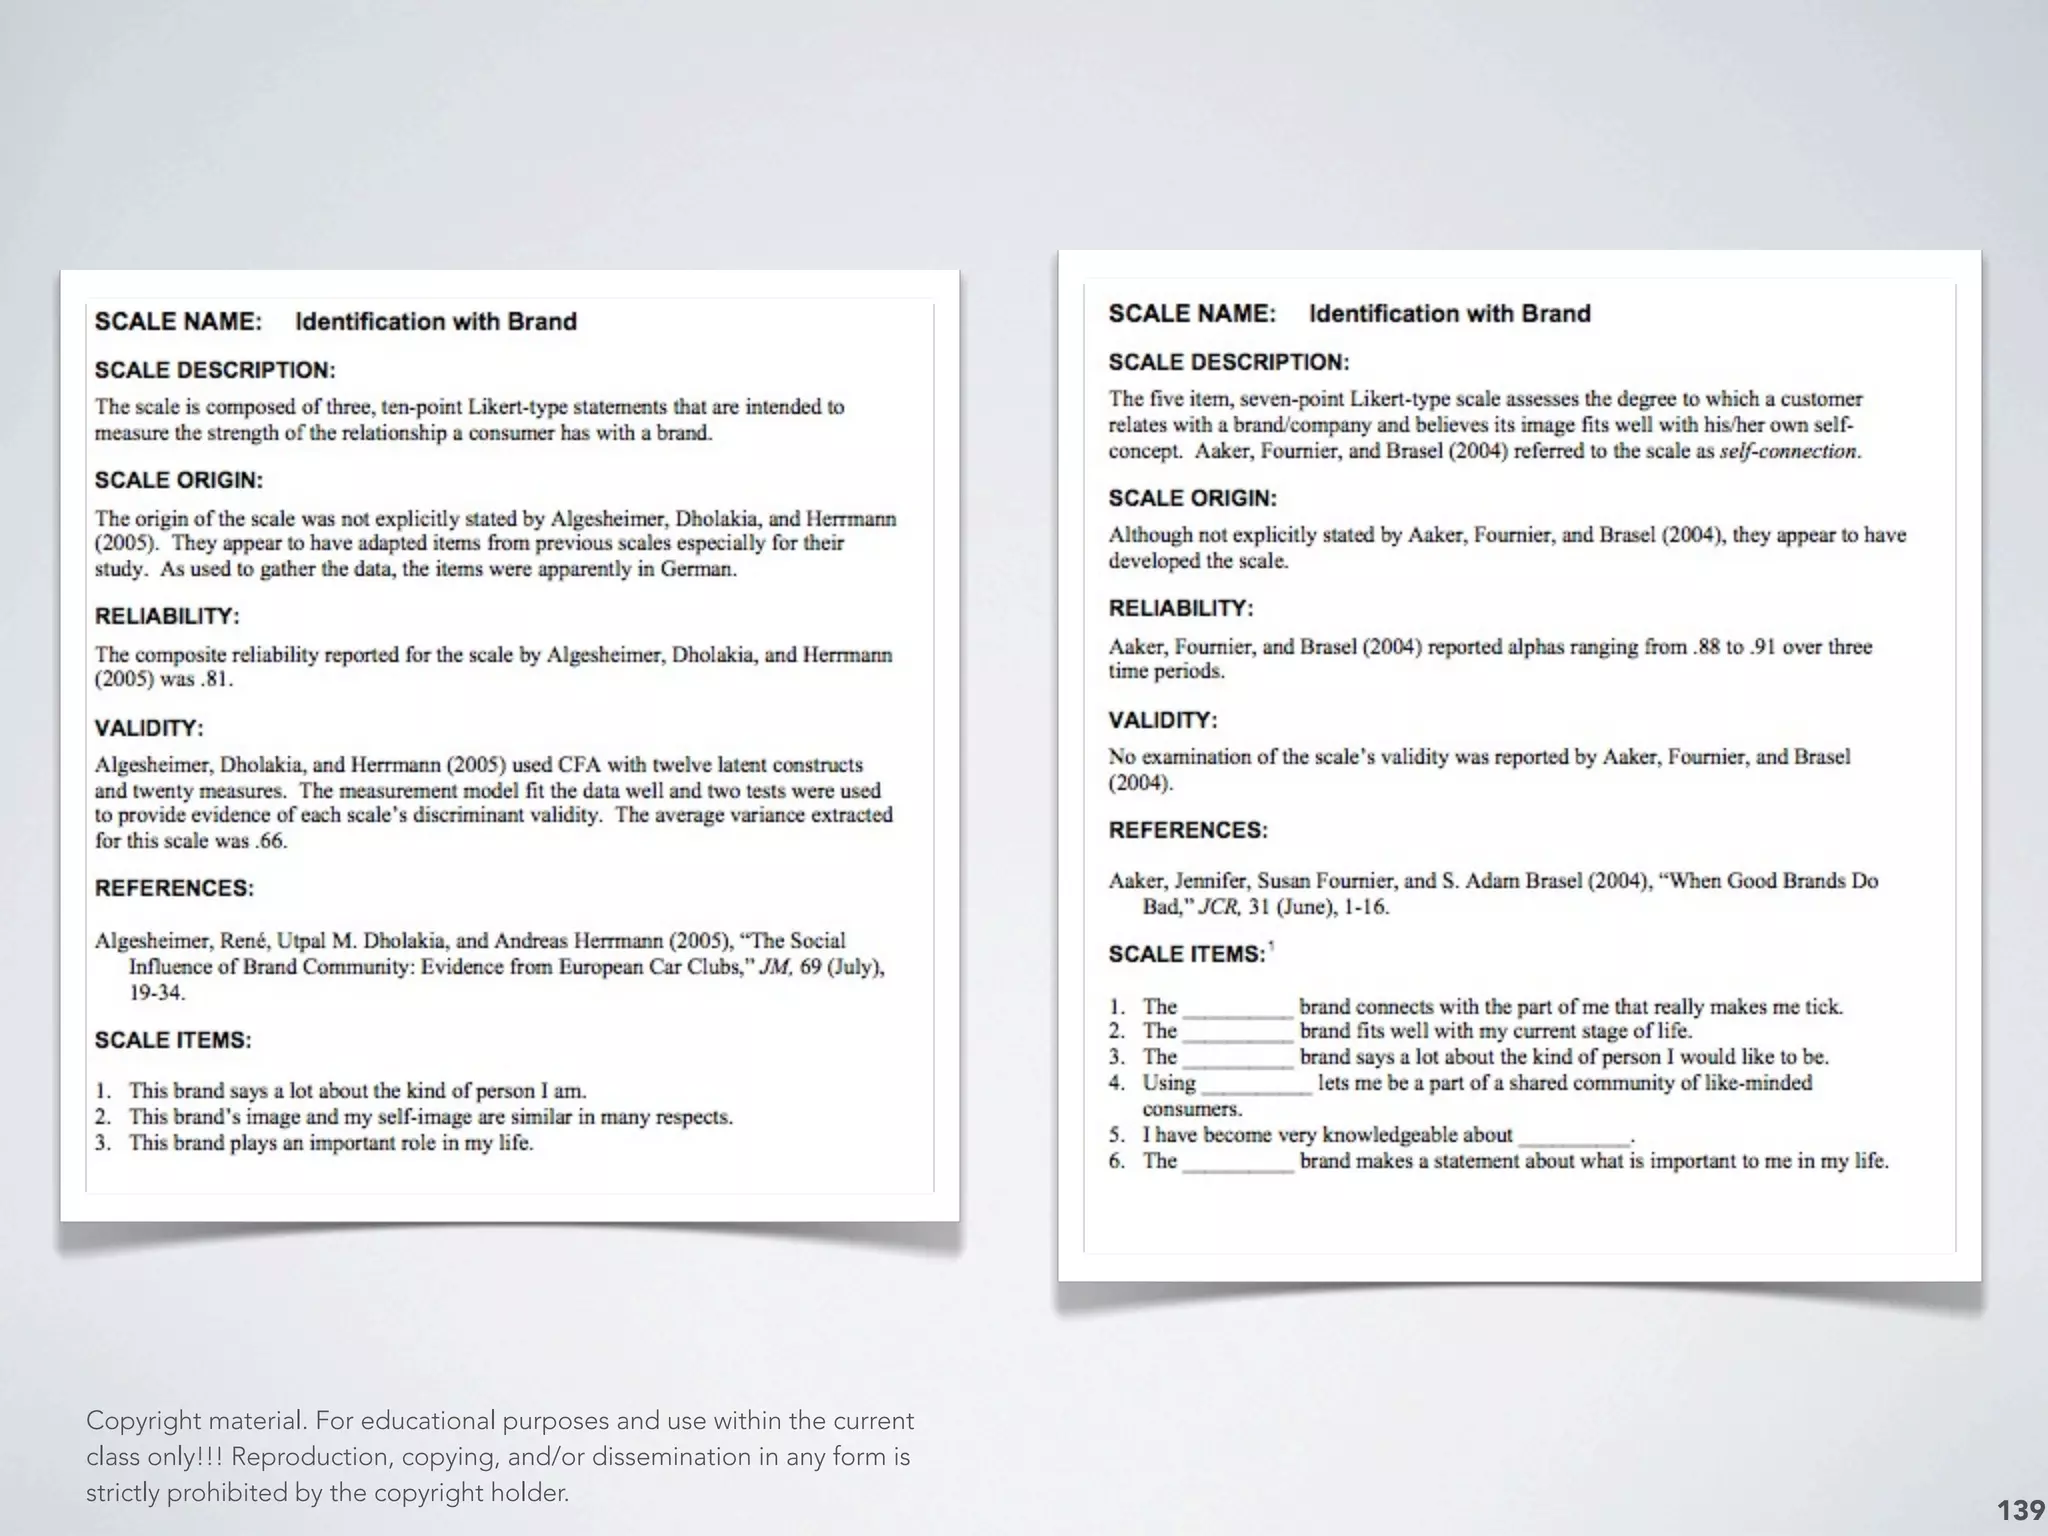
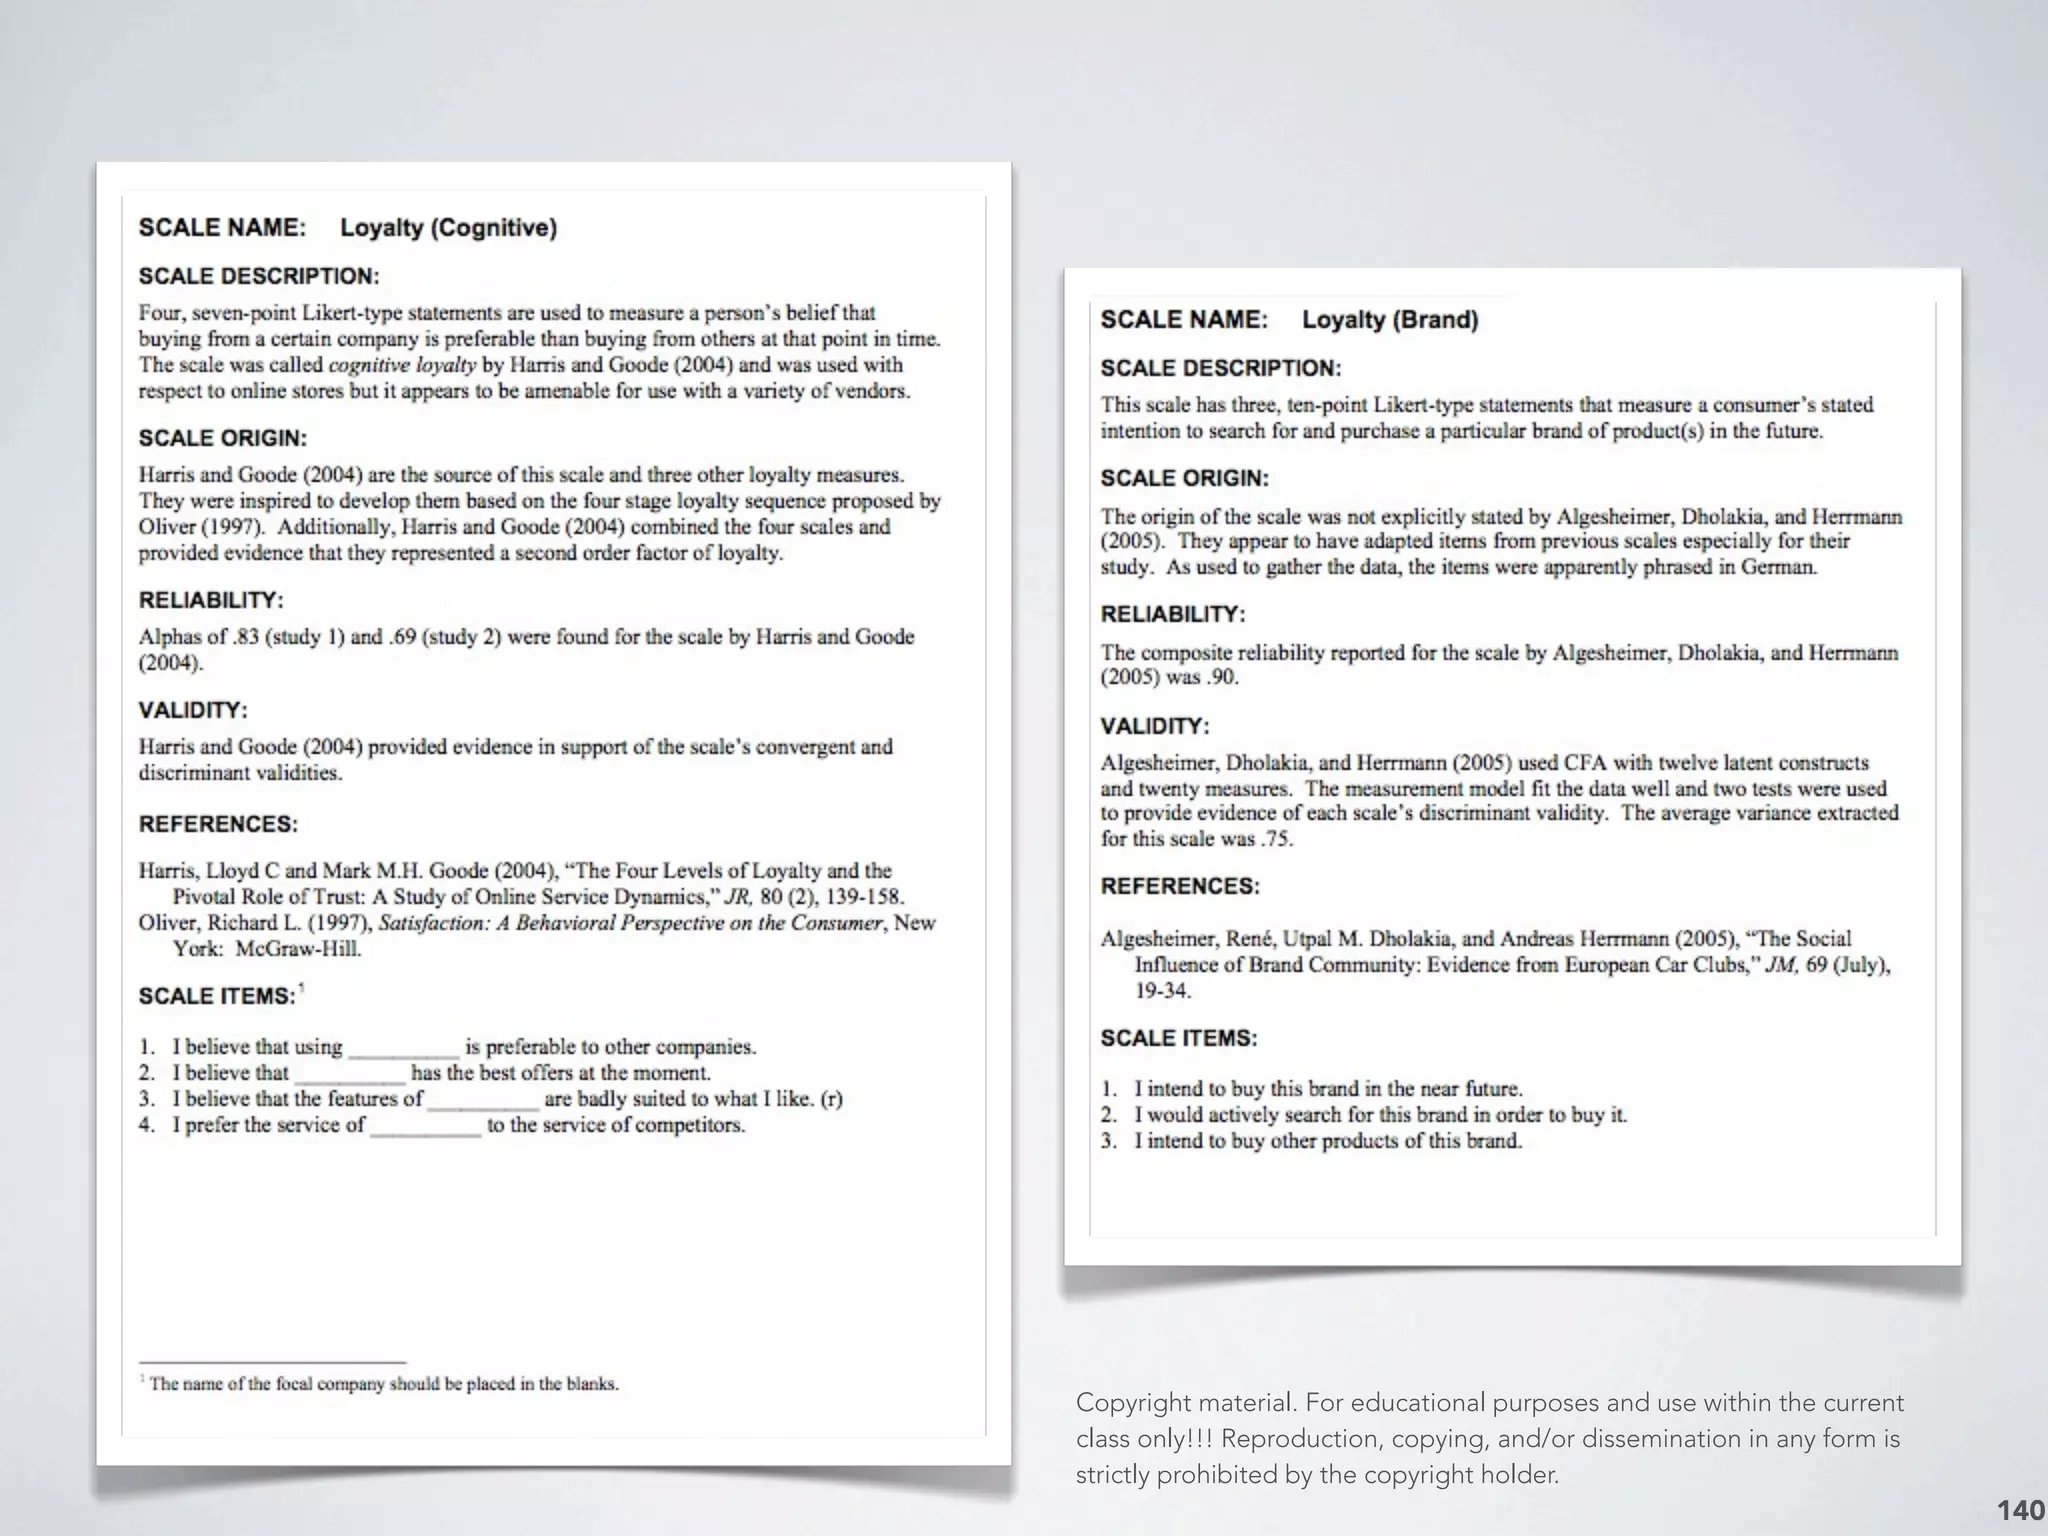
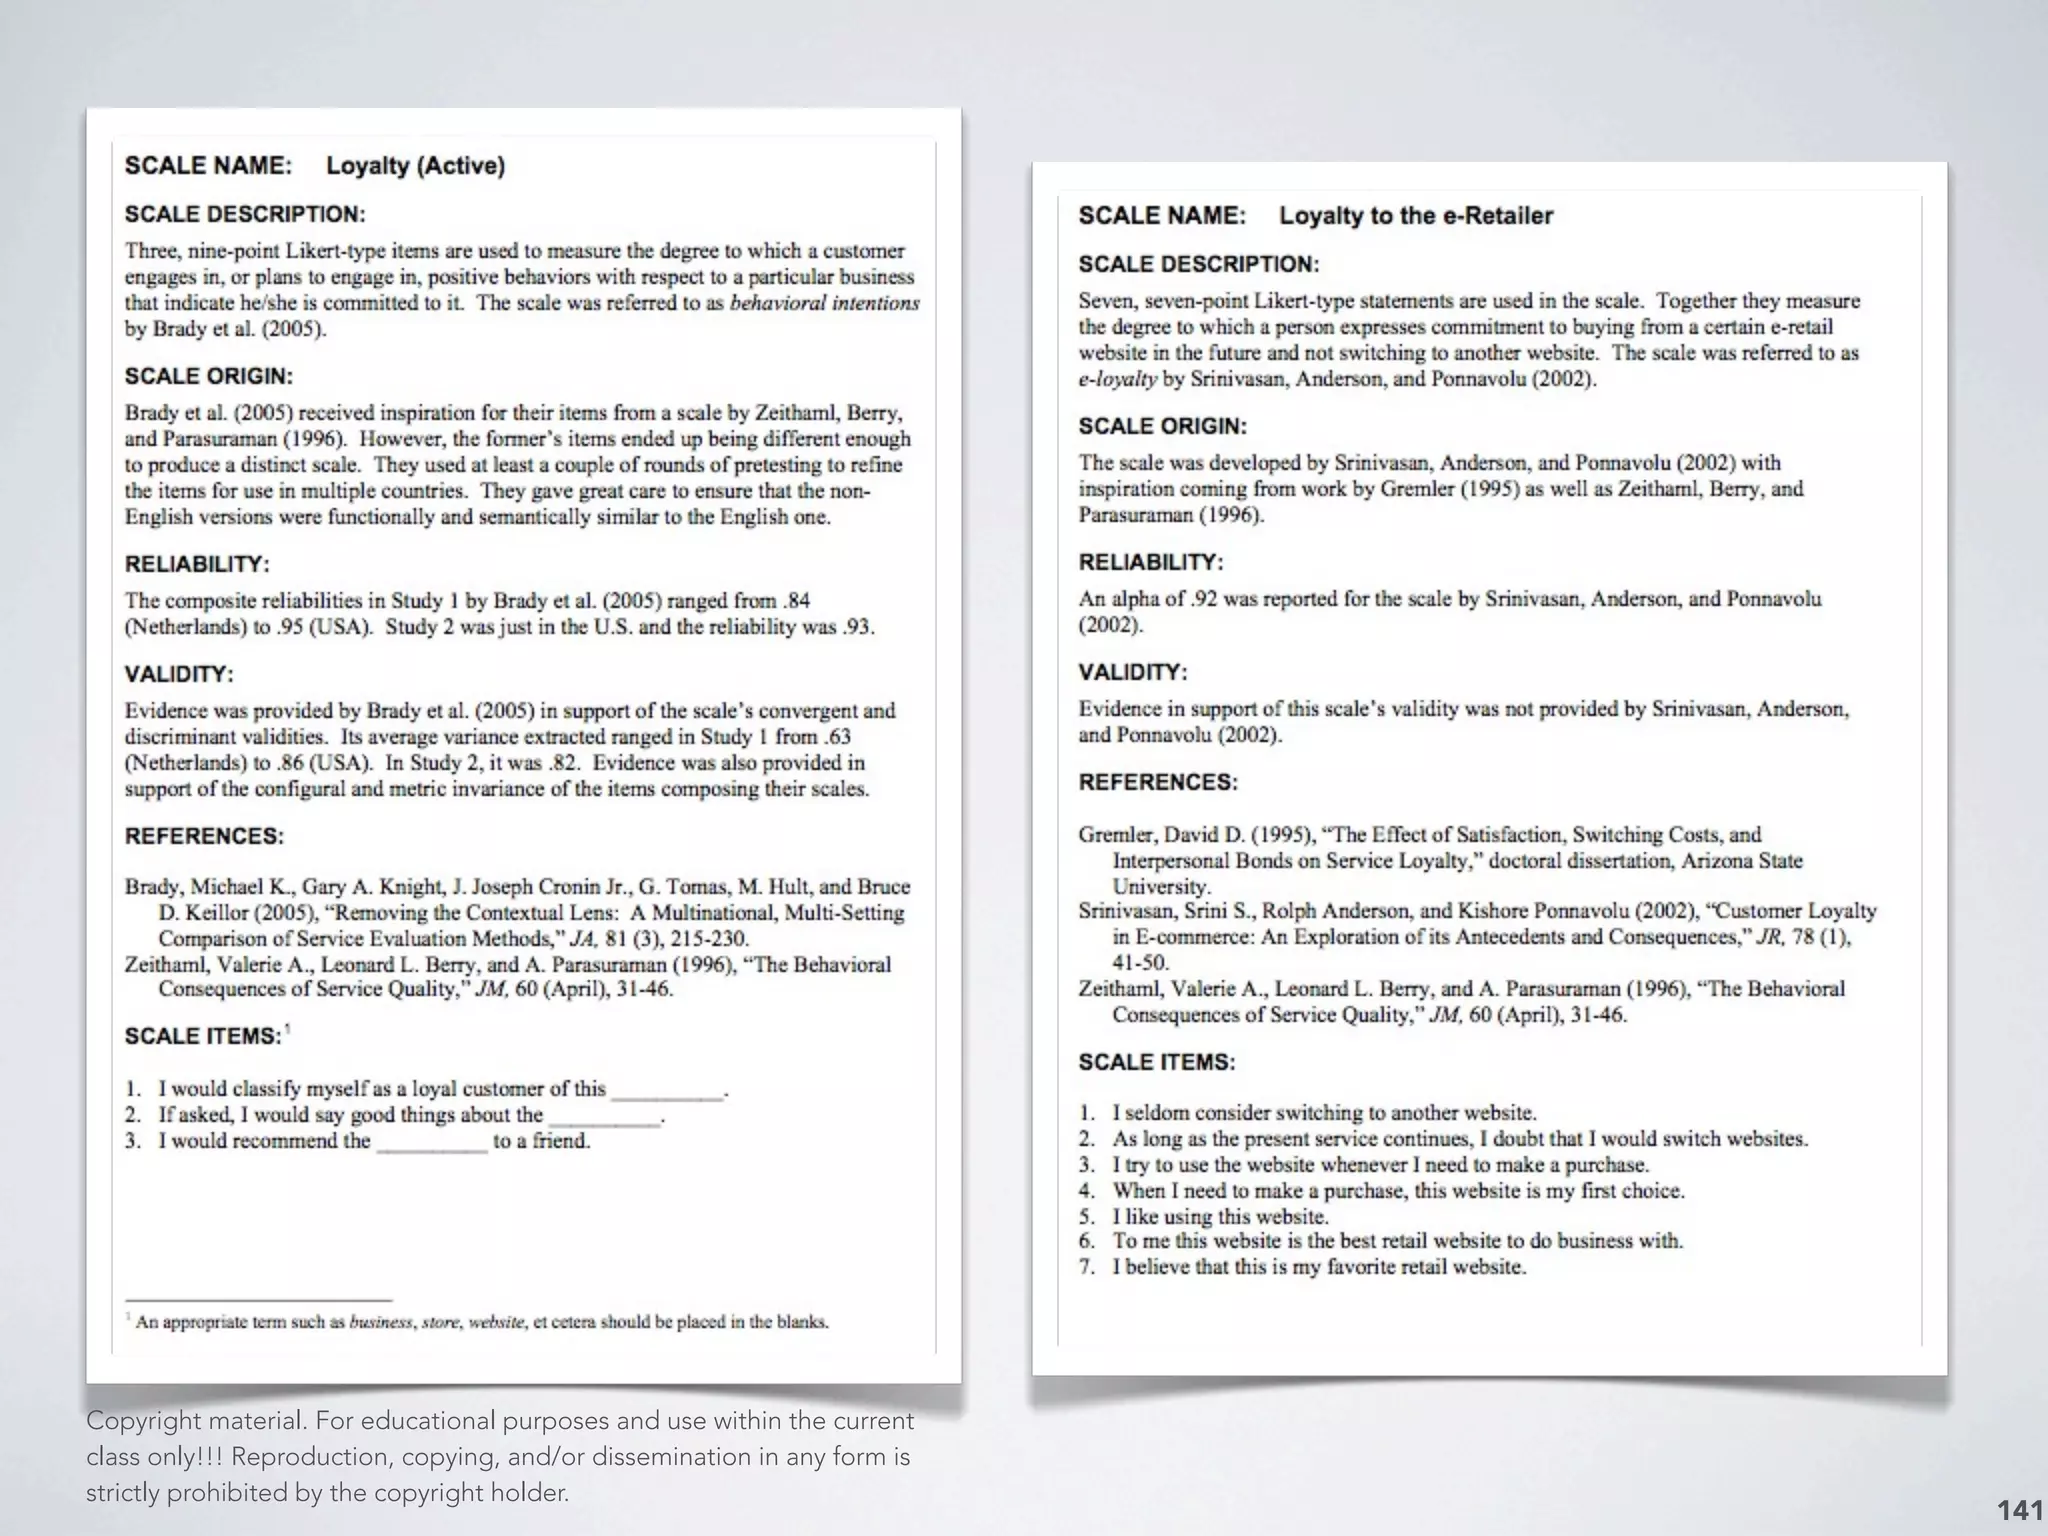
Introduction to survey as a primary data collection technique, including measurement and scaling techniques.
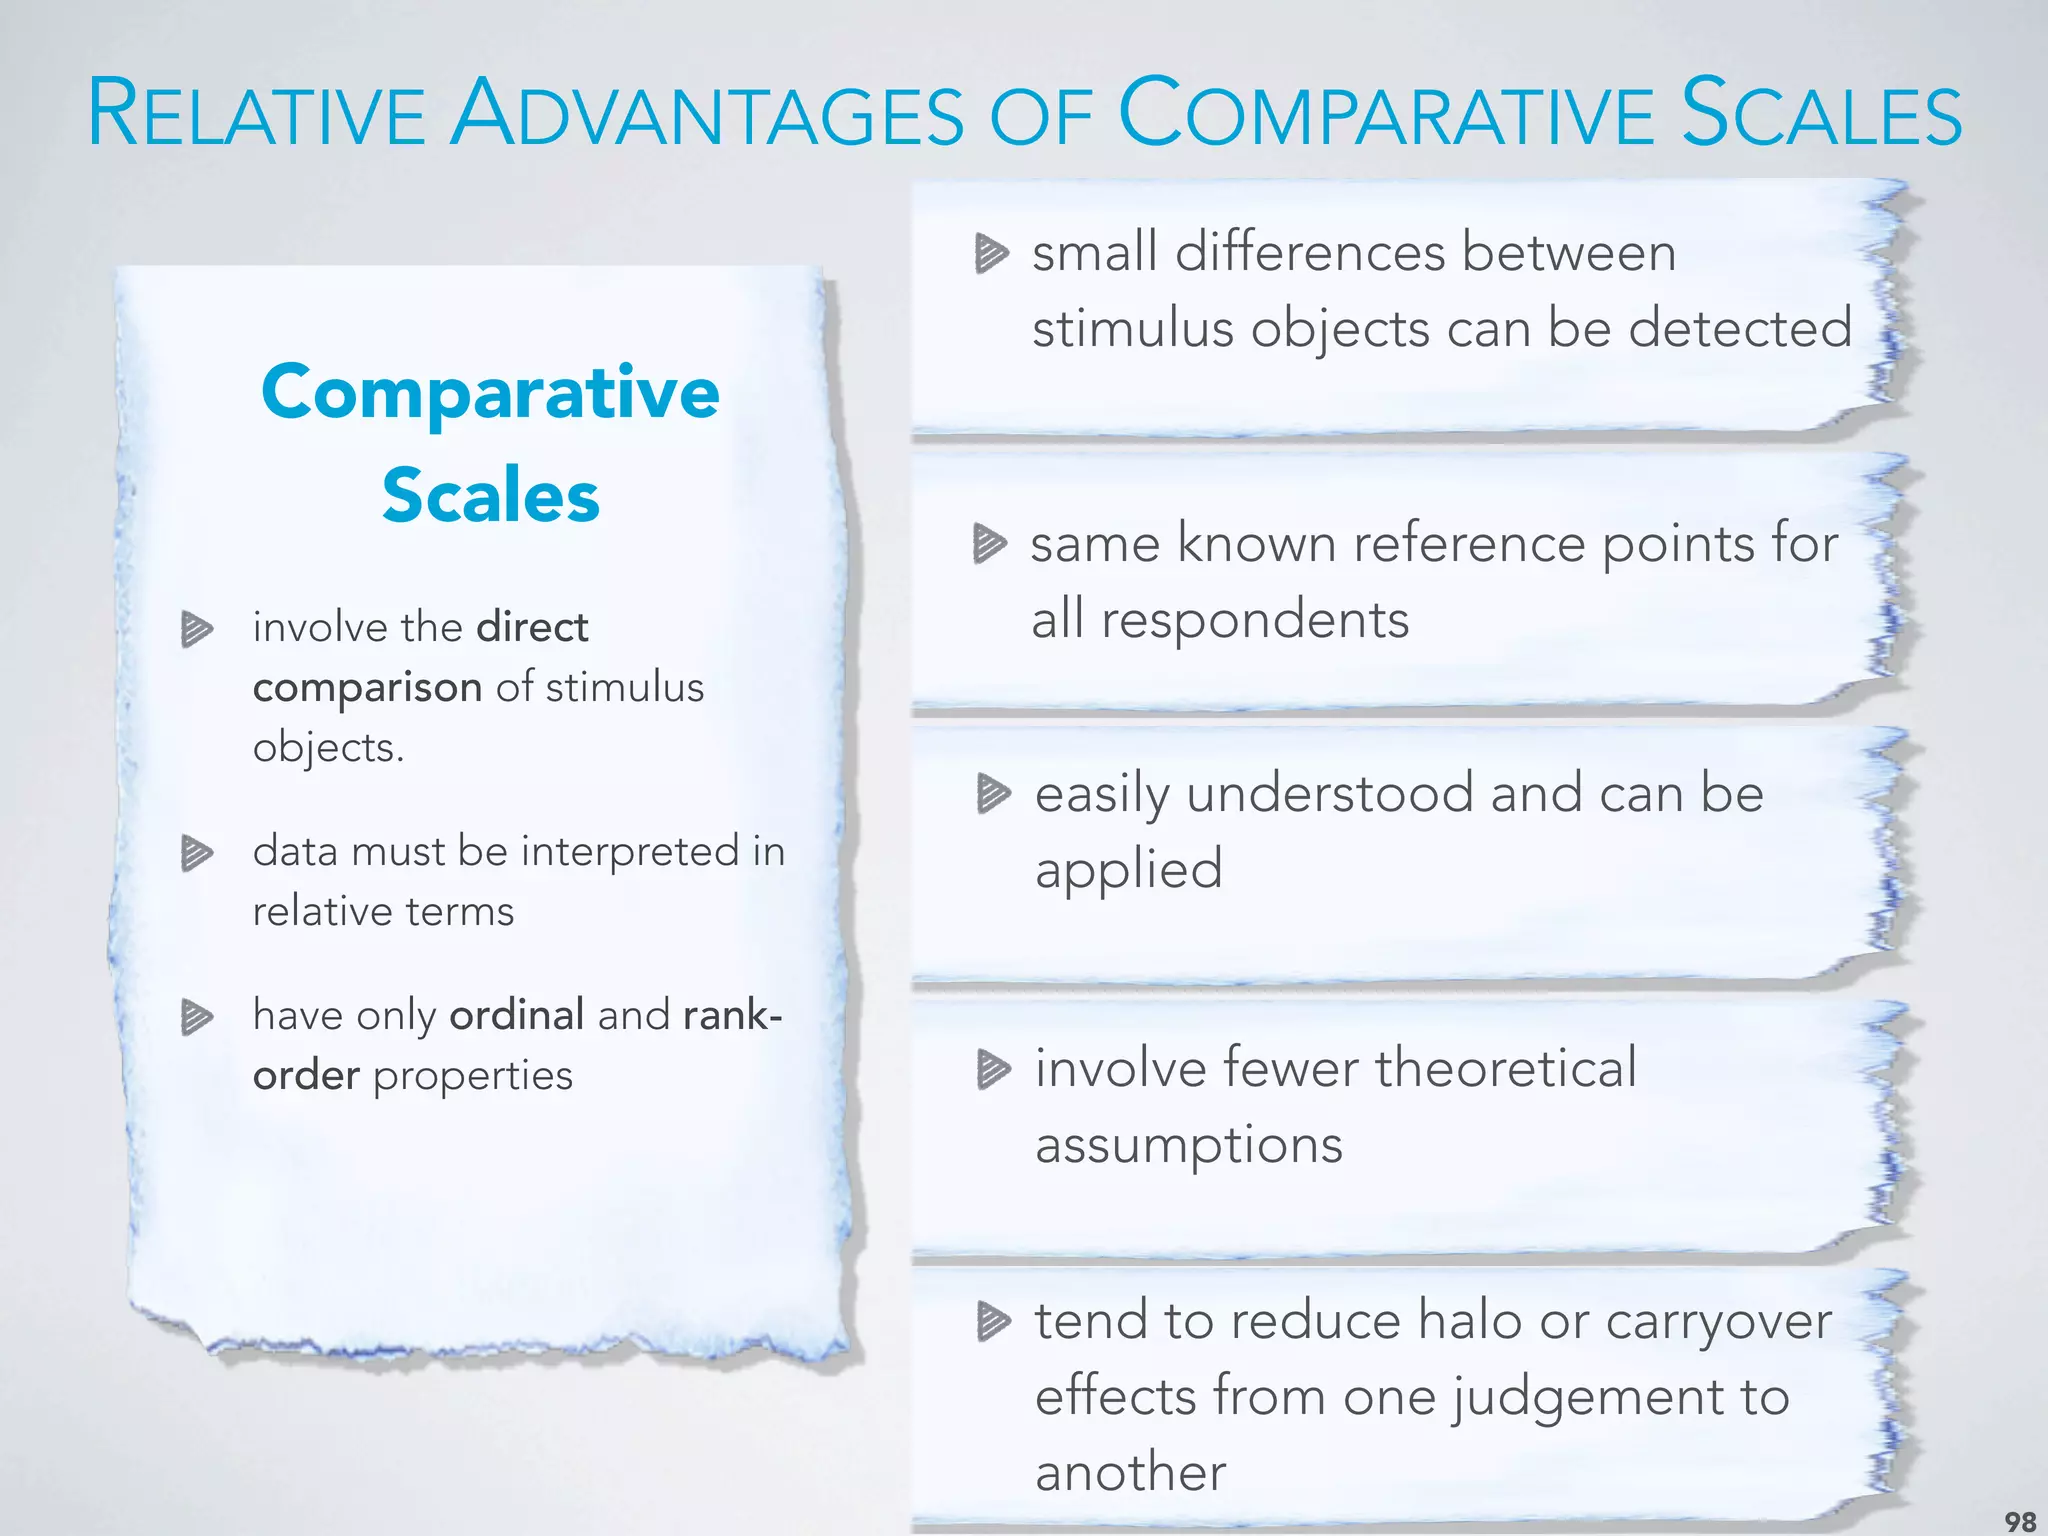
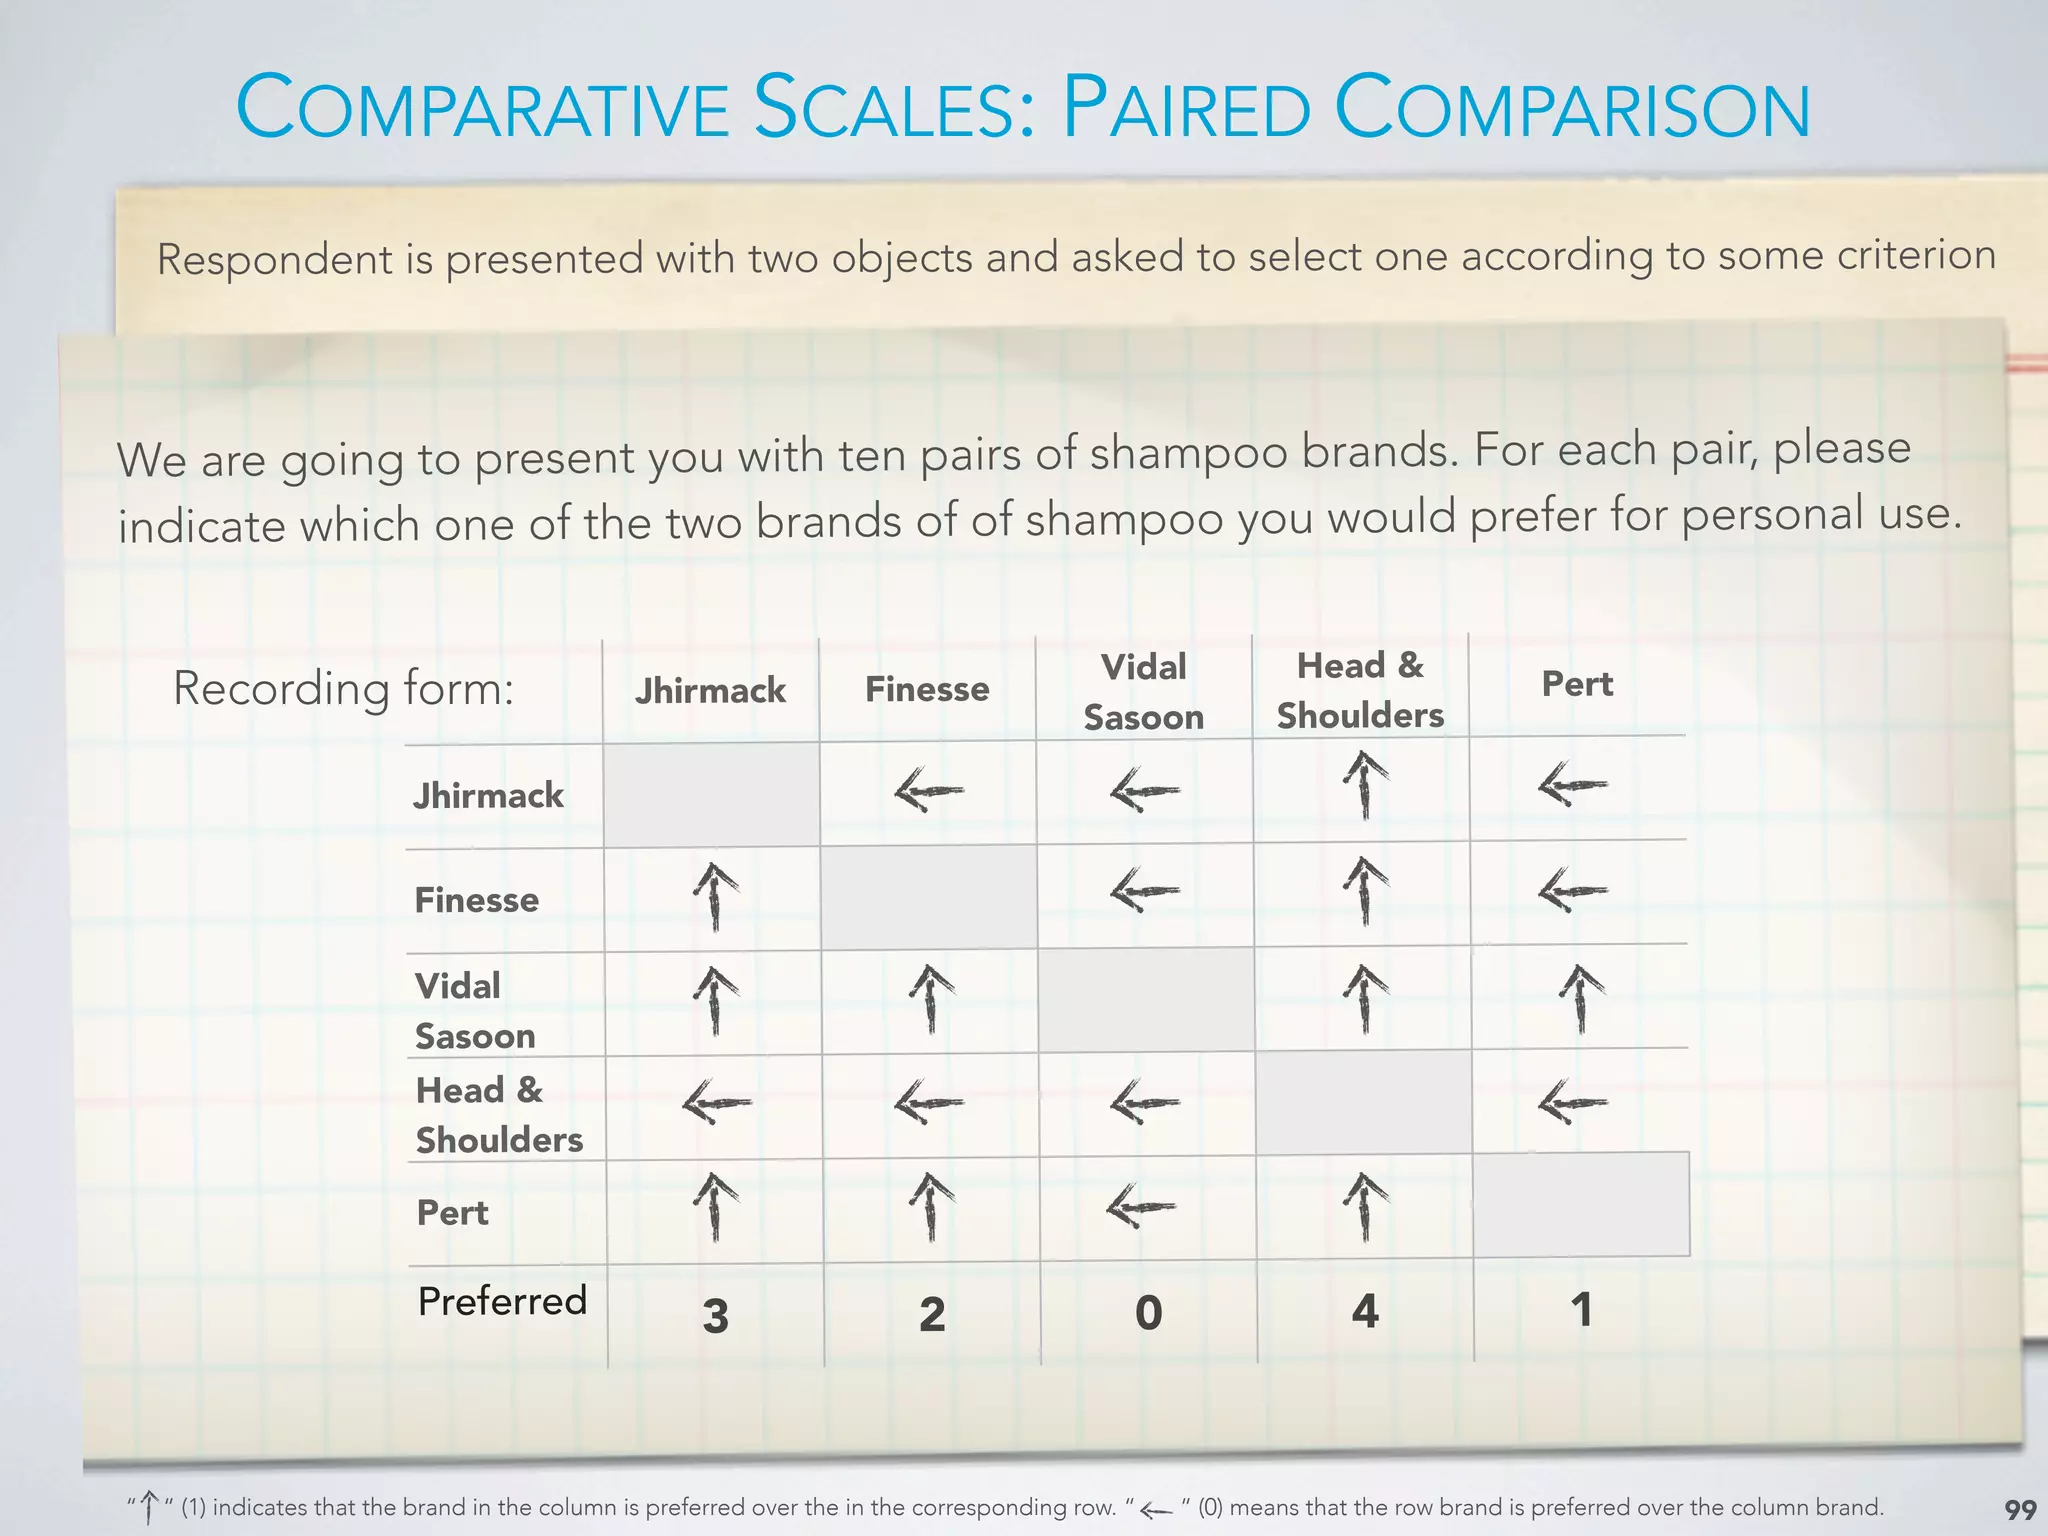
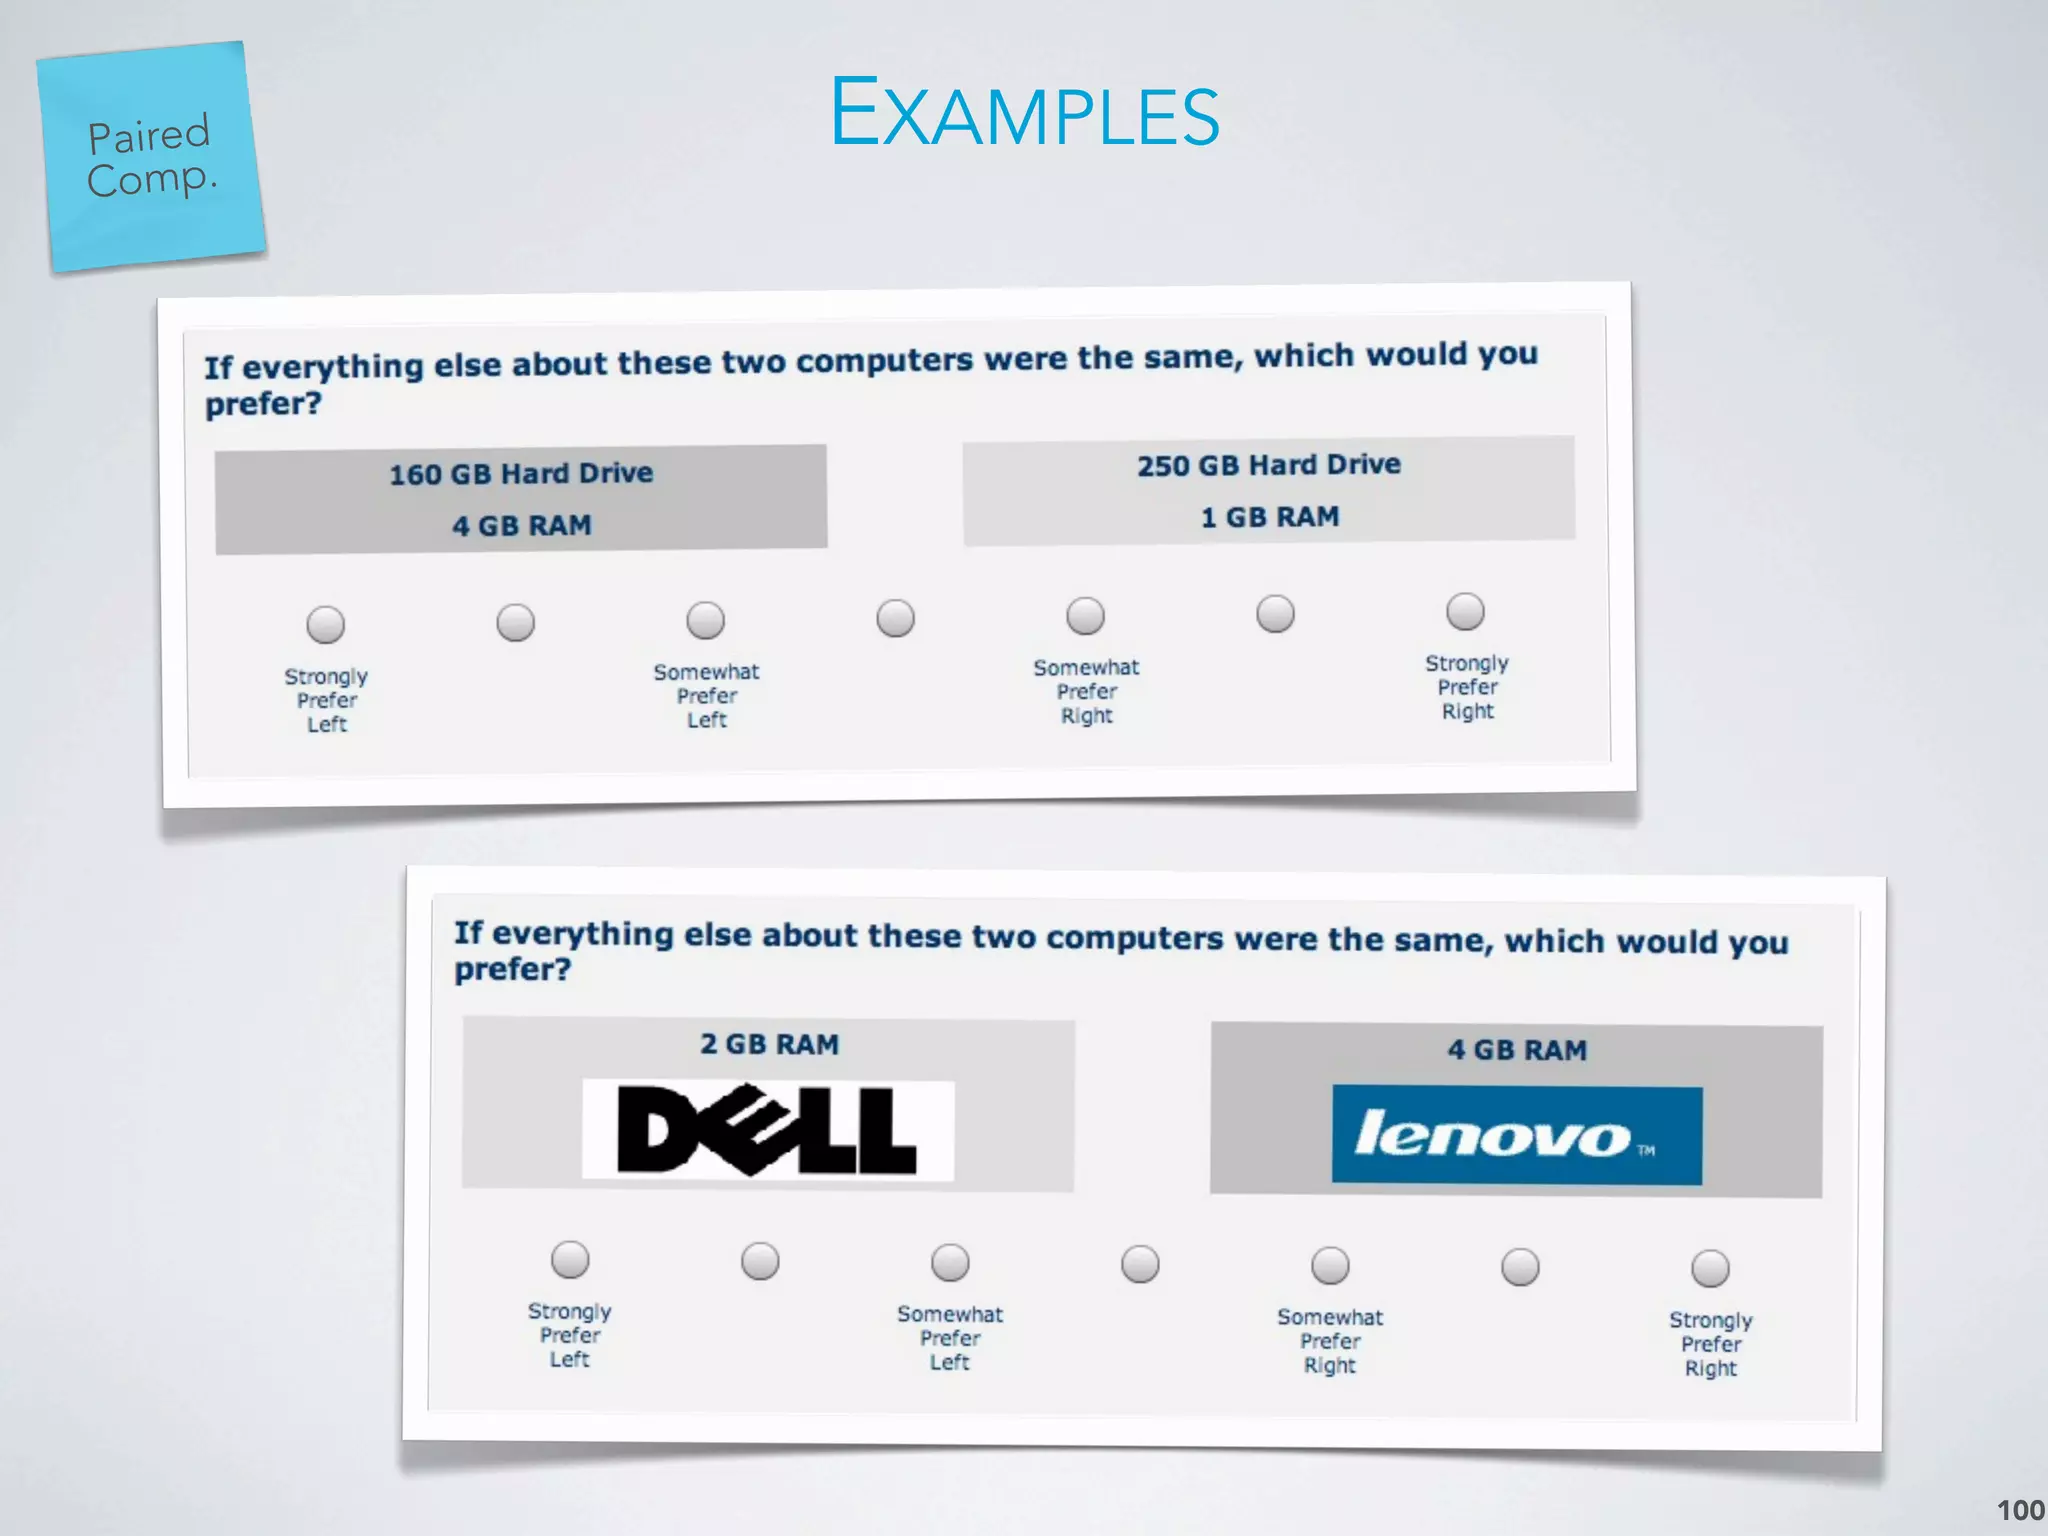
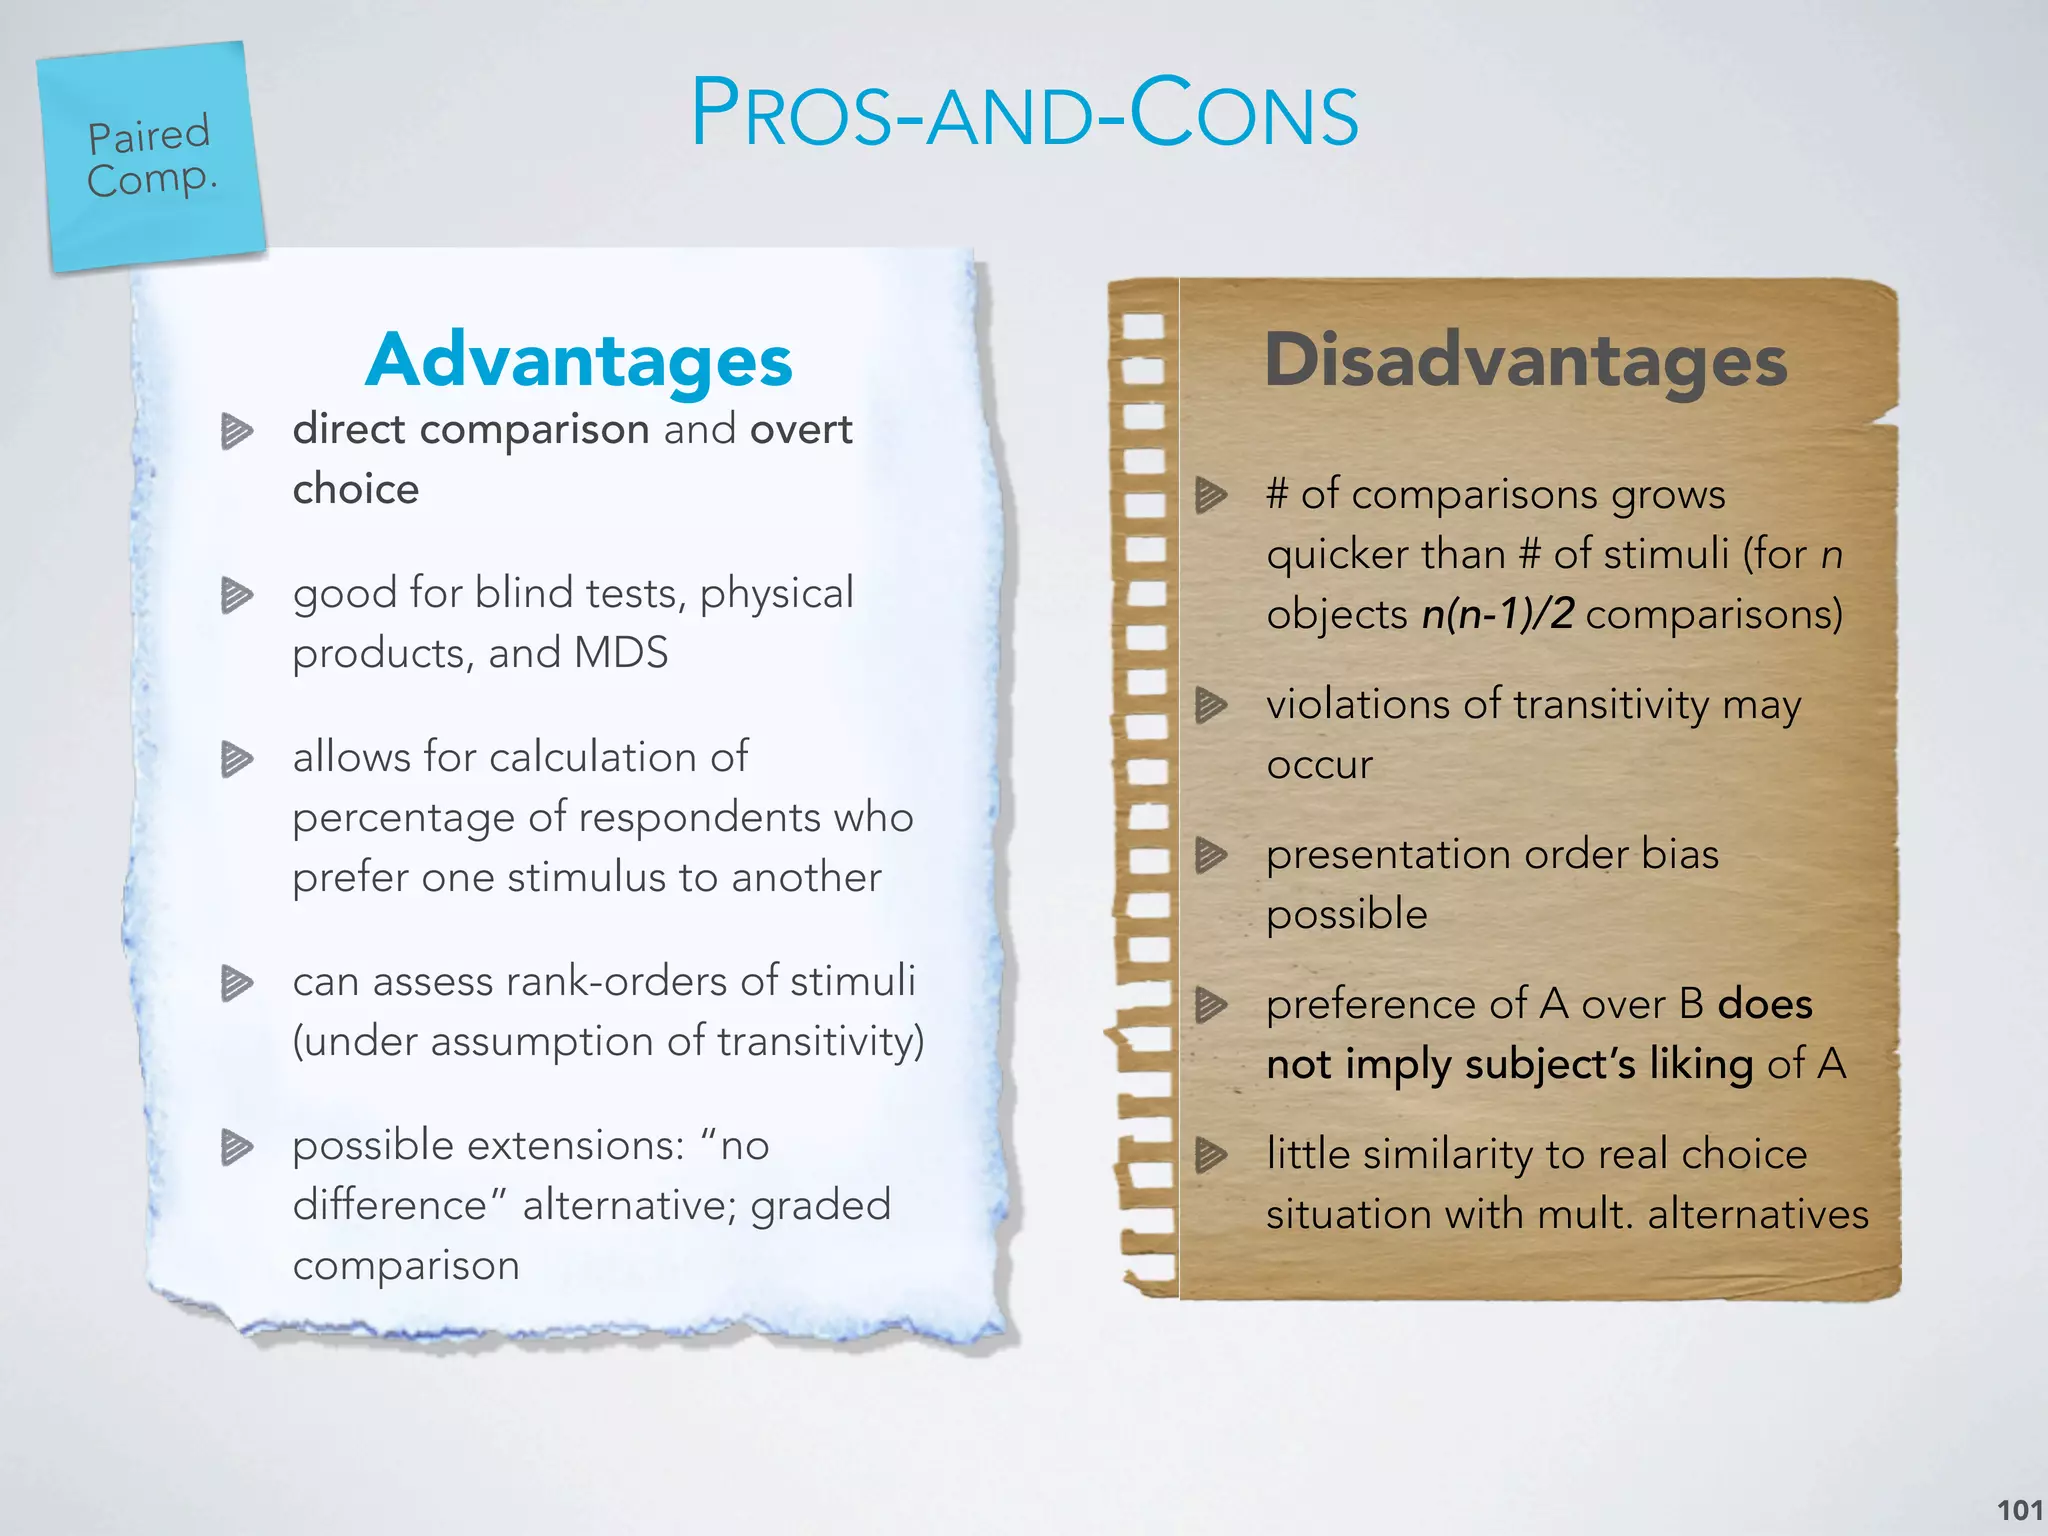
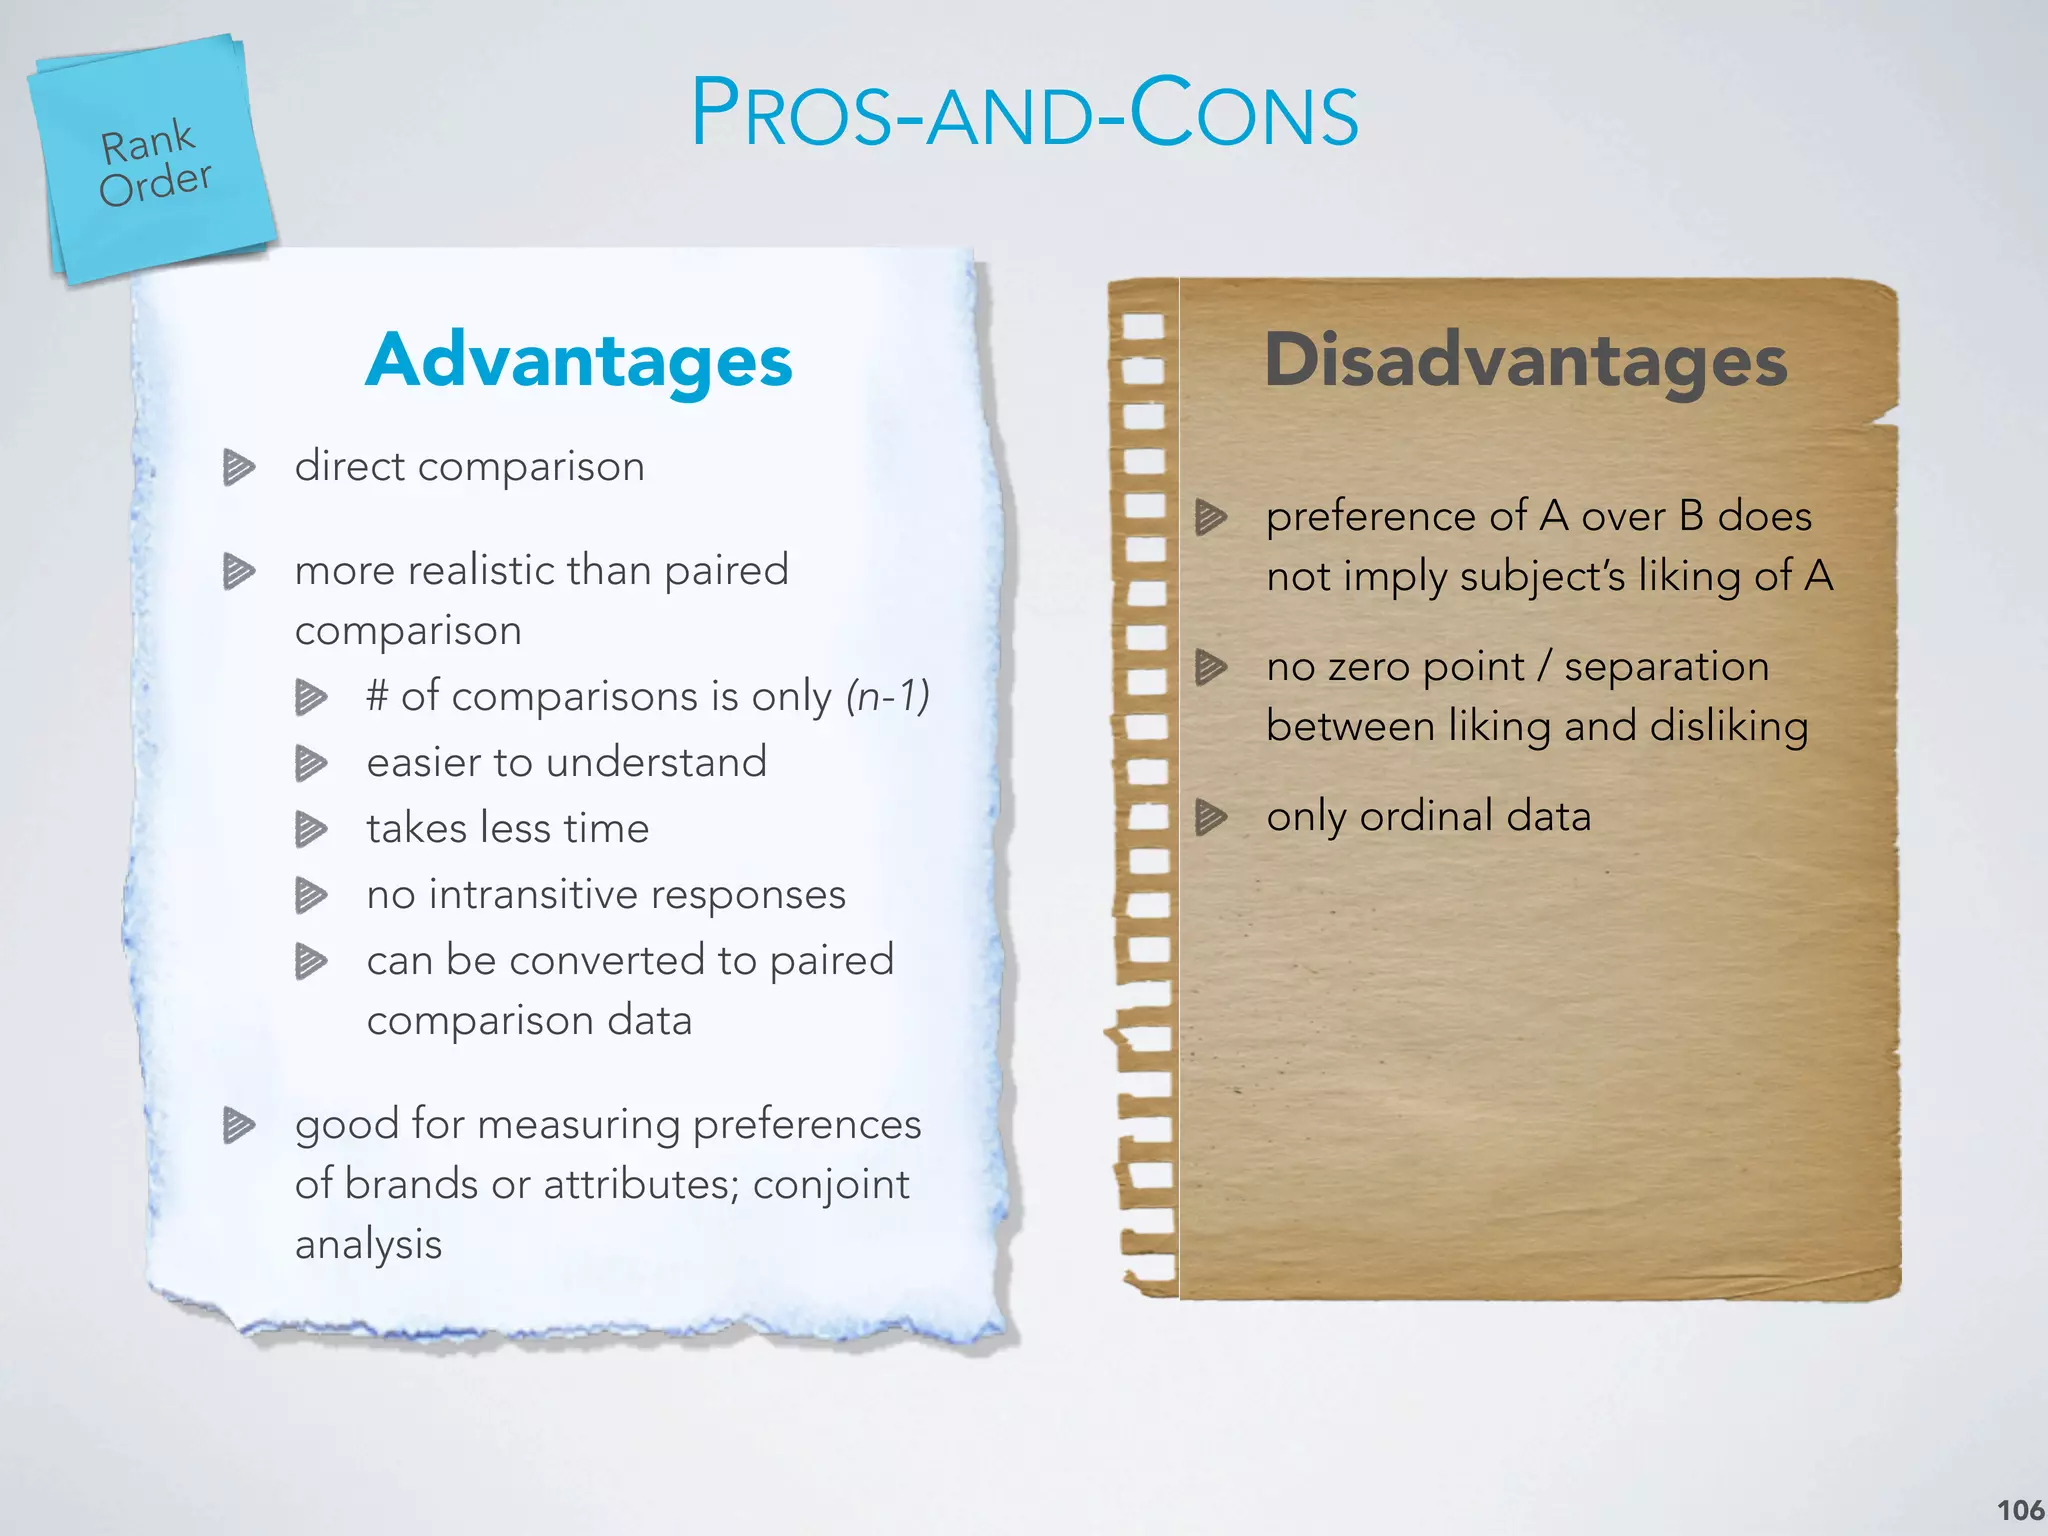
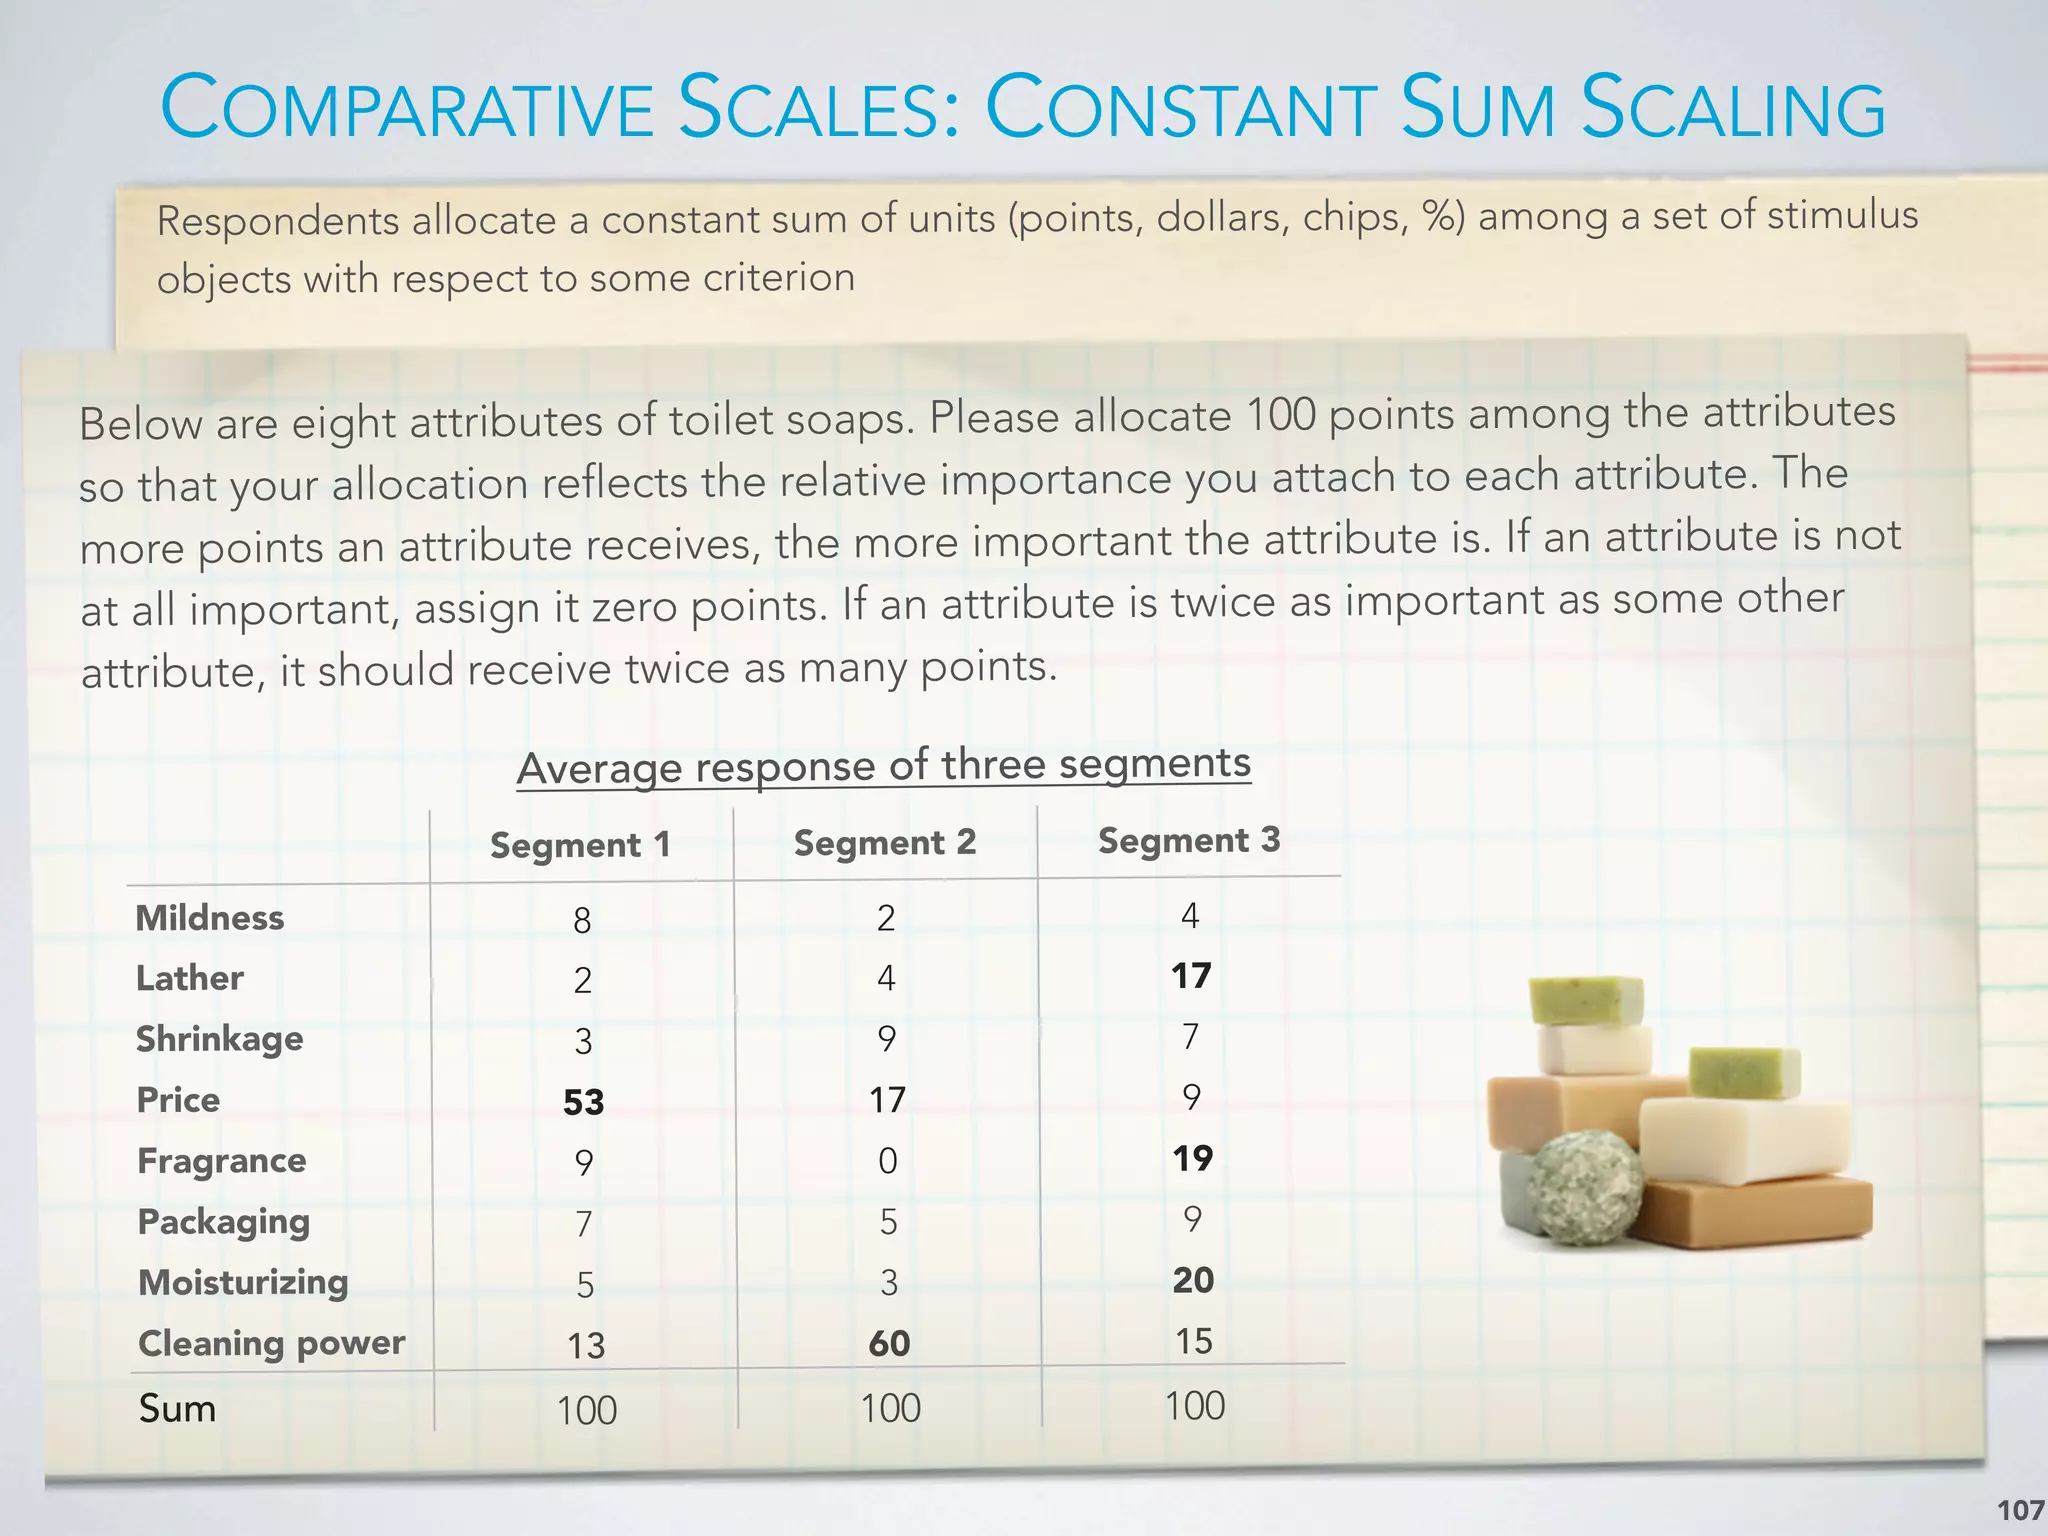
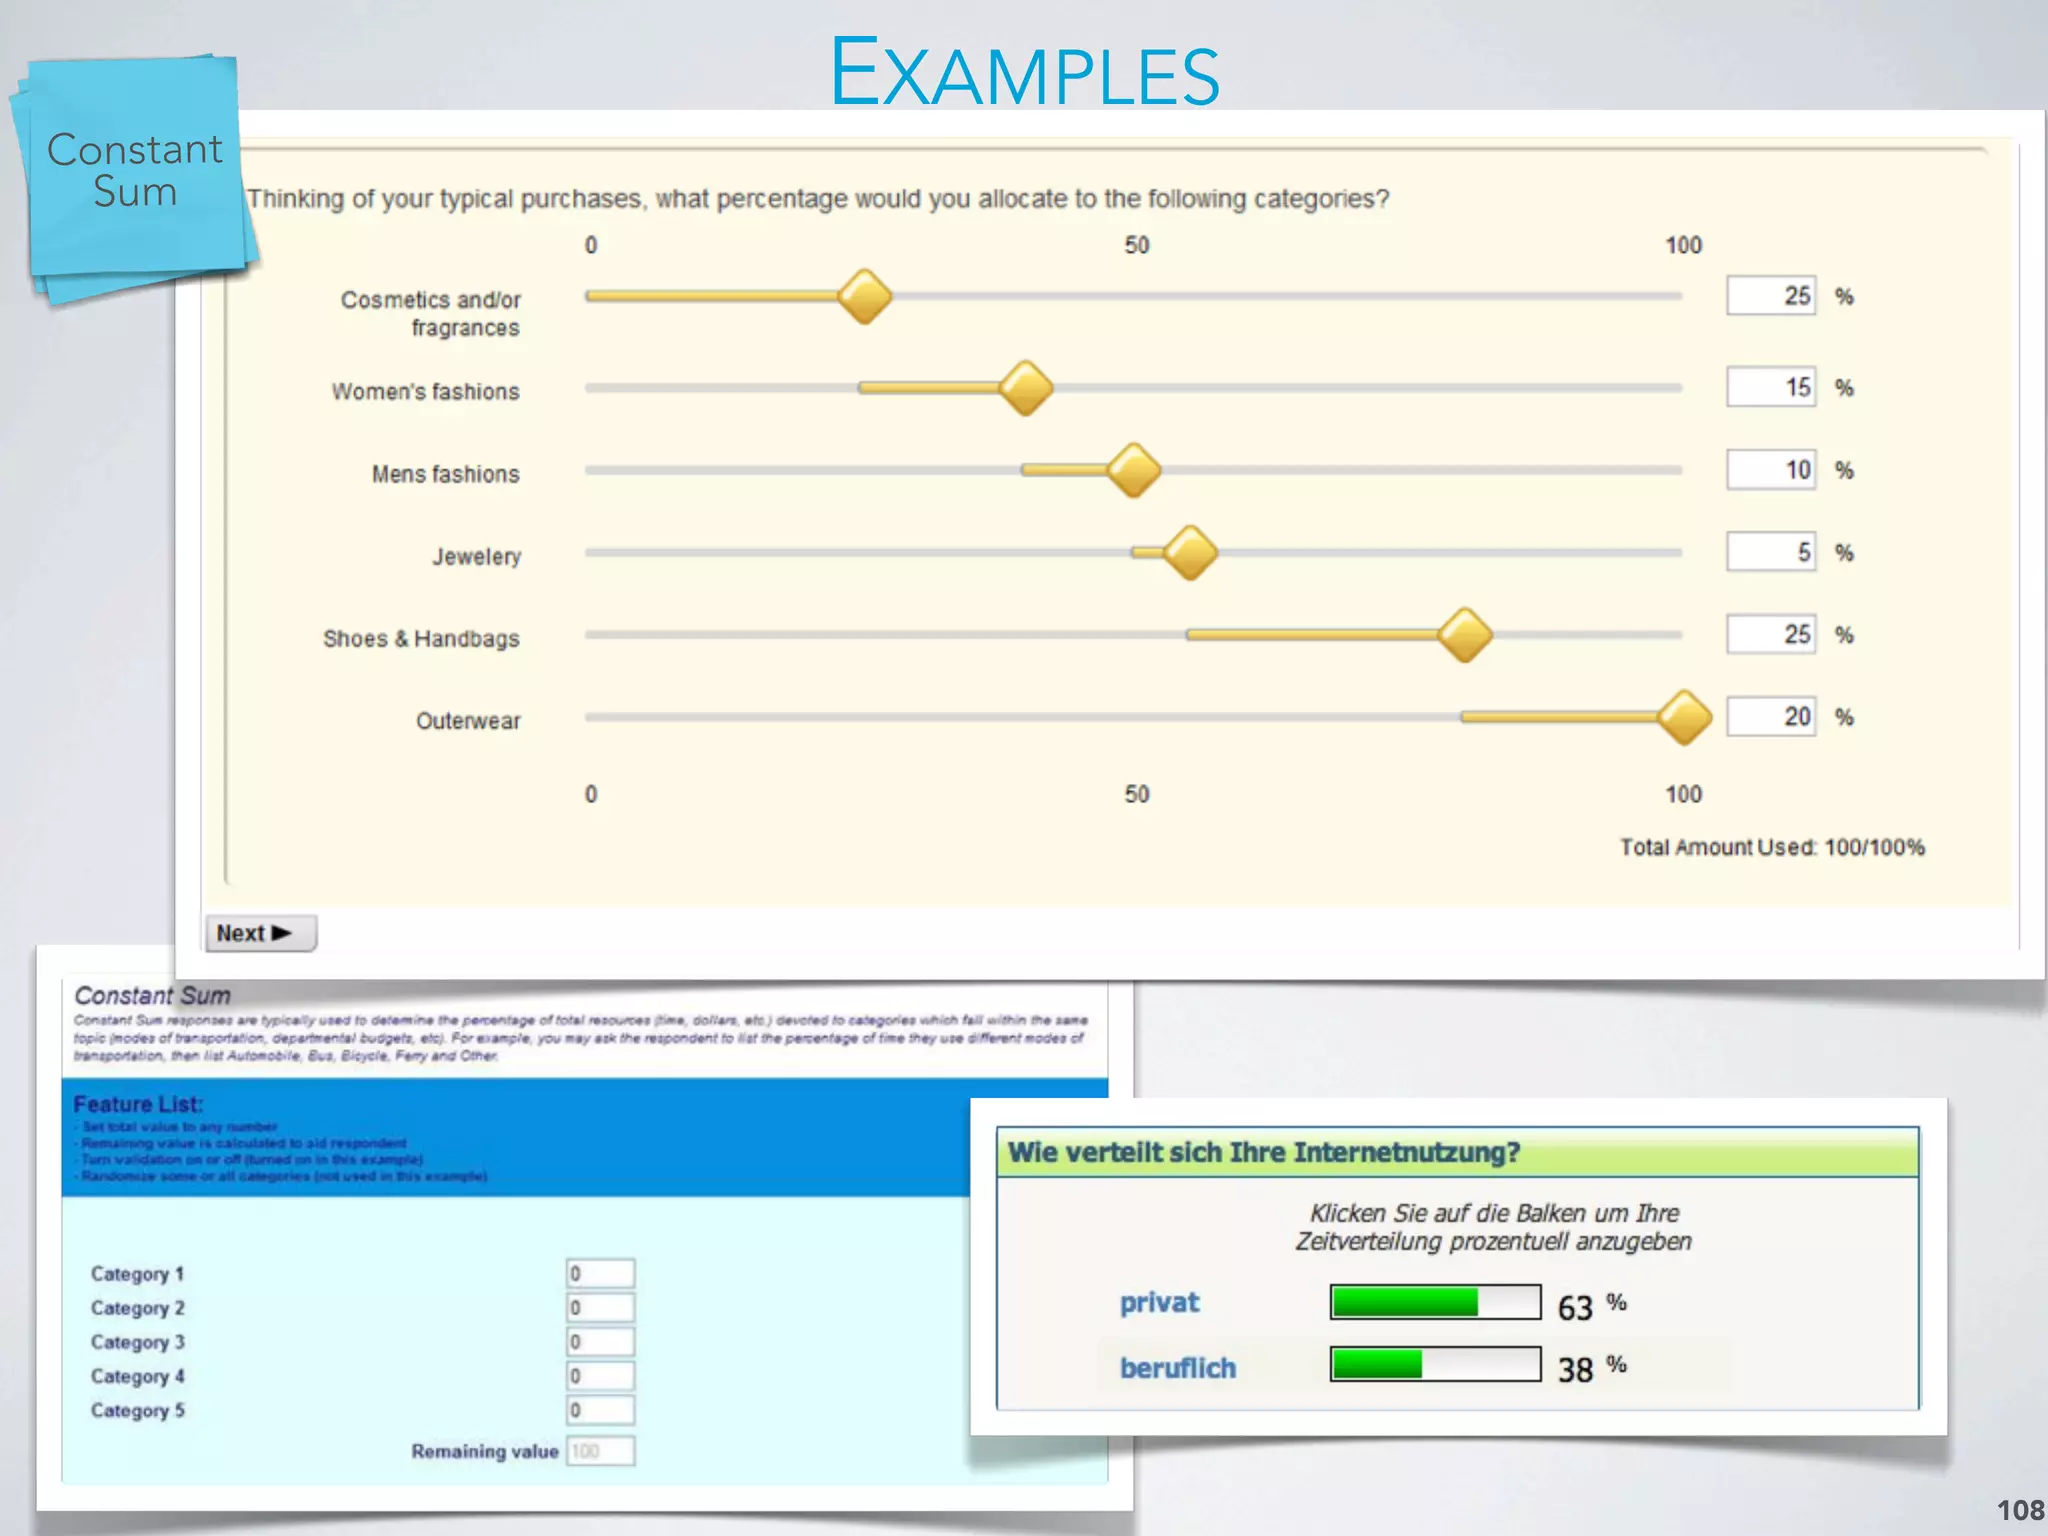
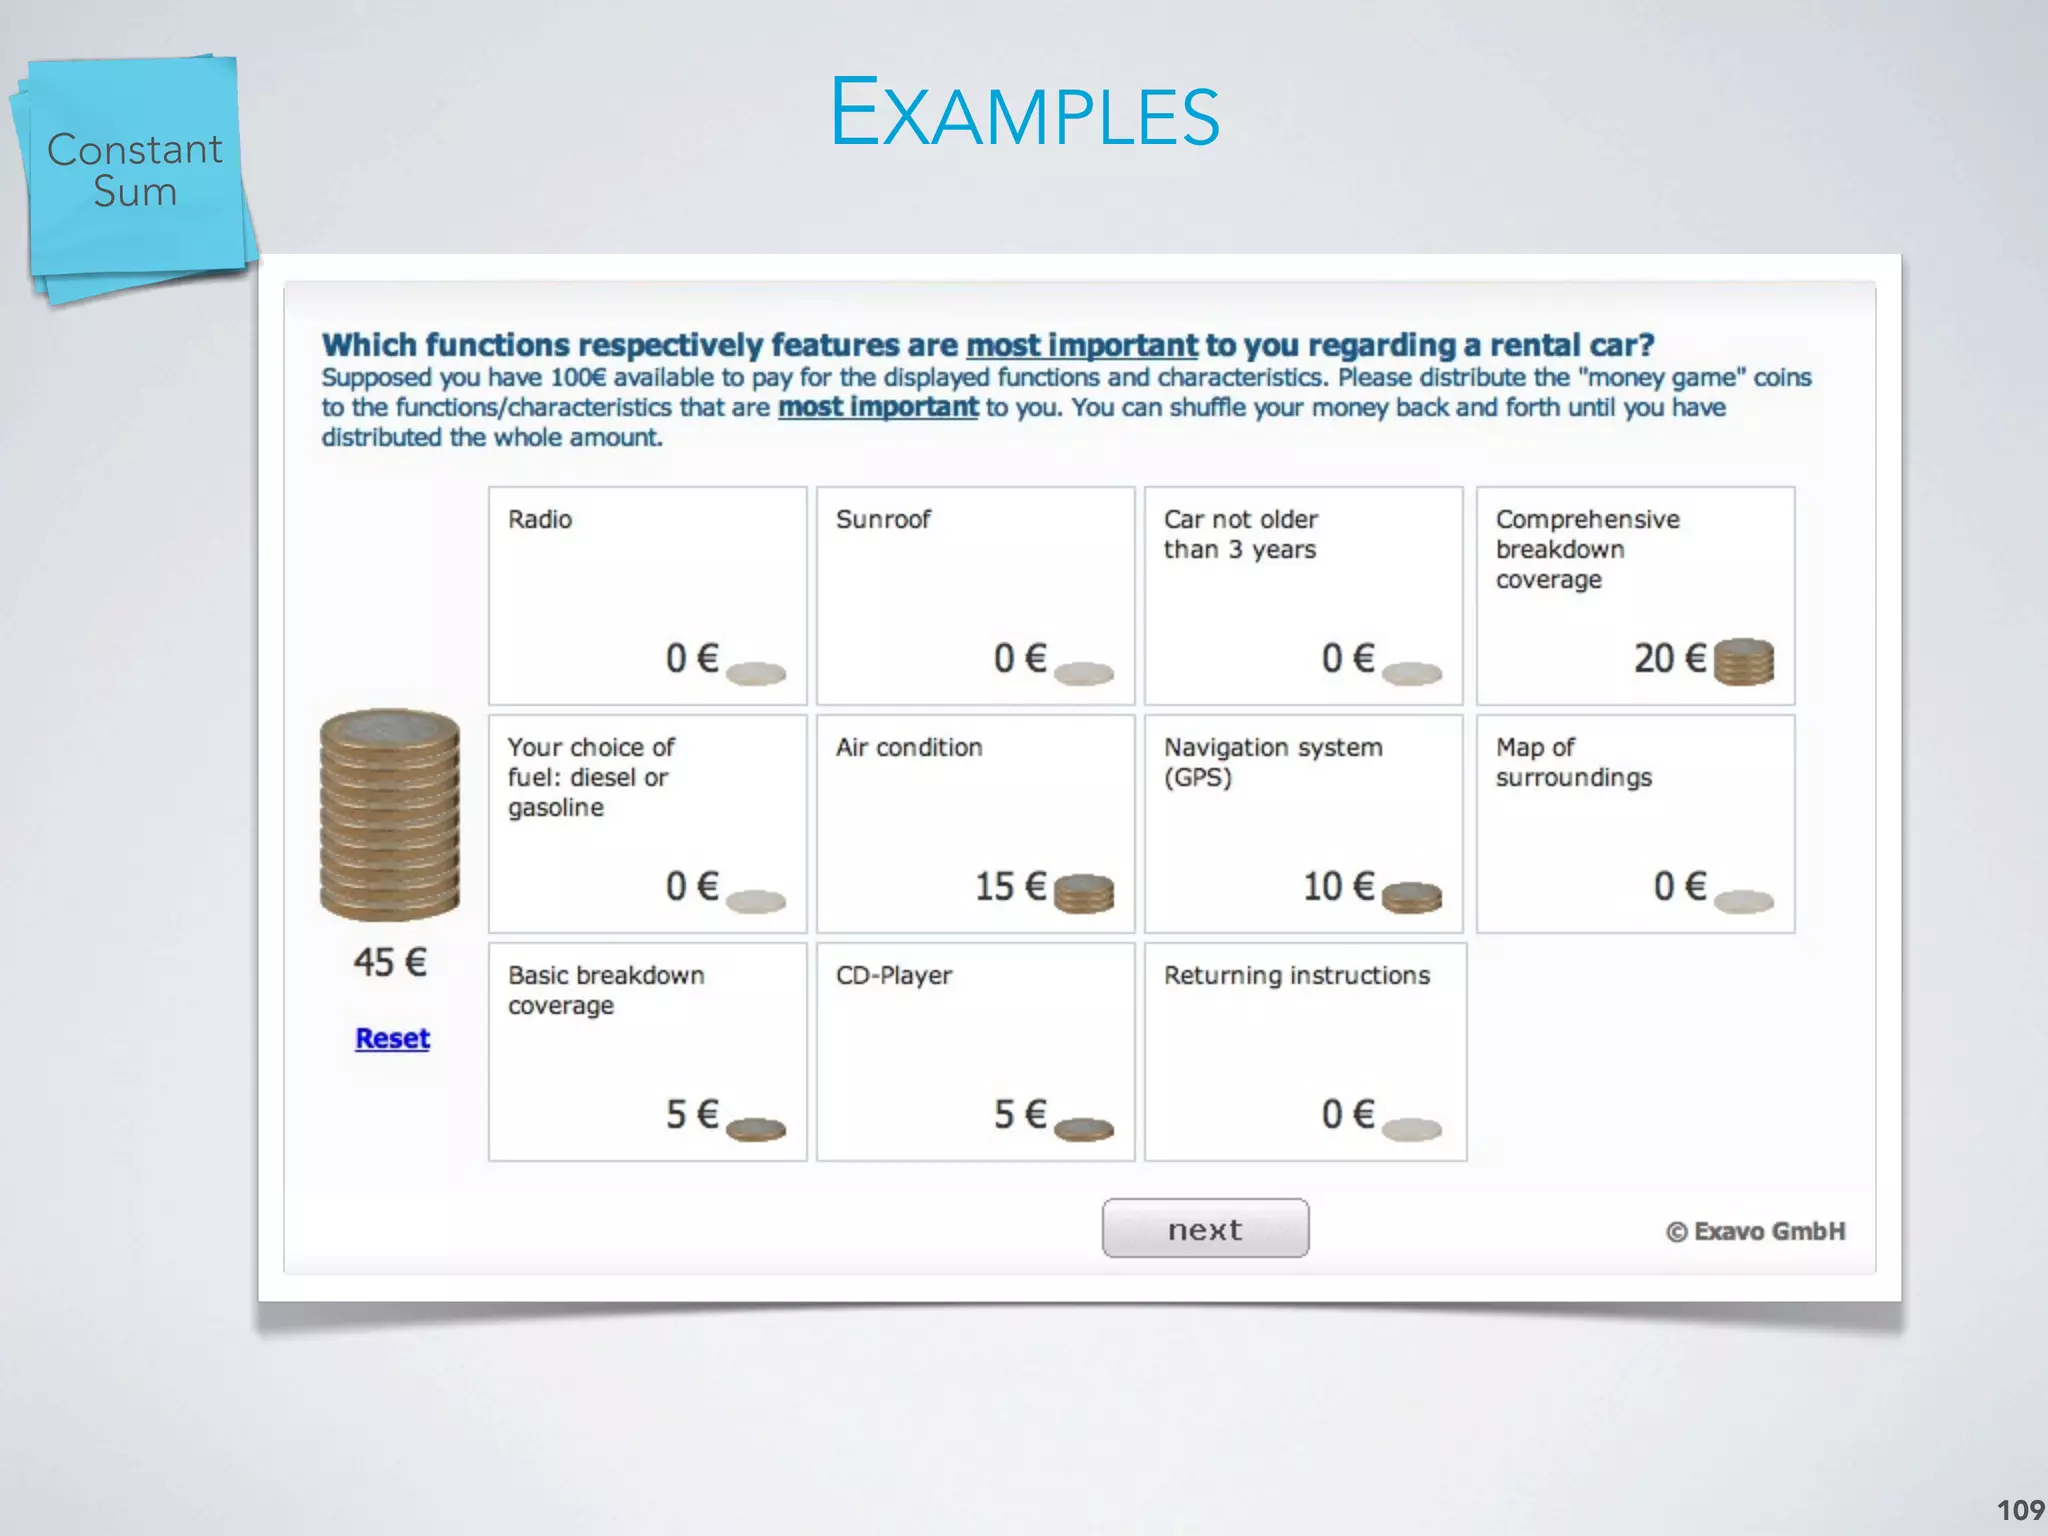
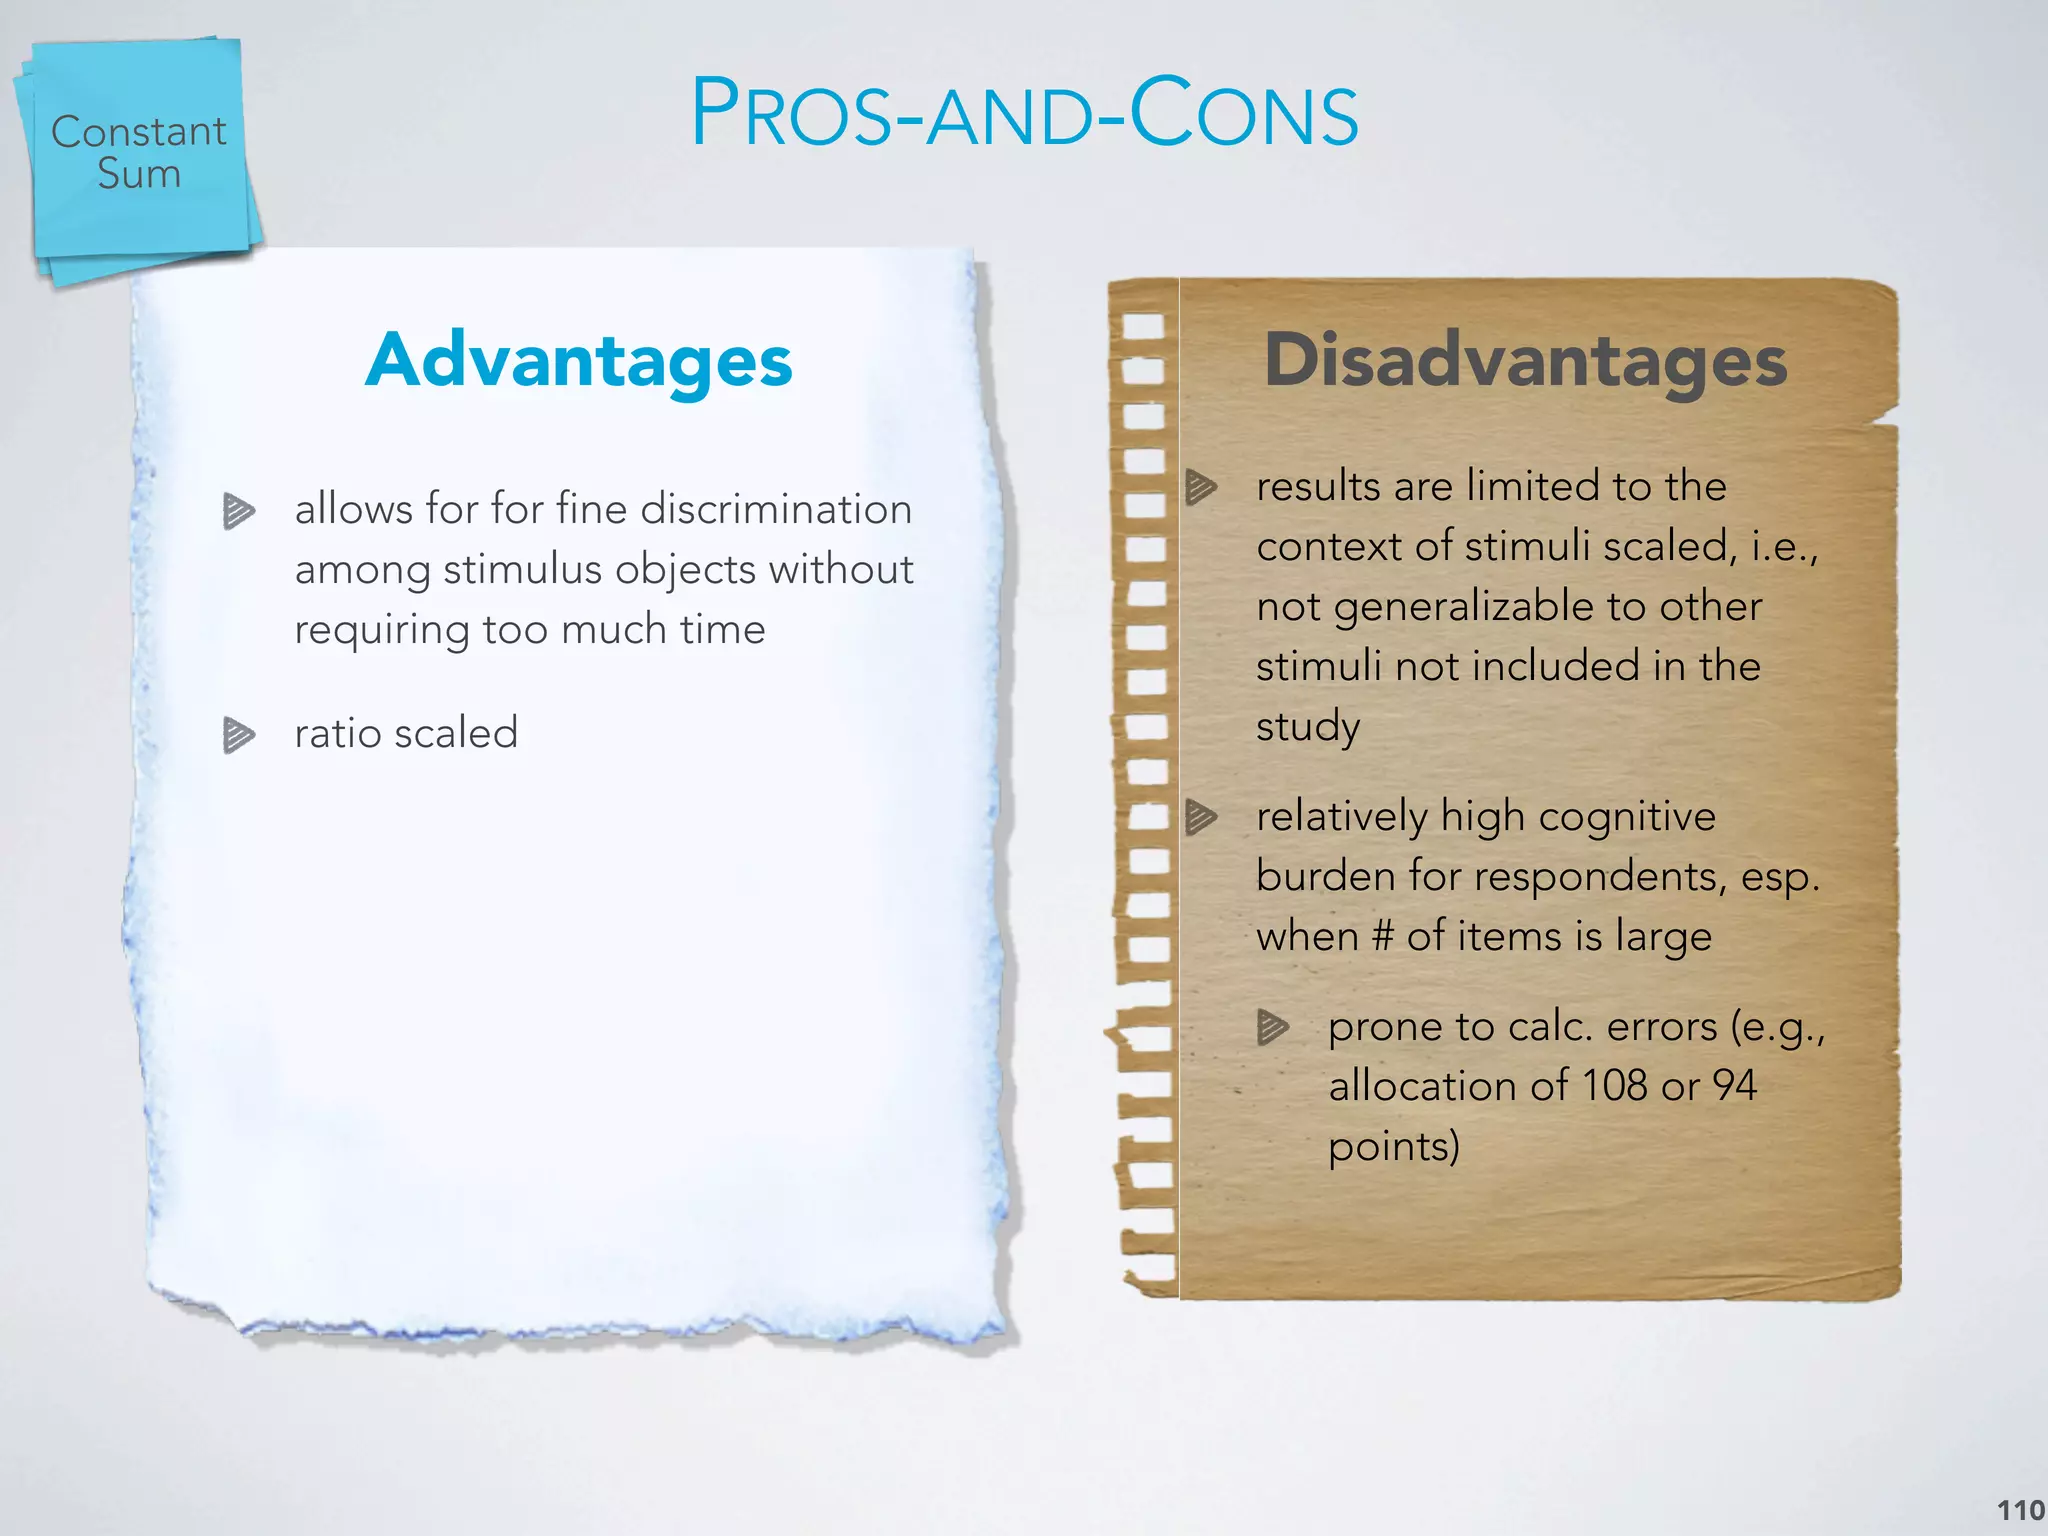
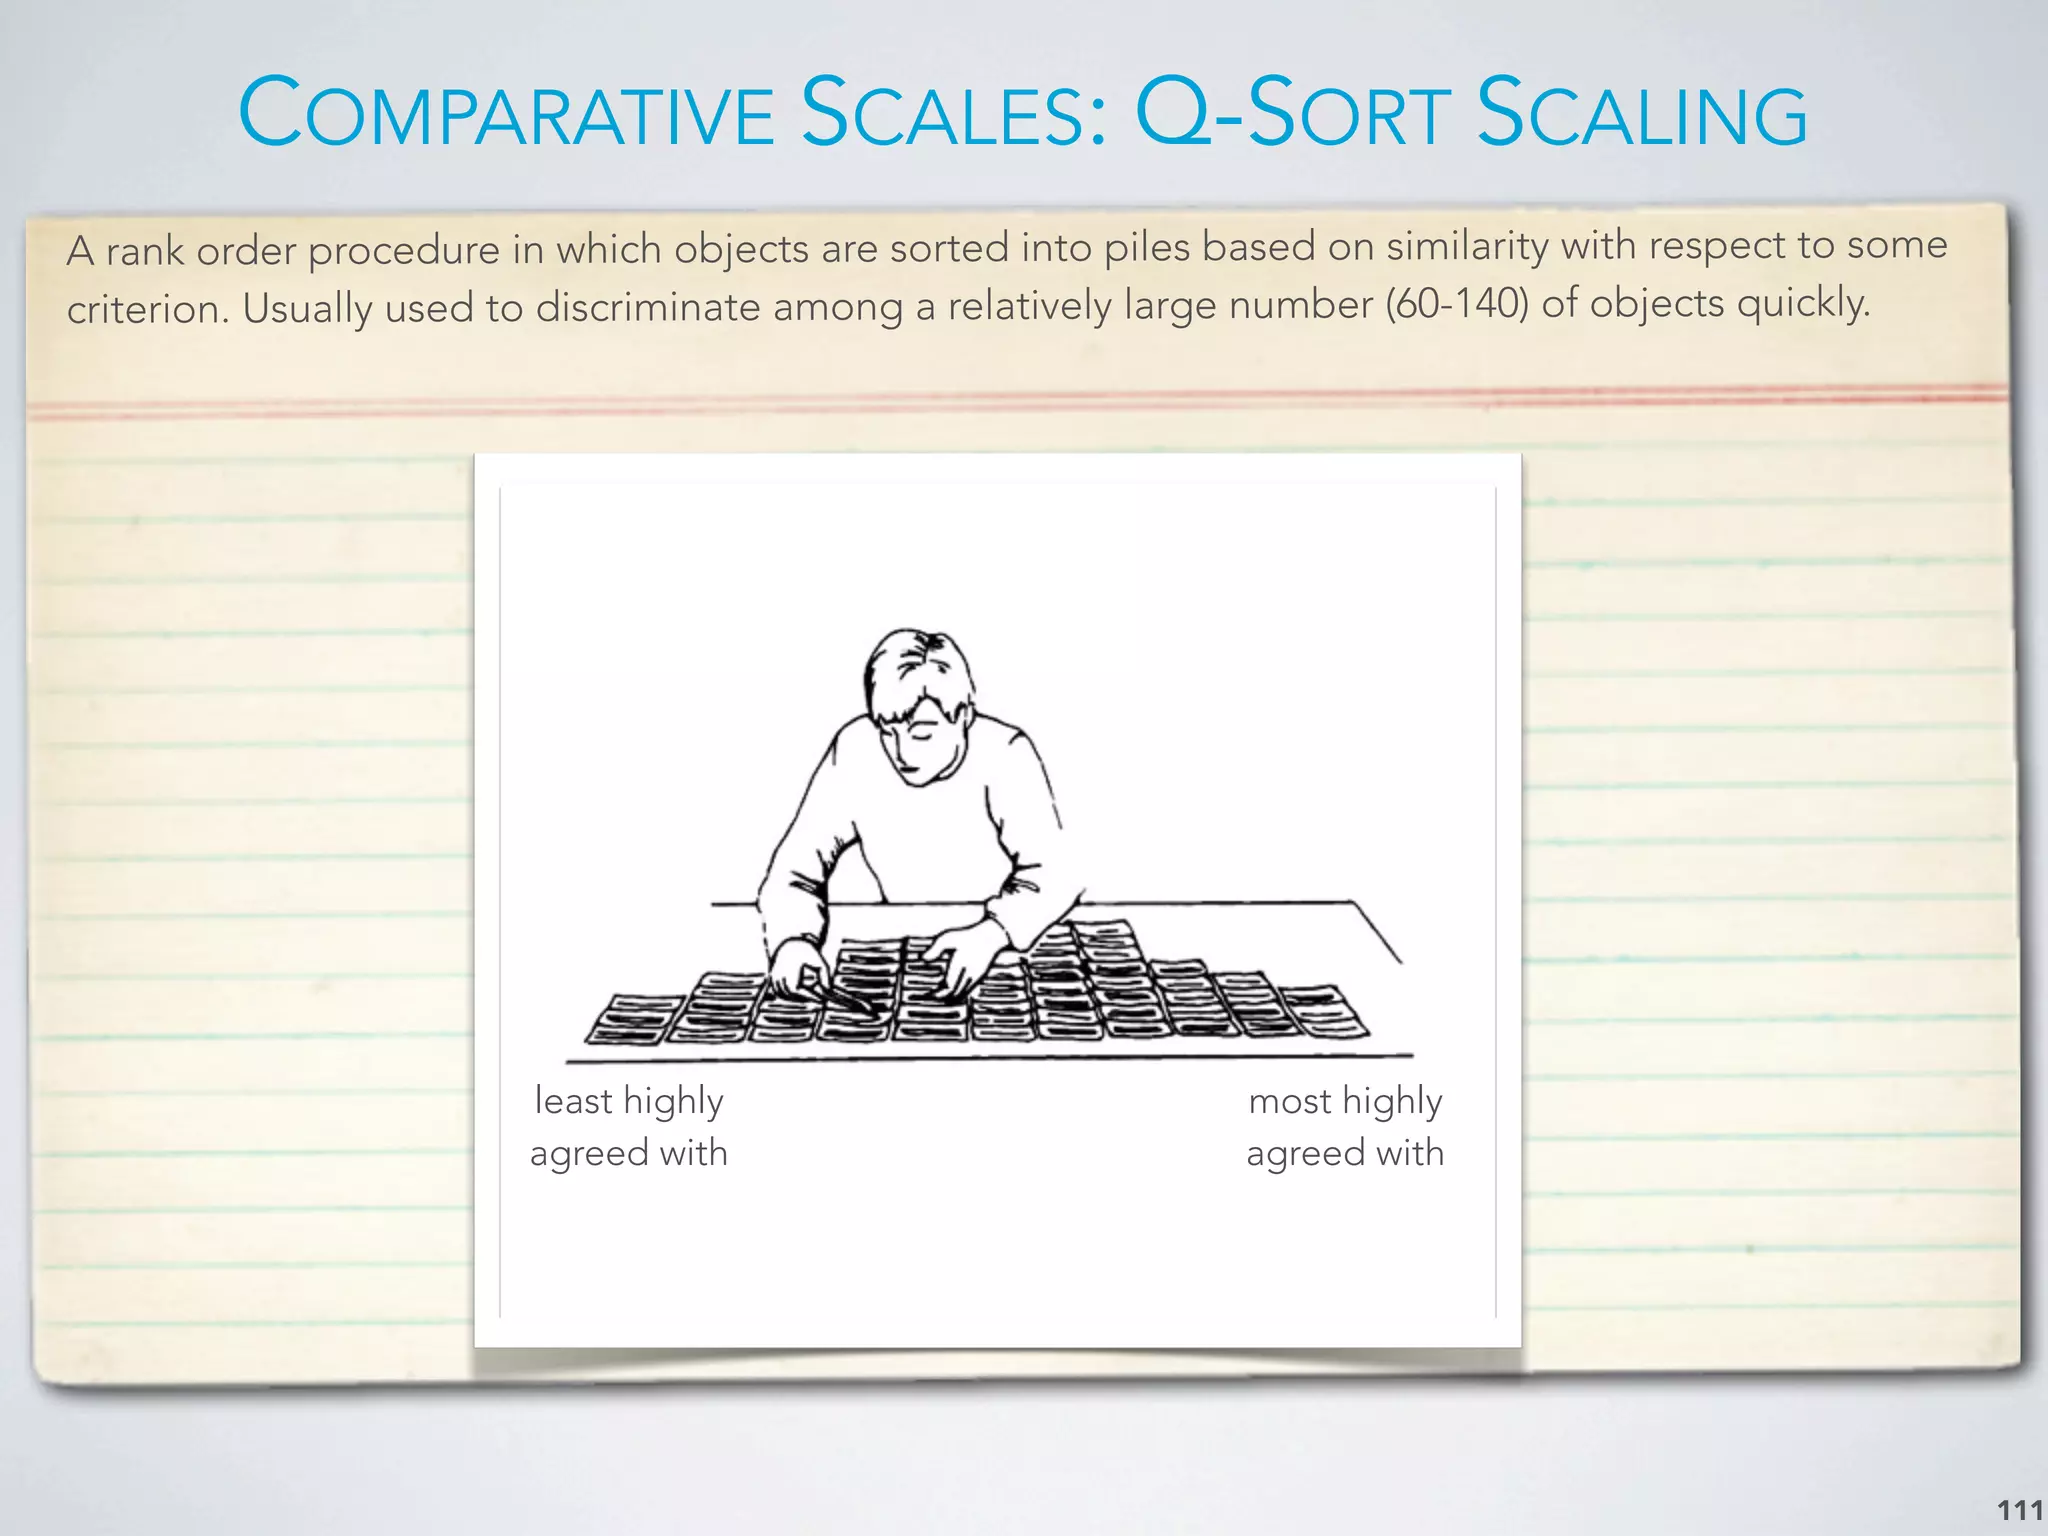
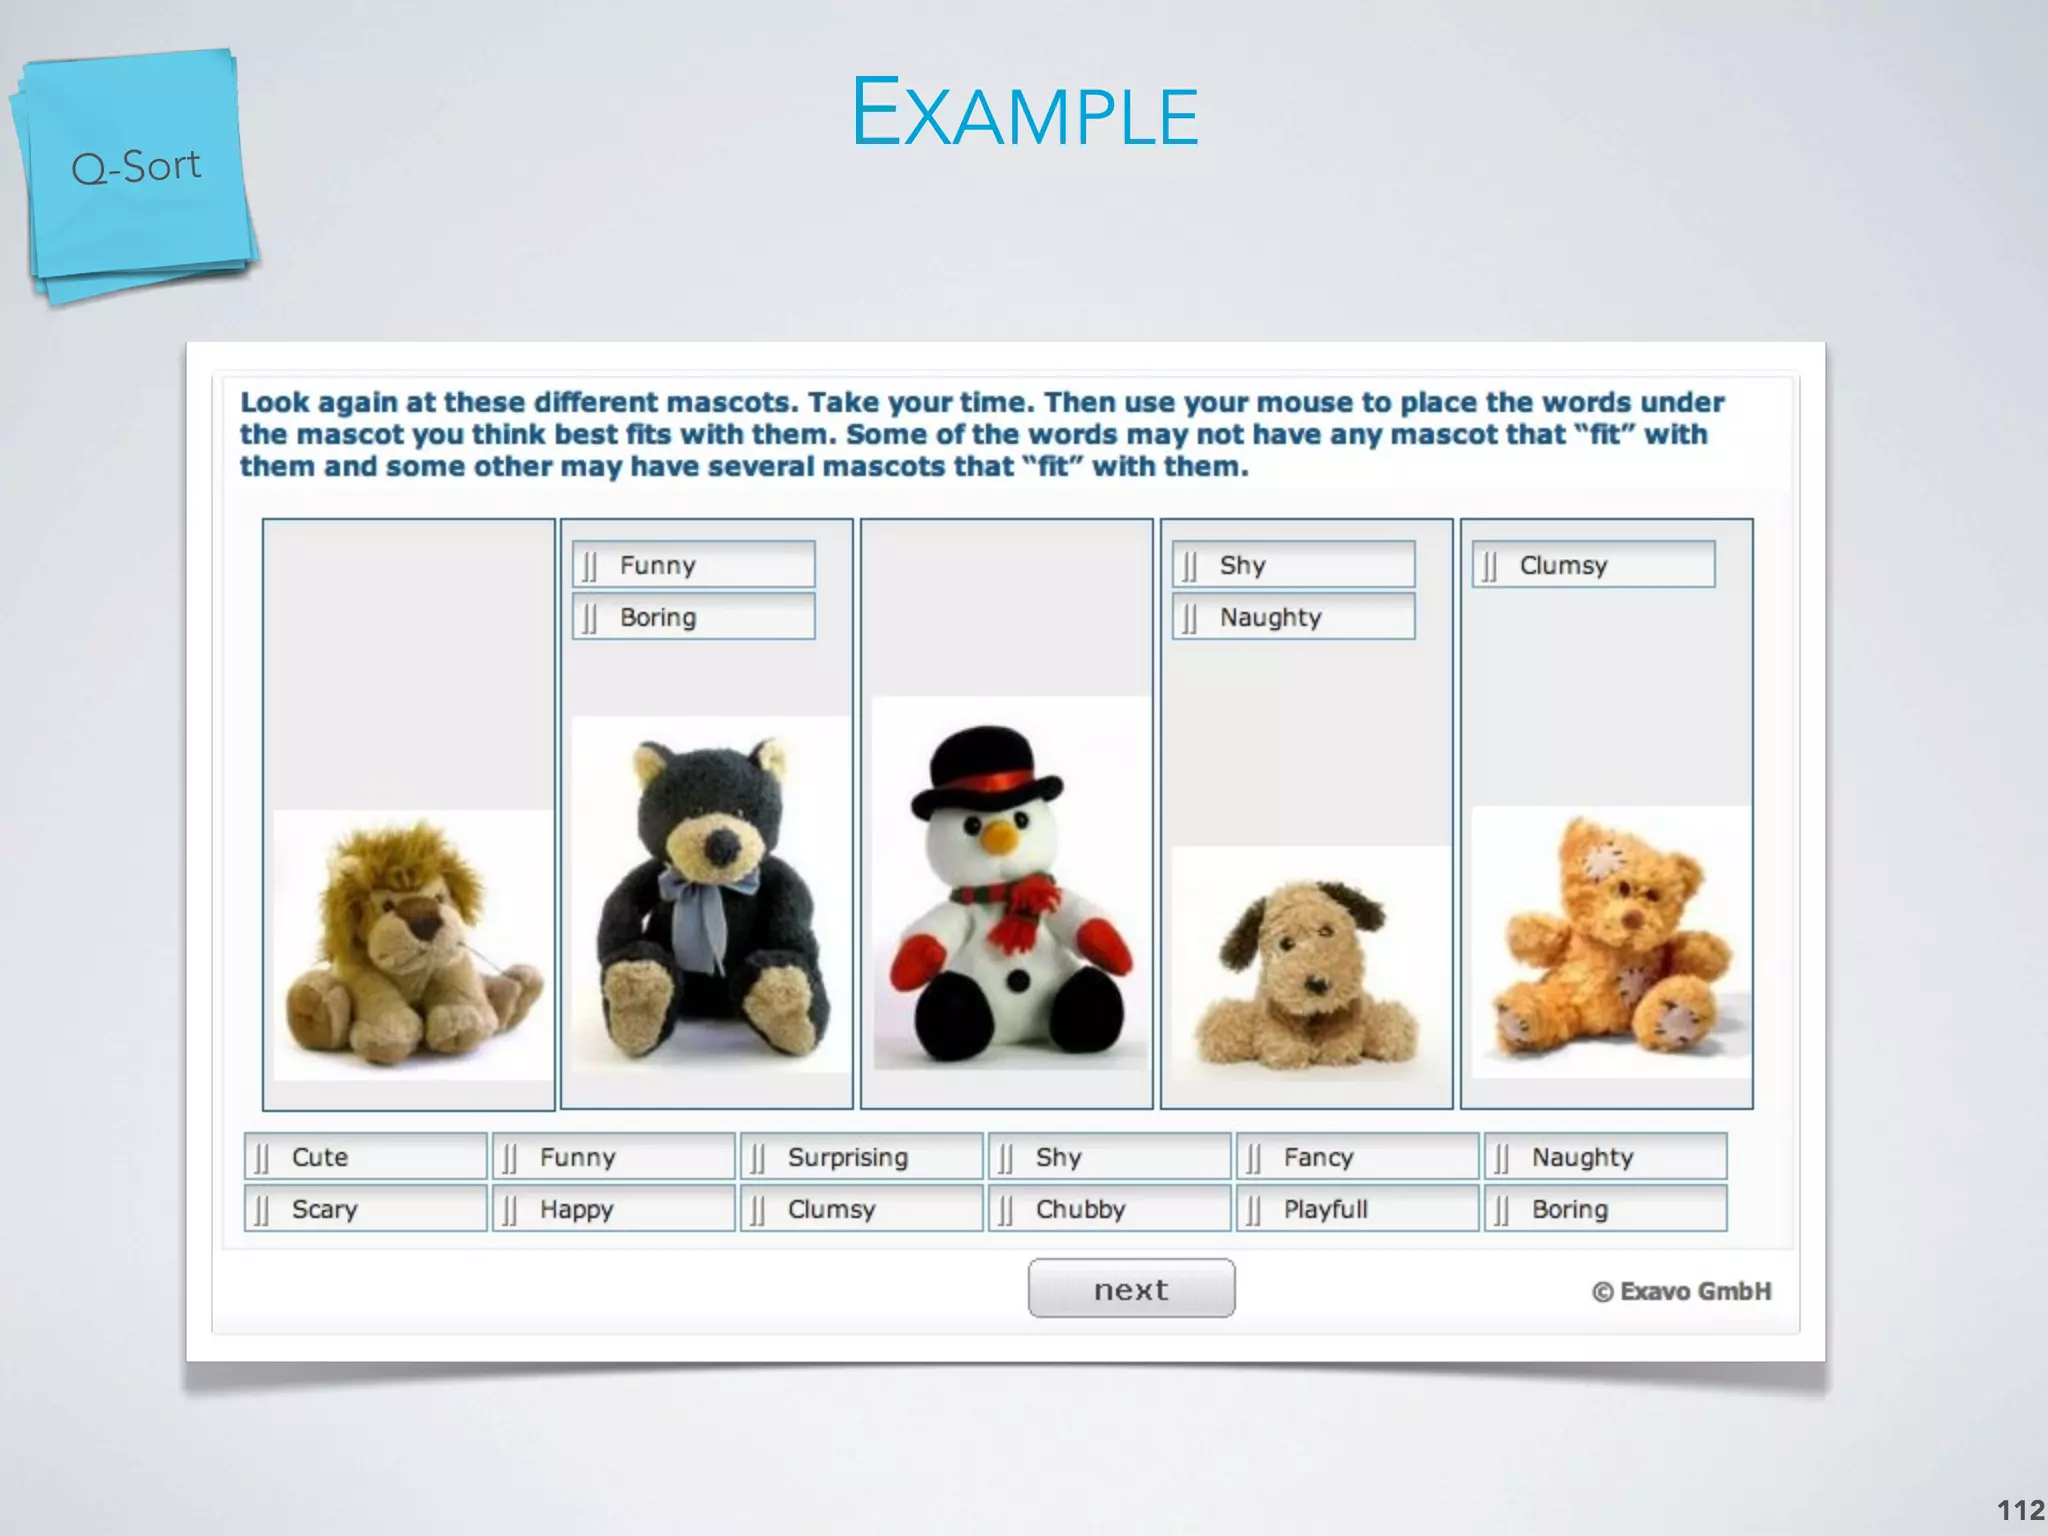
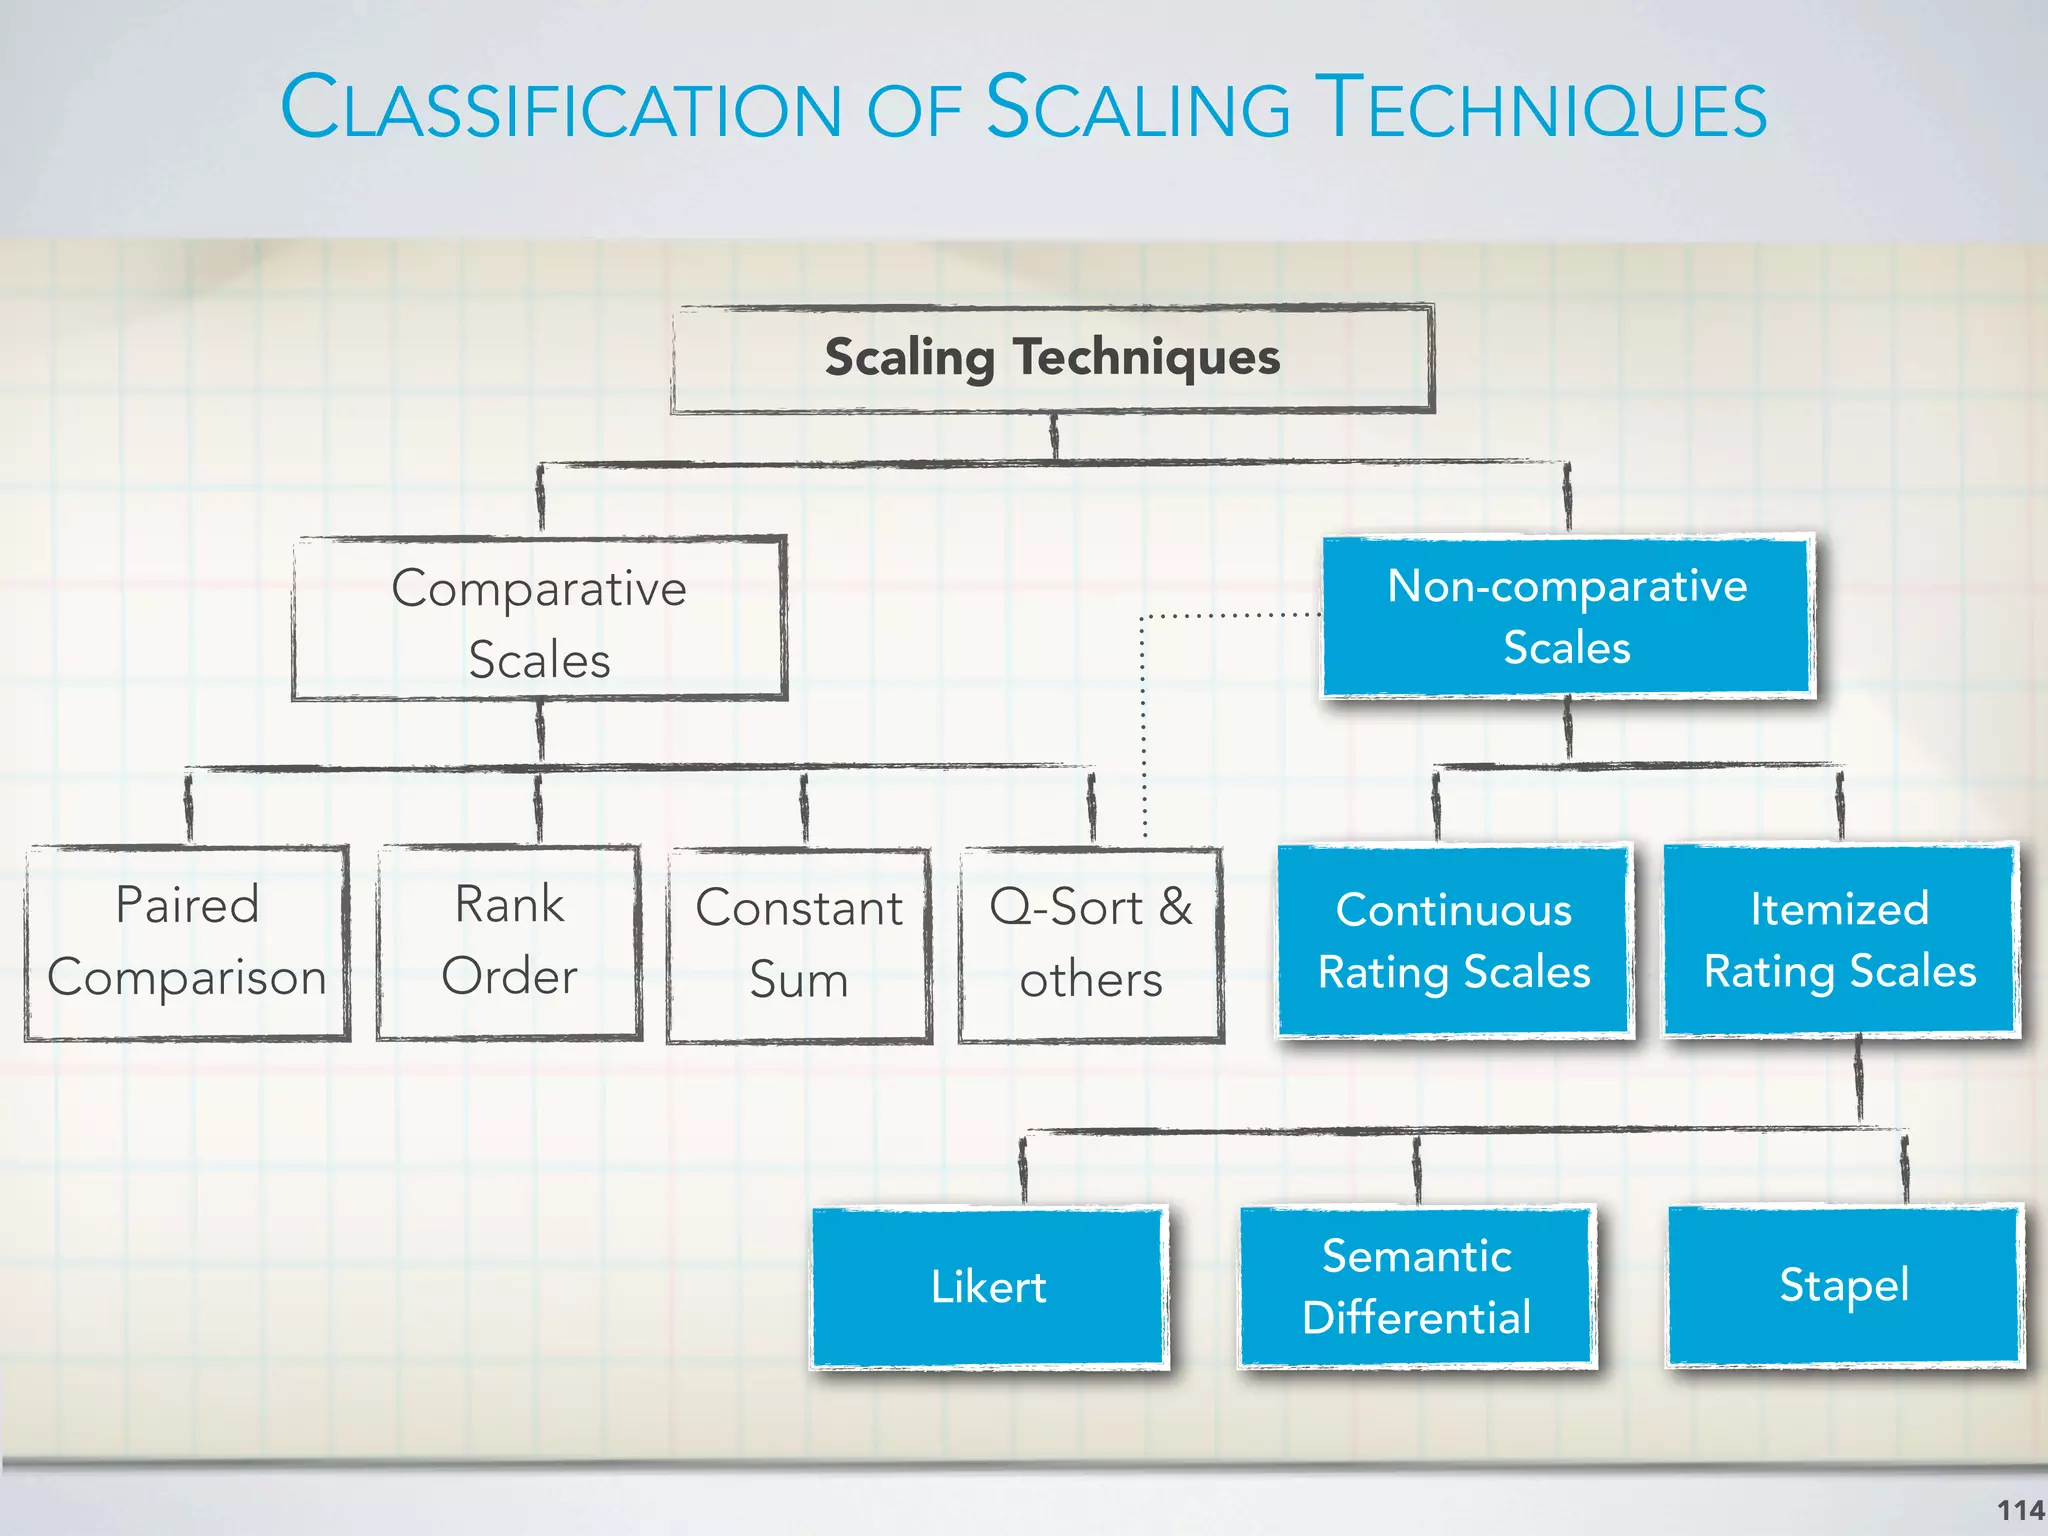
Types of scales, measurement techniques, advantages, and disadvantages of different scaling methods.
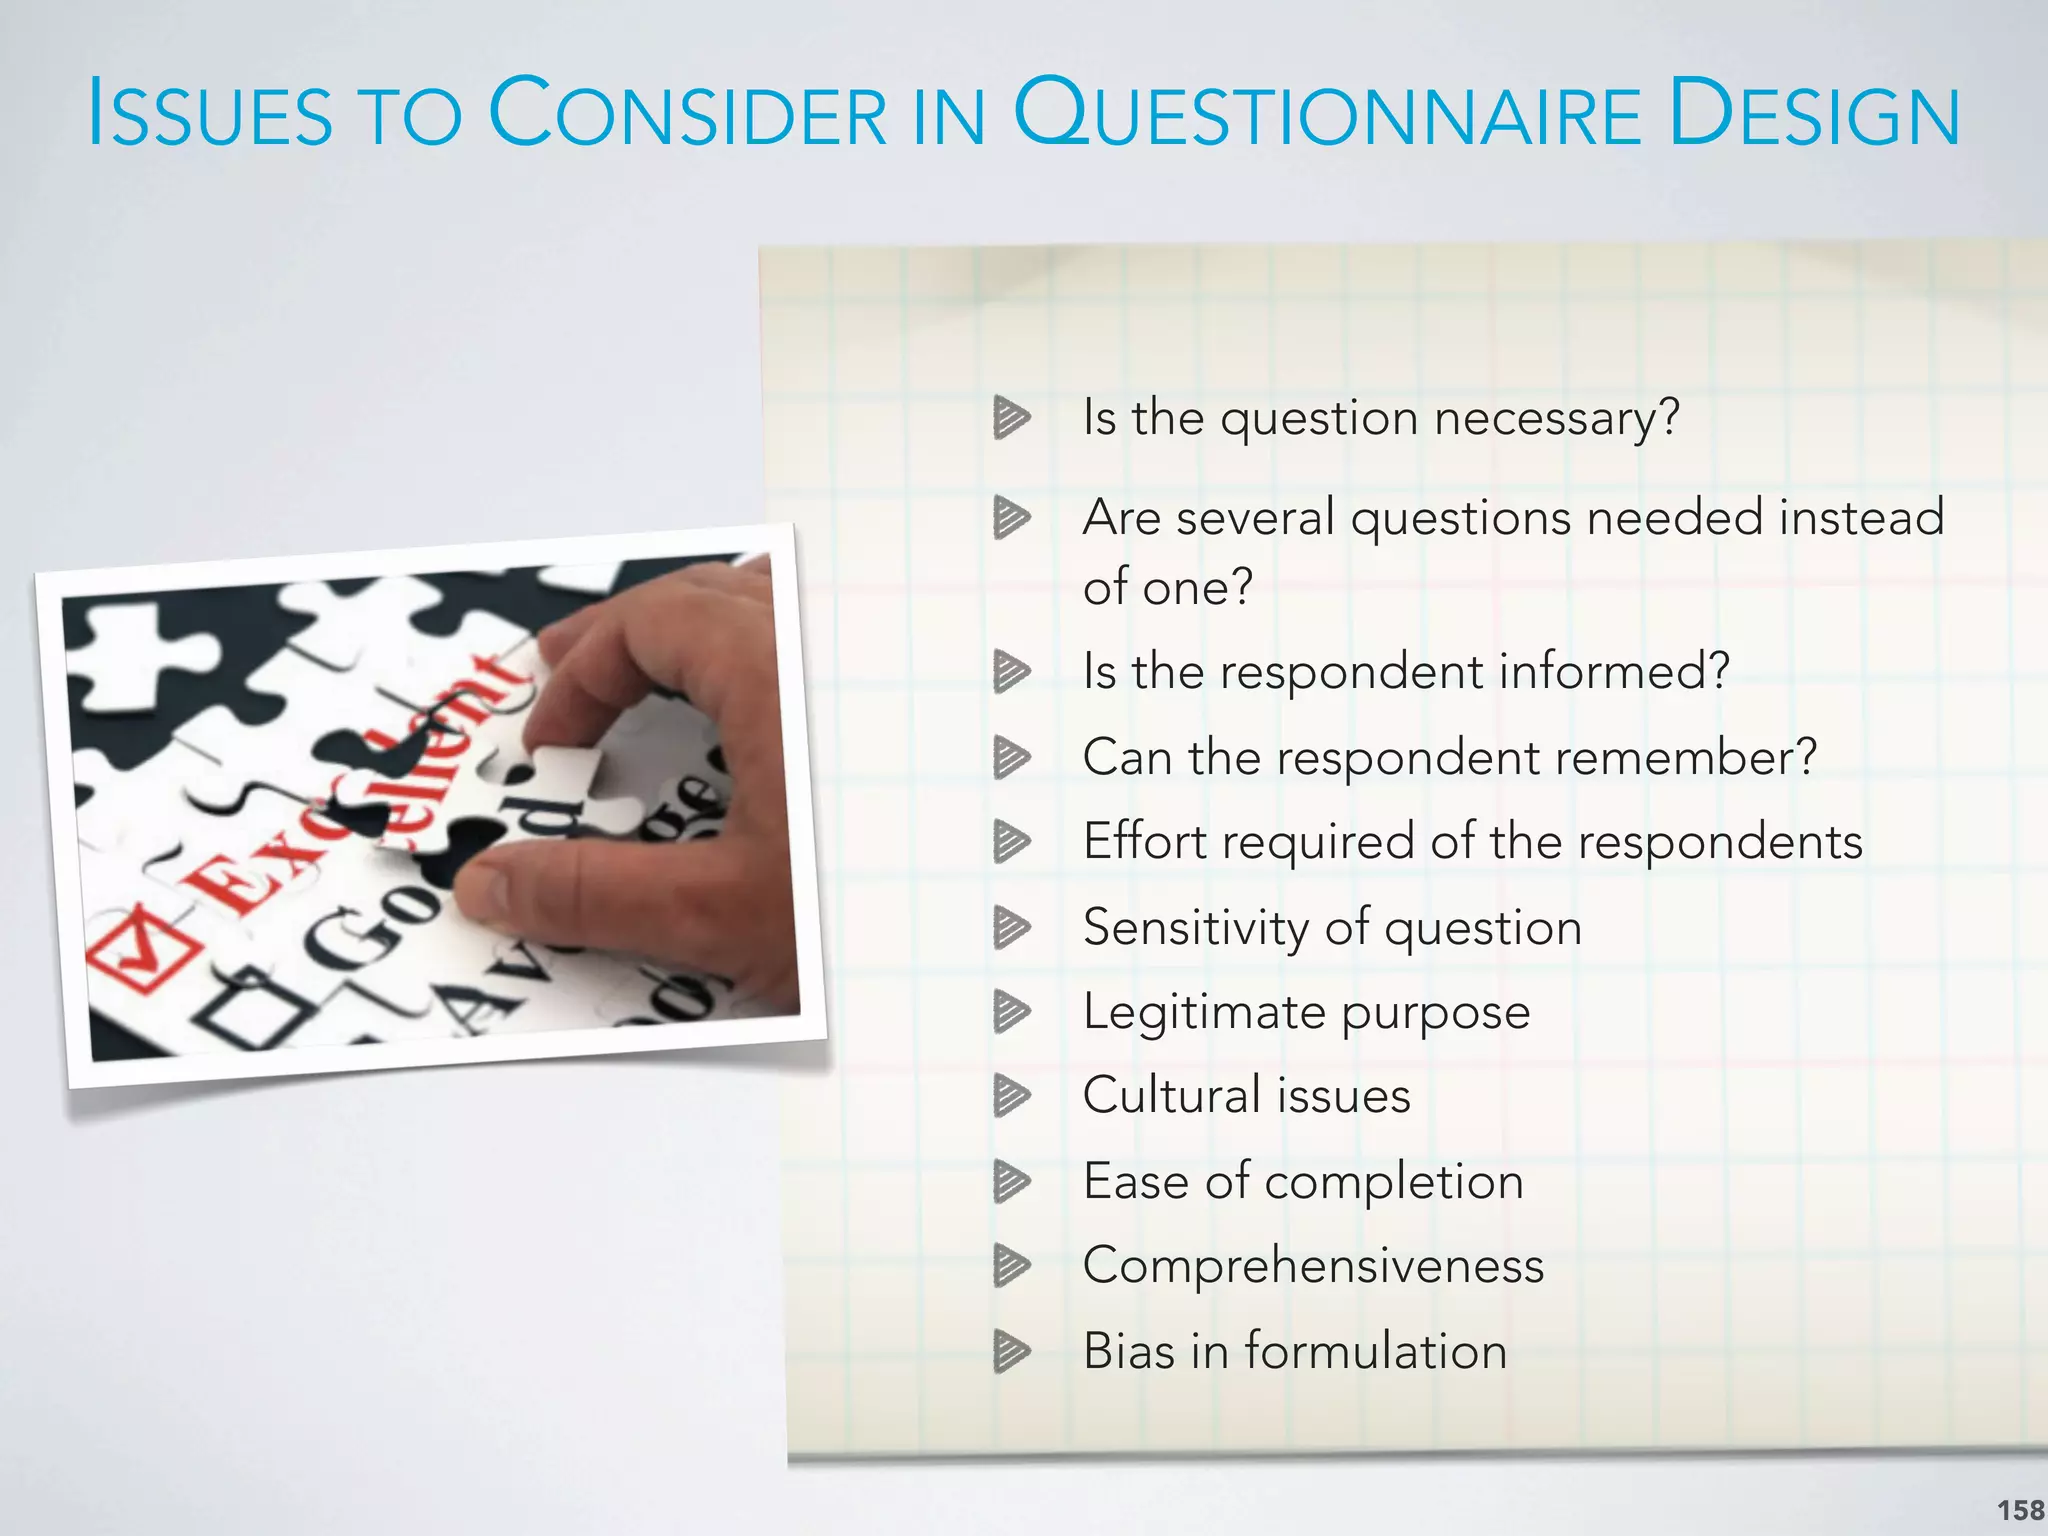
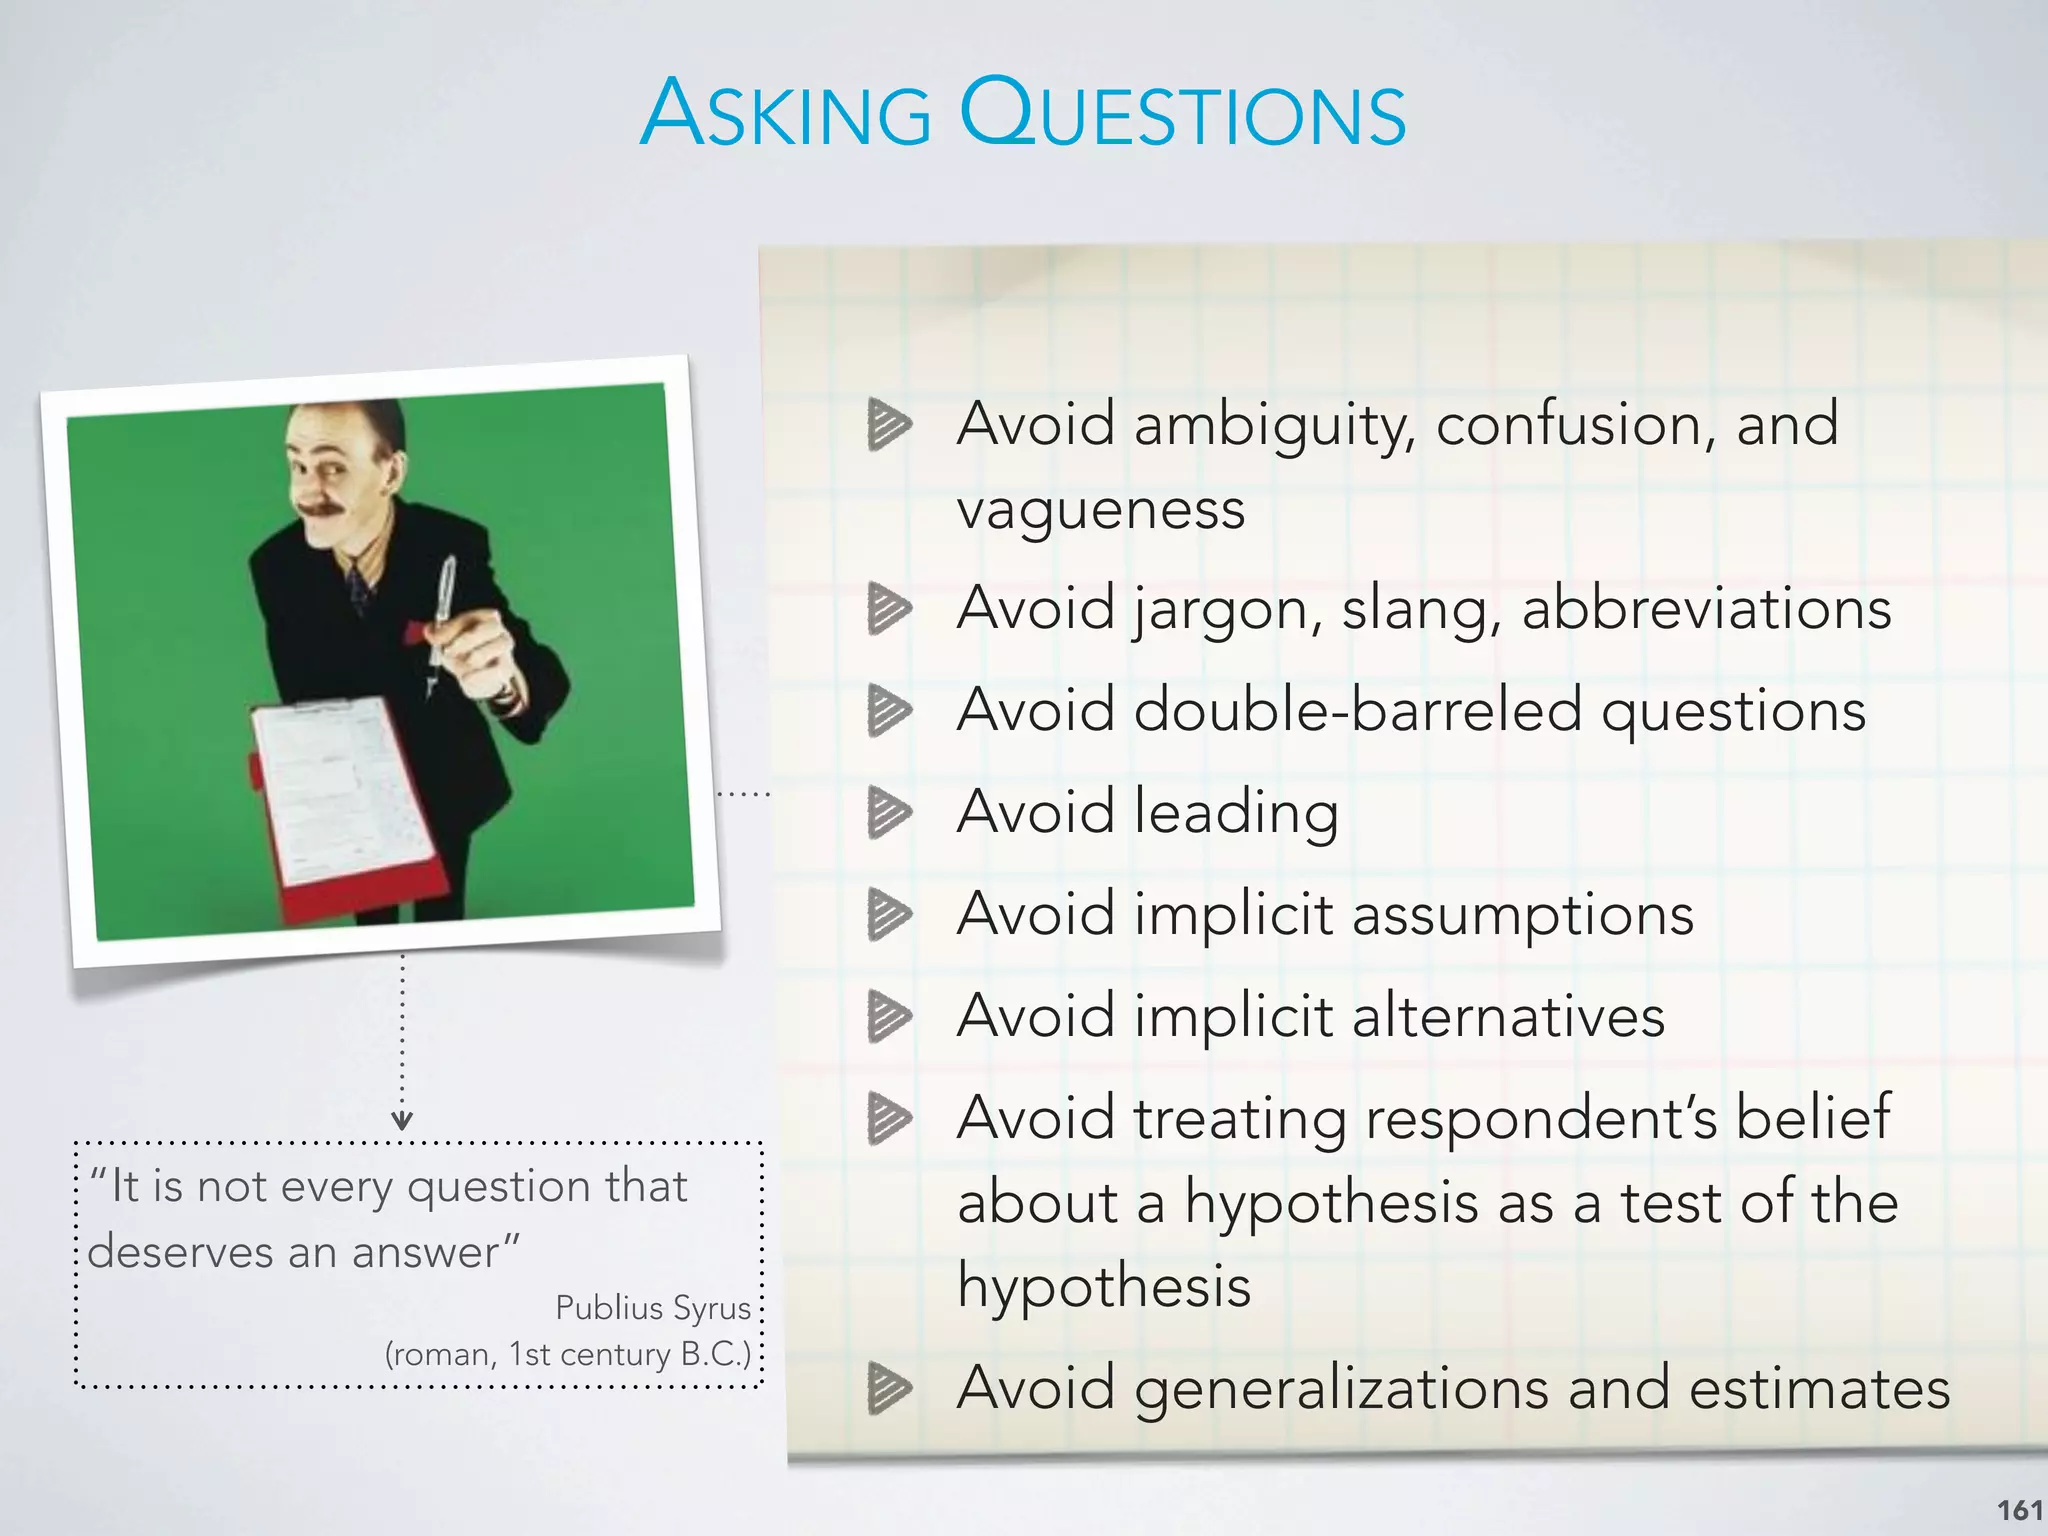
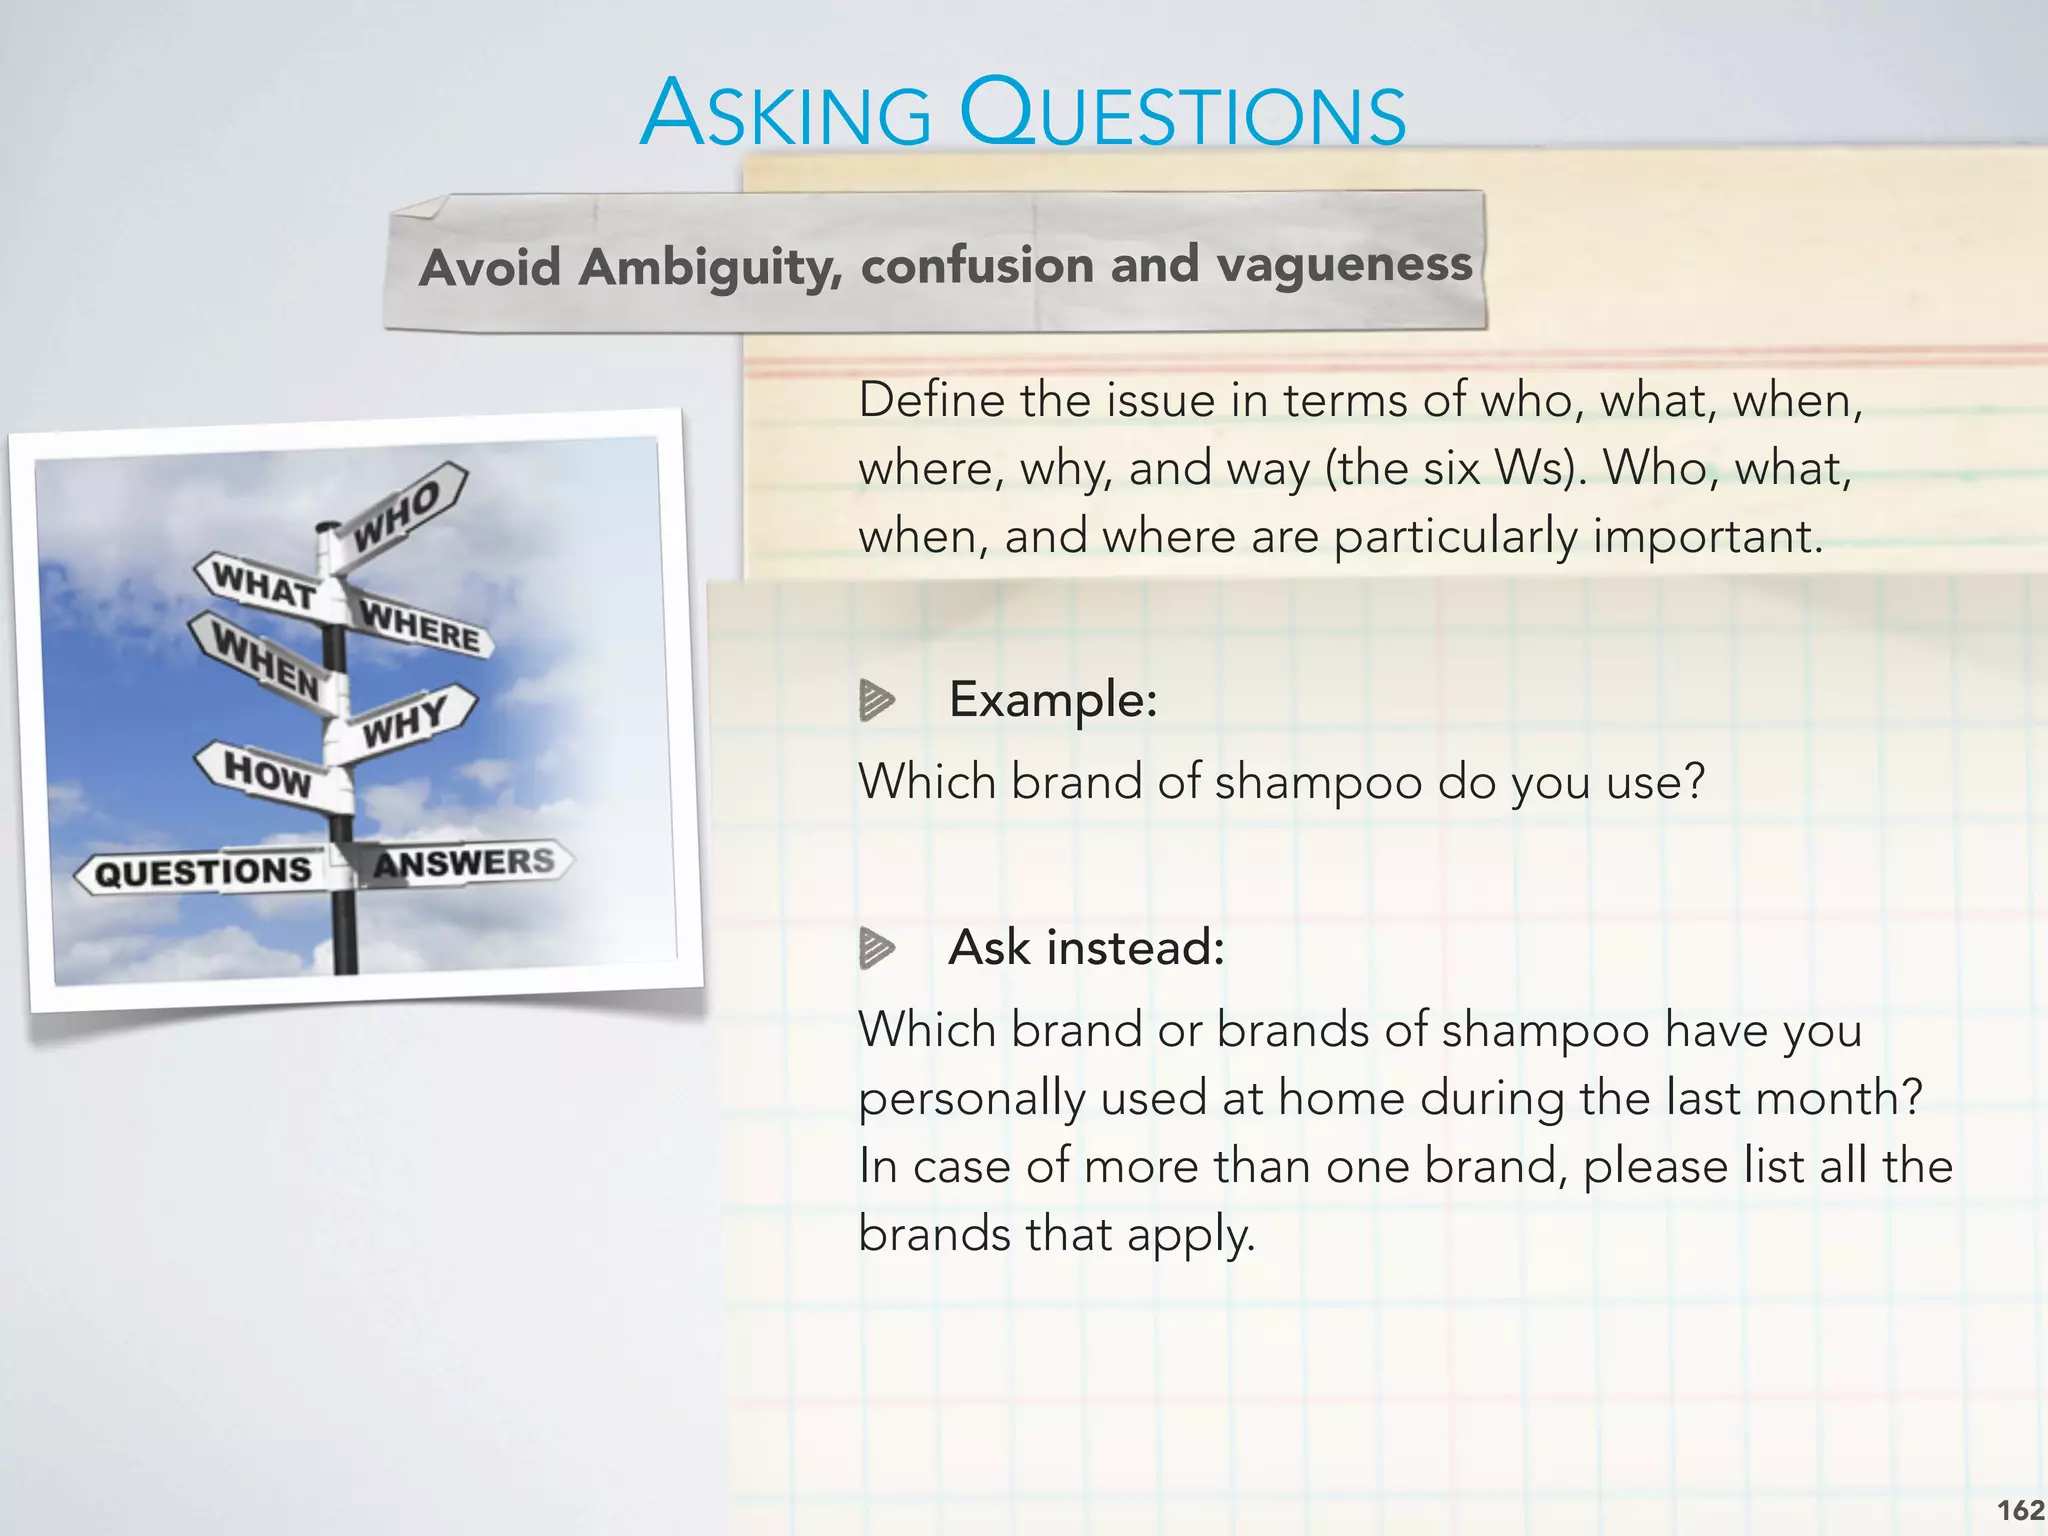
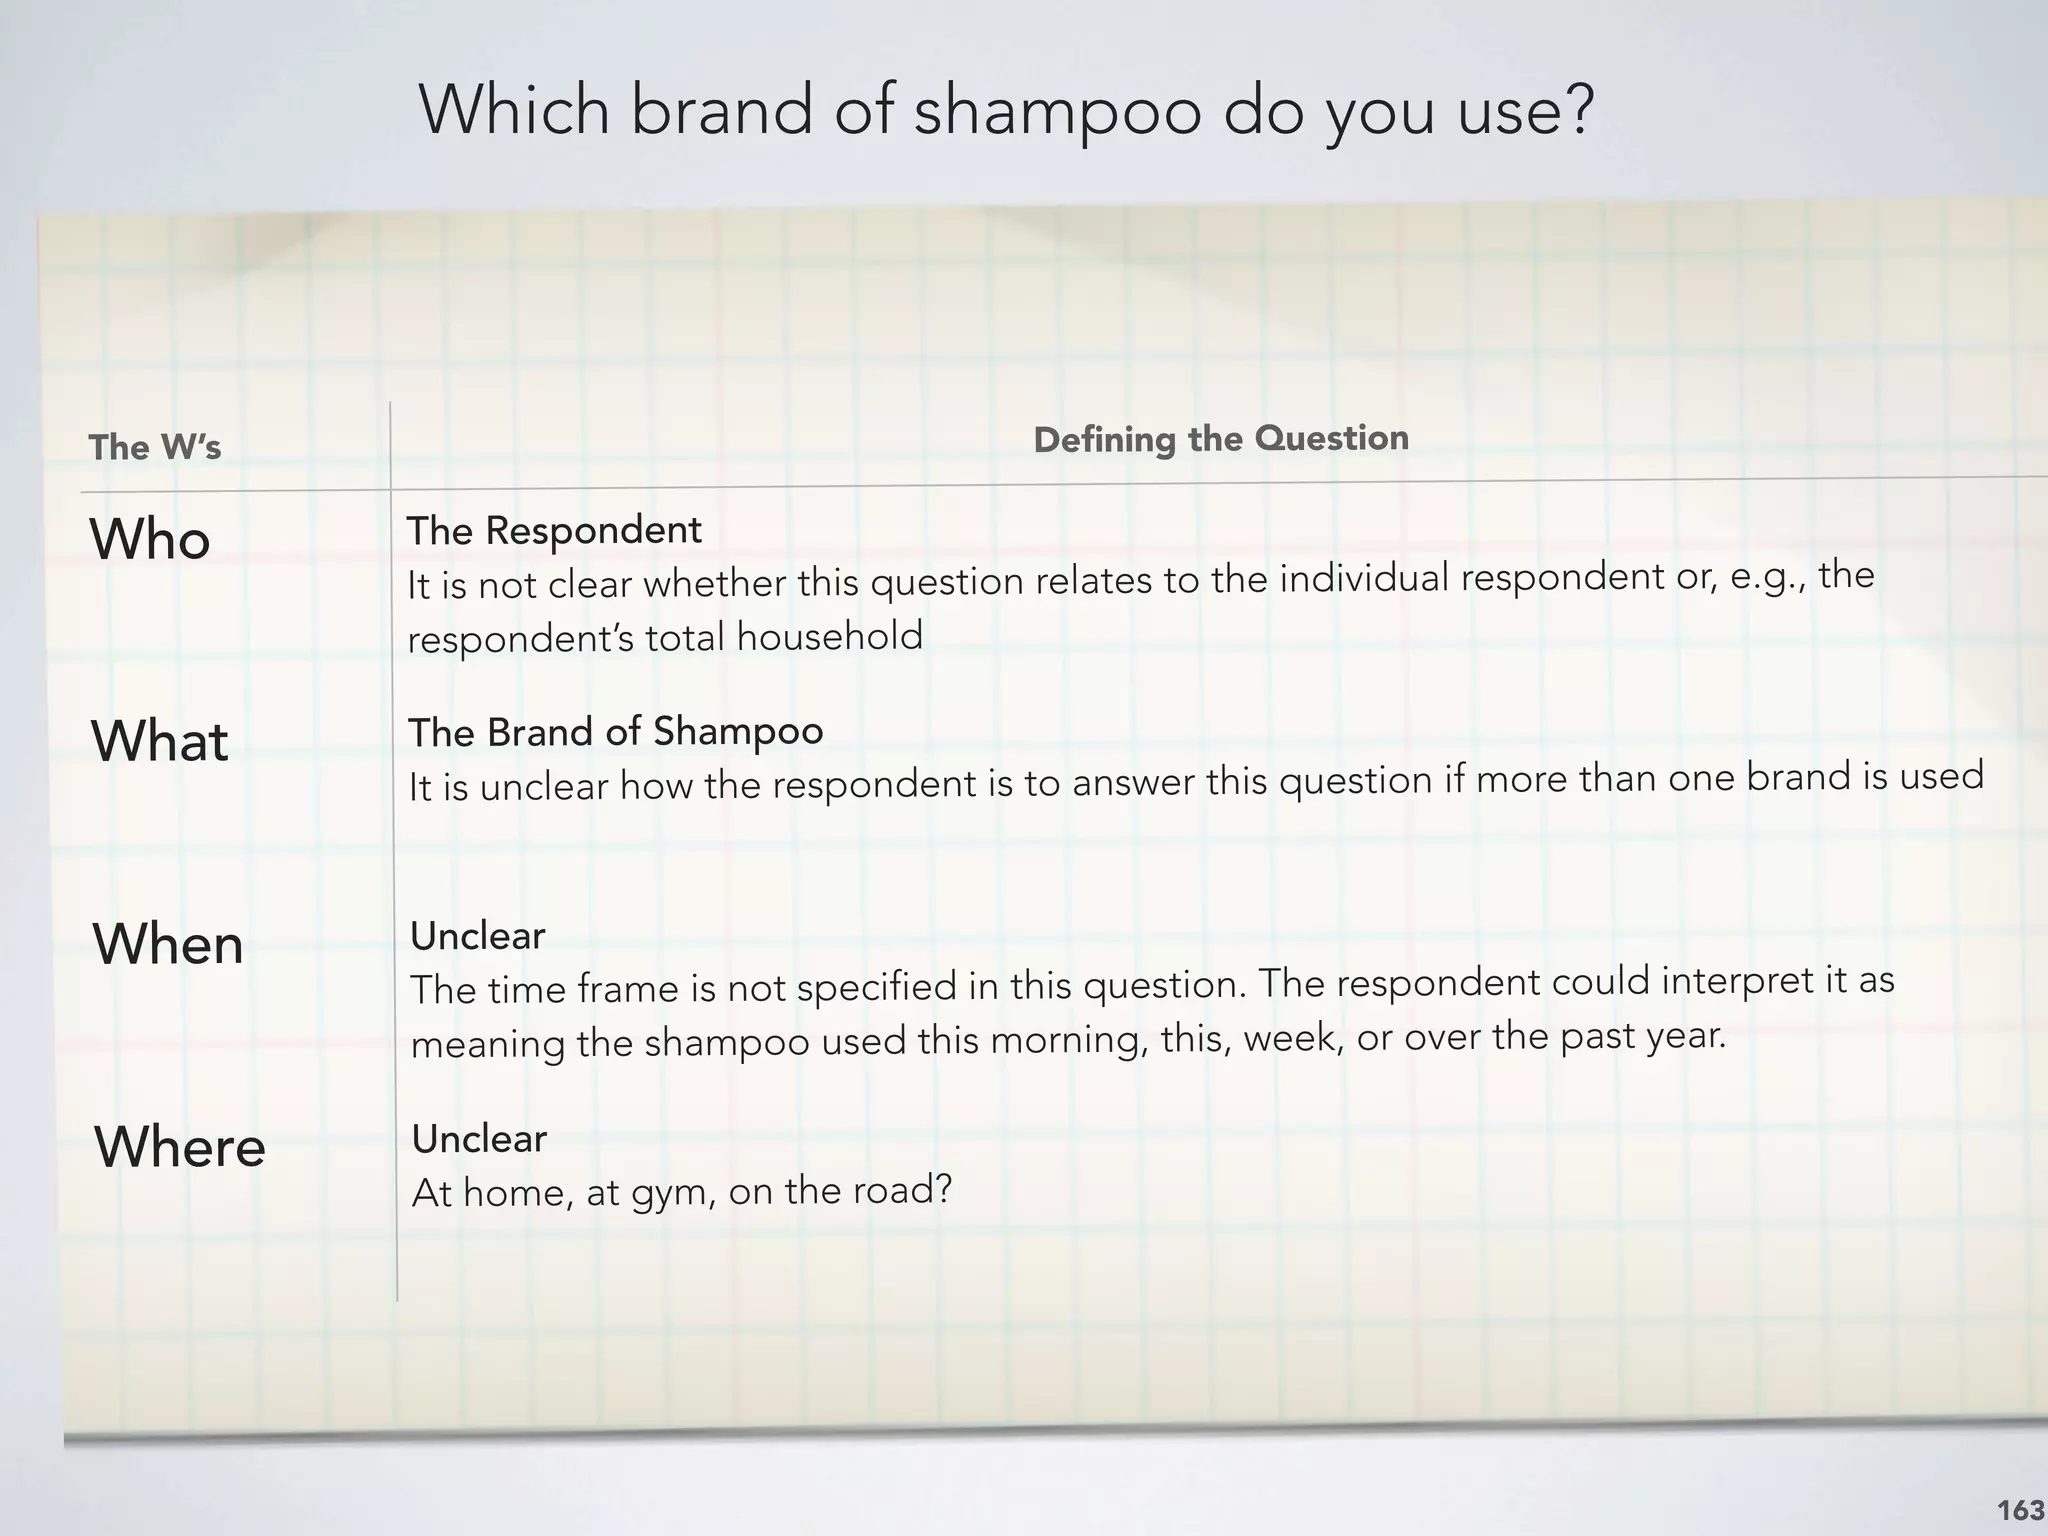
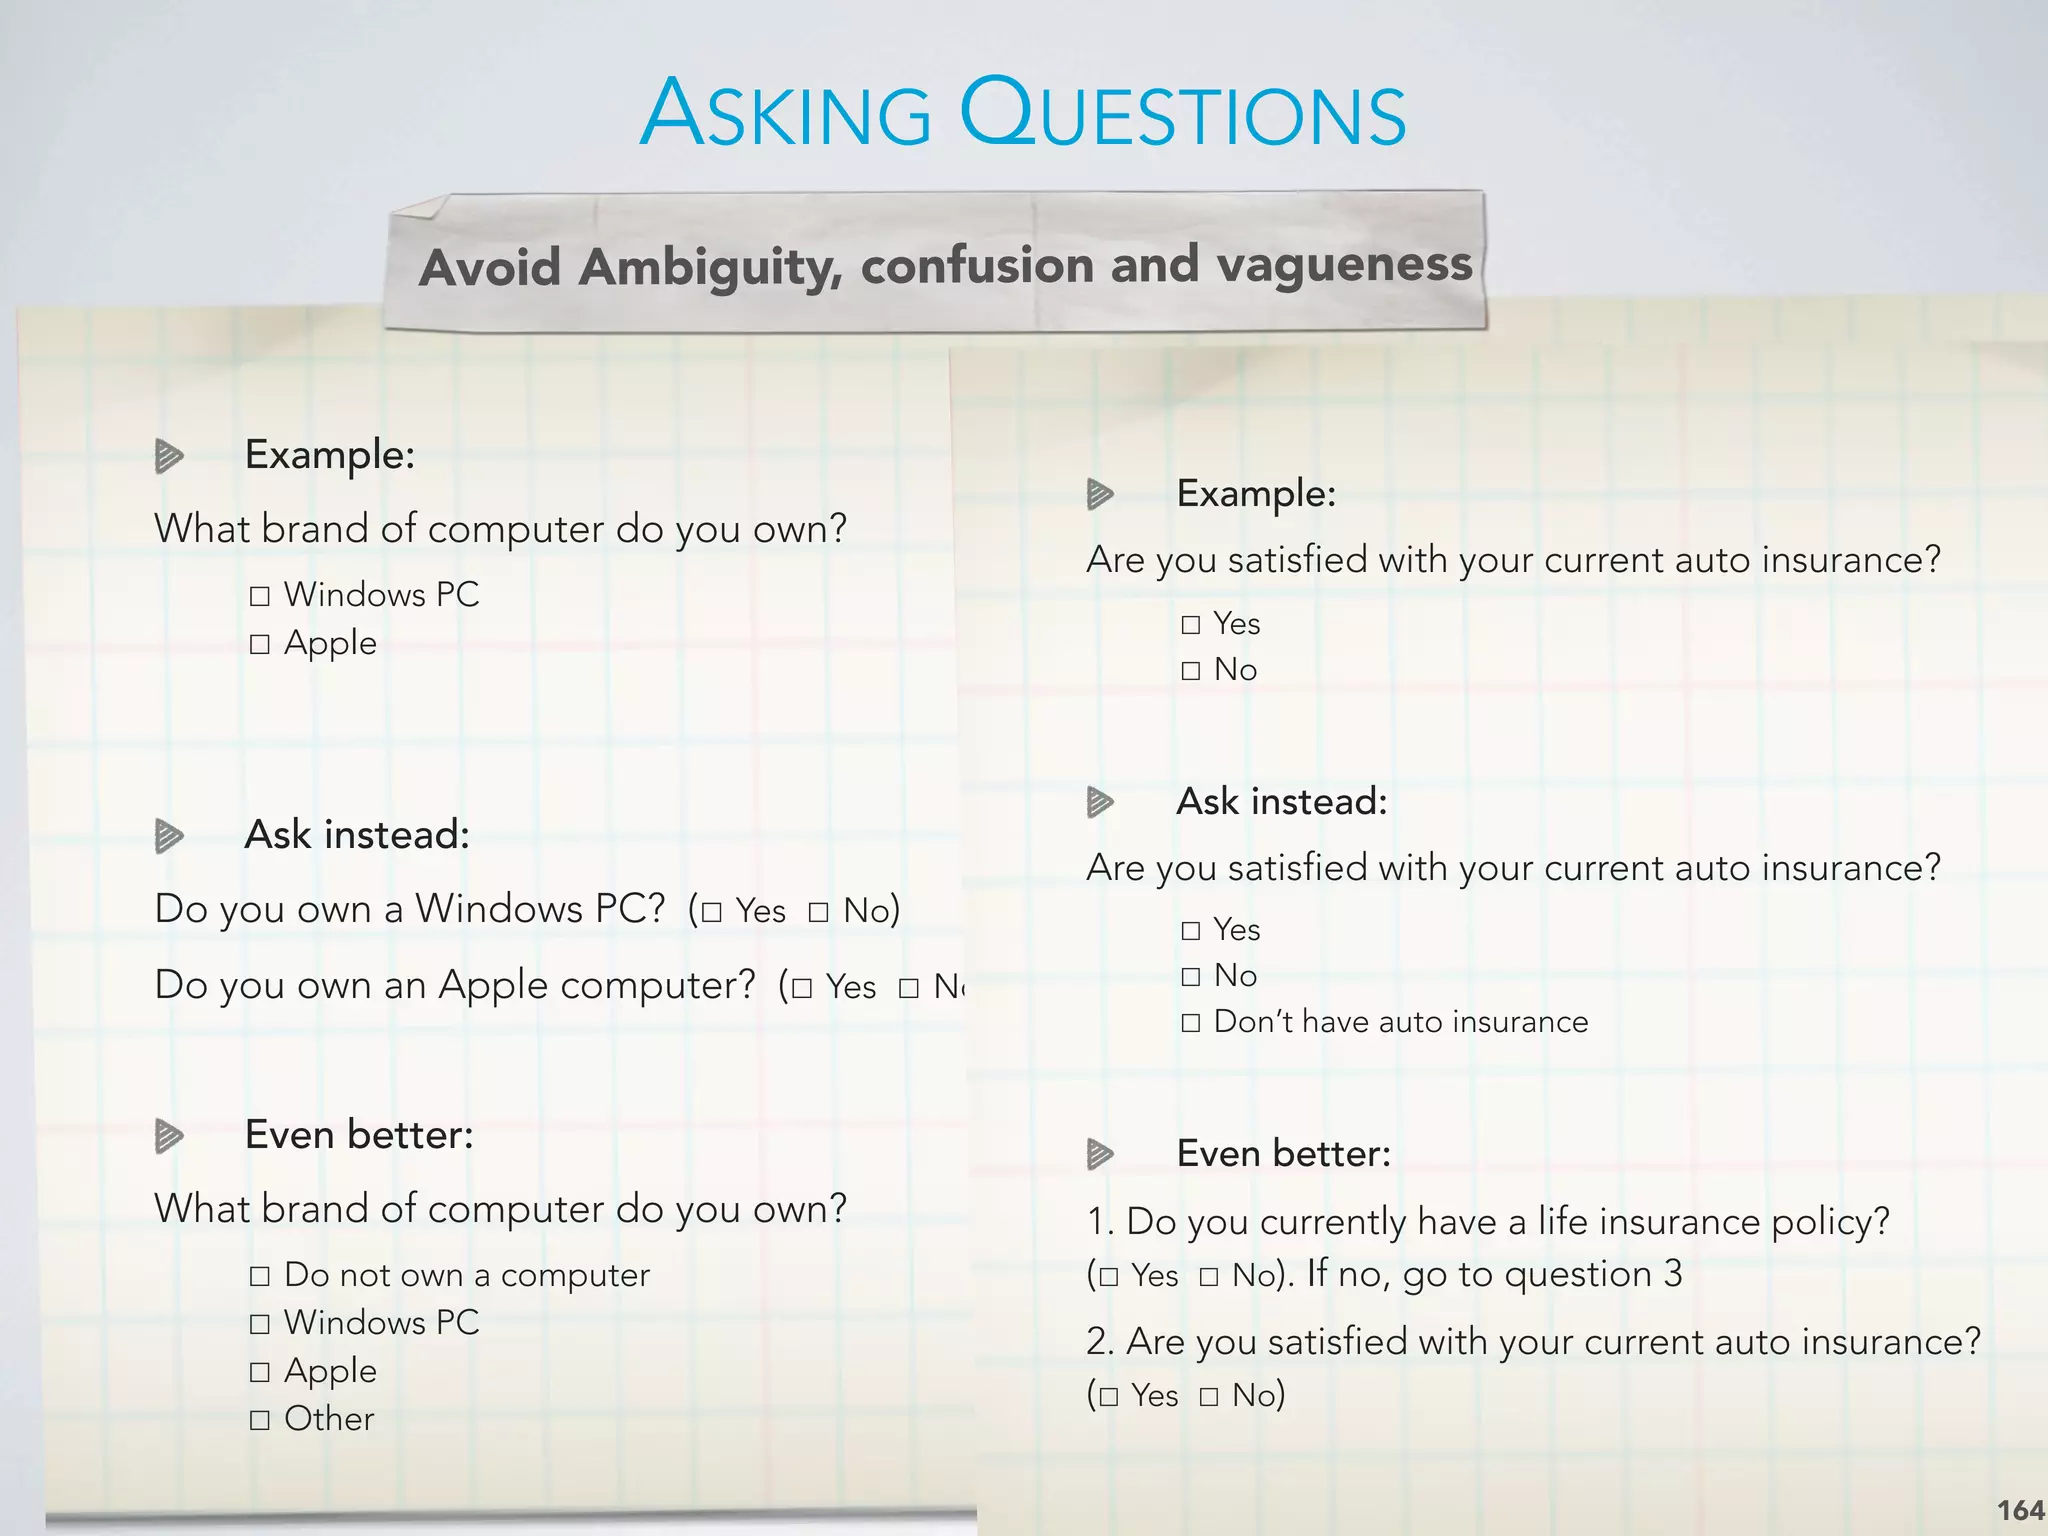
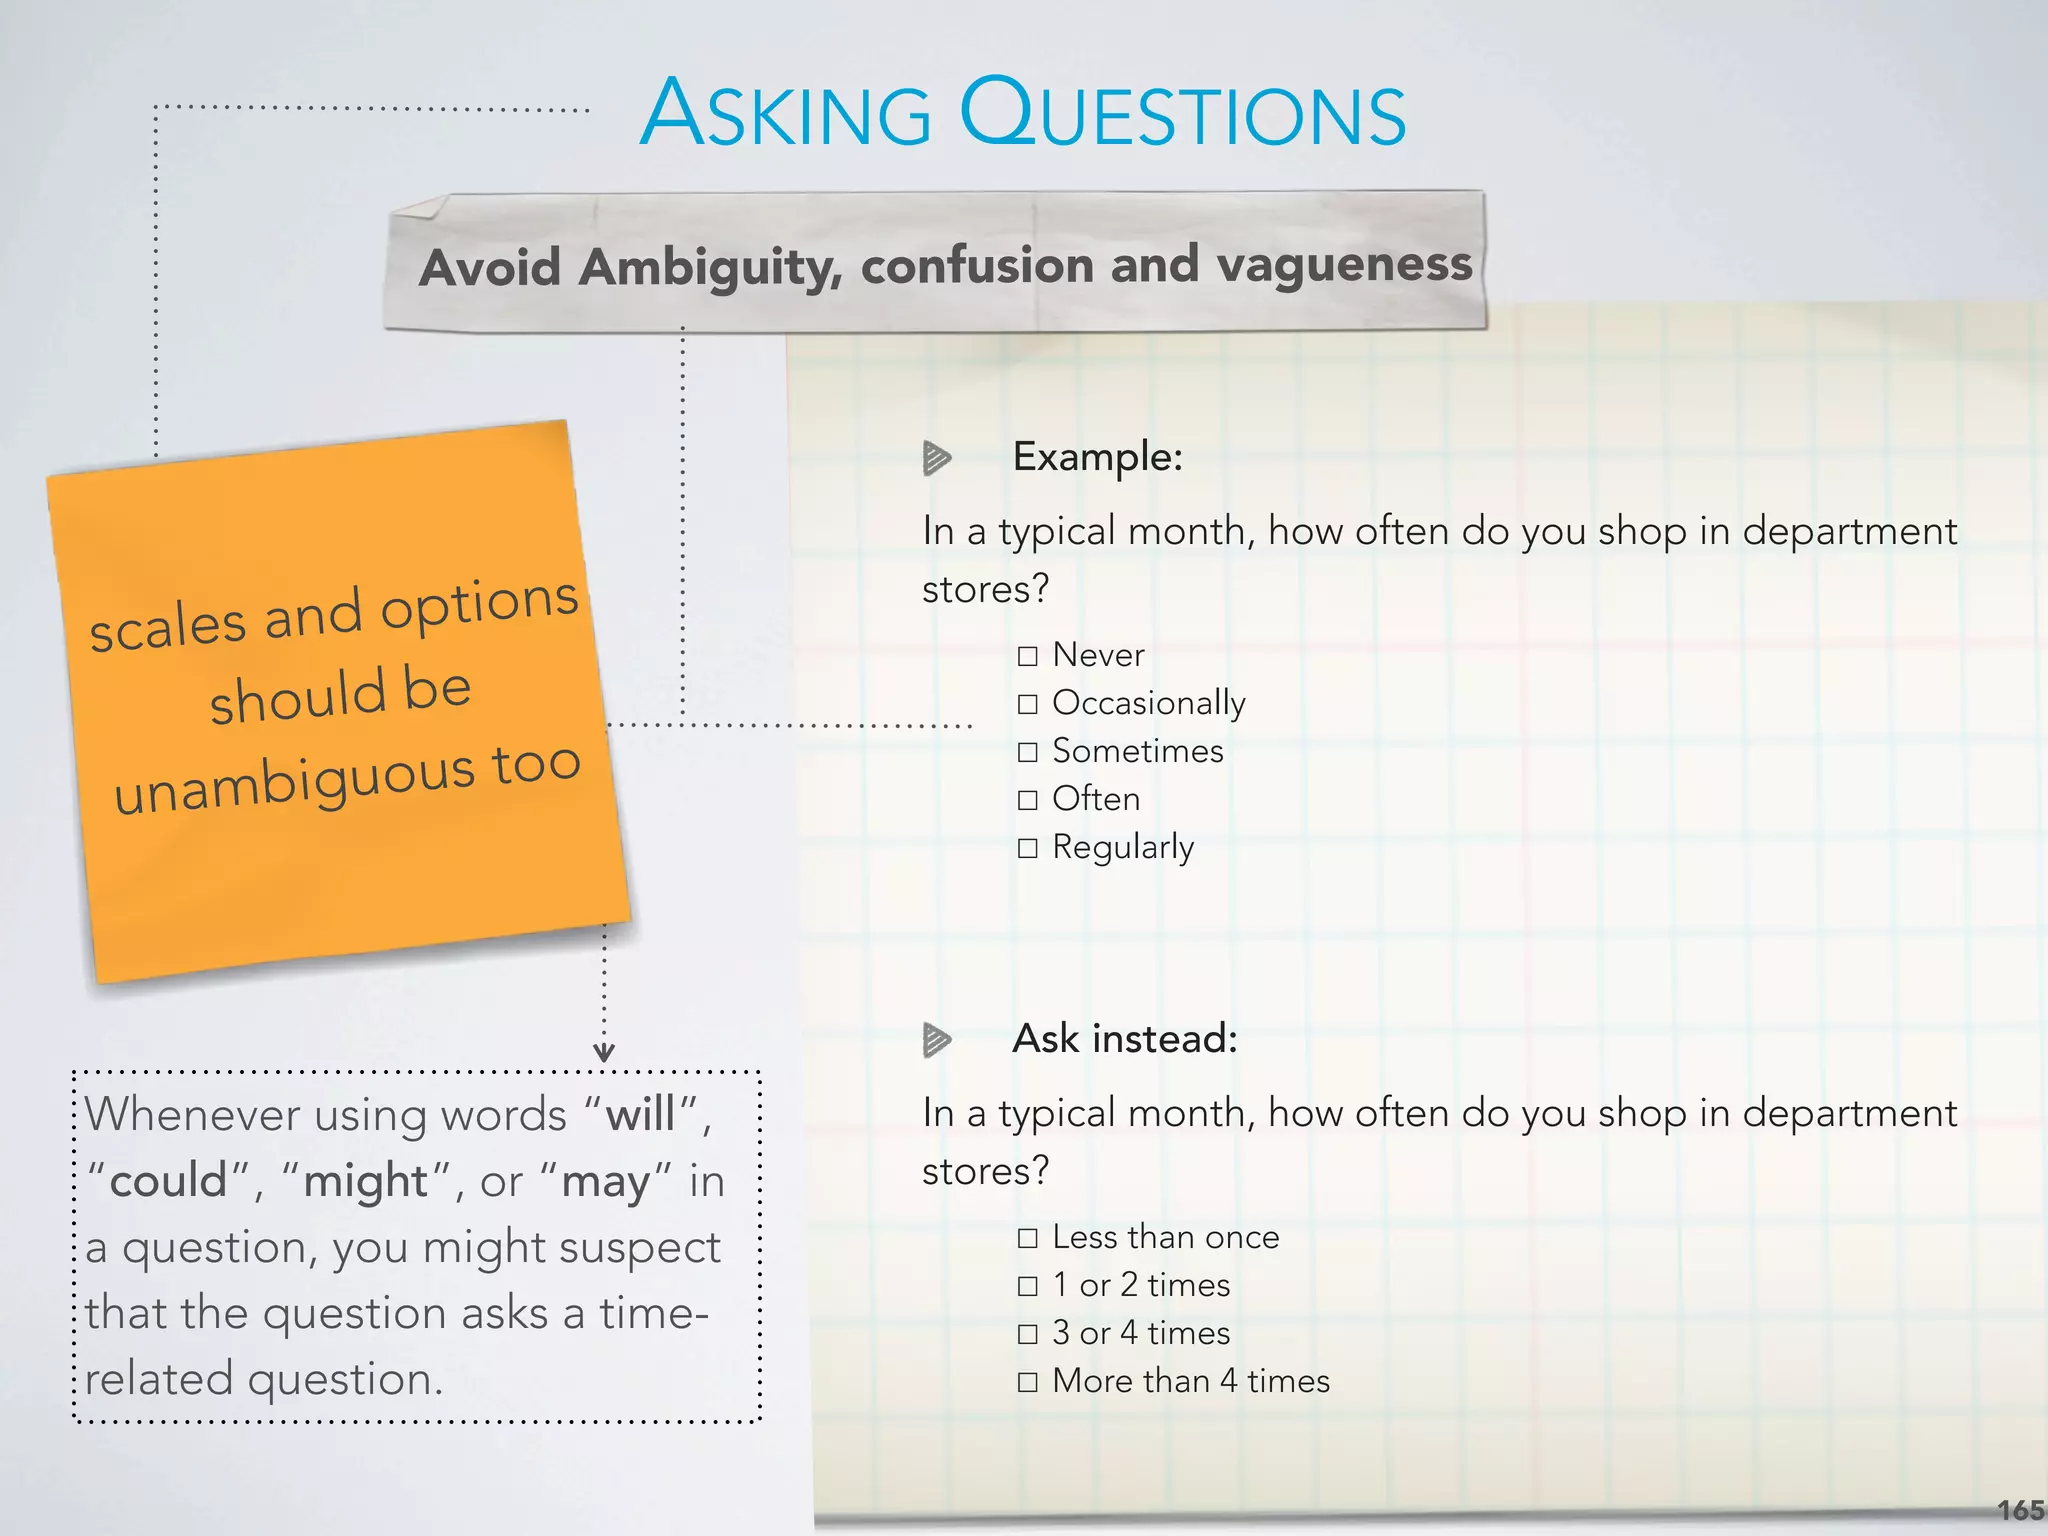
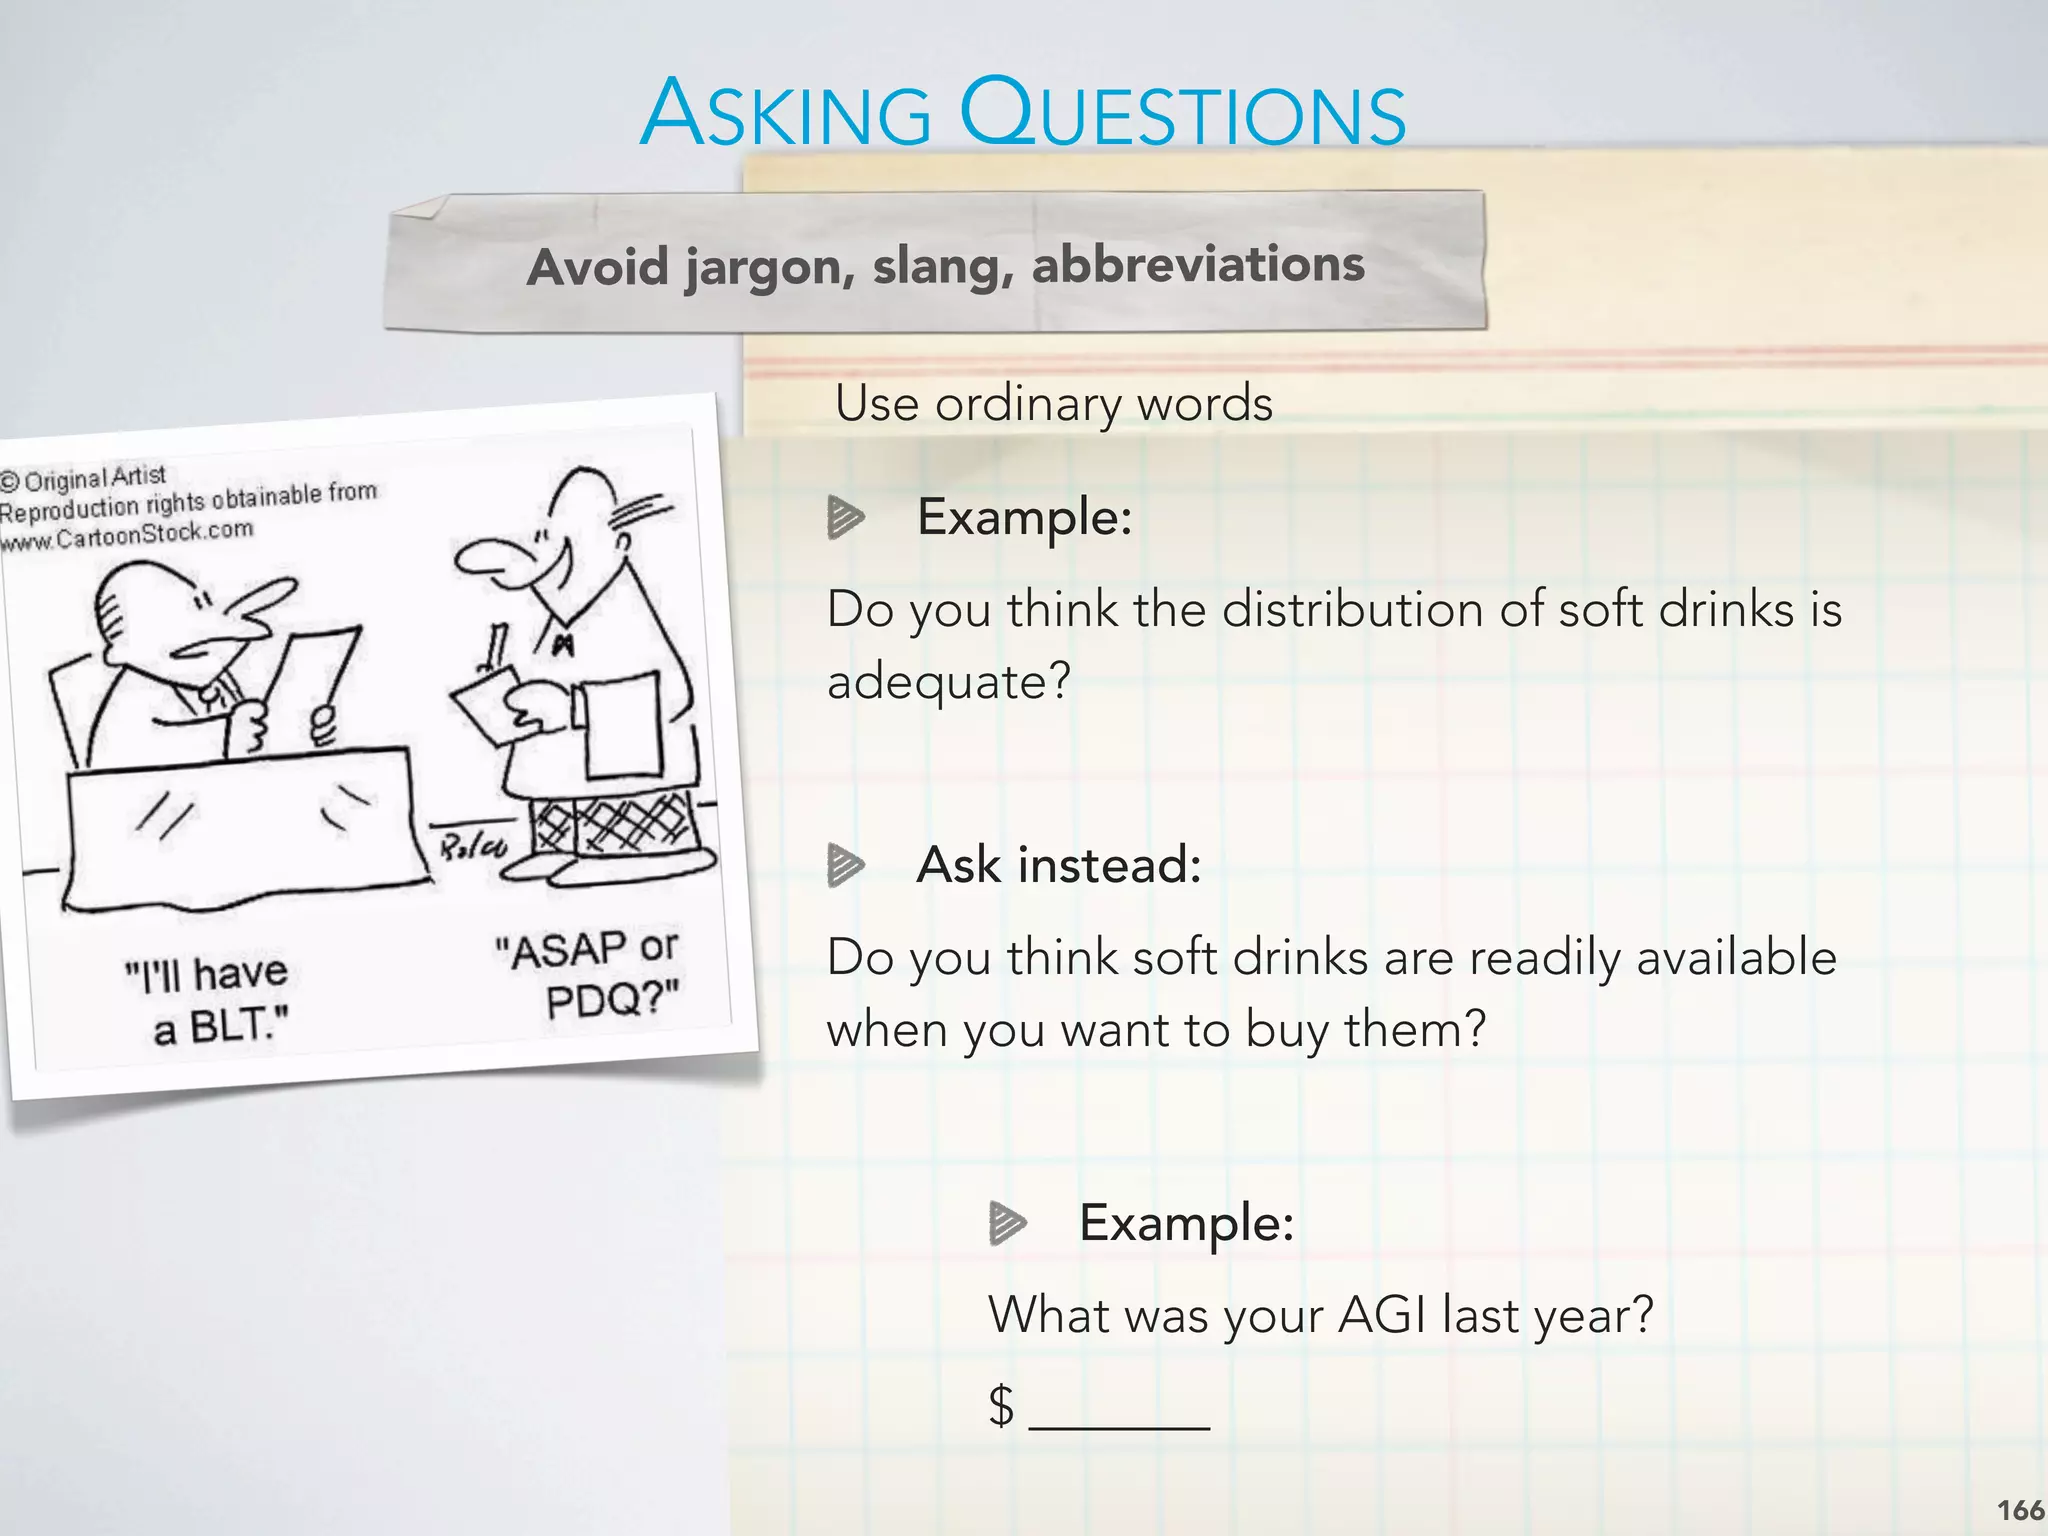
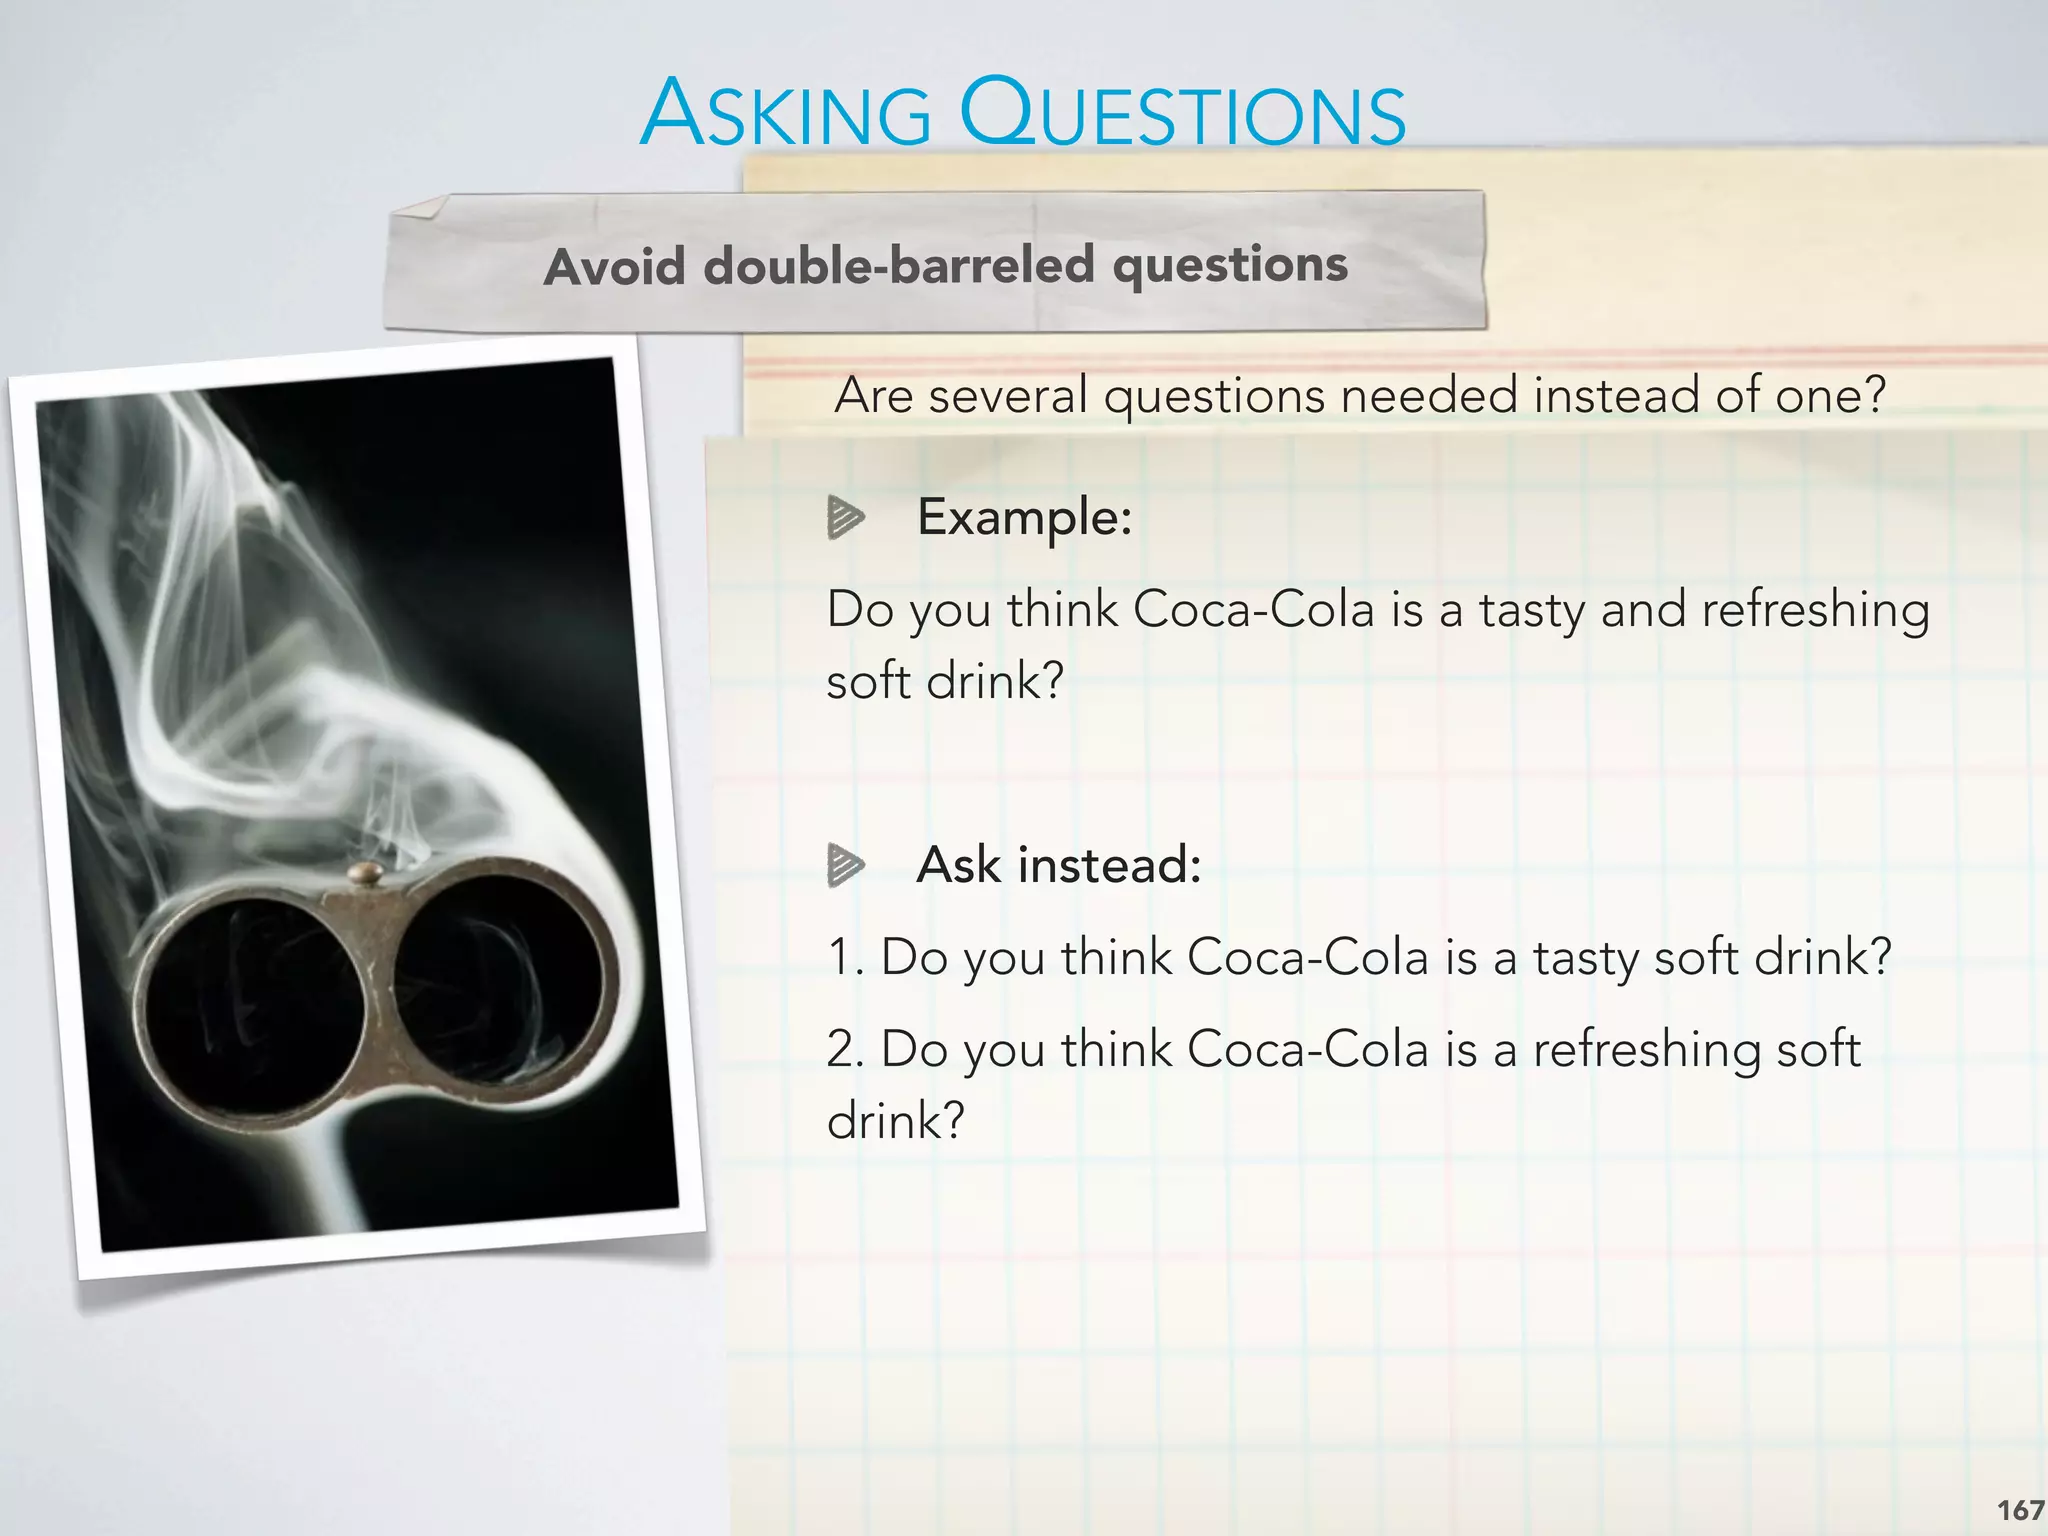
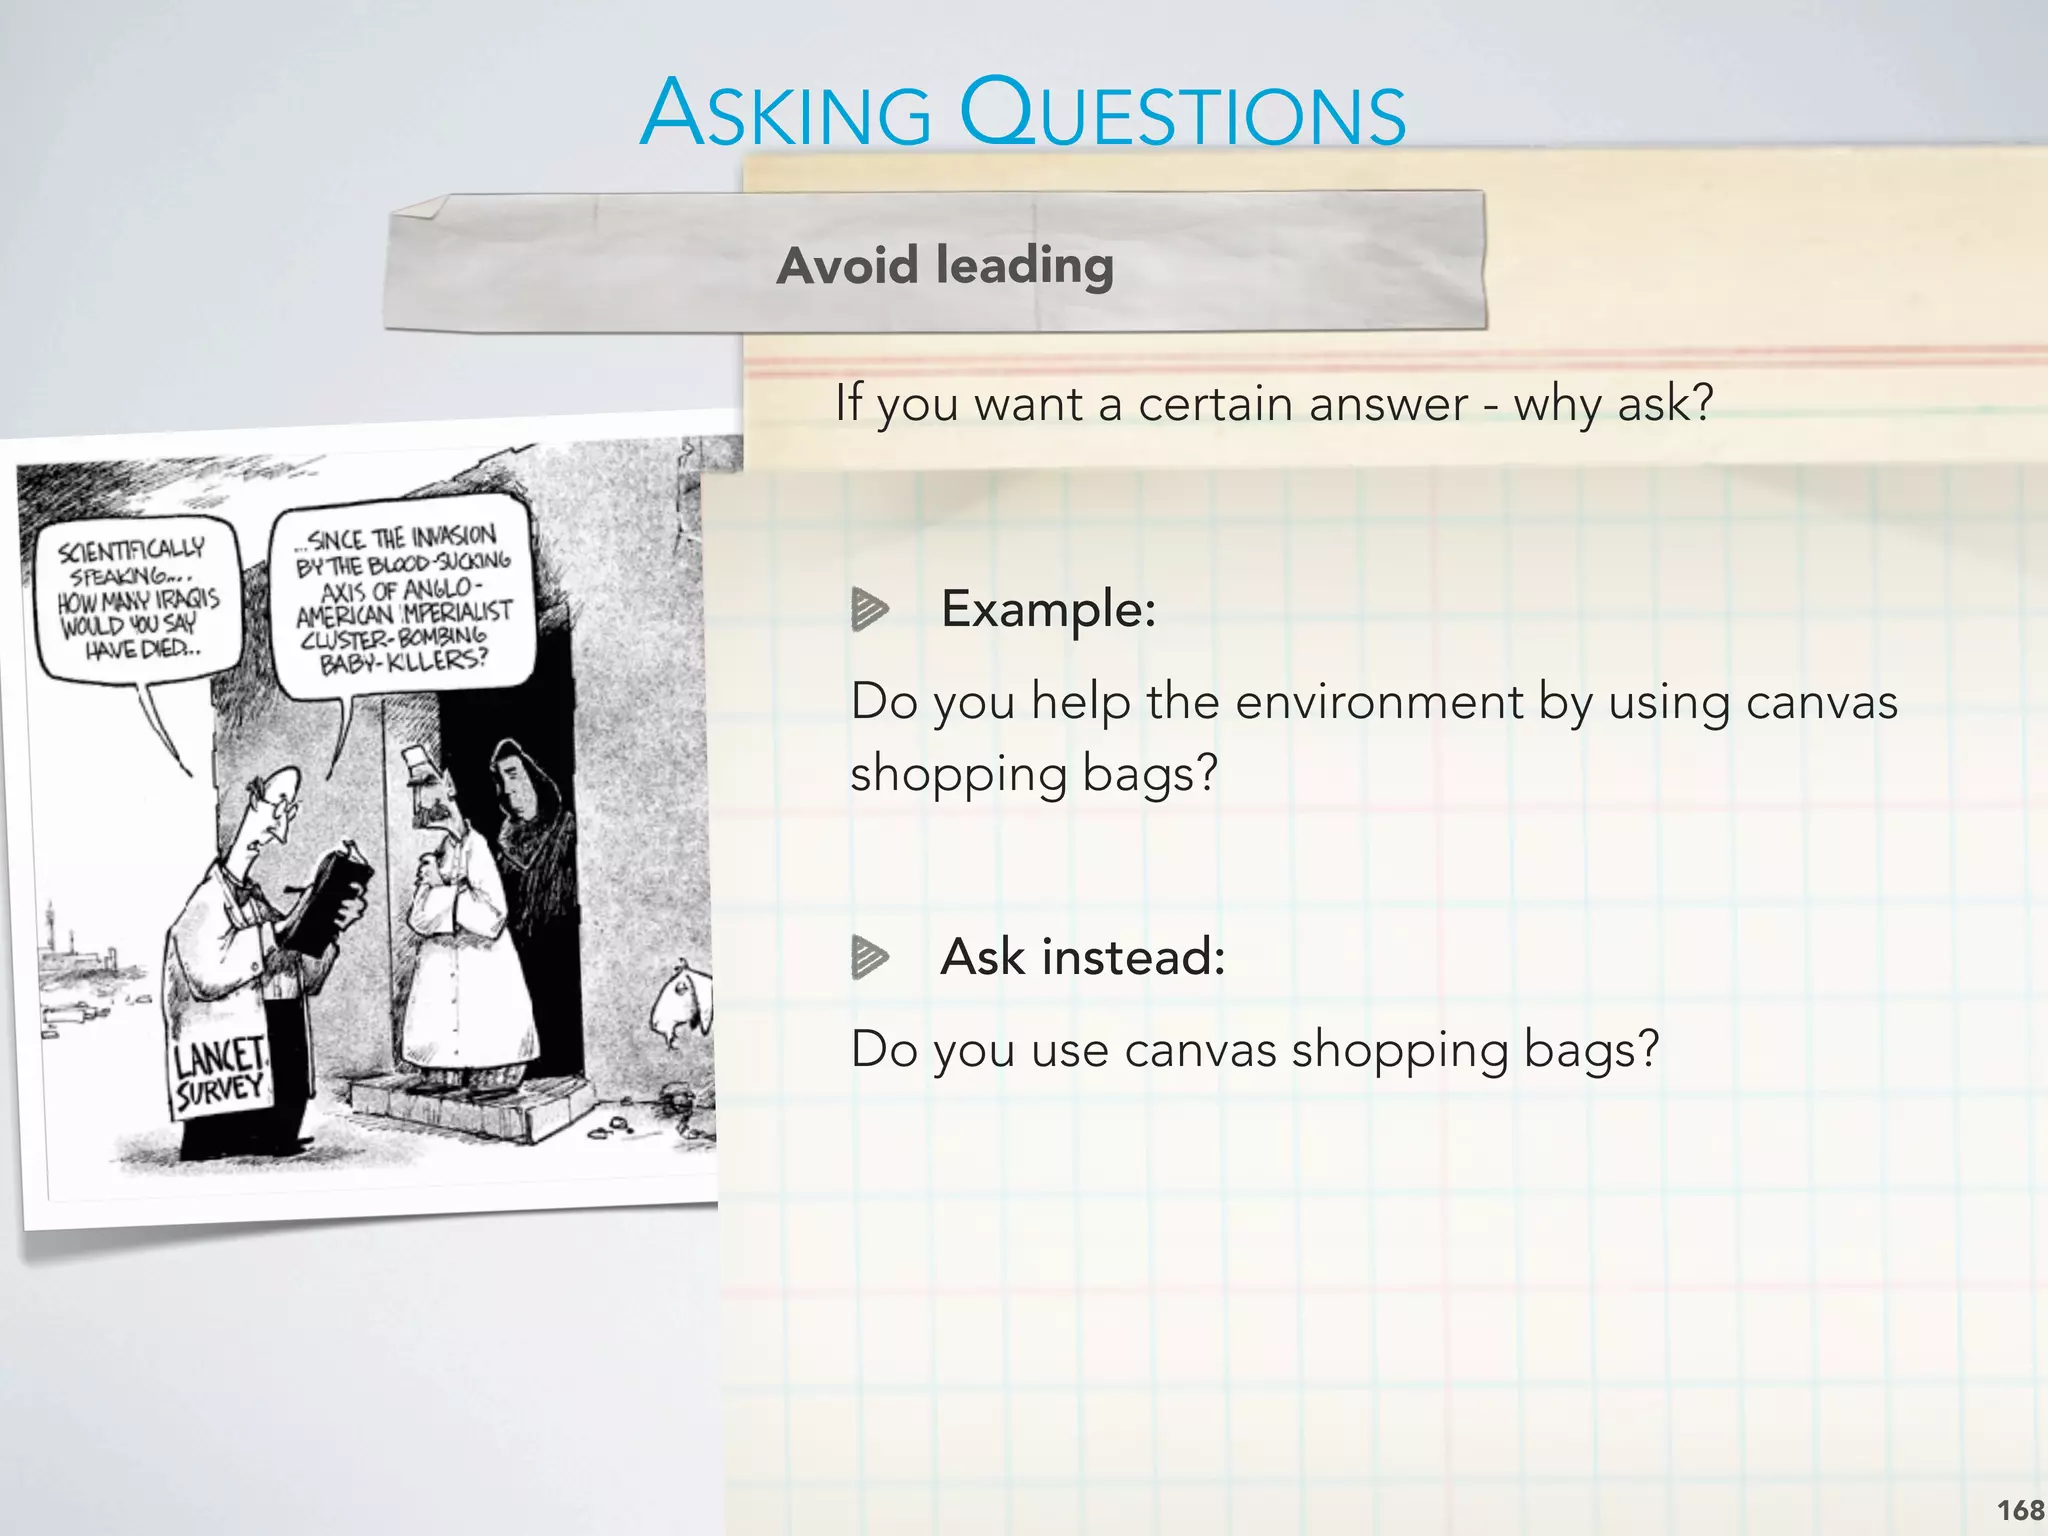
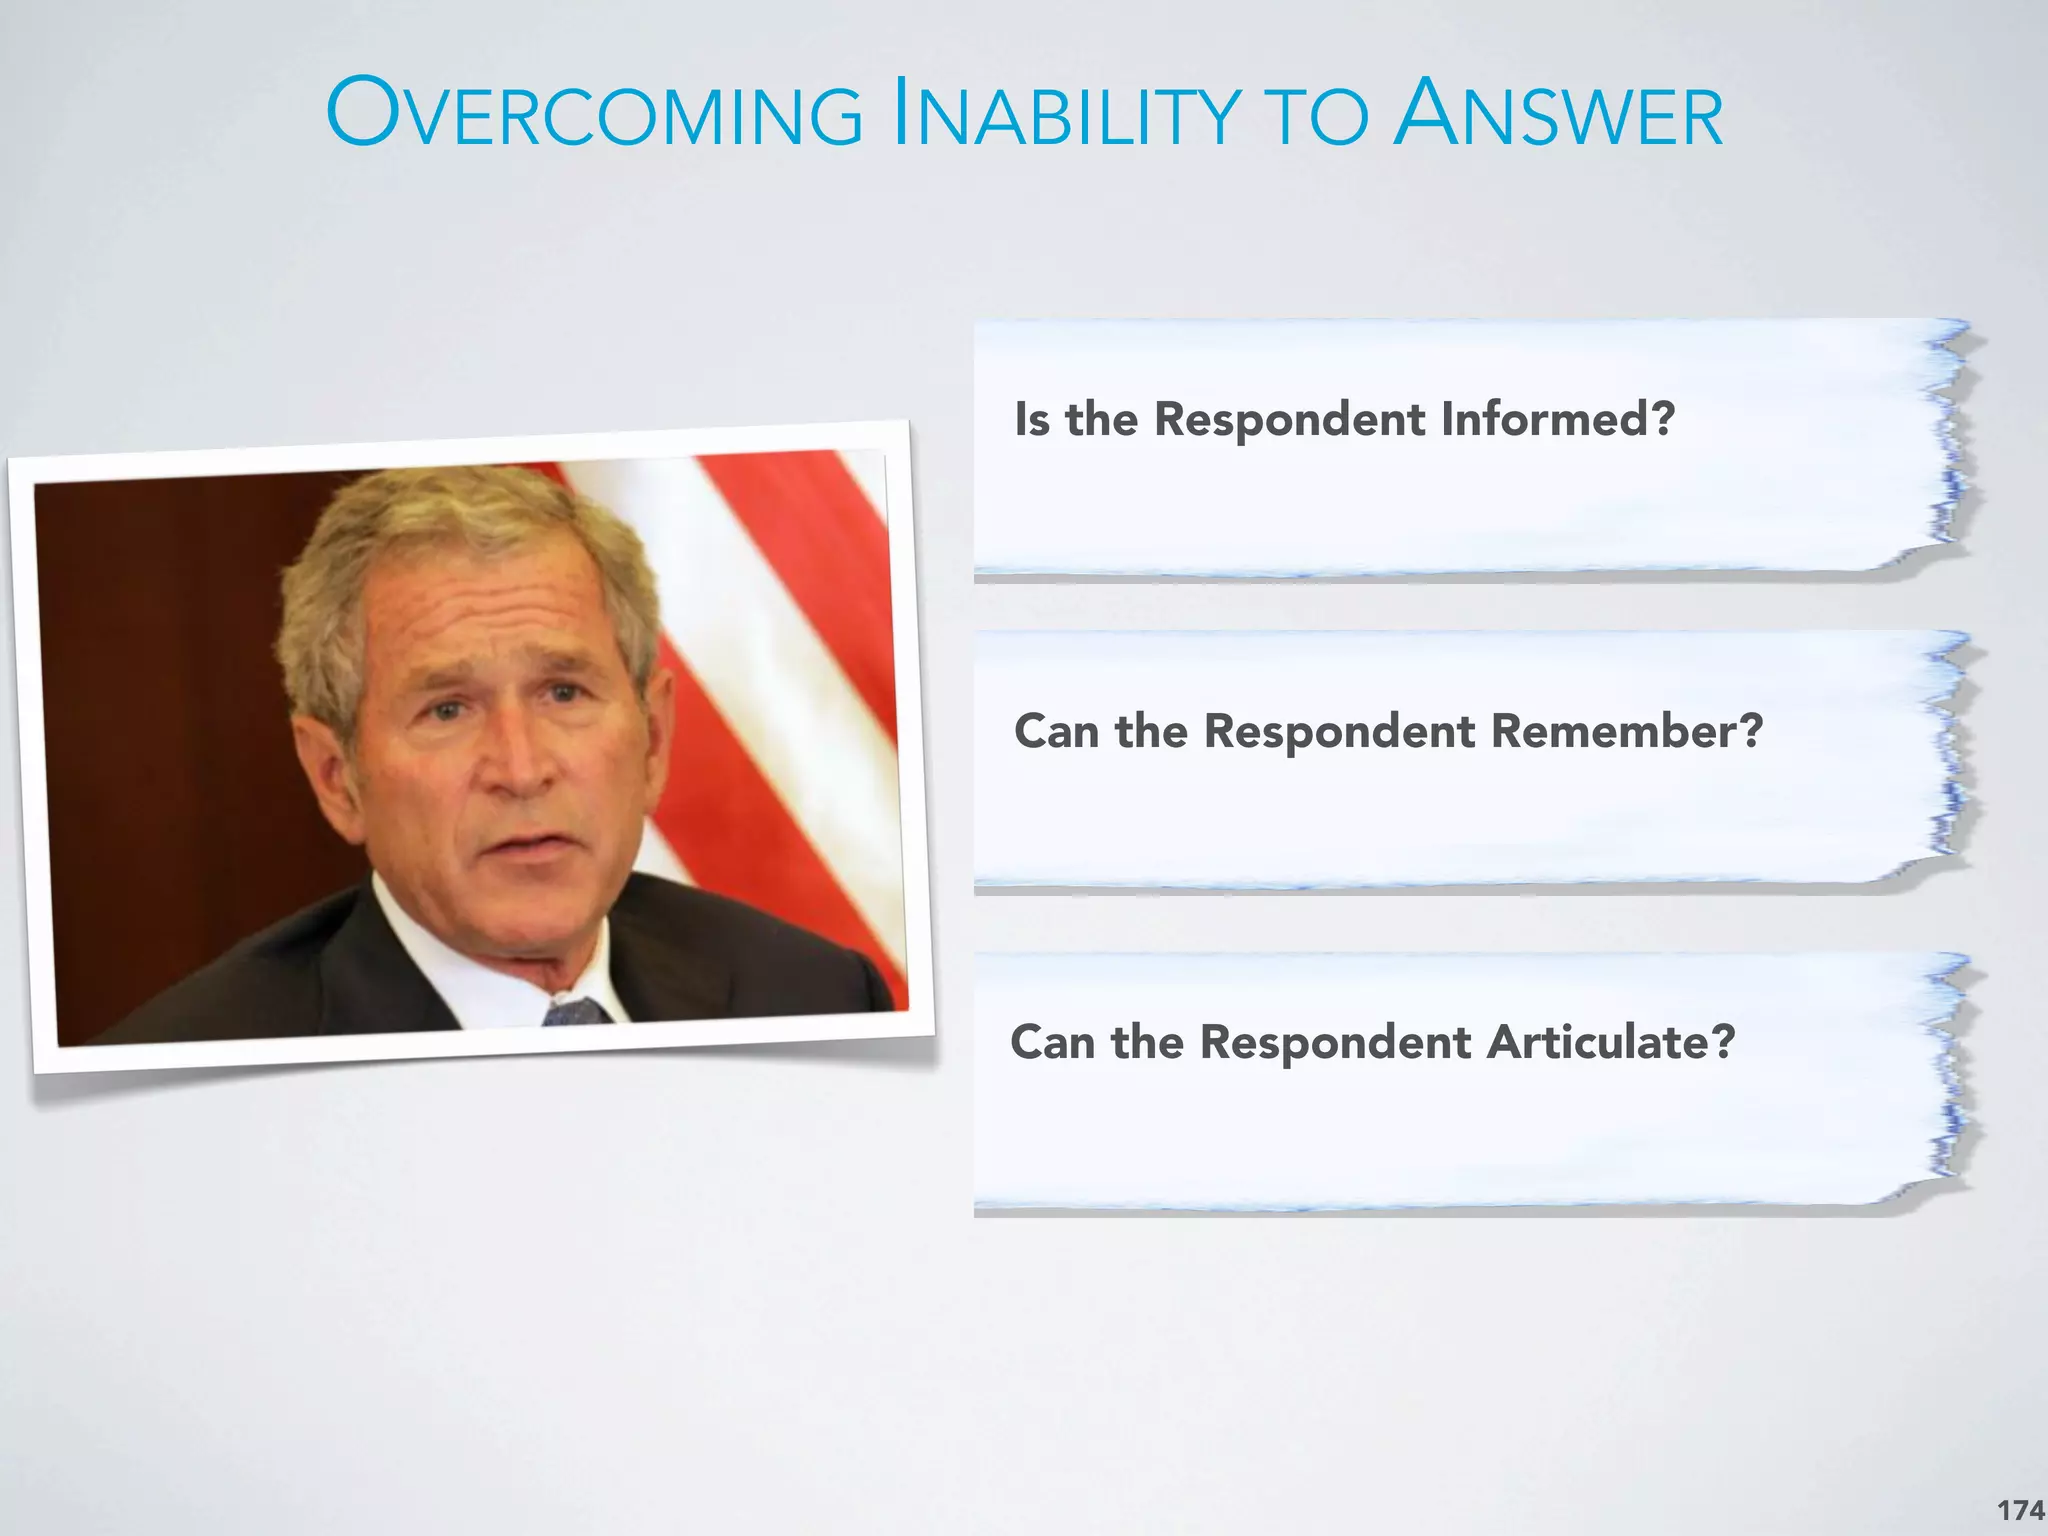
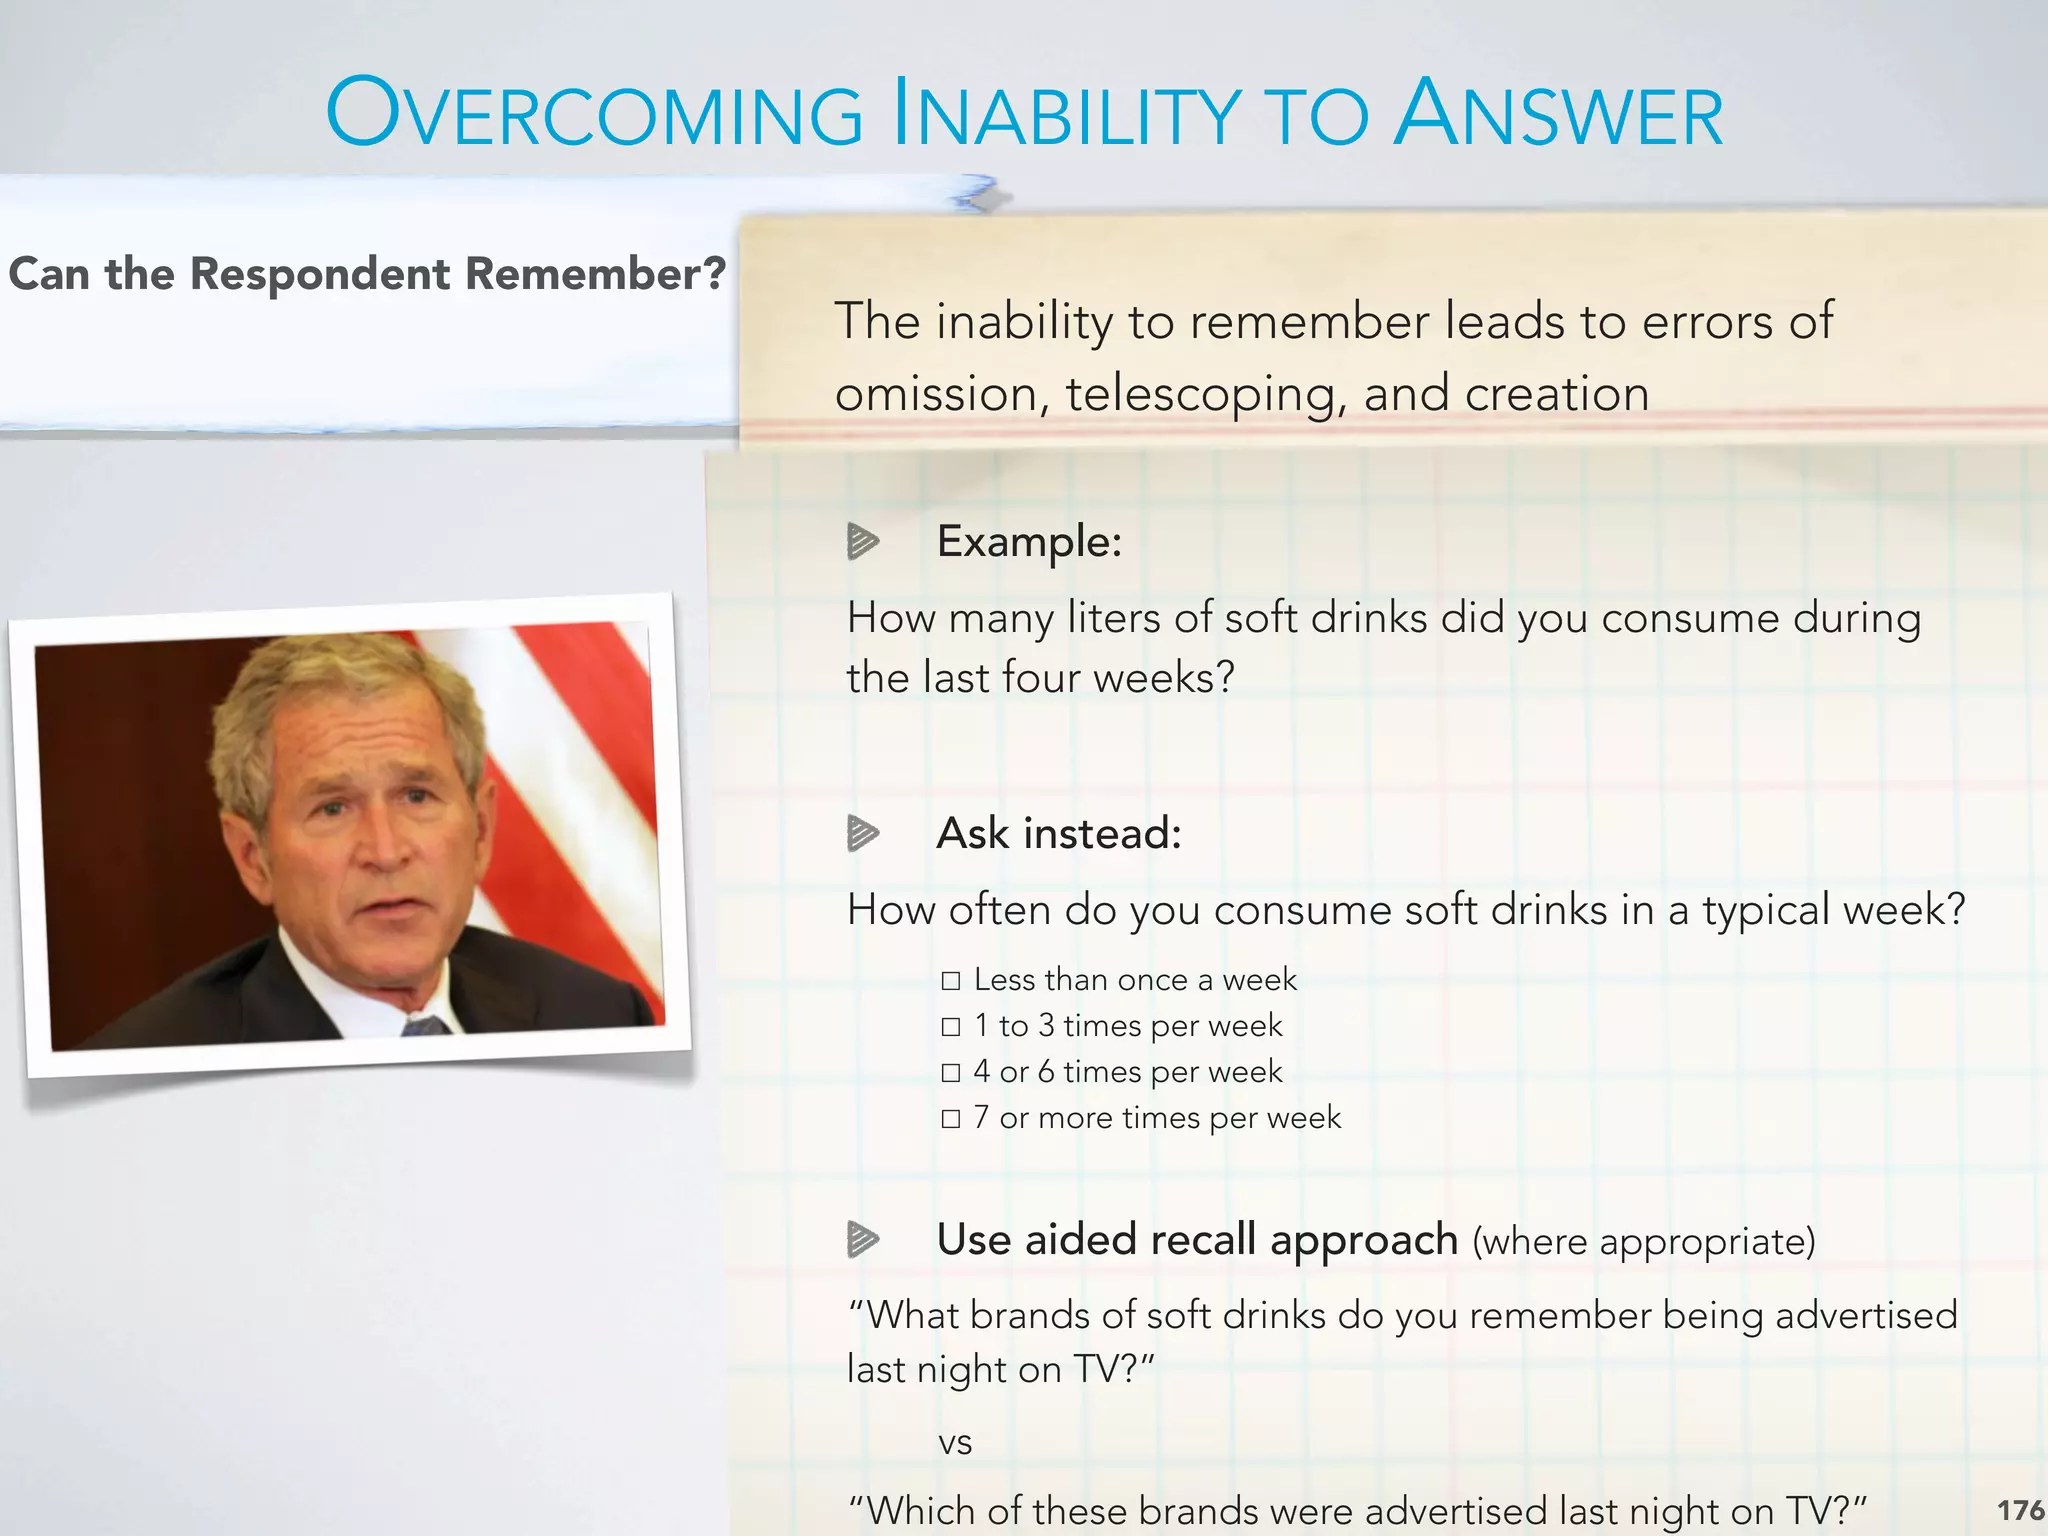
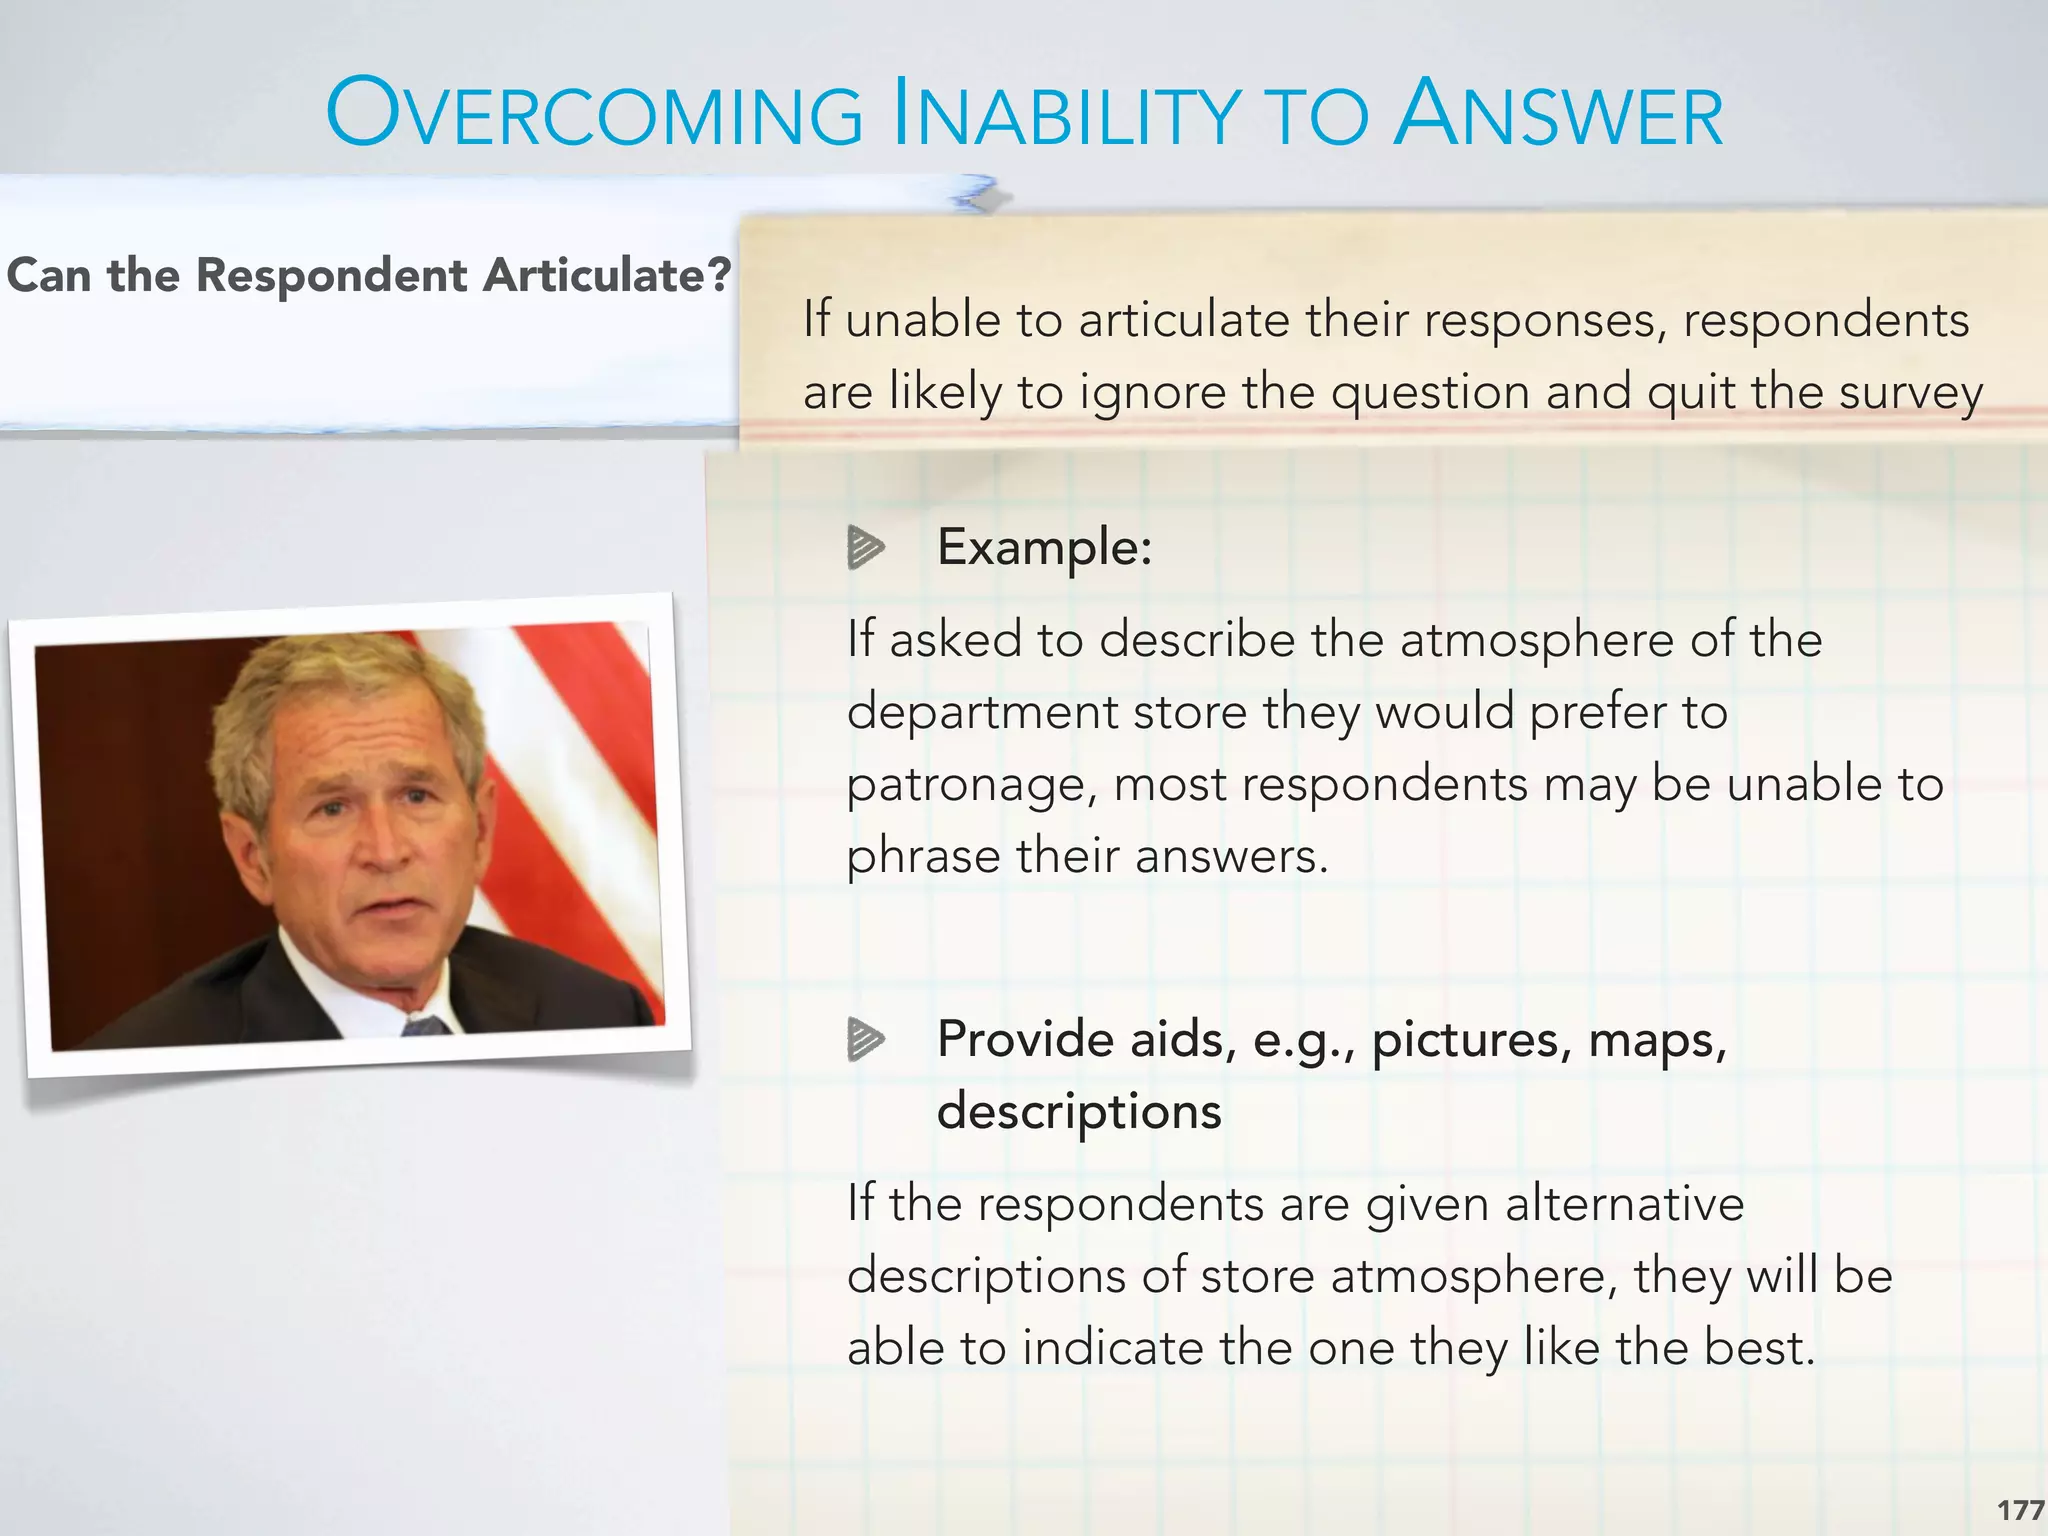
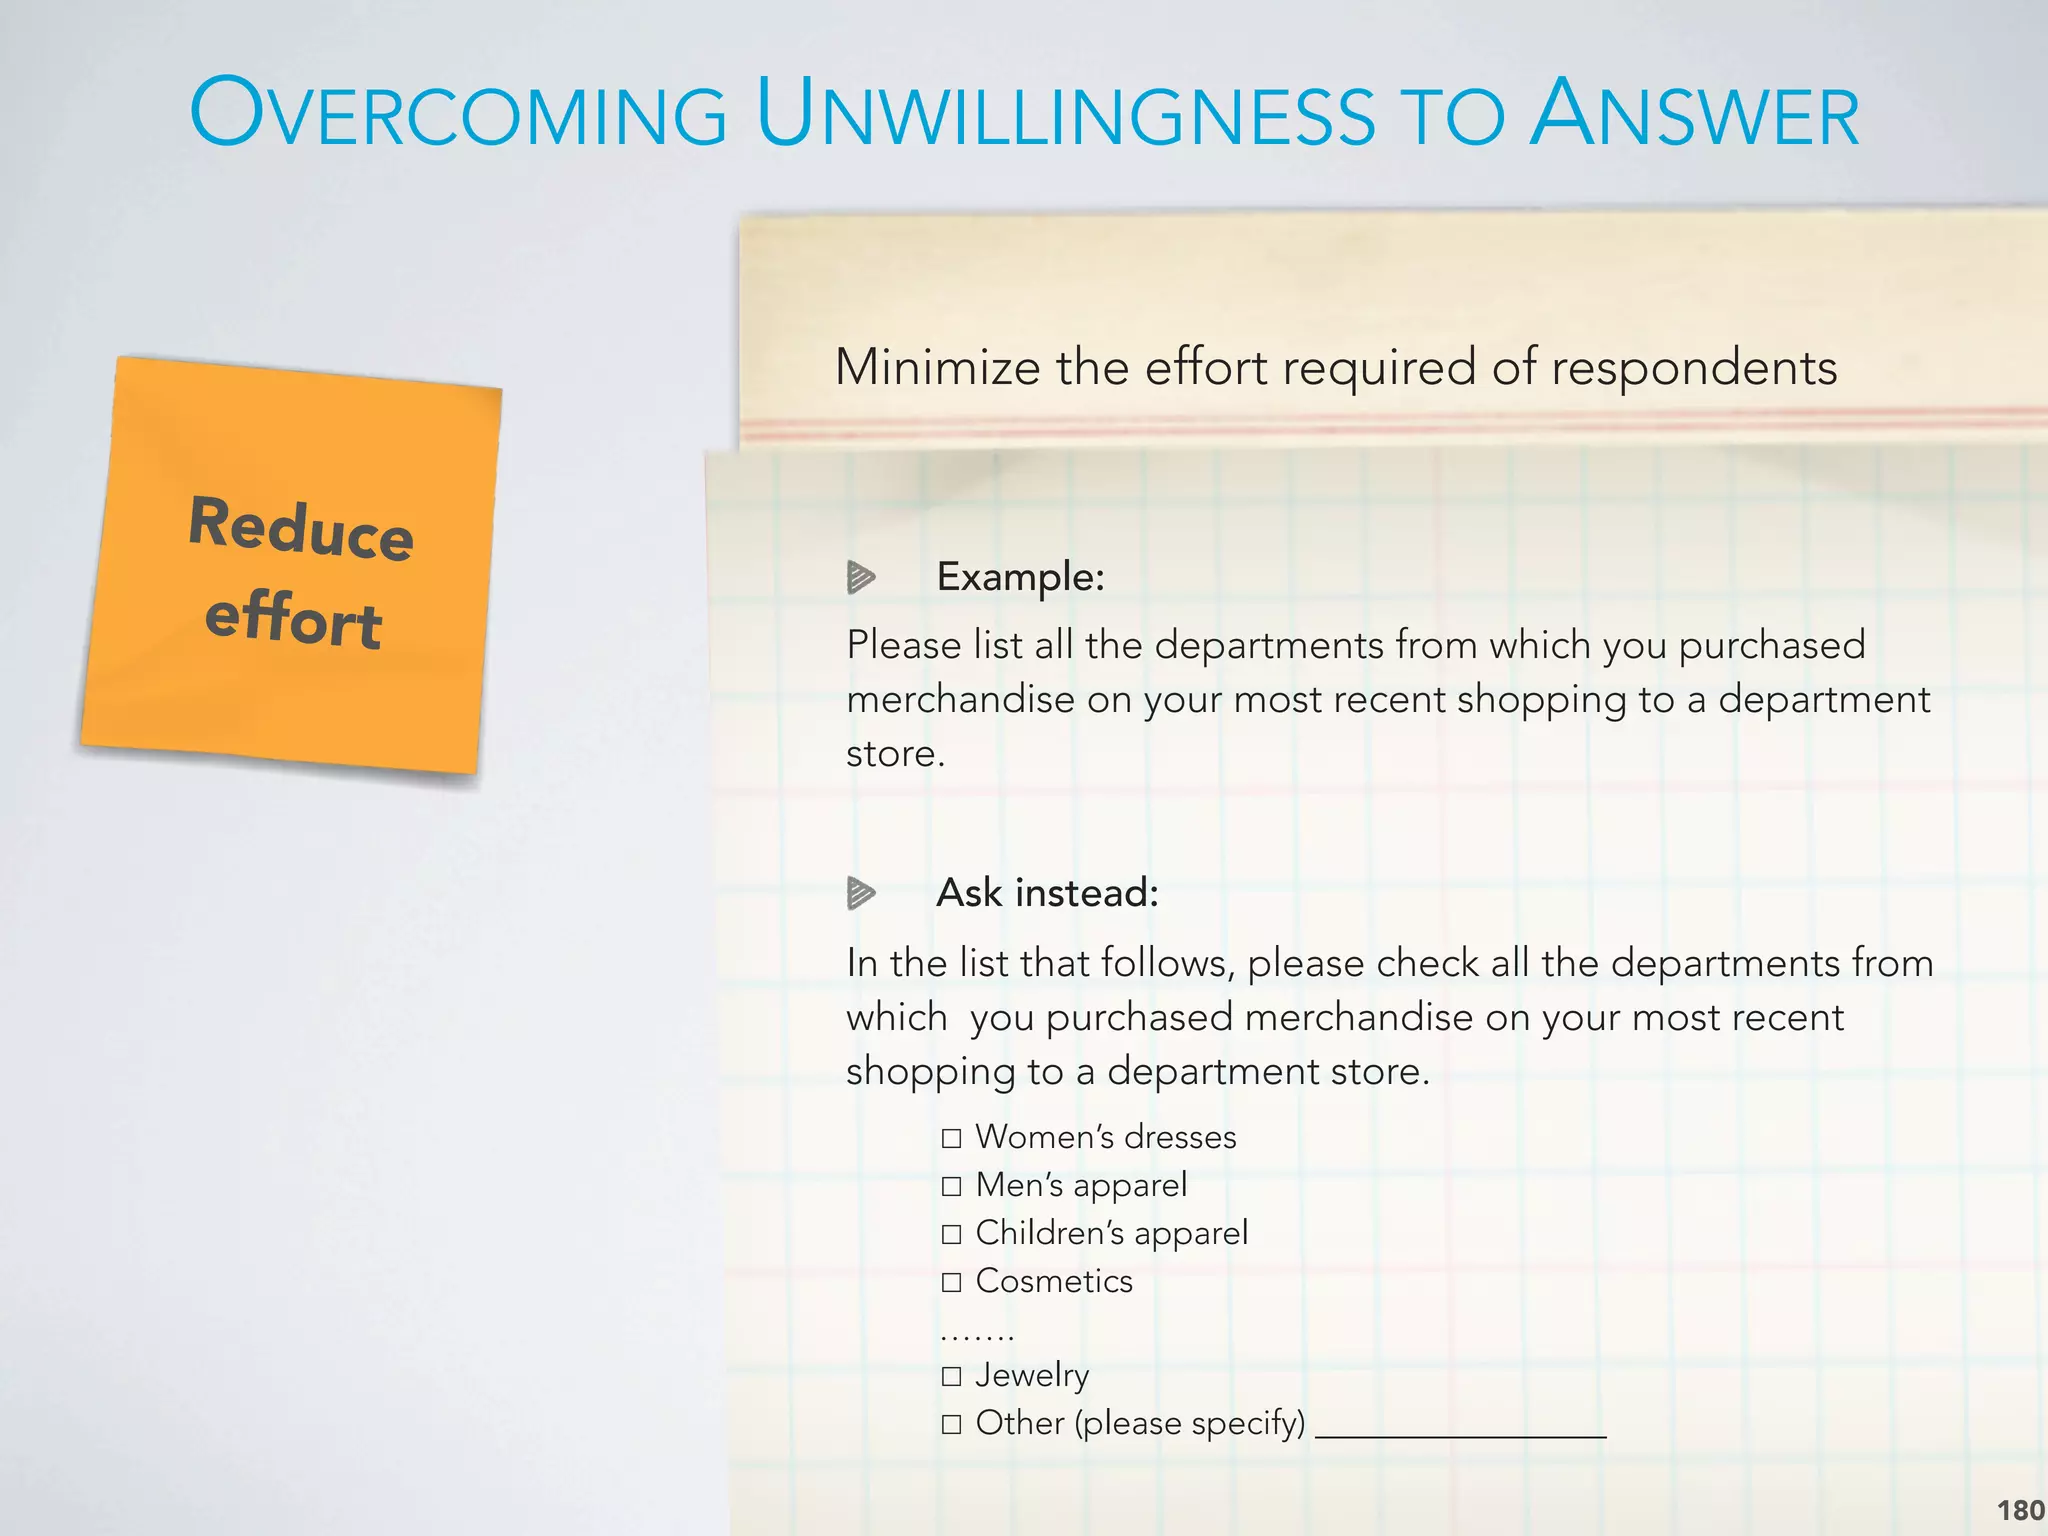
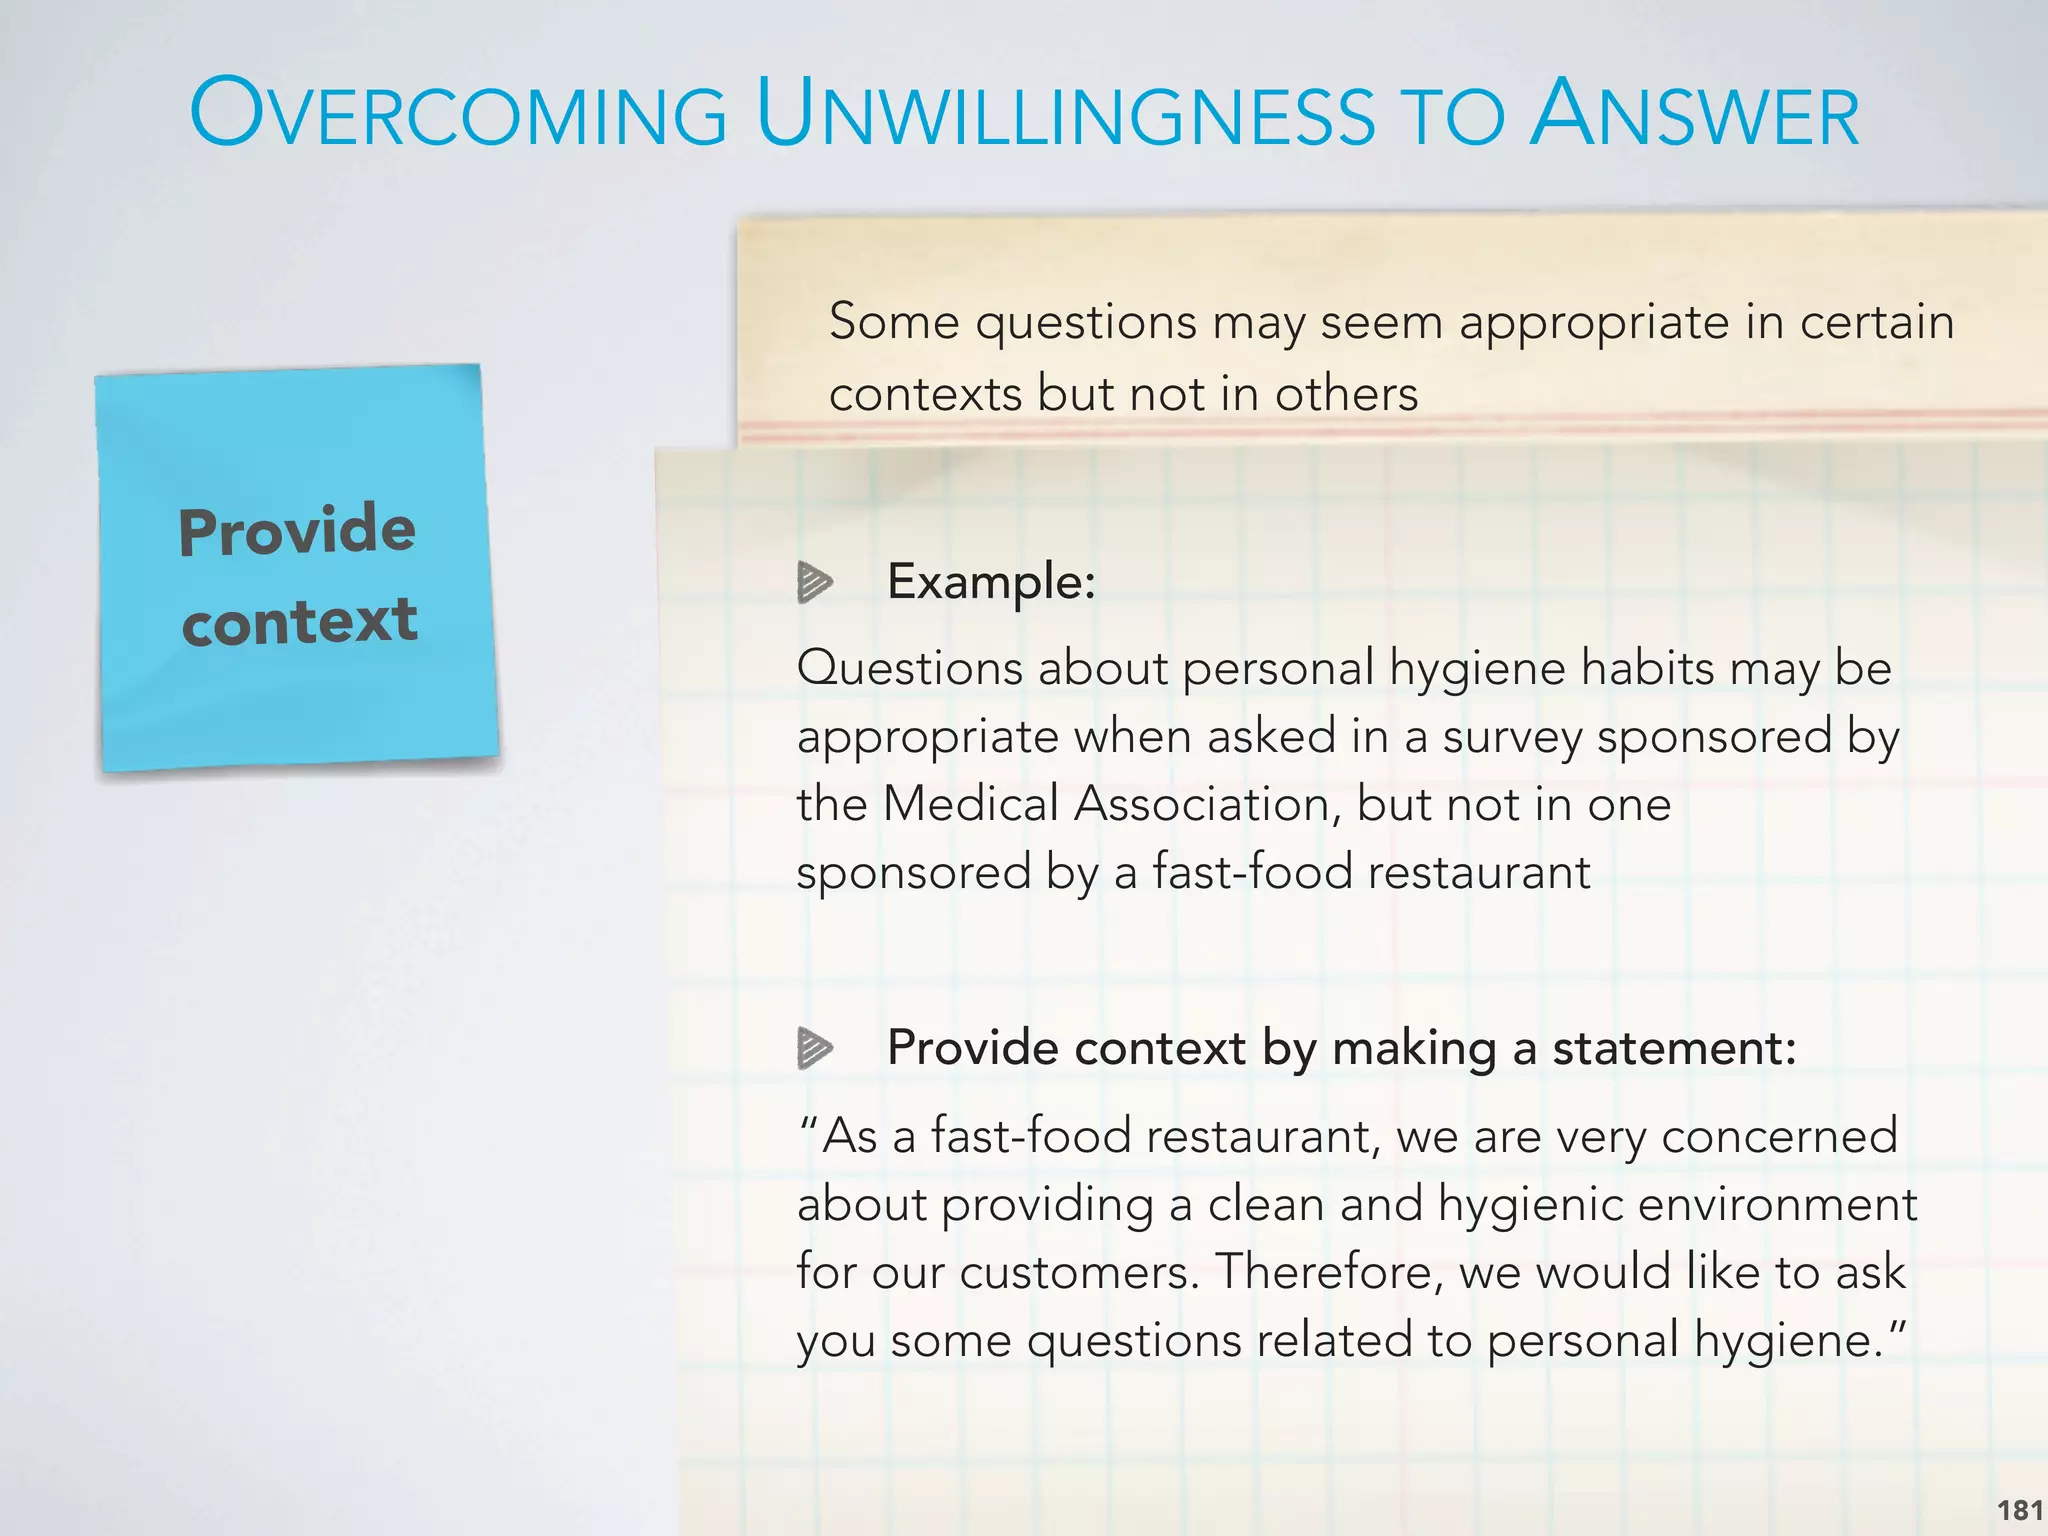
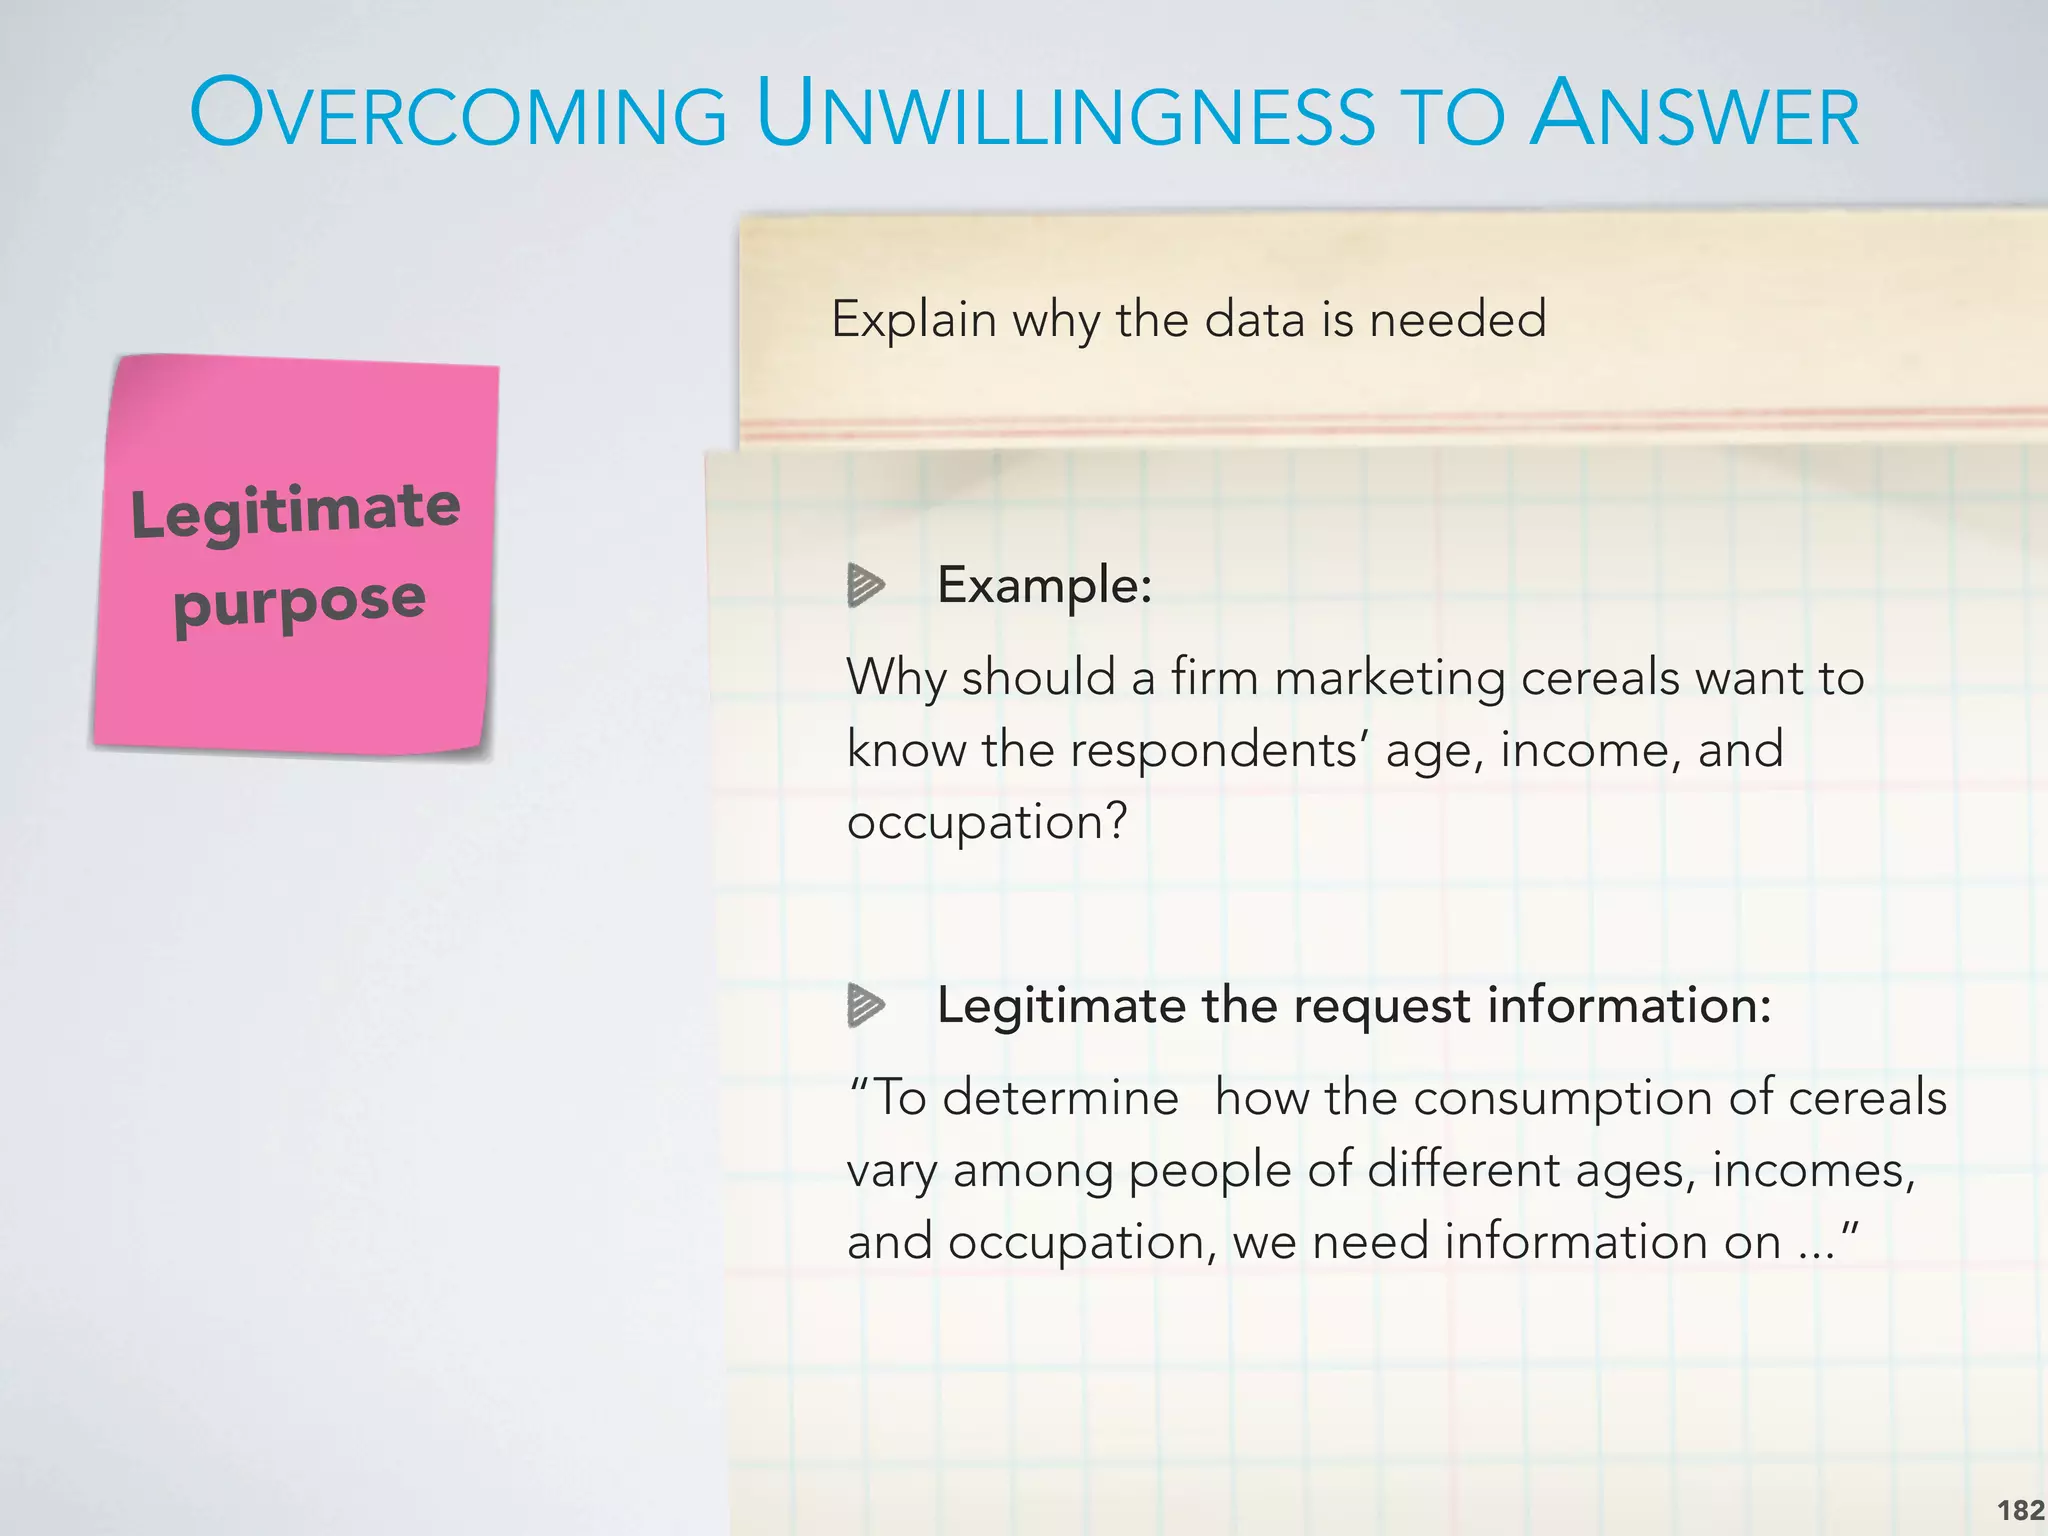
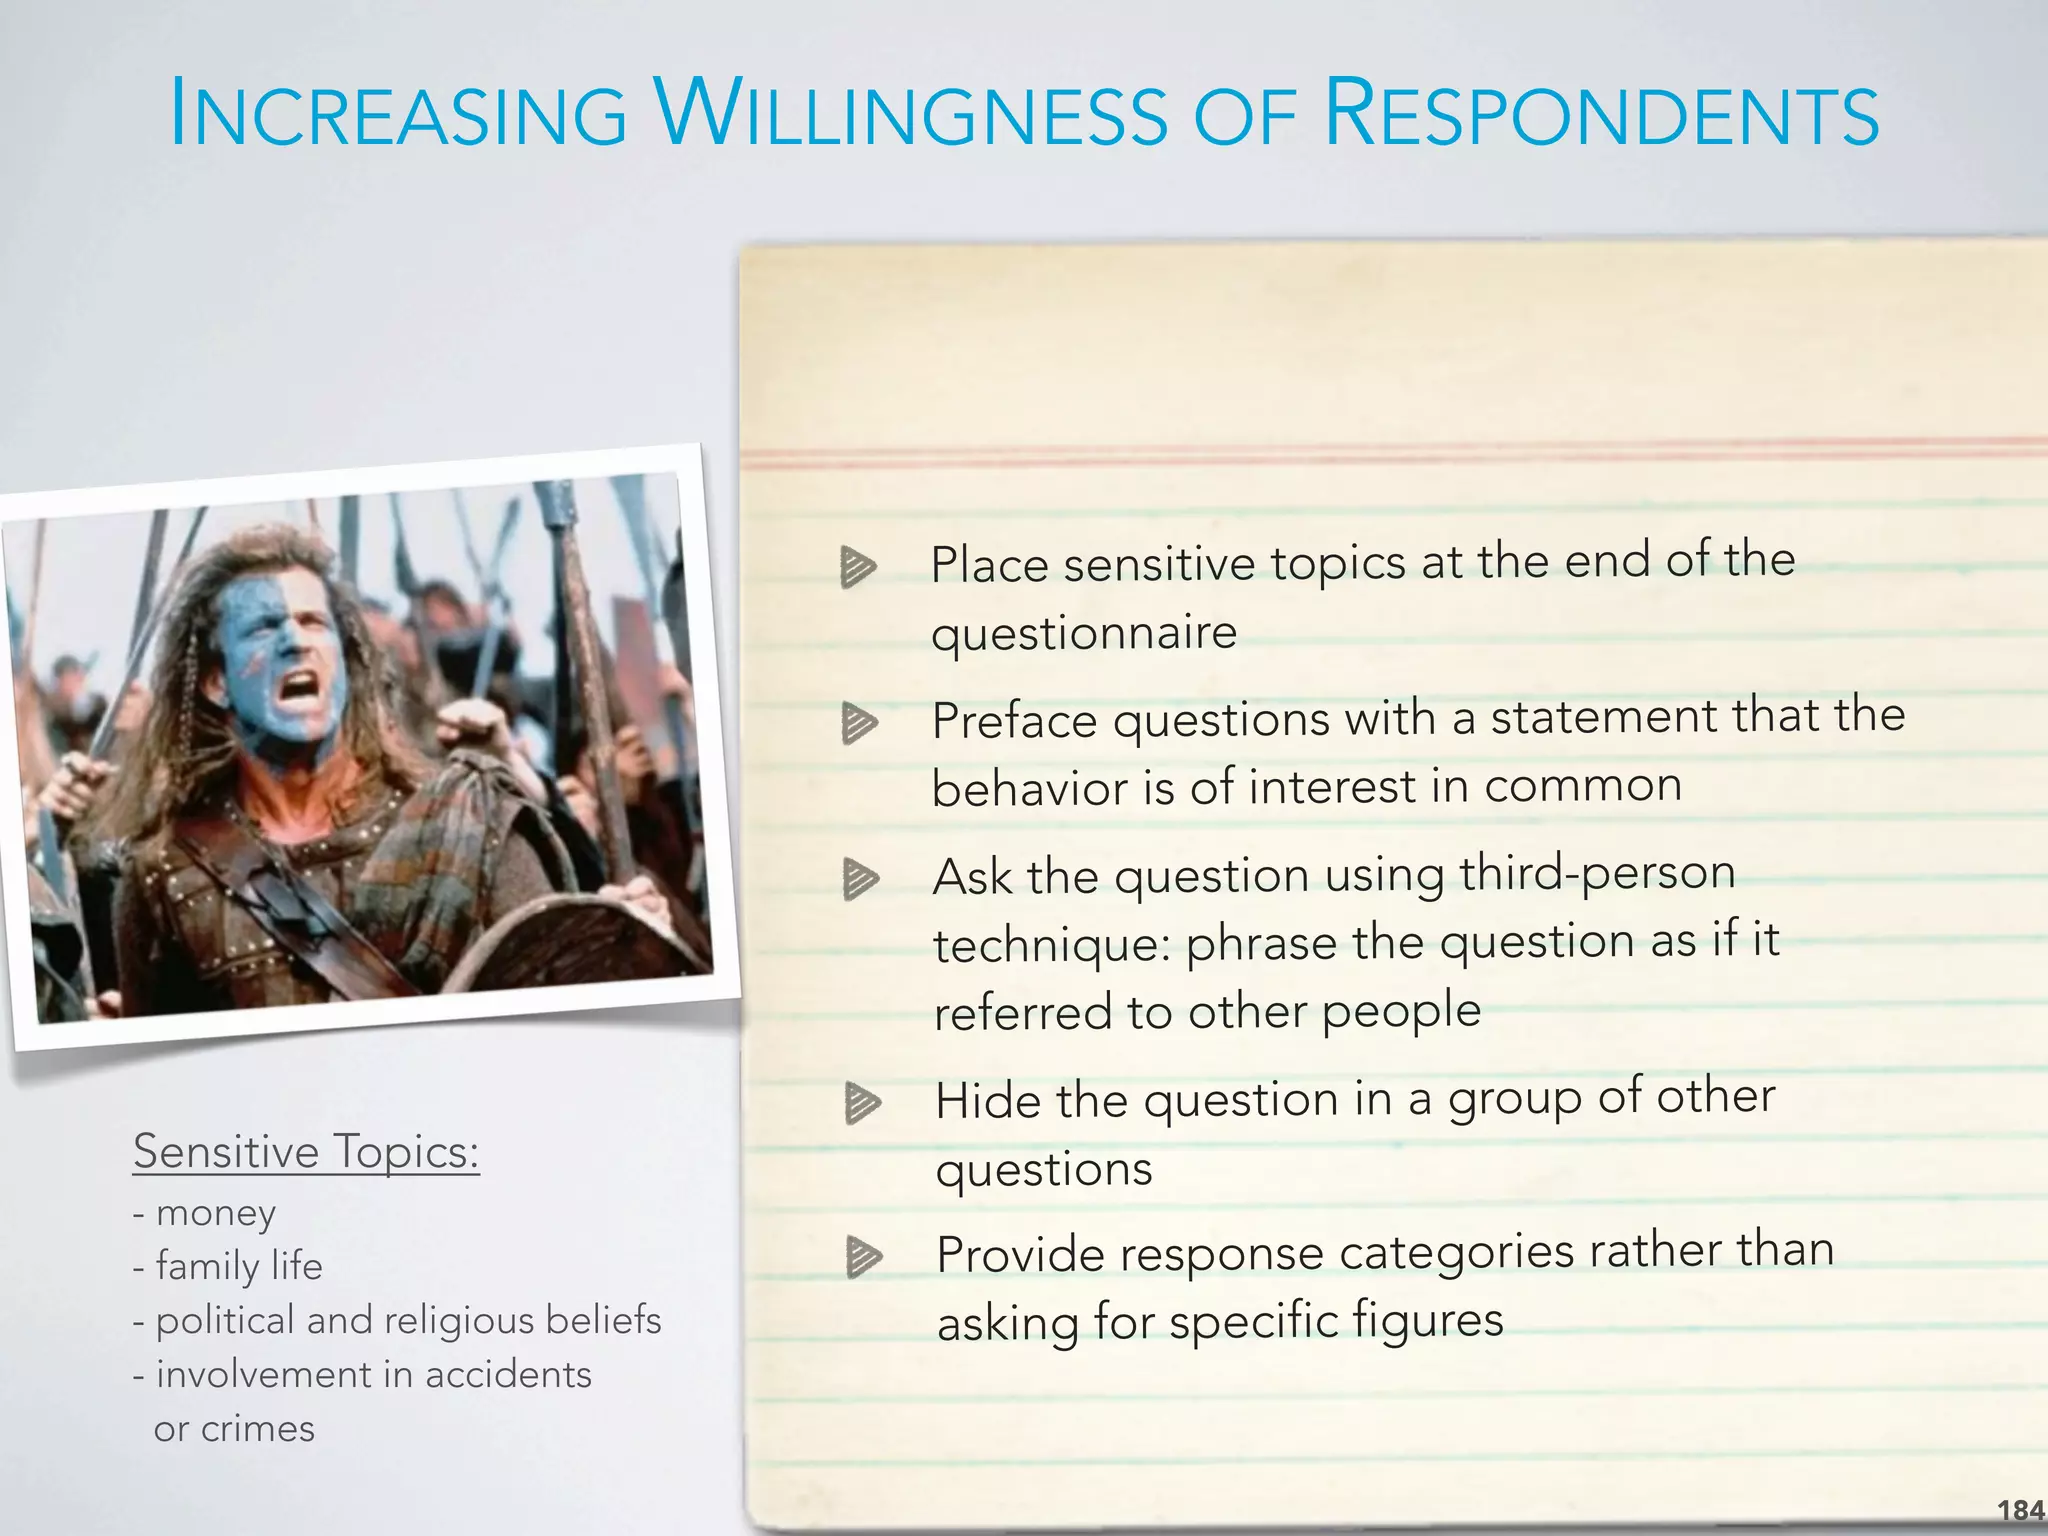
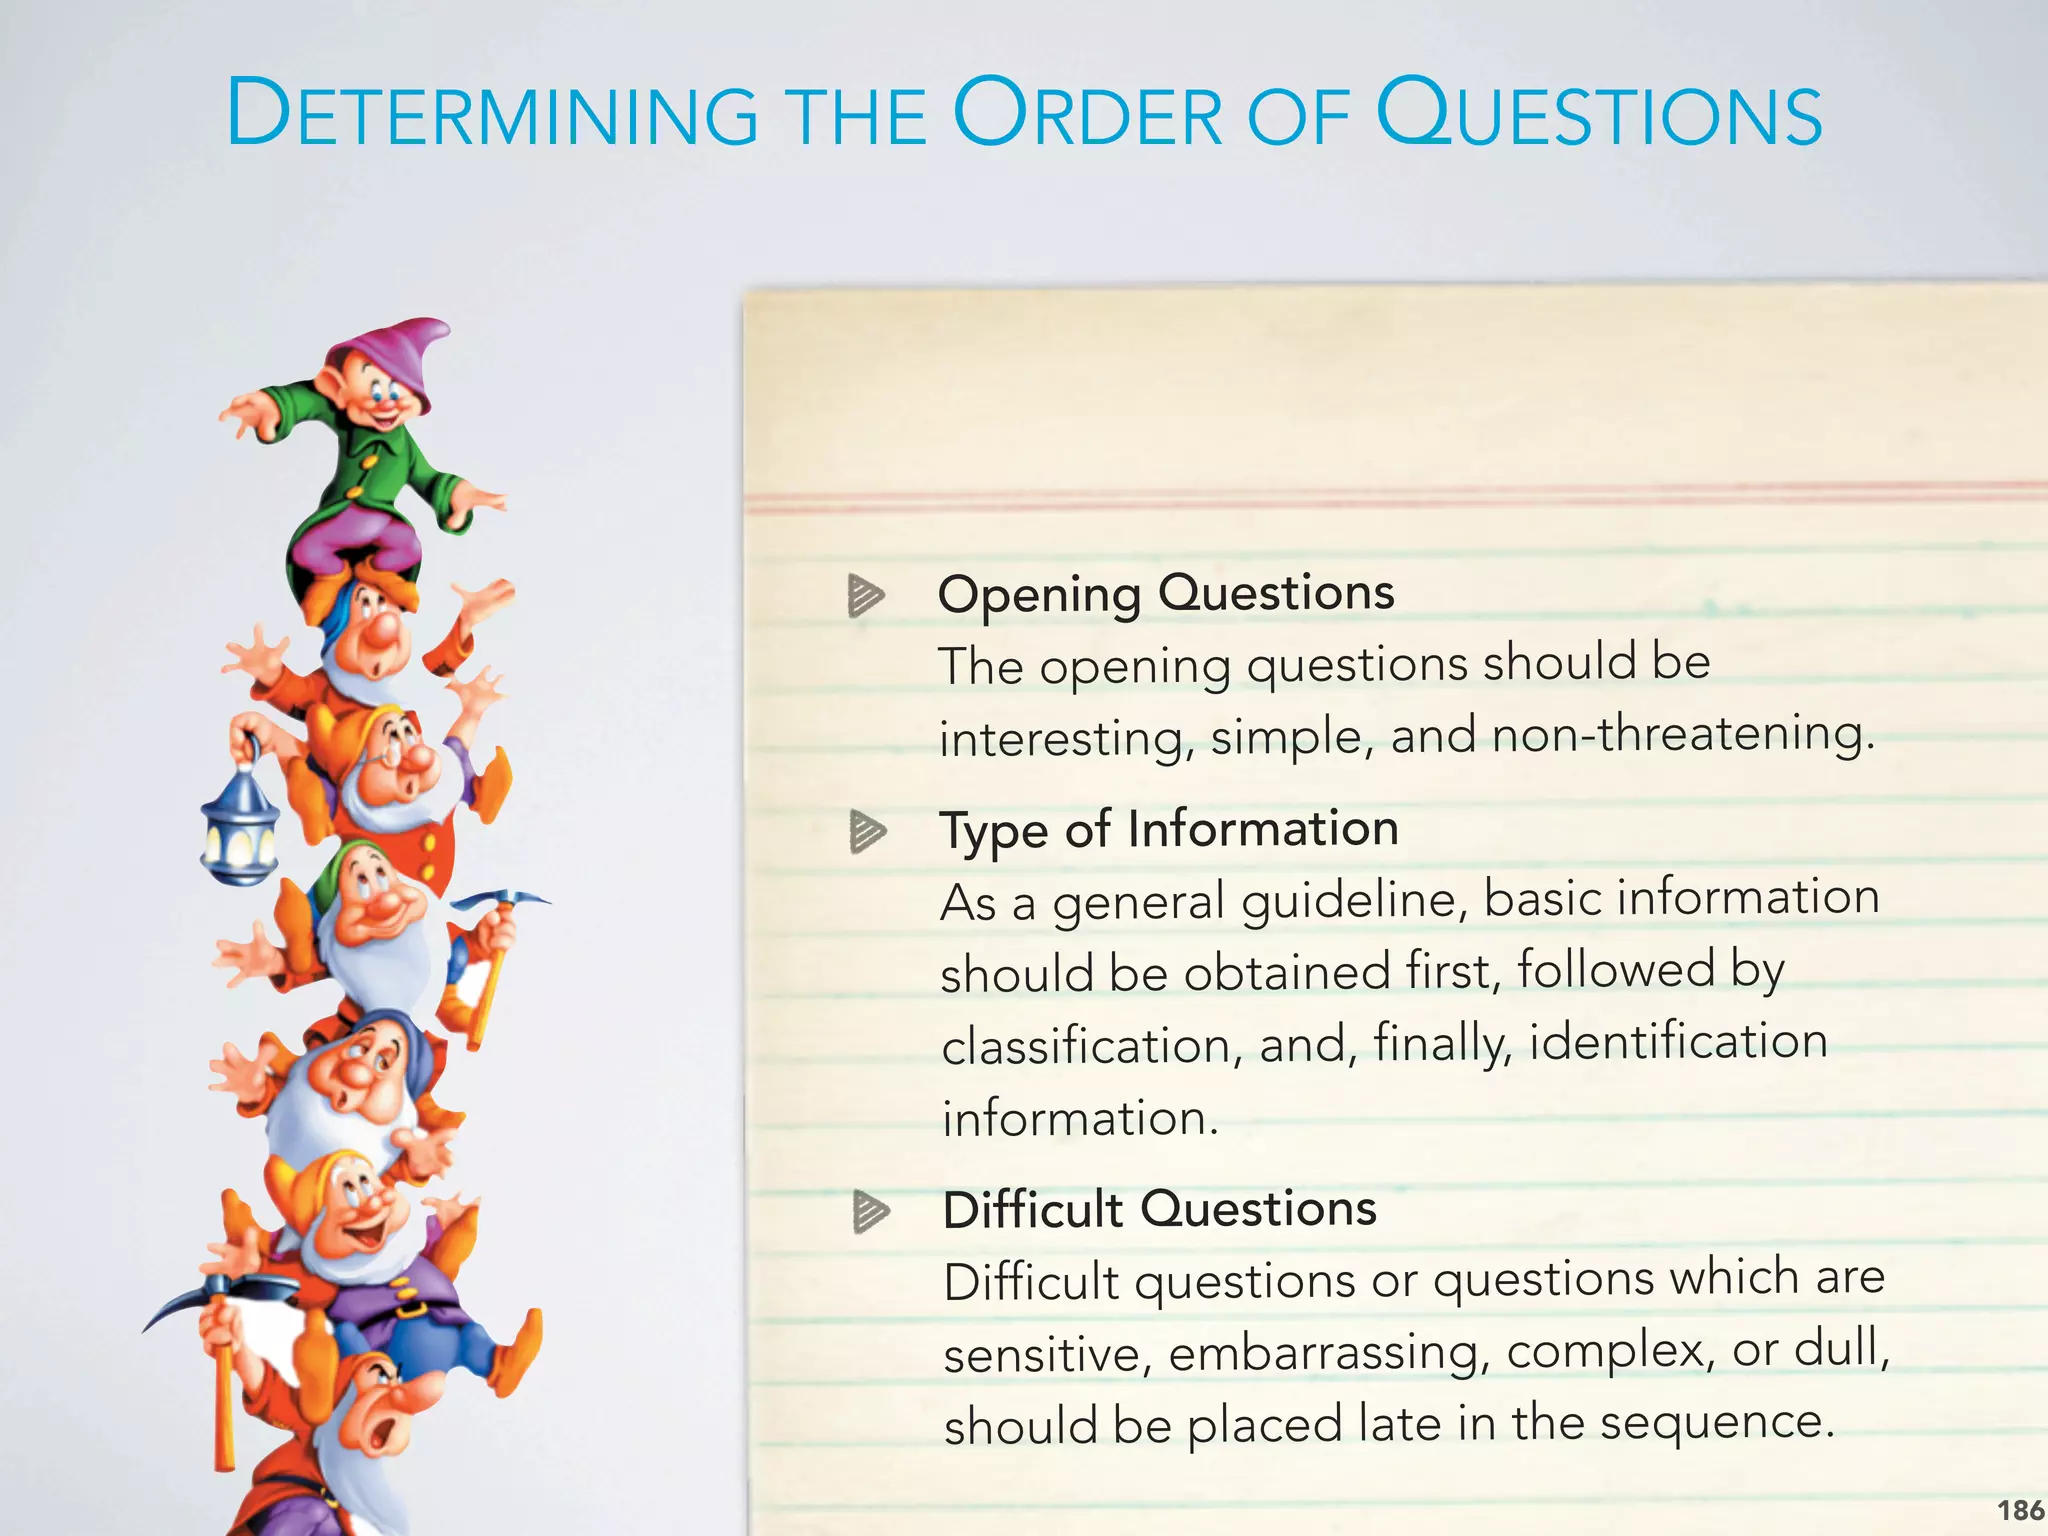
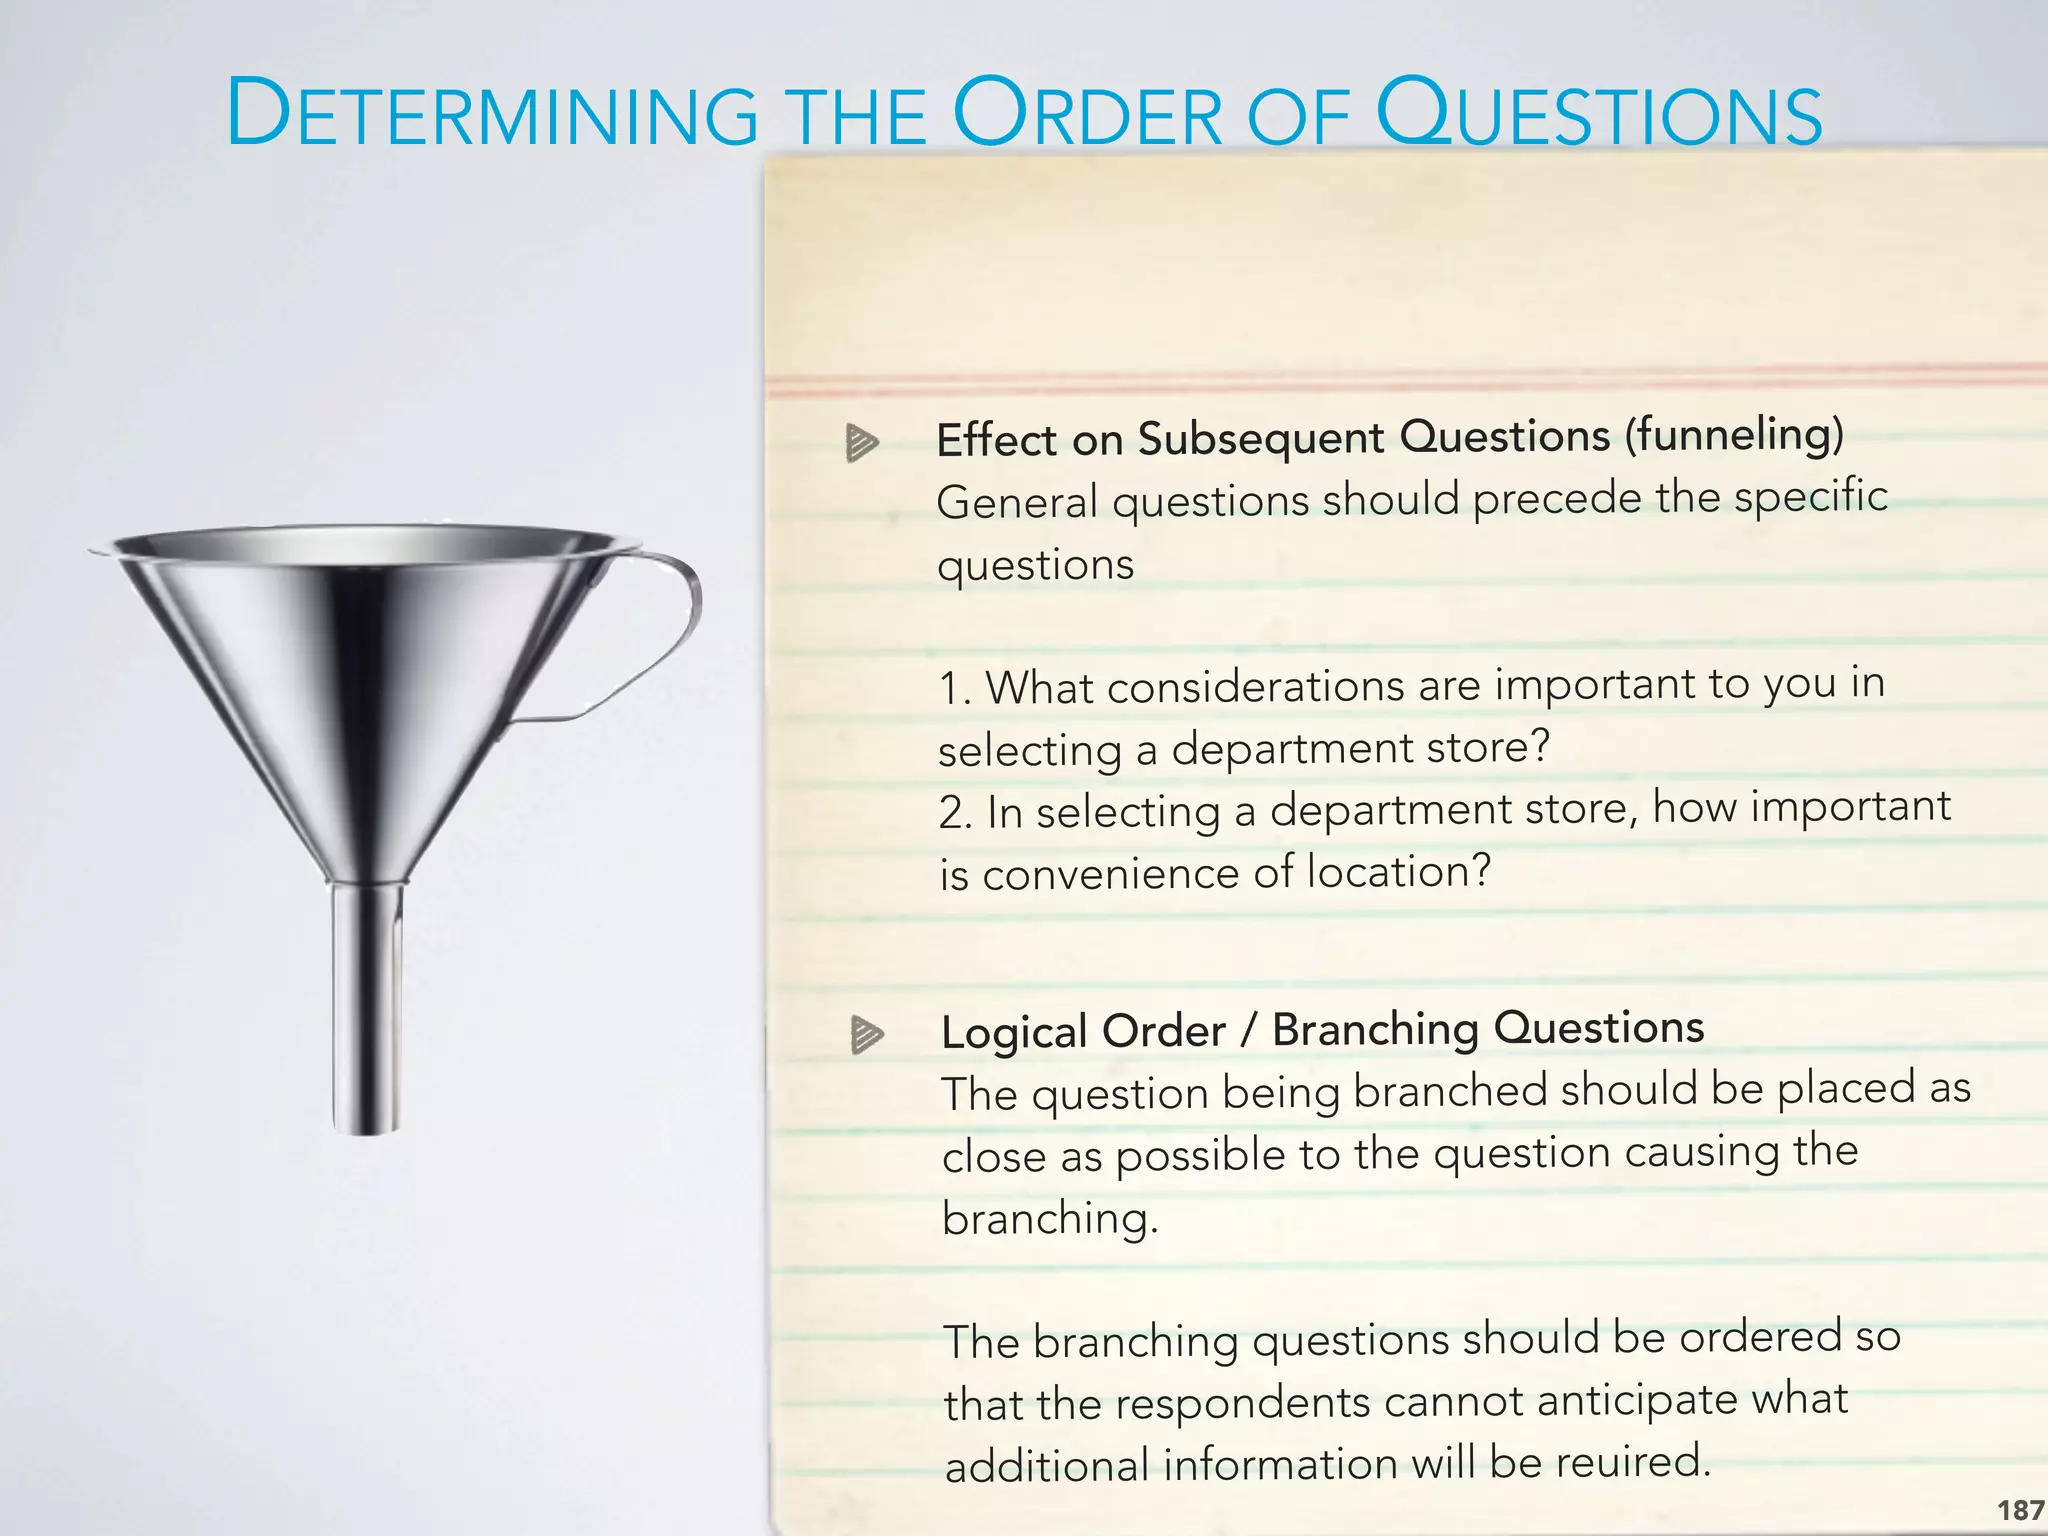
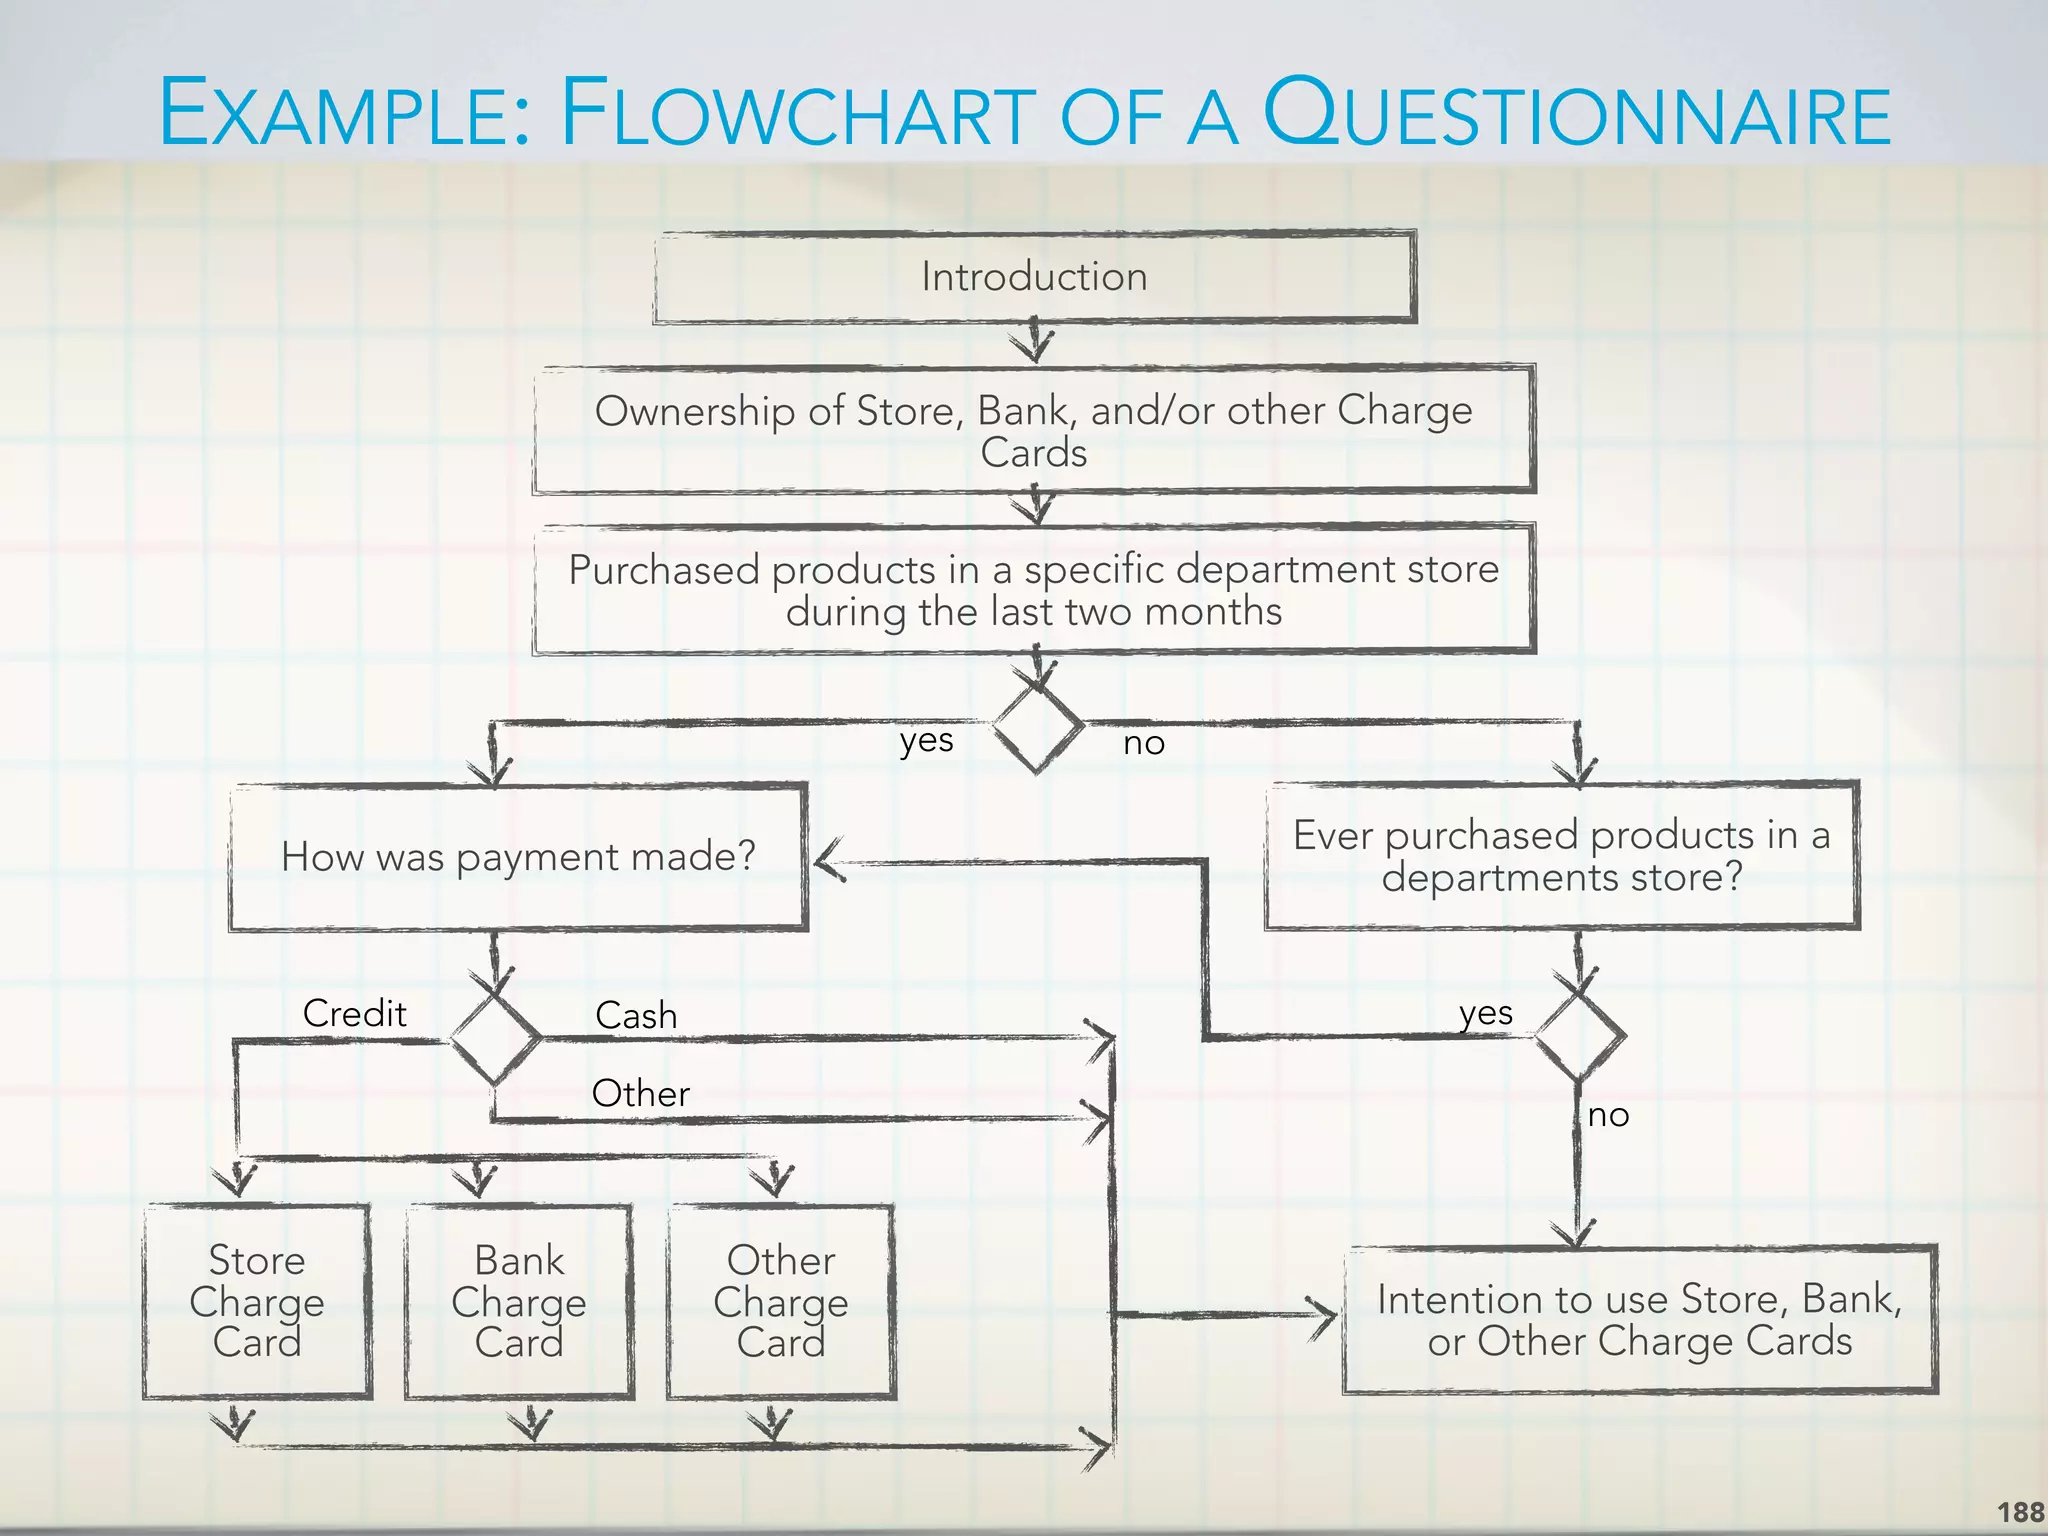
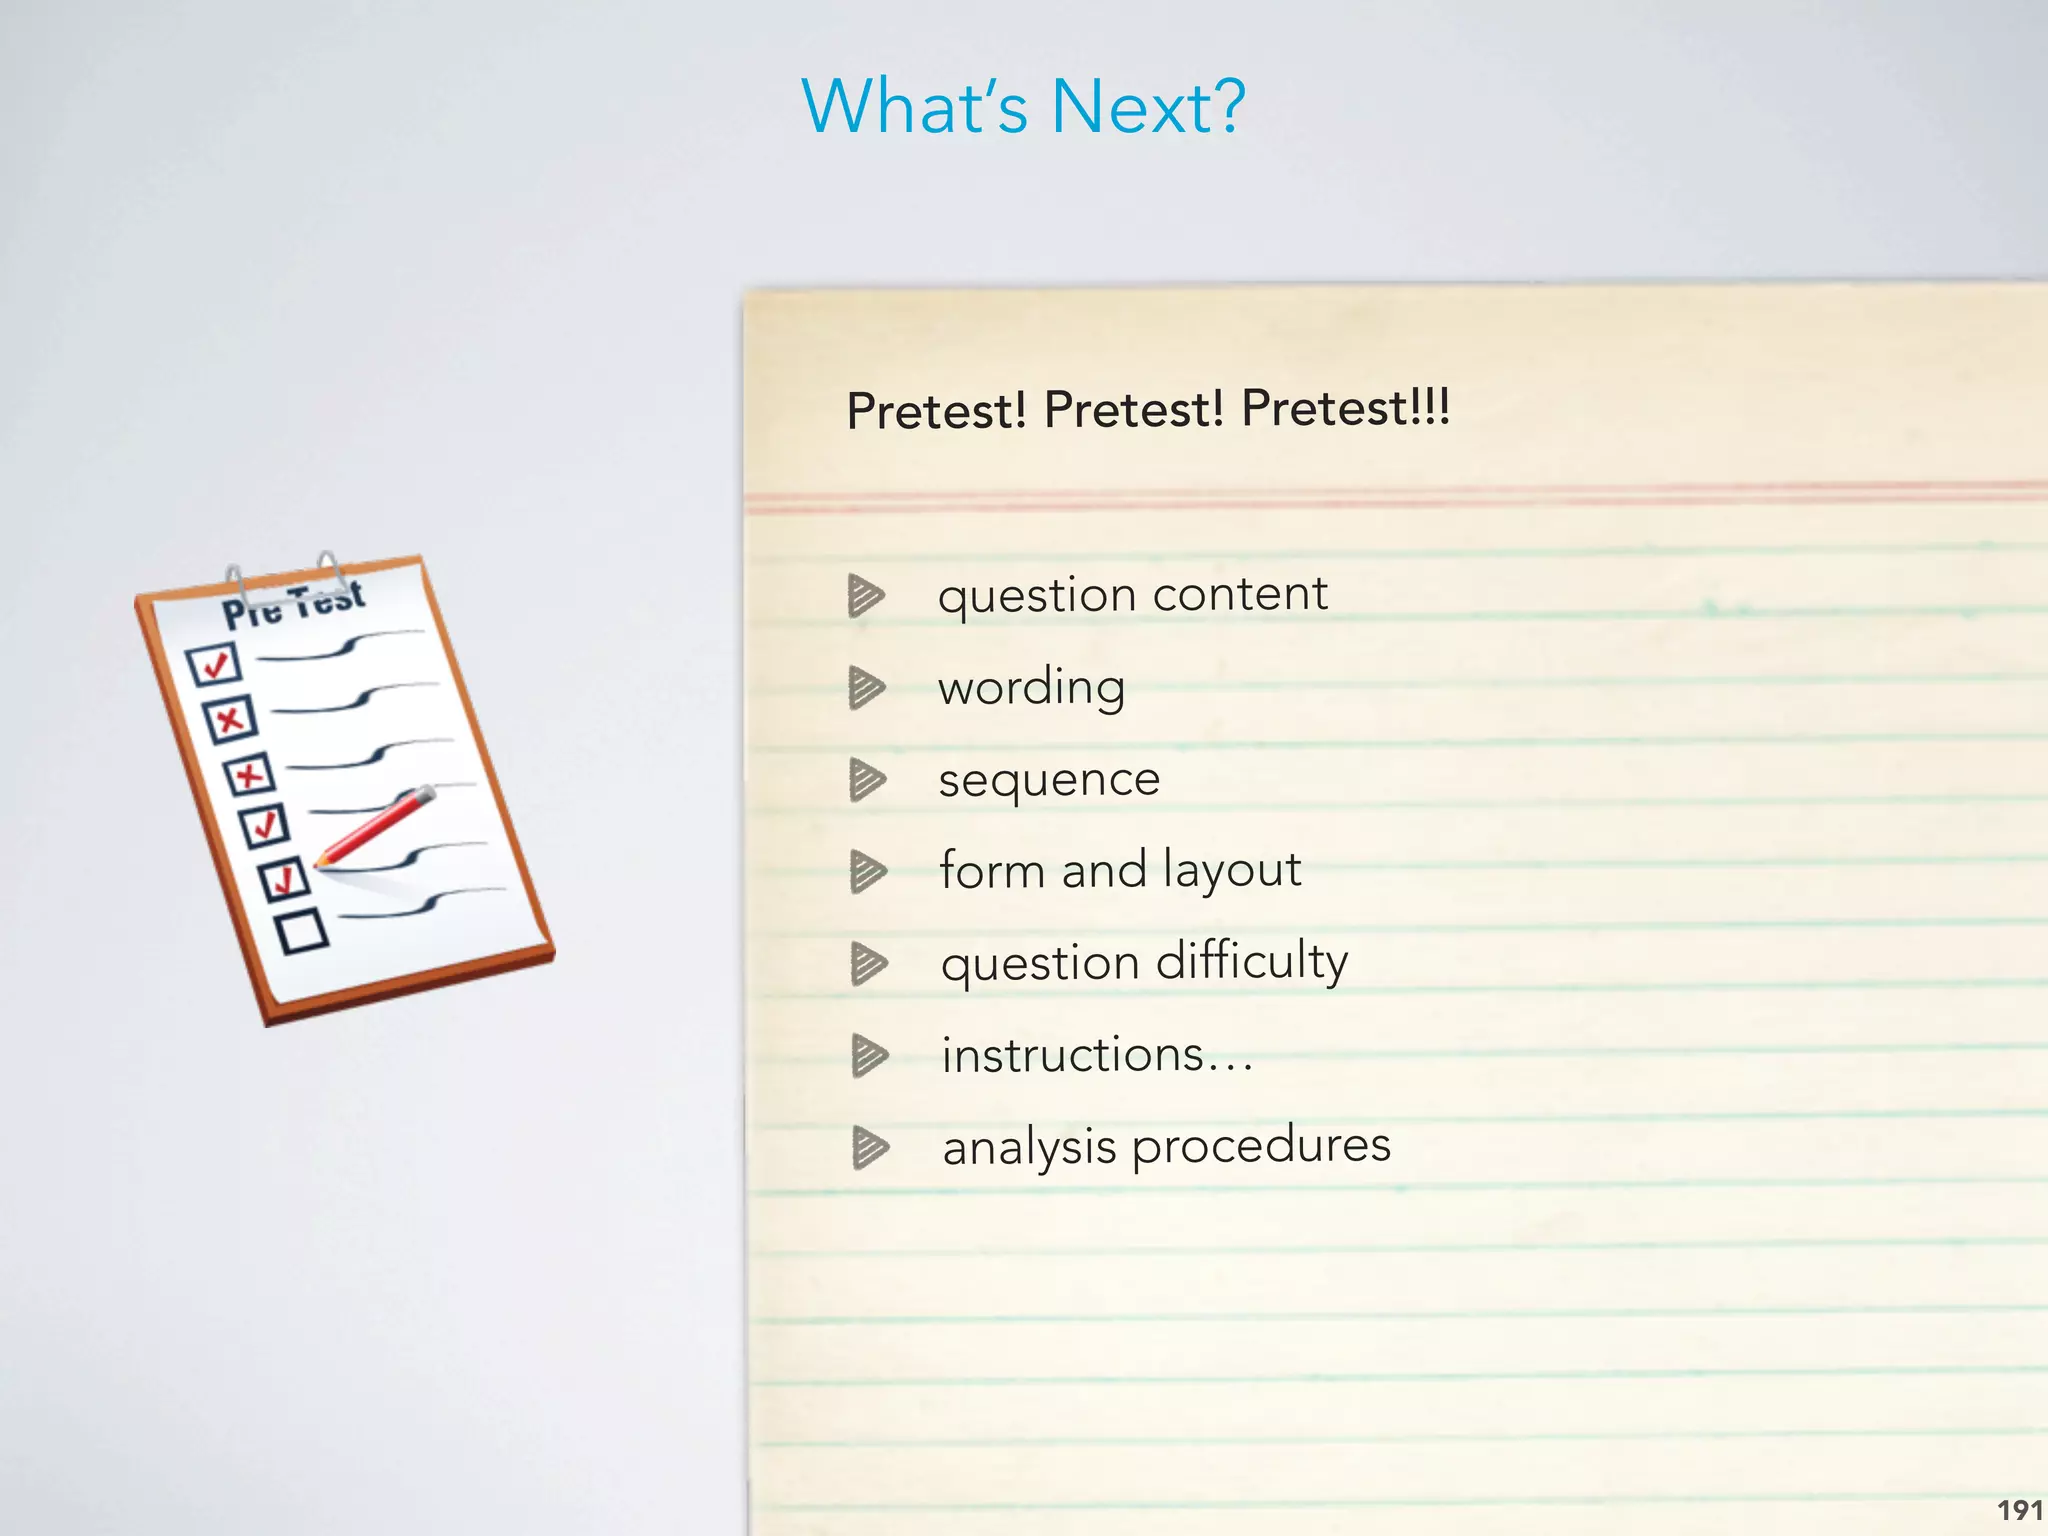
Strategies for effective questionnaire design including question formulation, structure, and overcoming response issues.
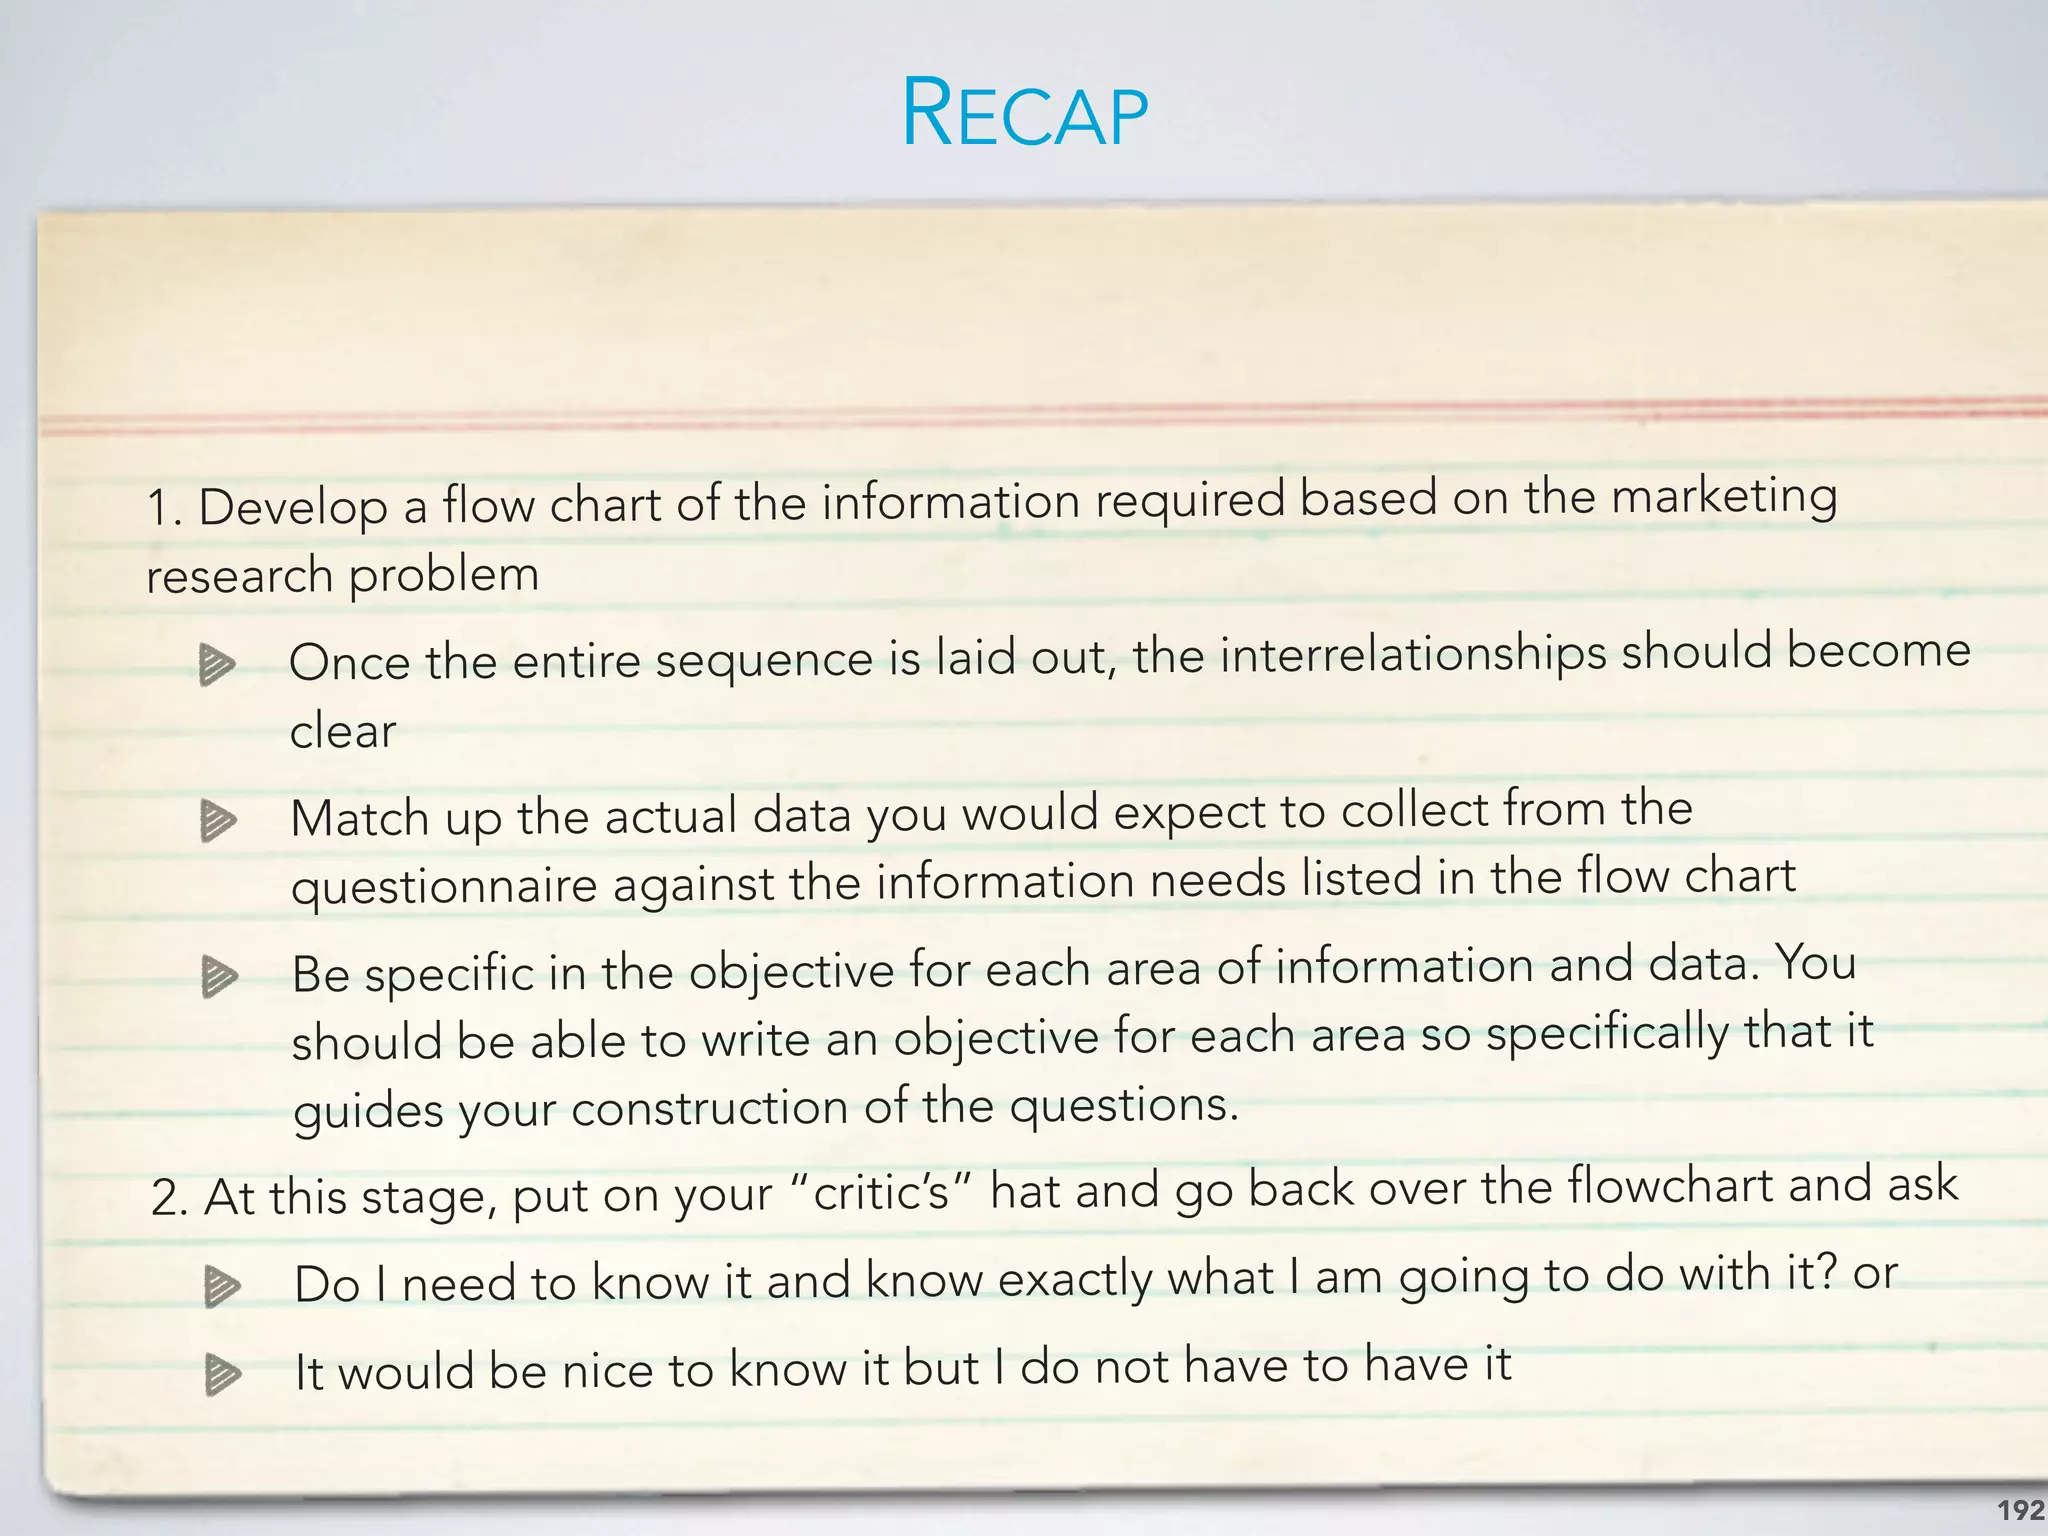
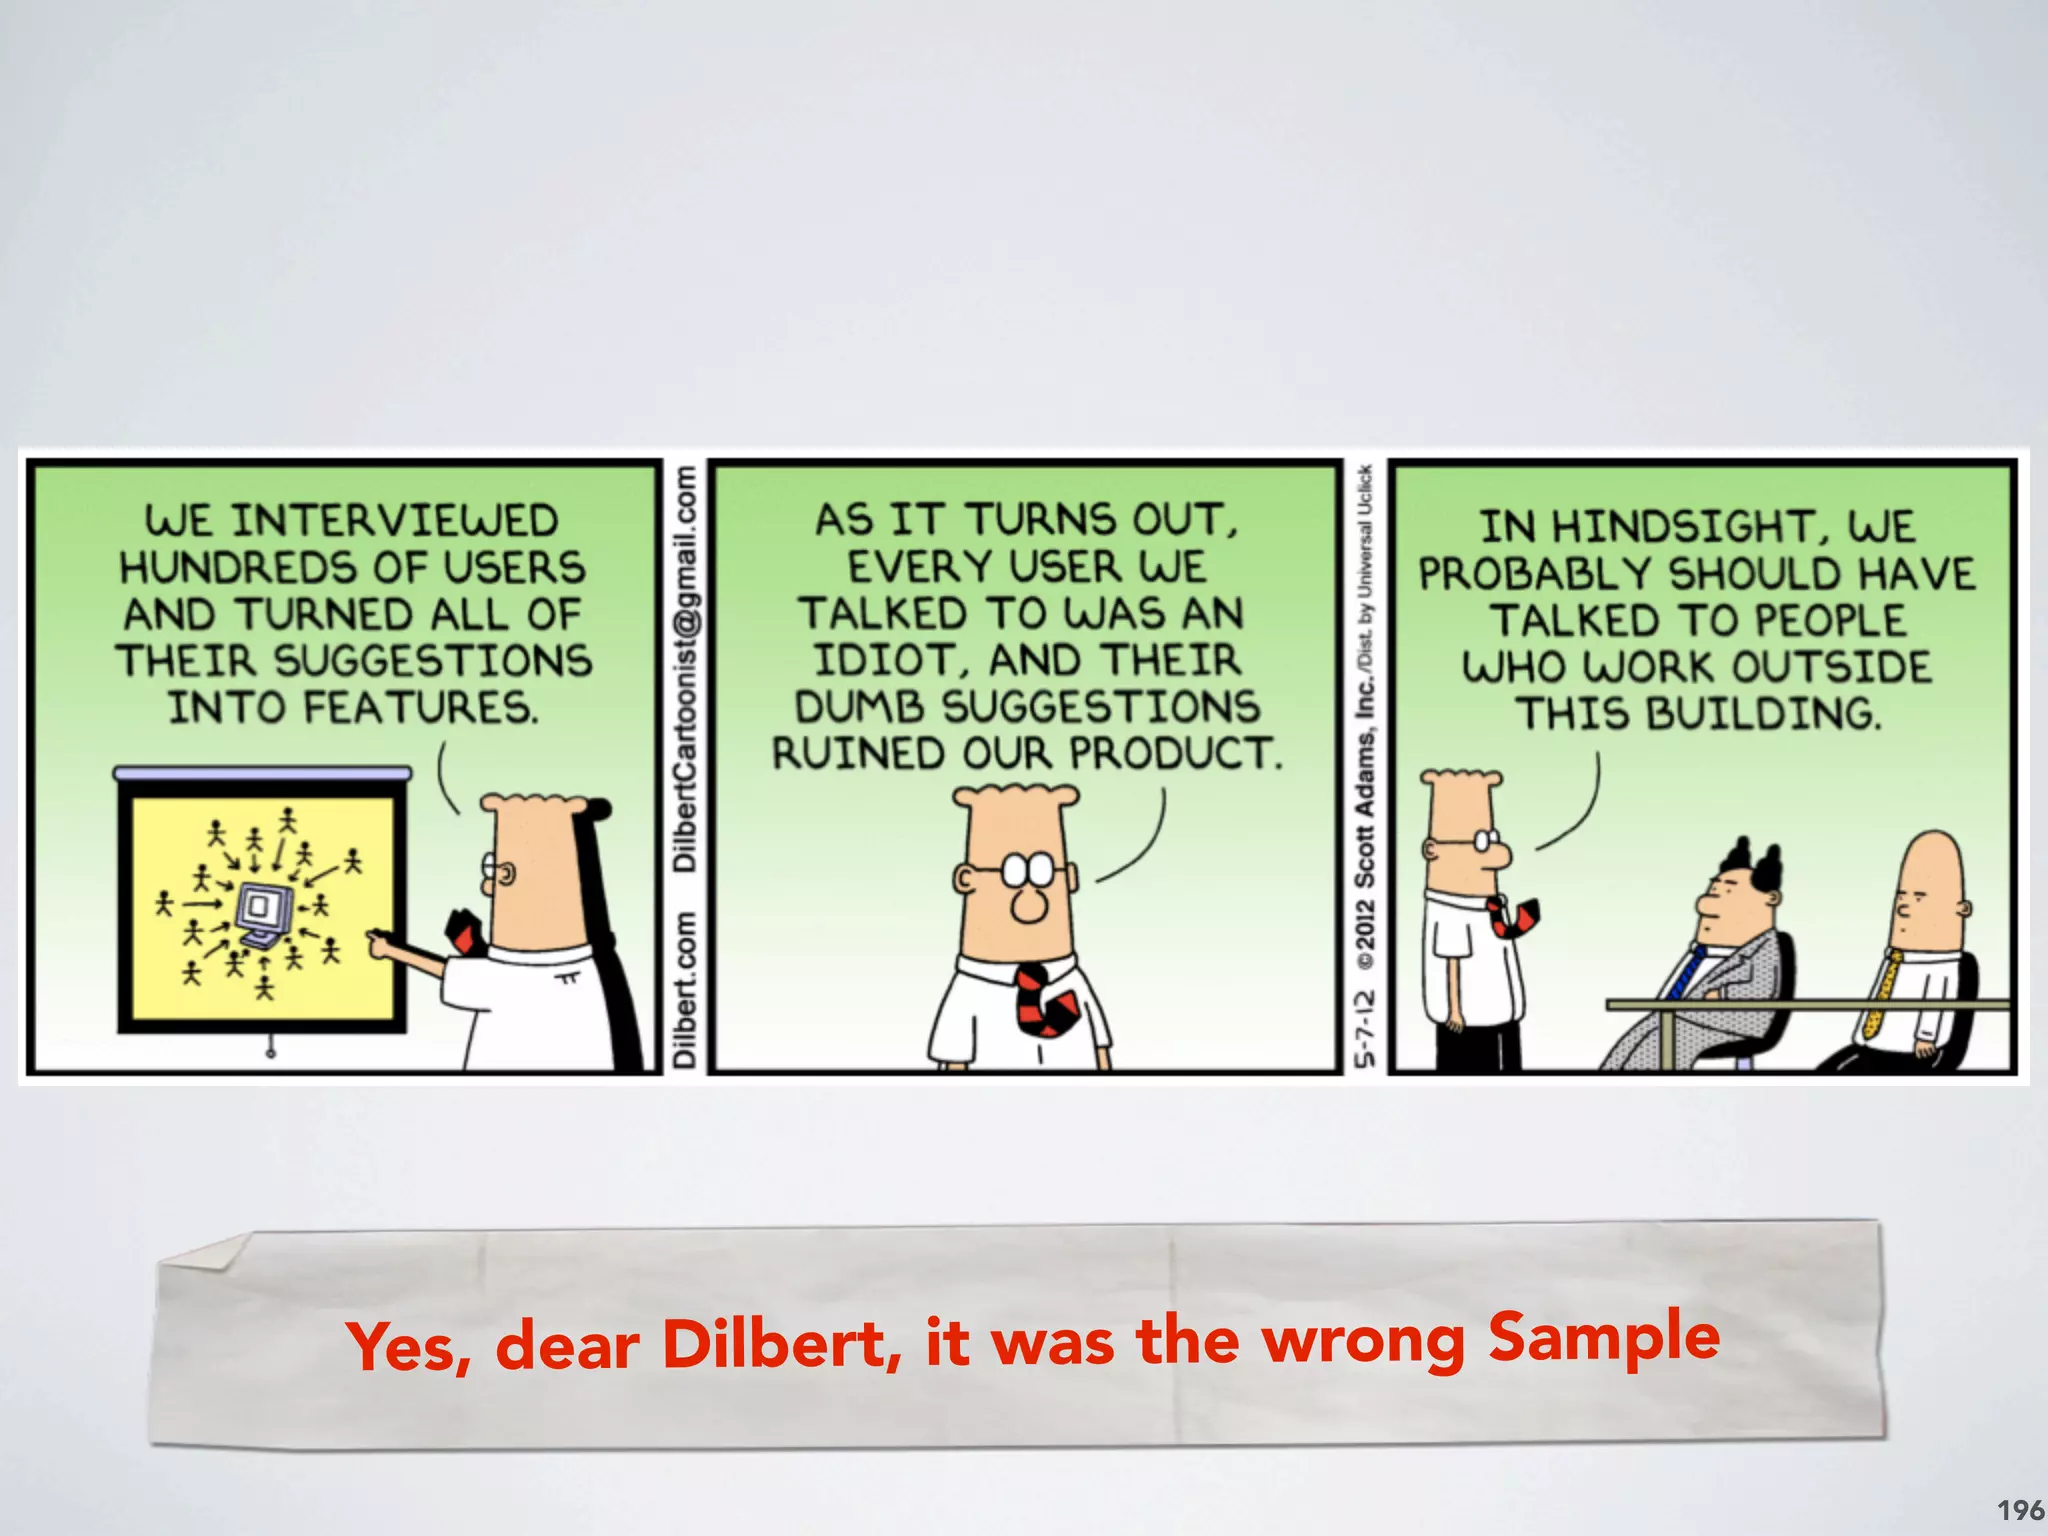
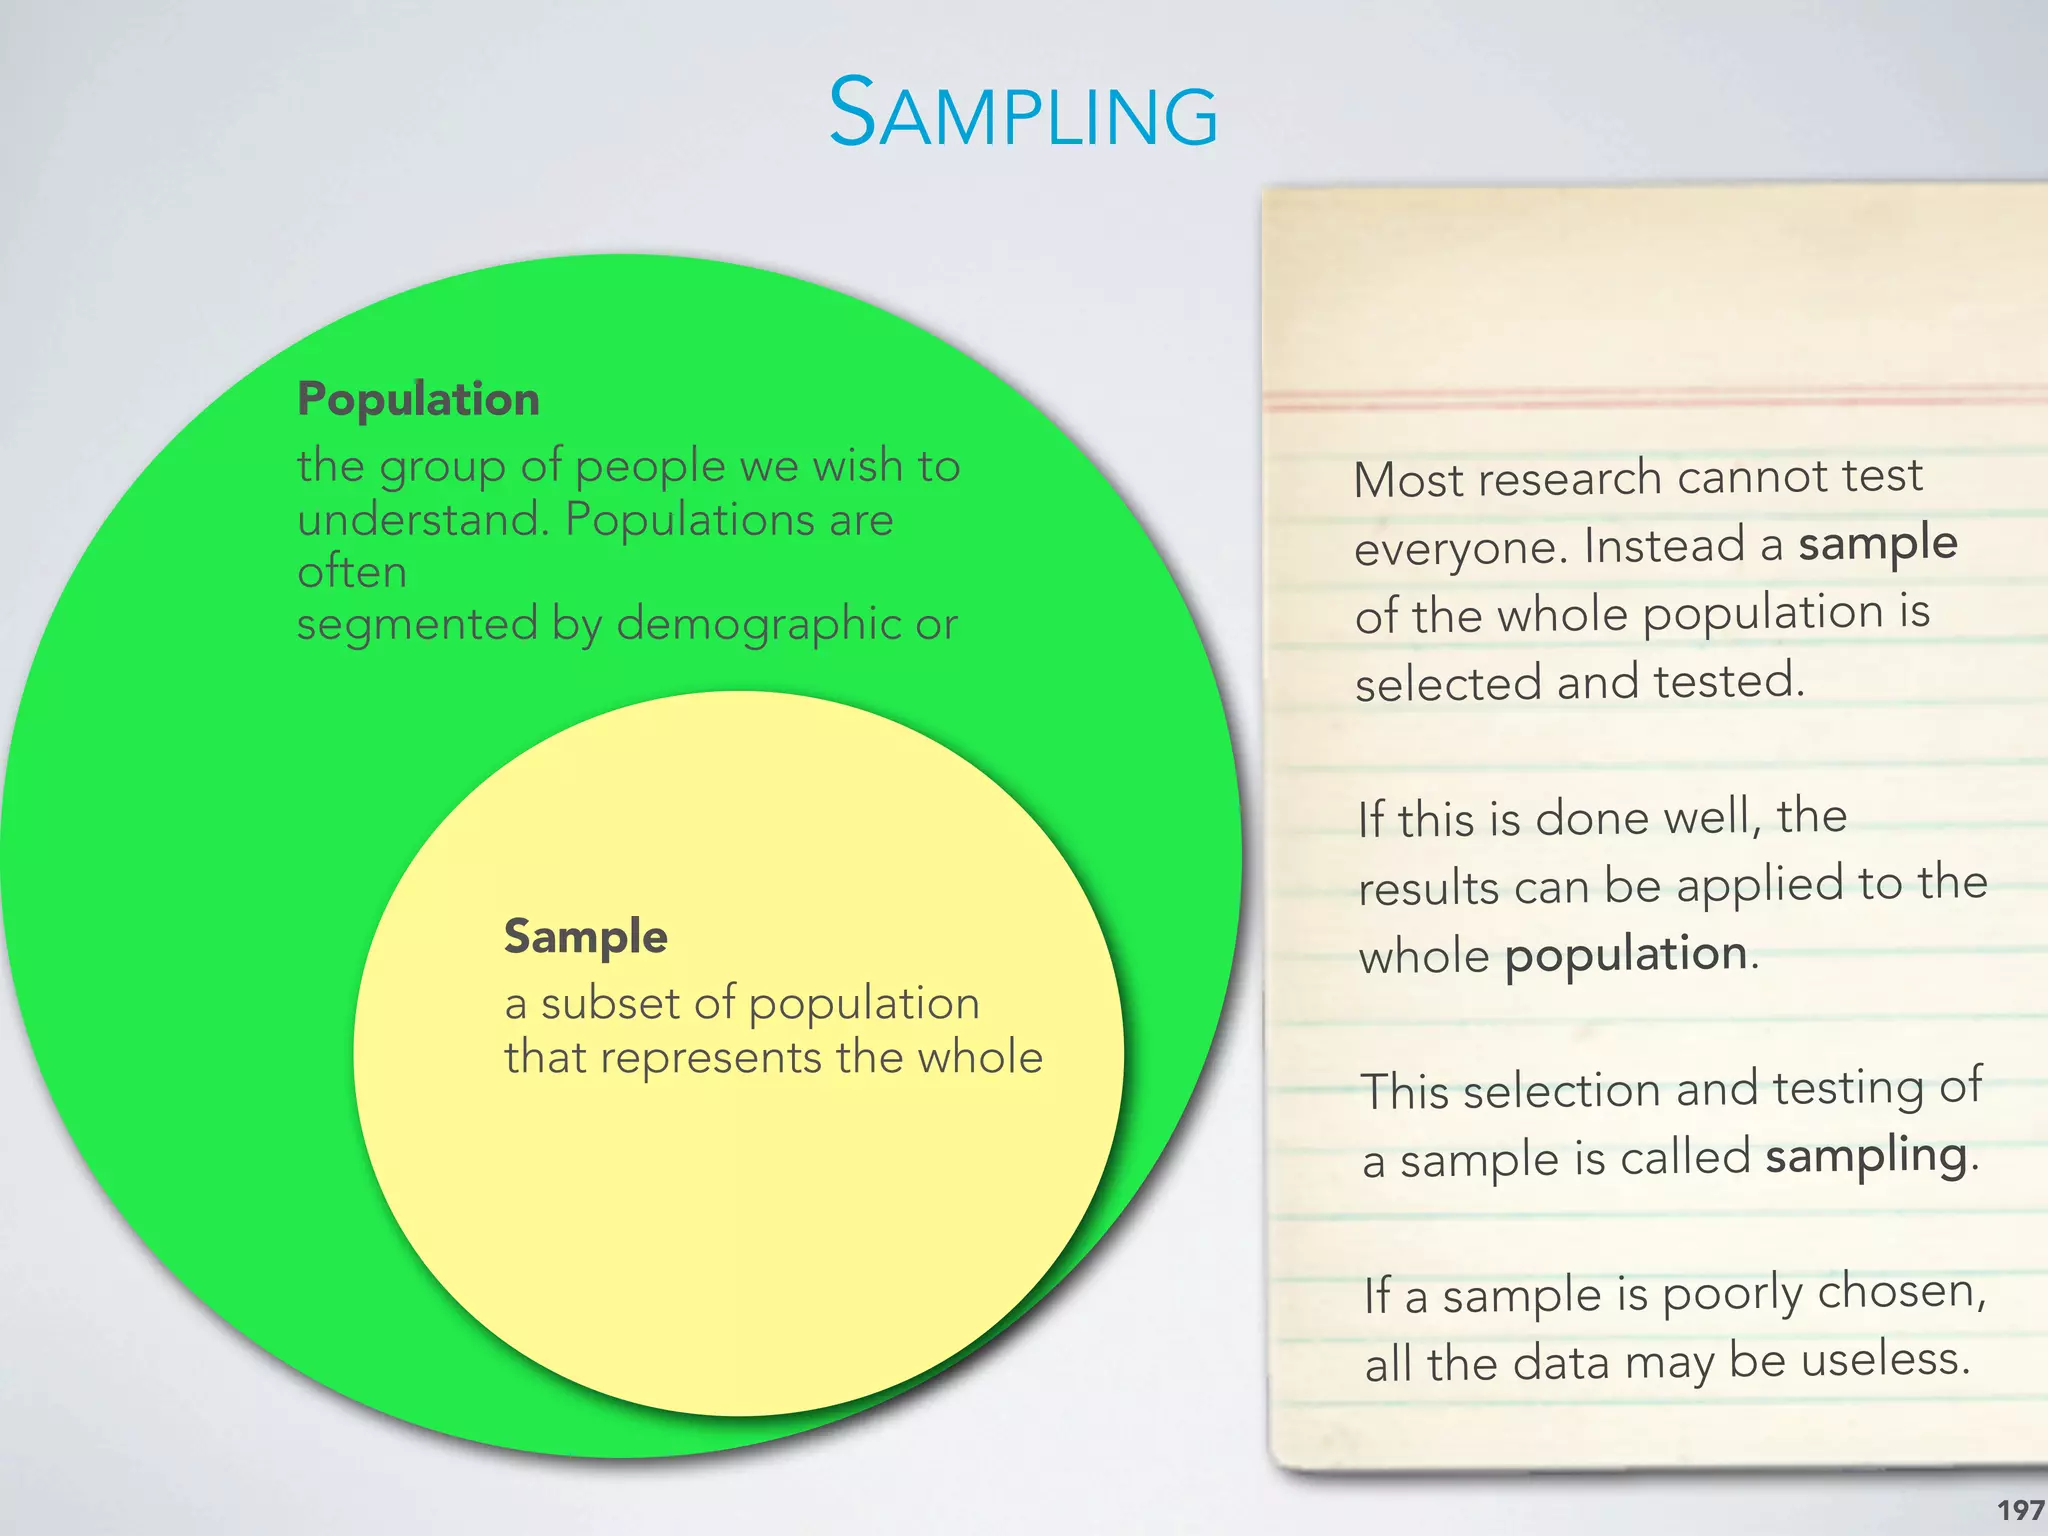
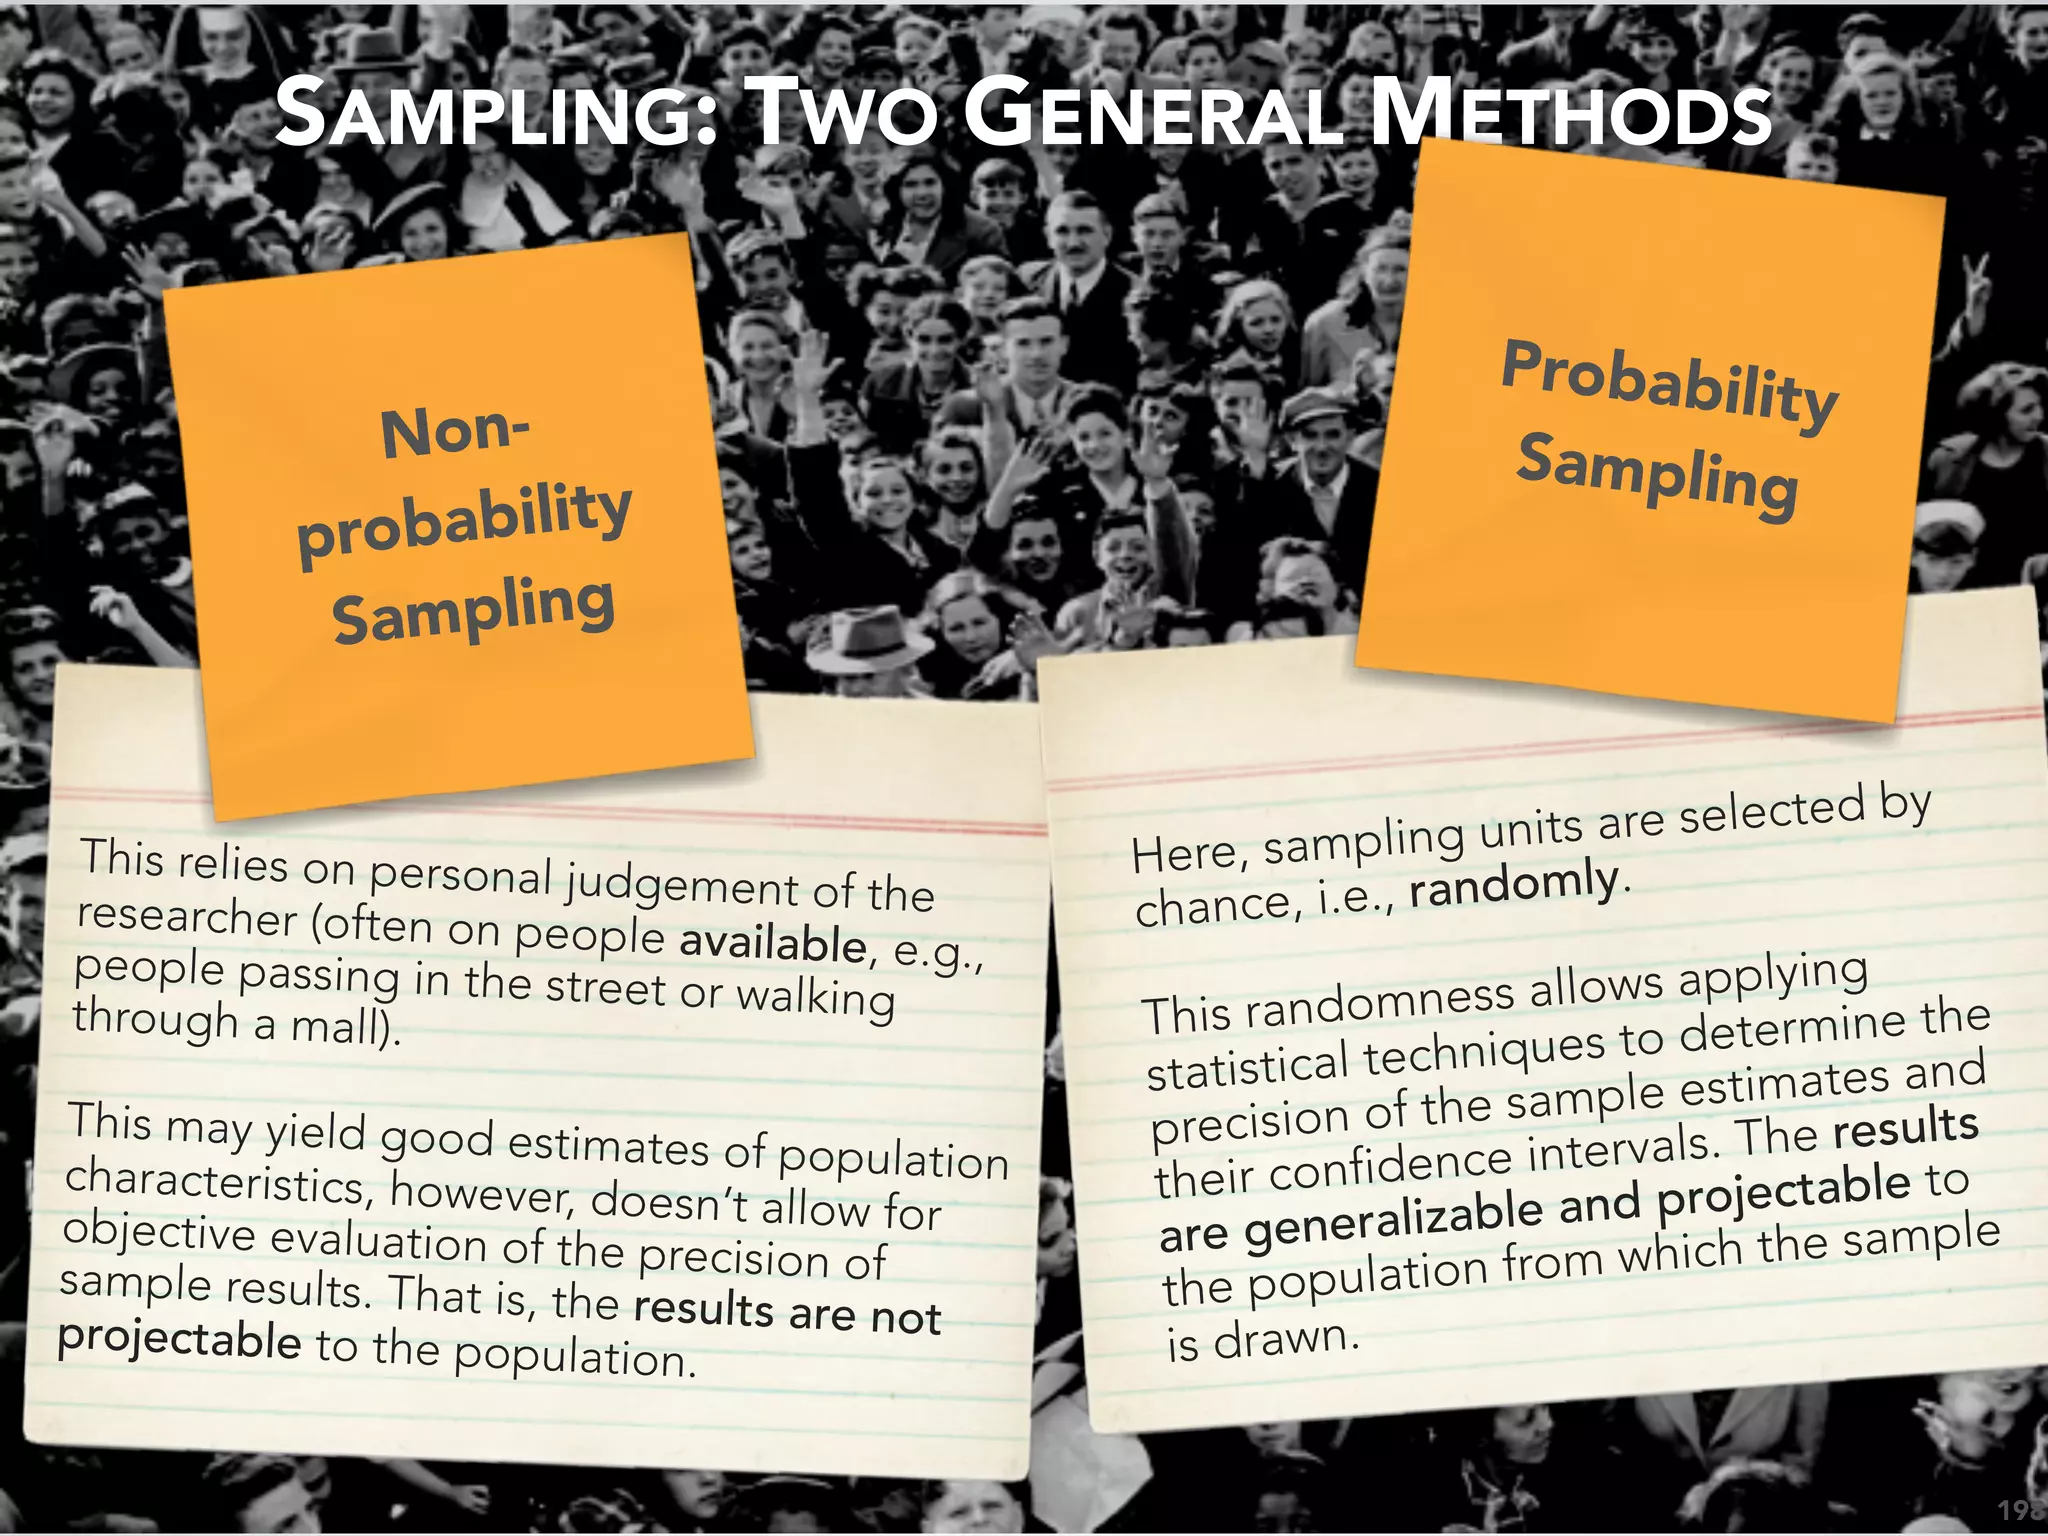
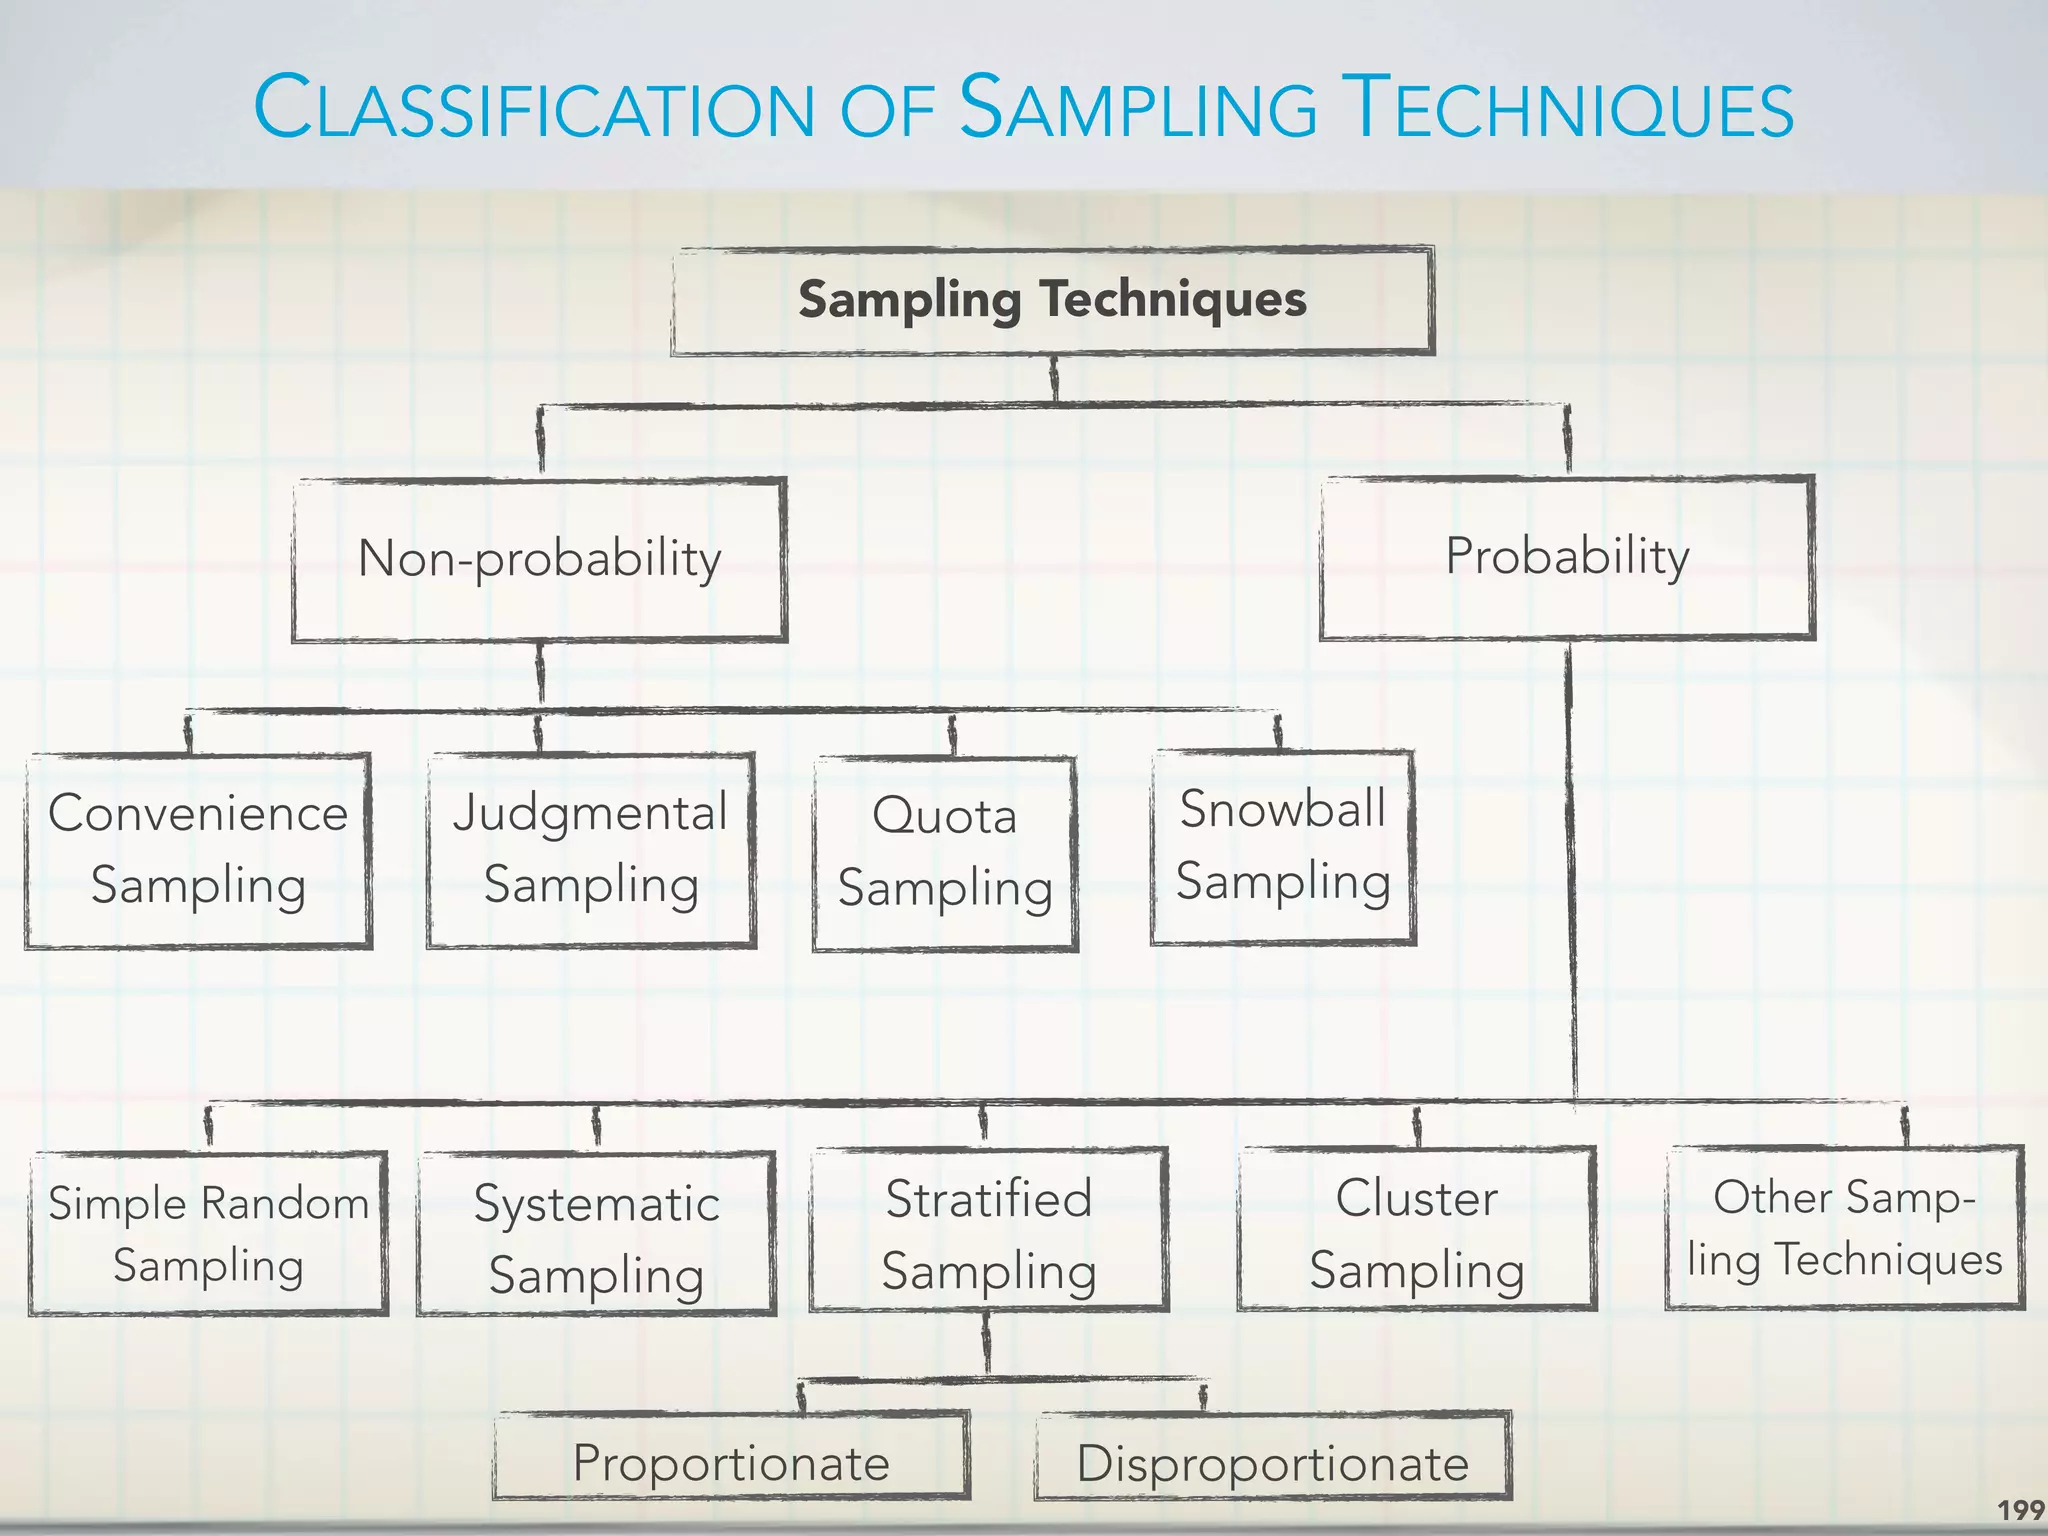
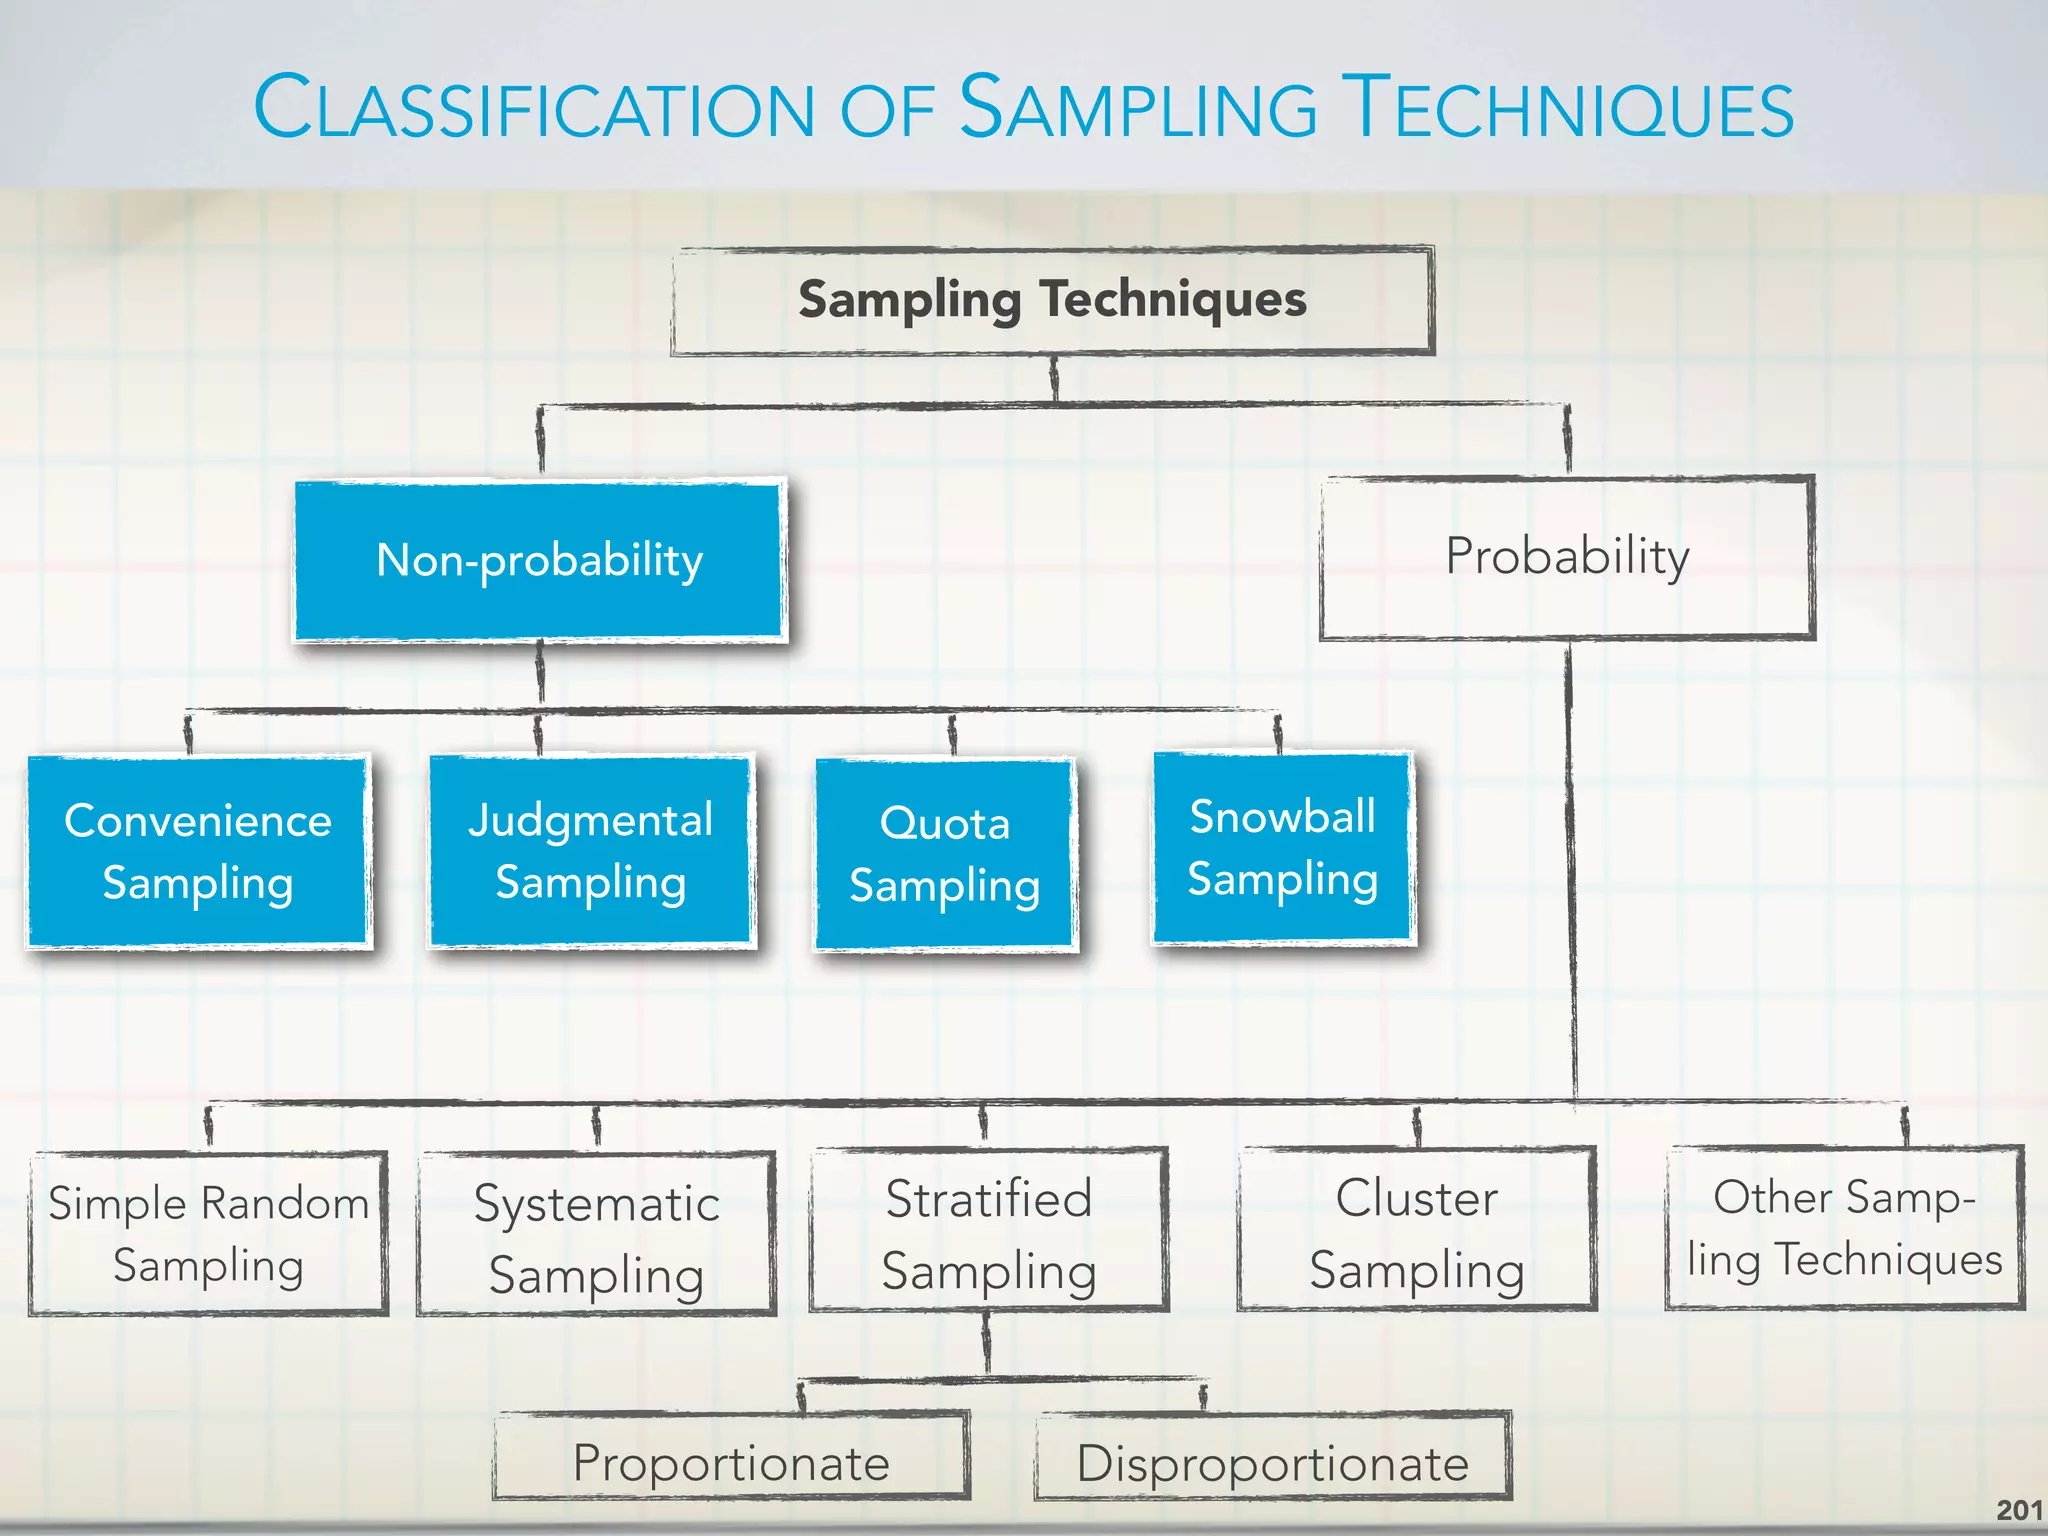
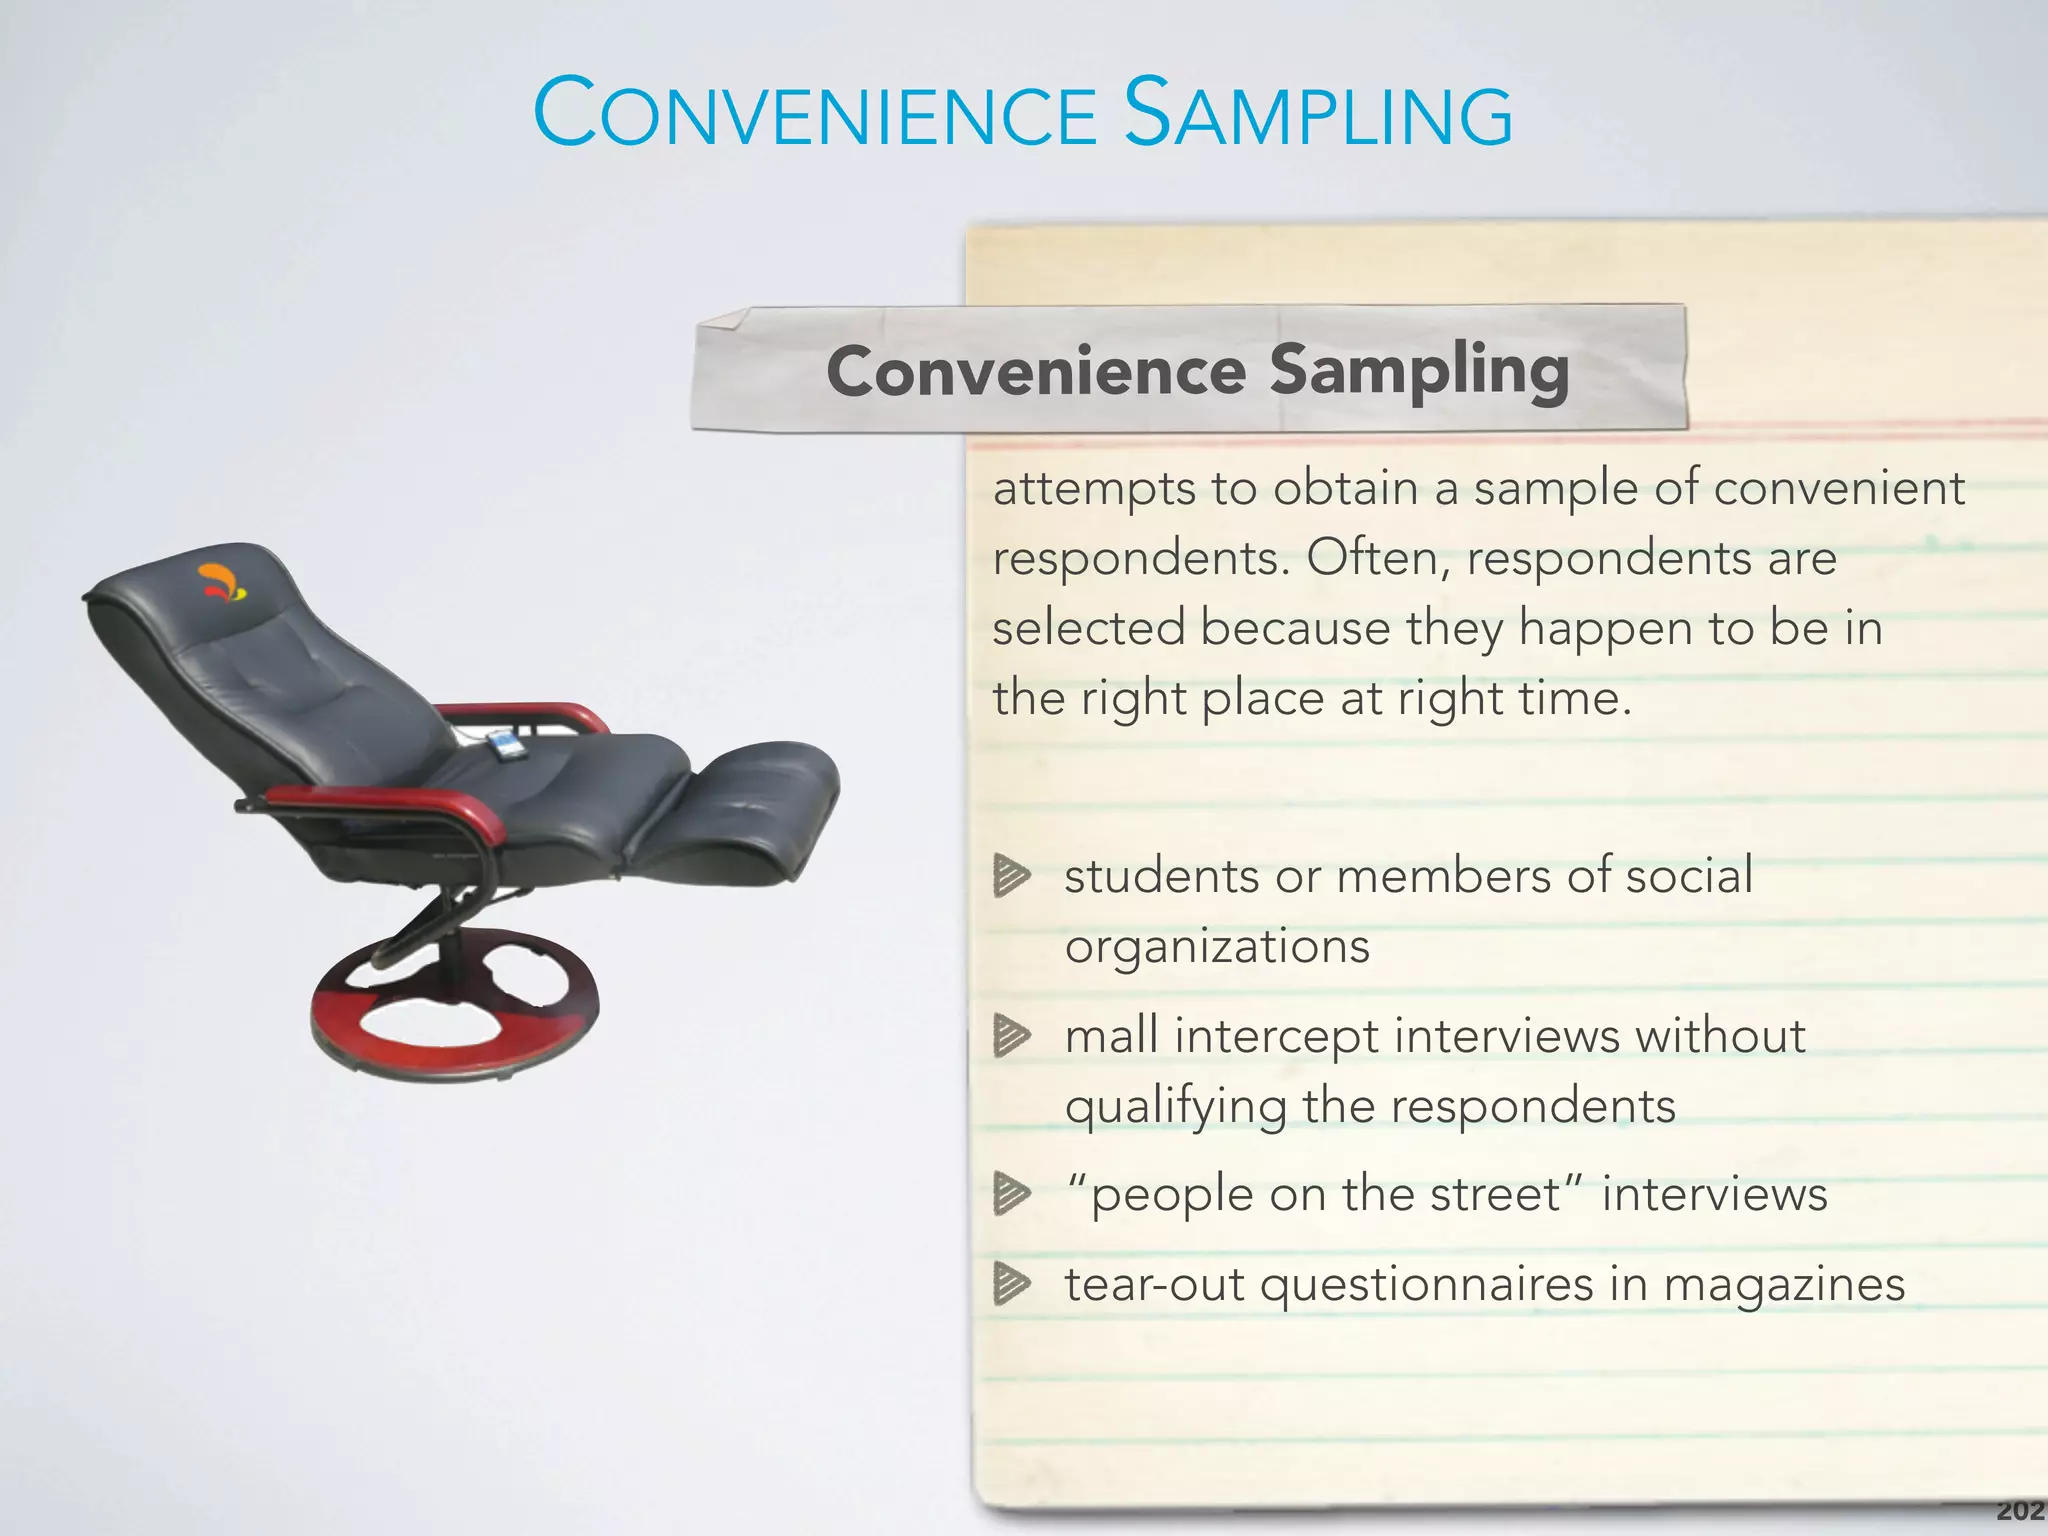
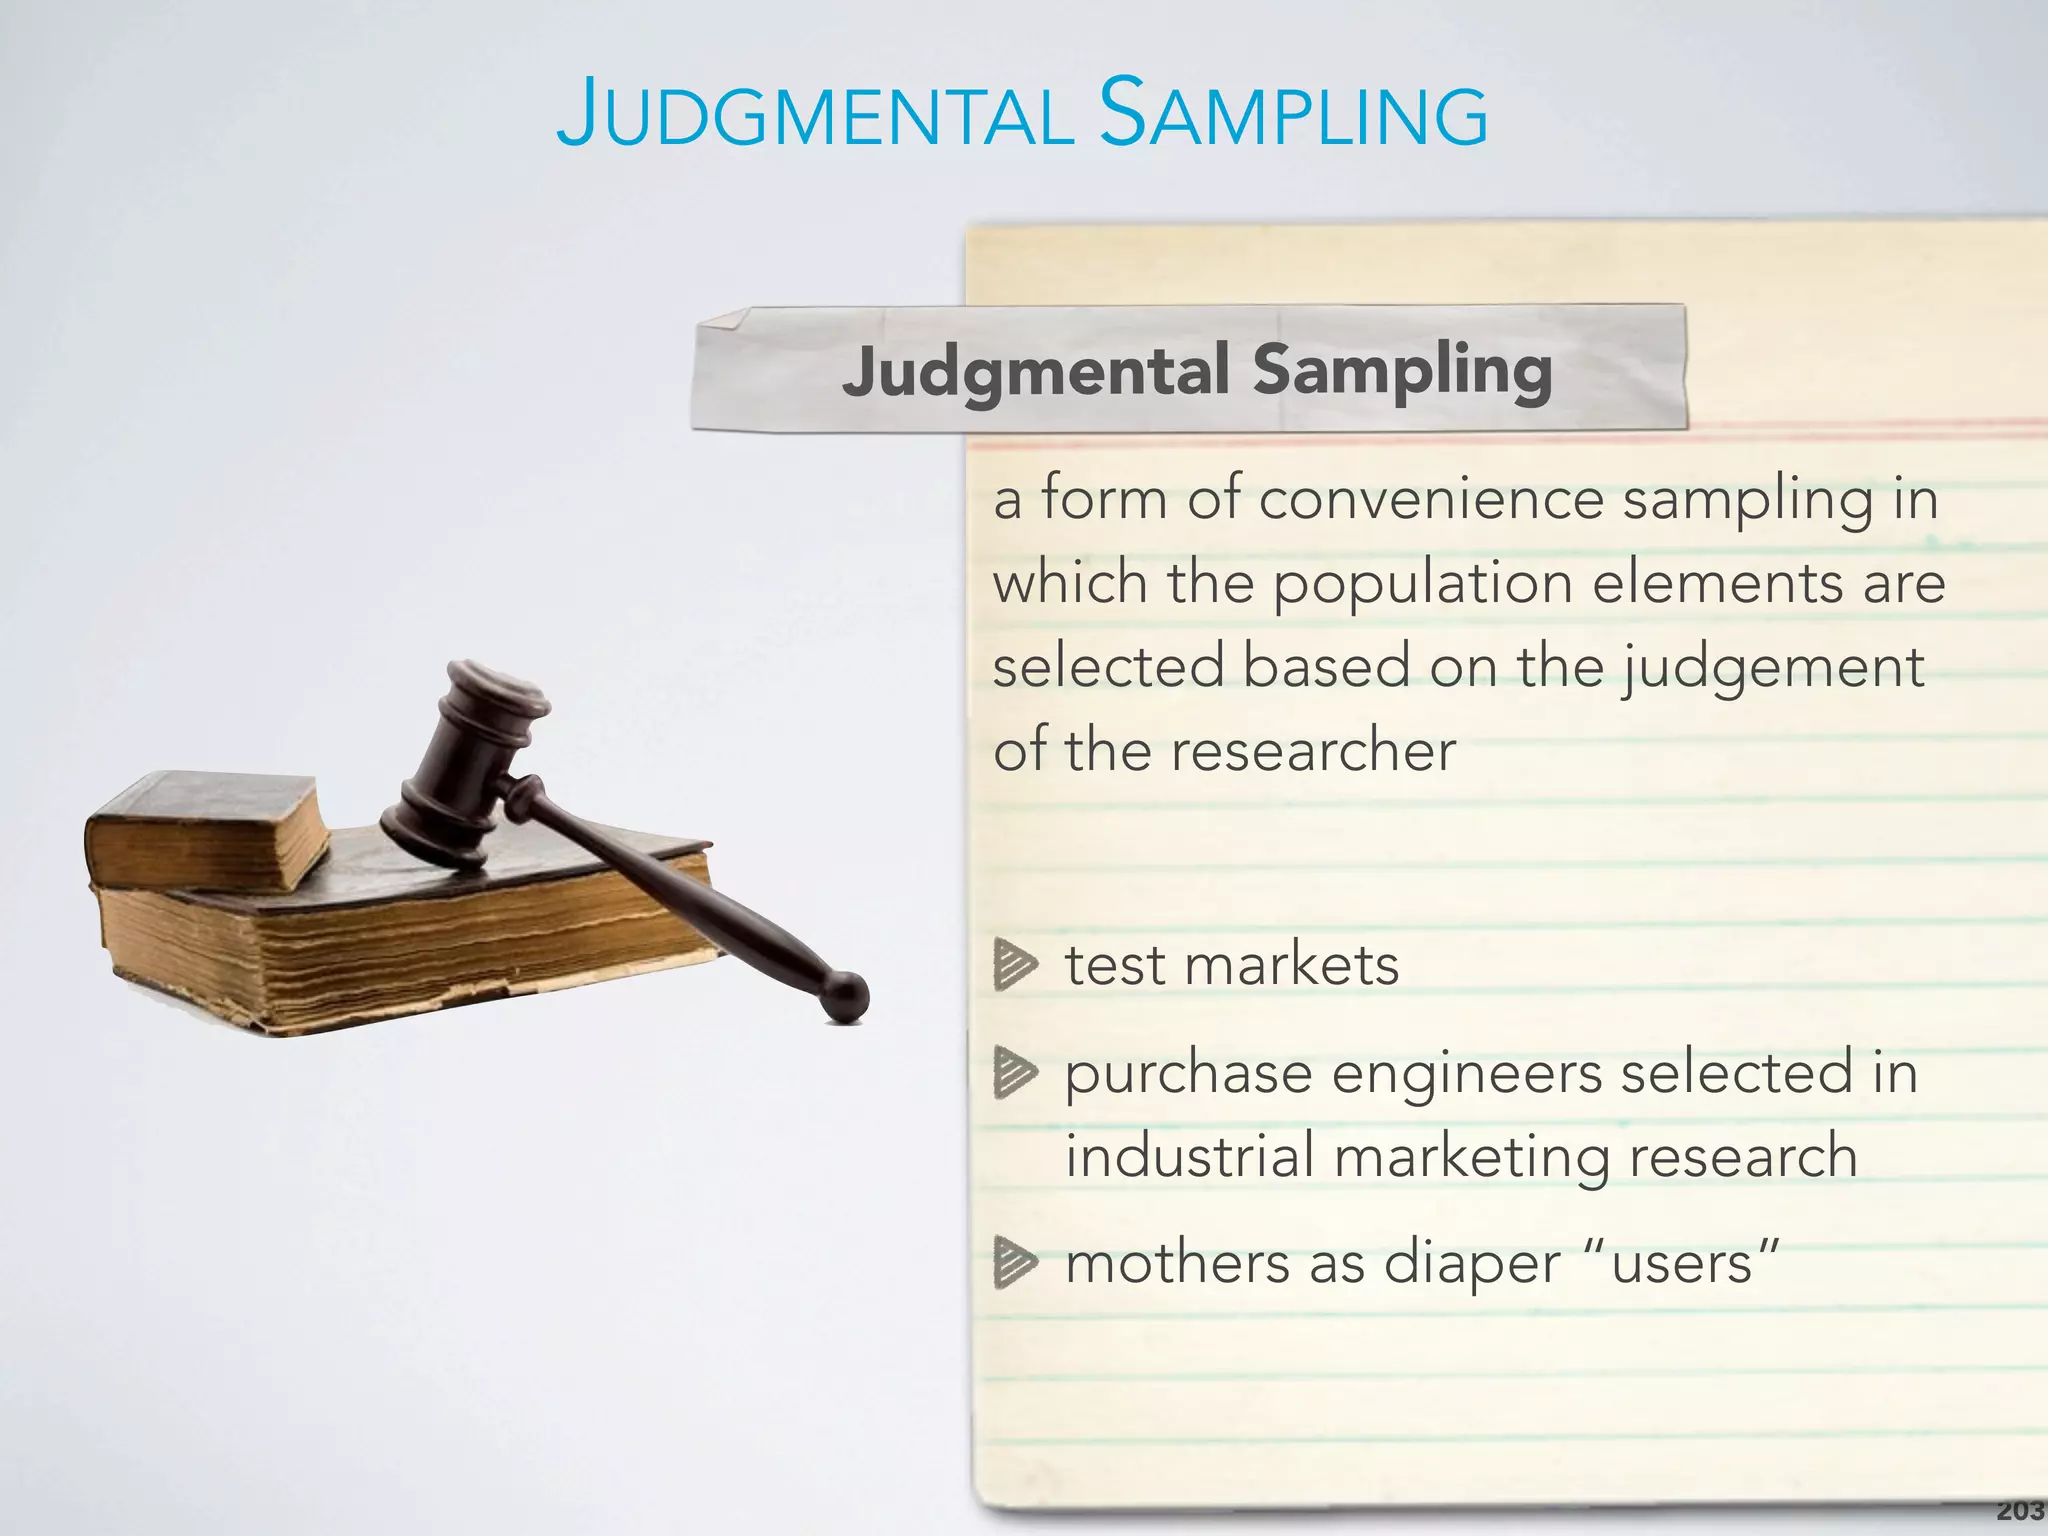
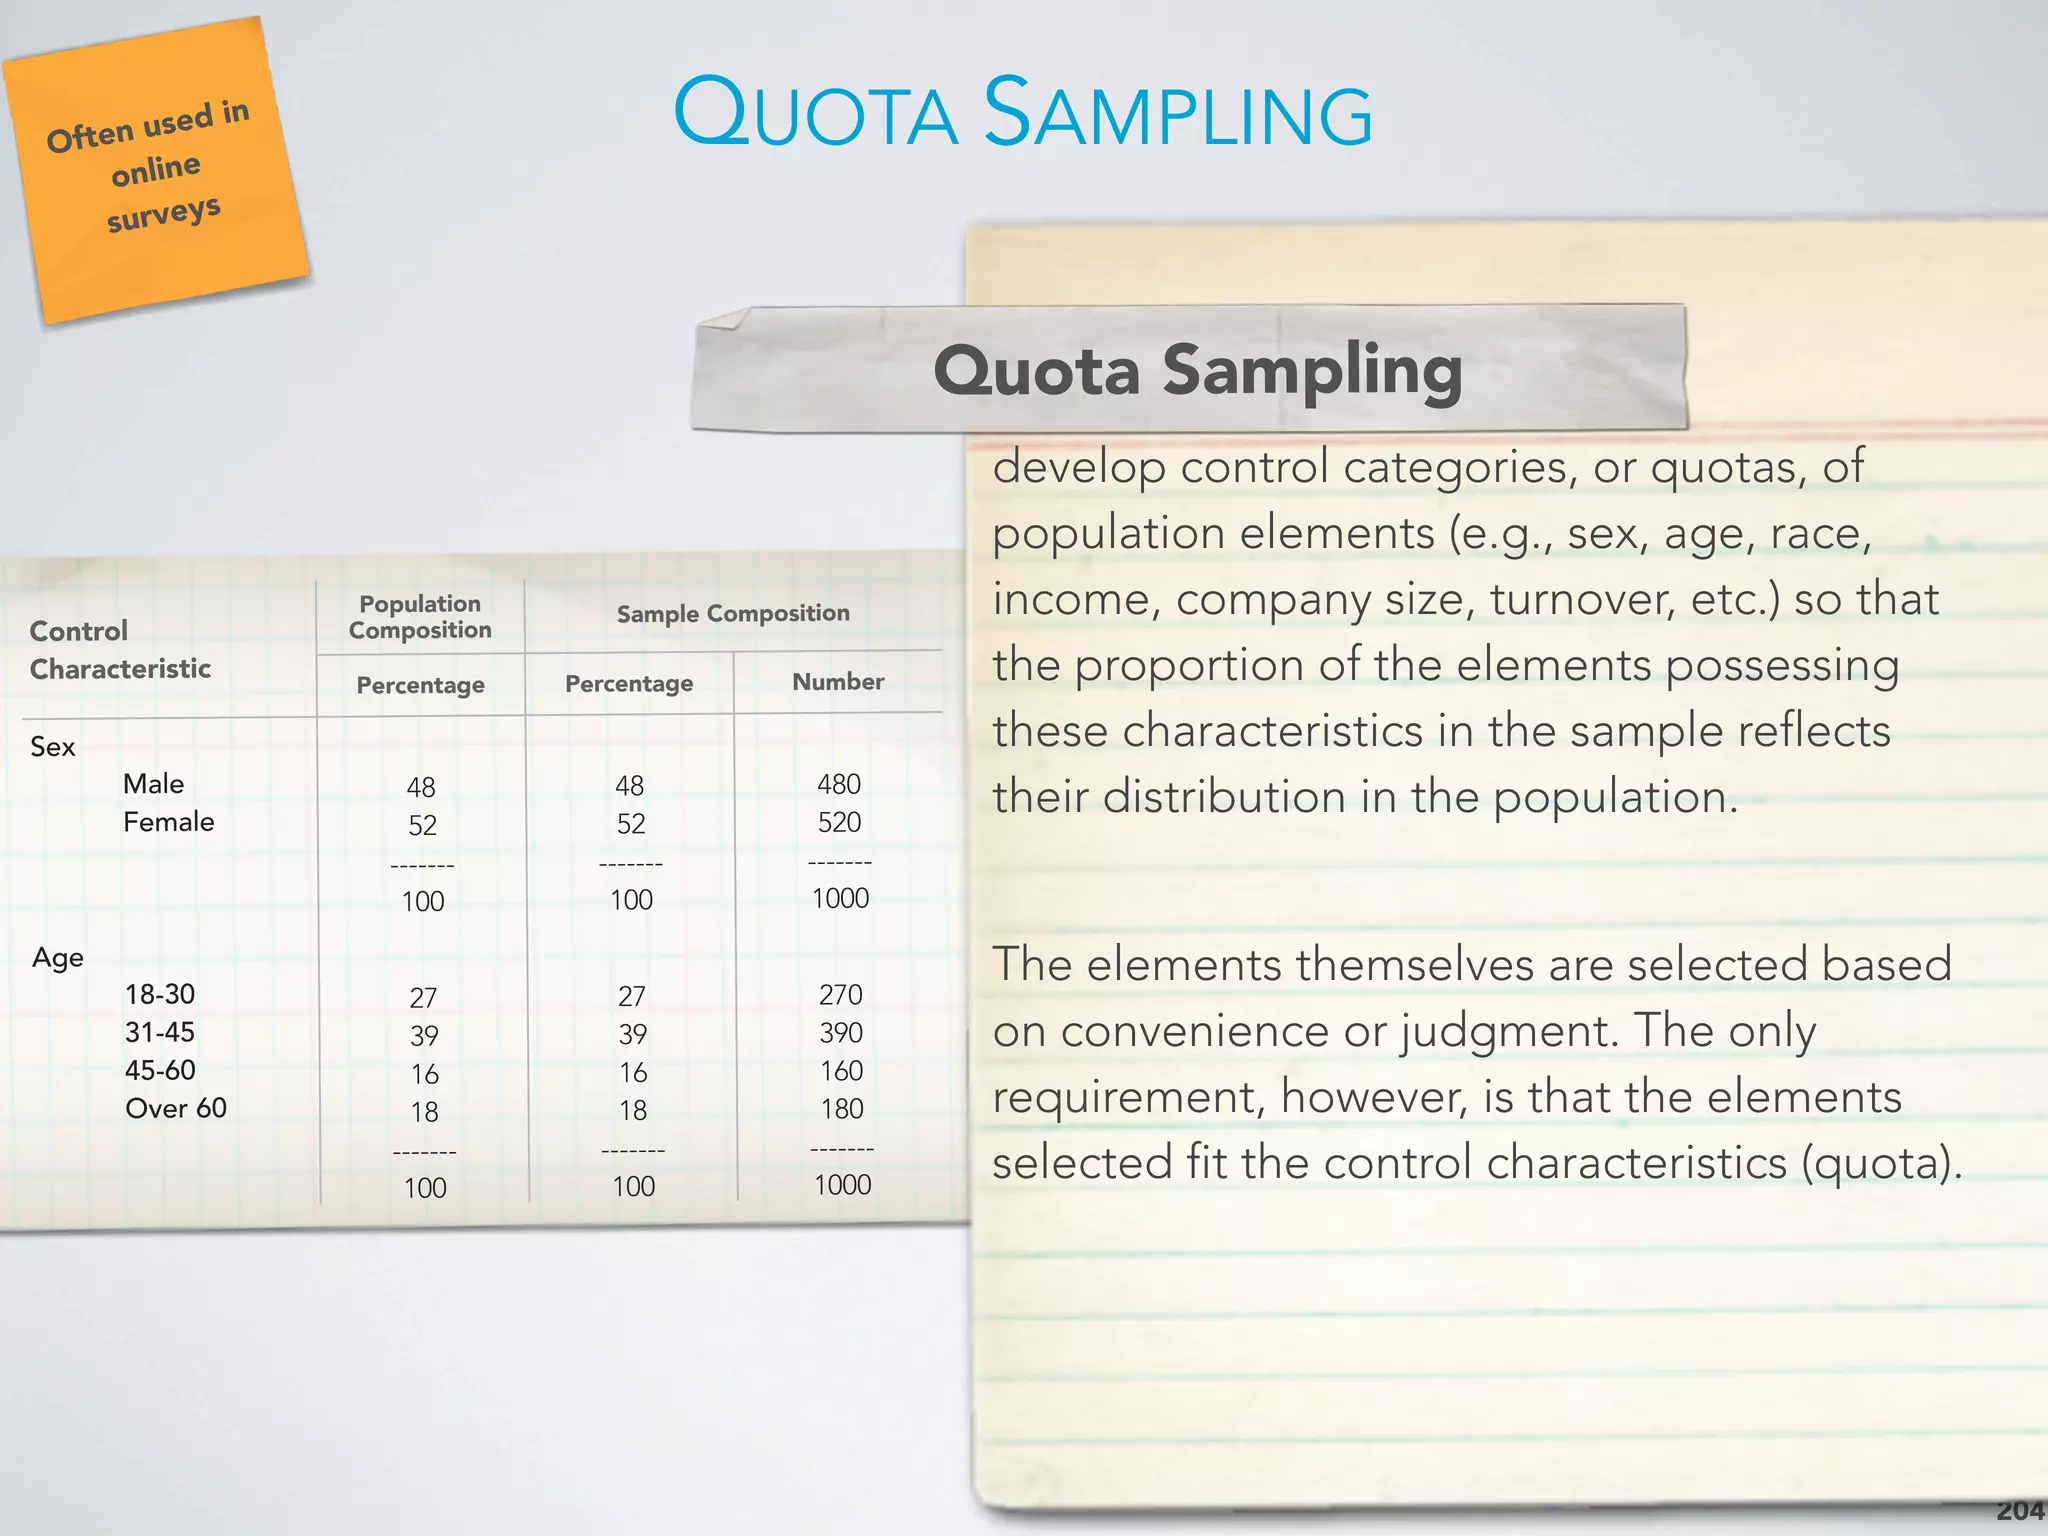
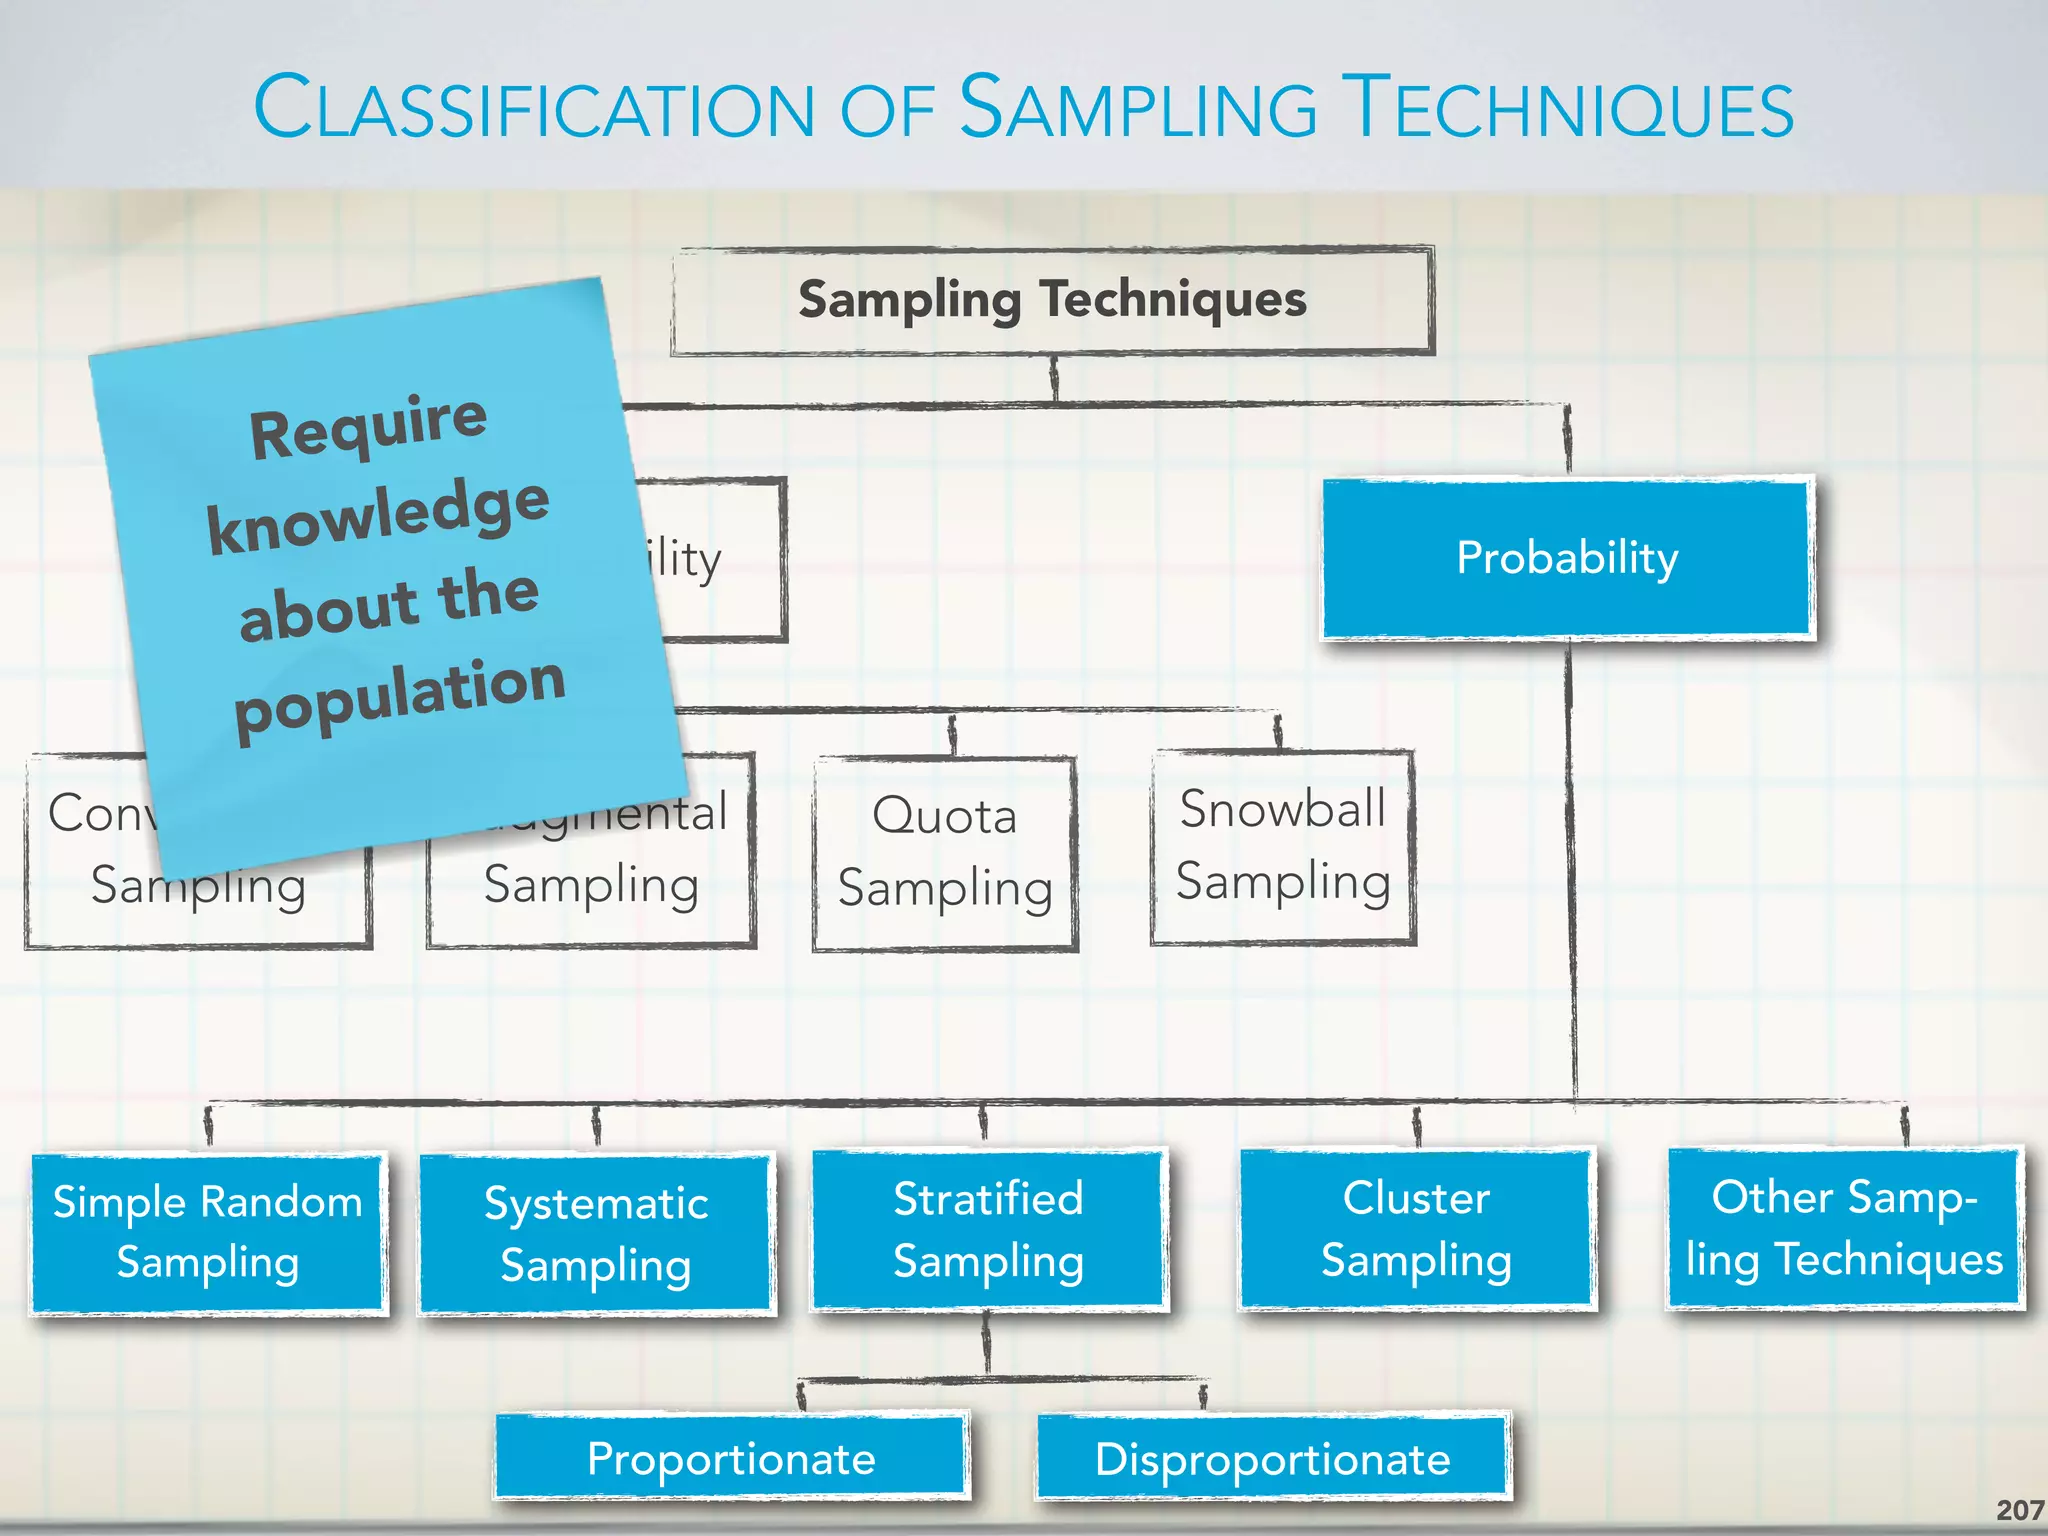
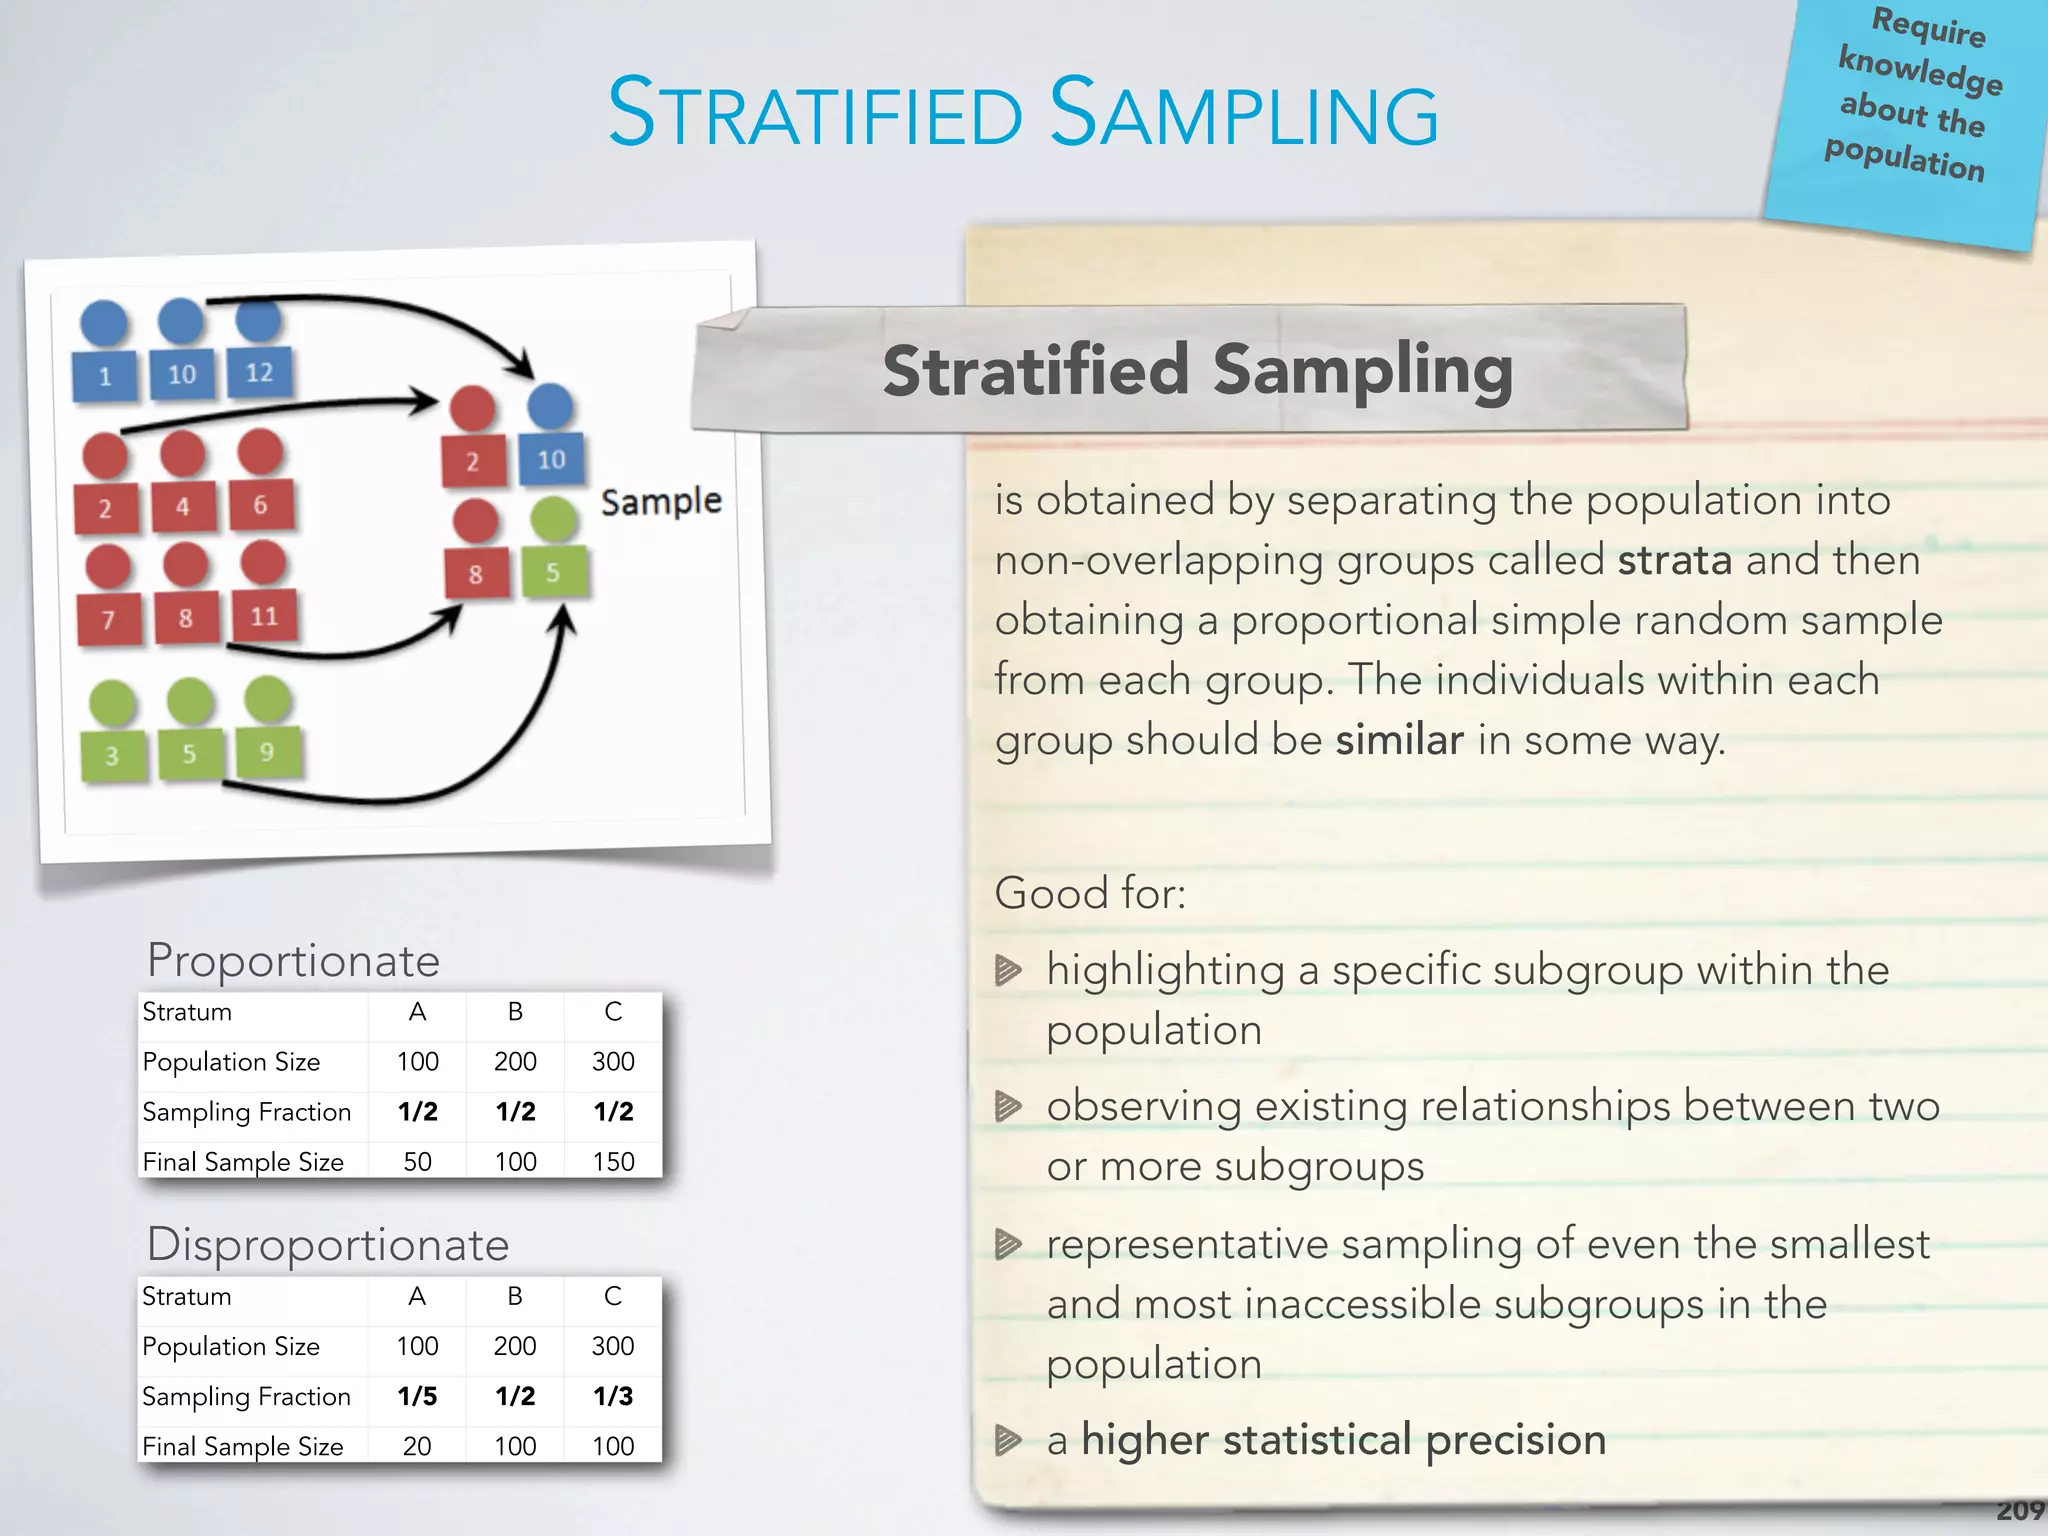
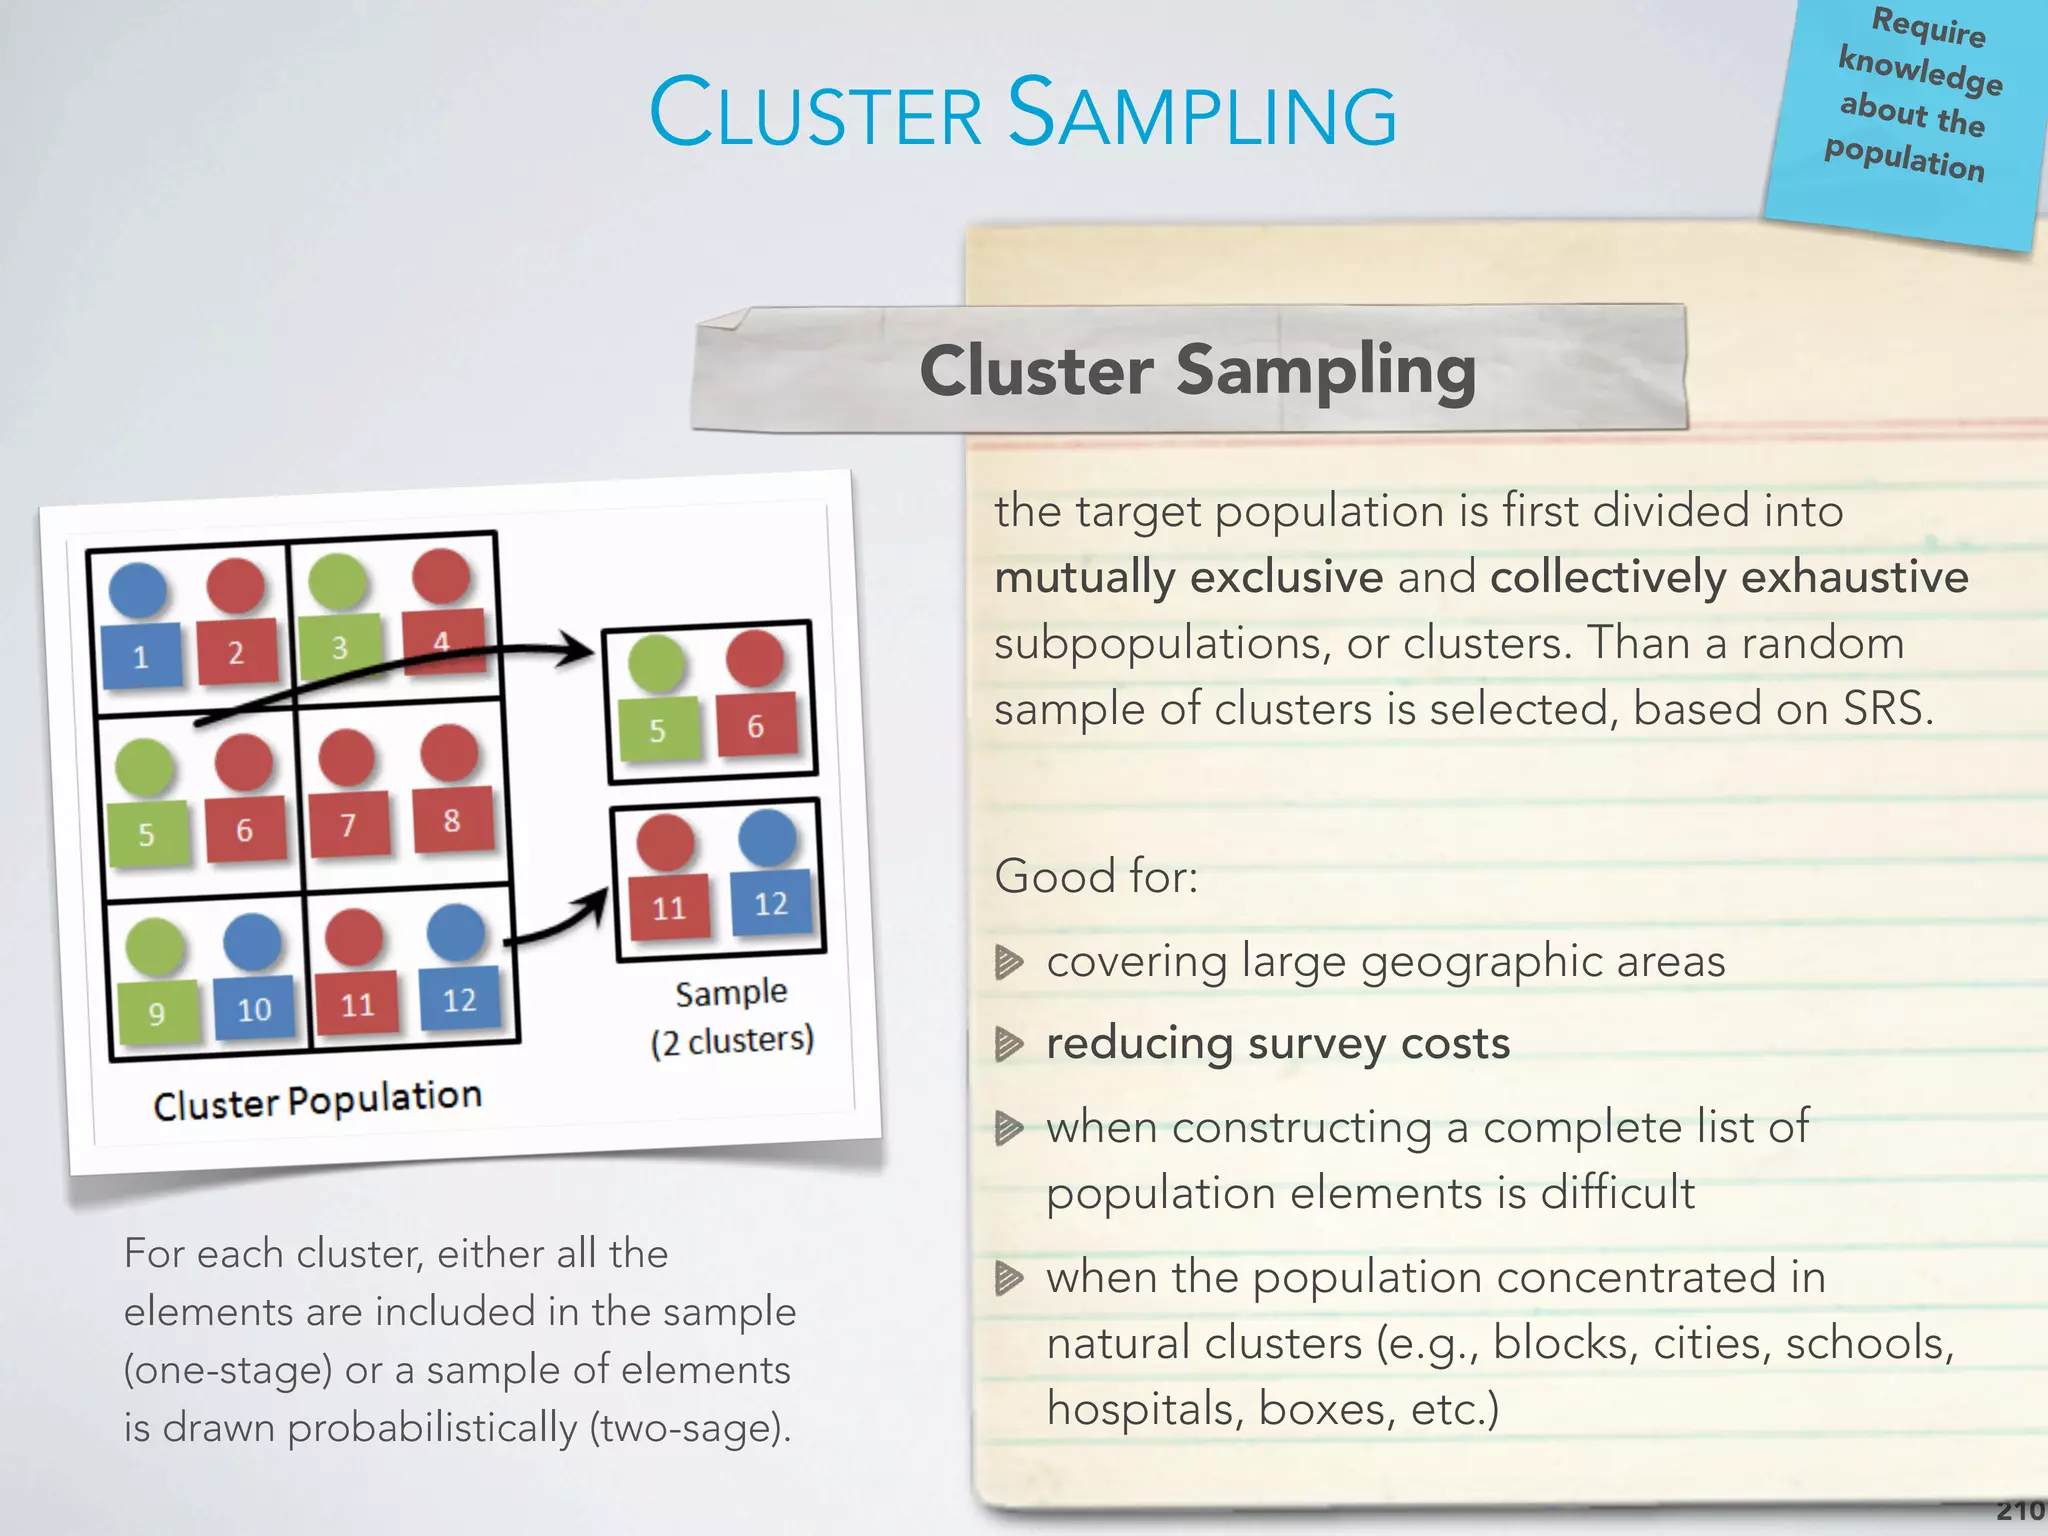
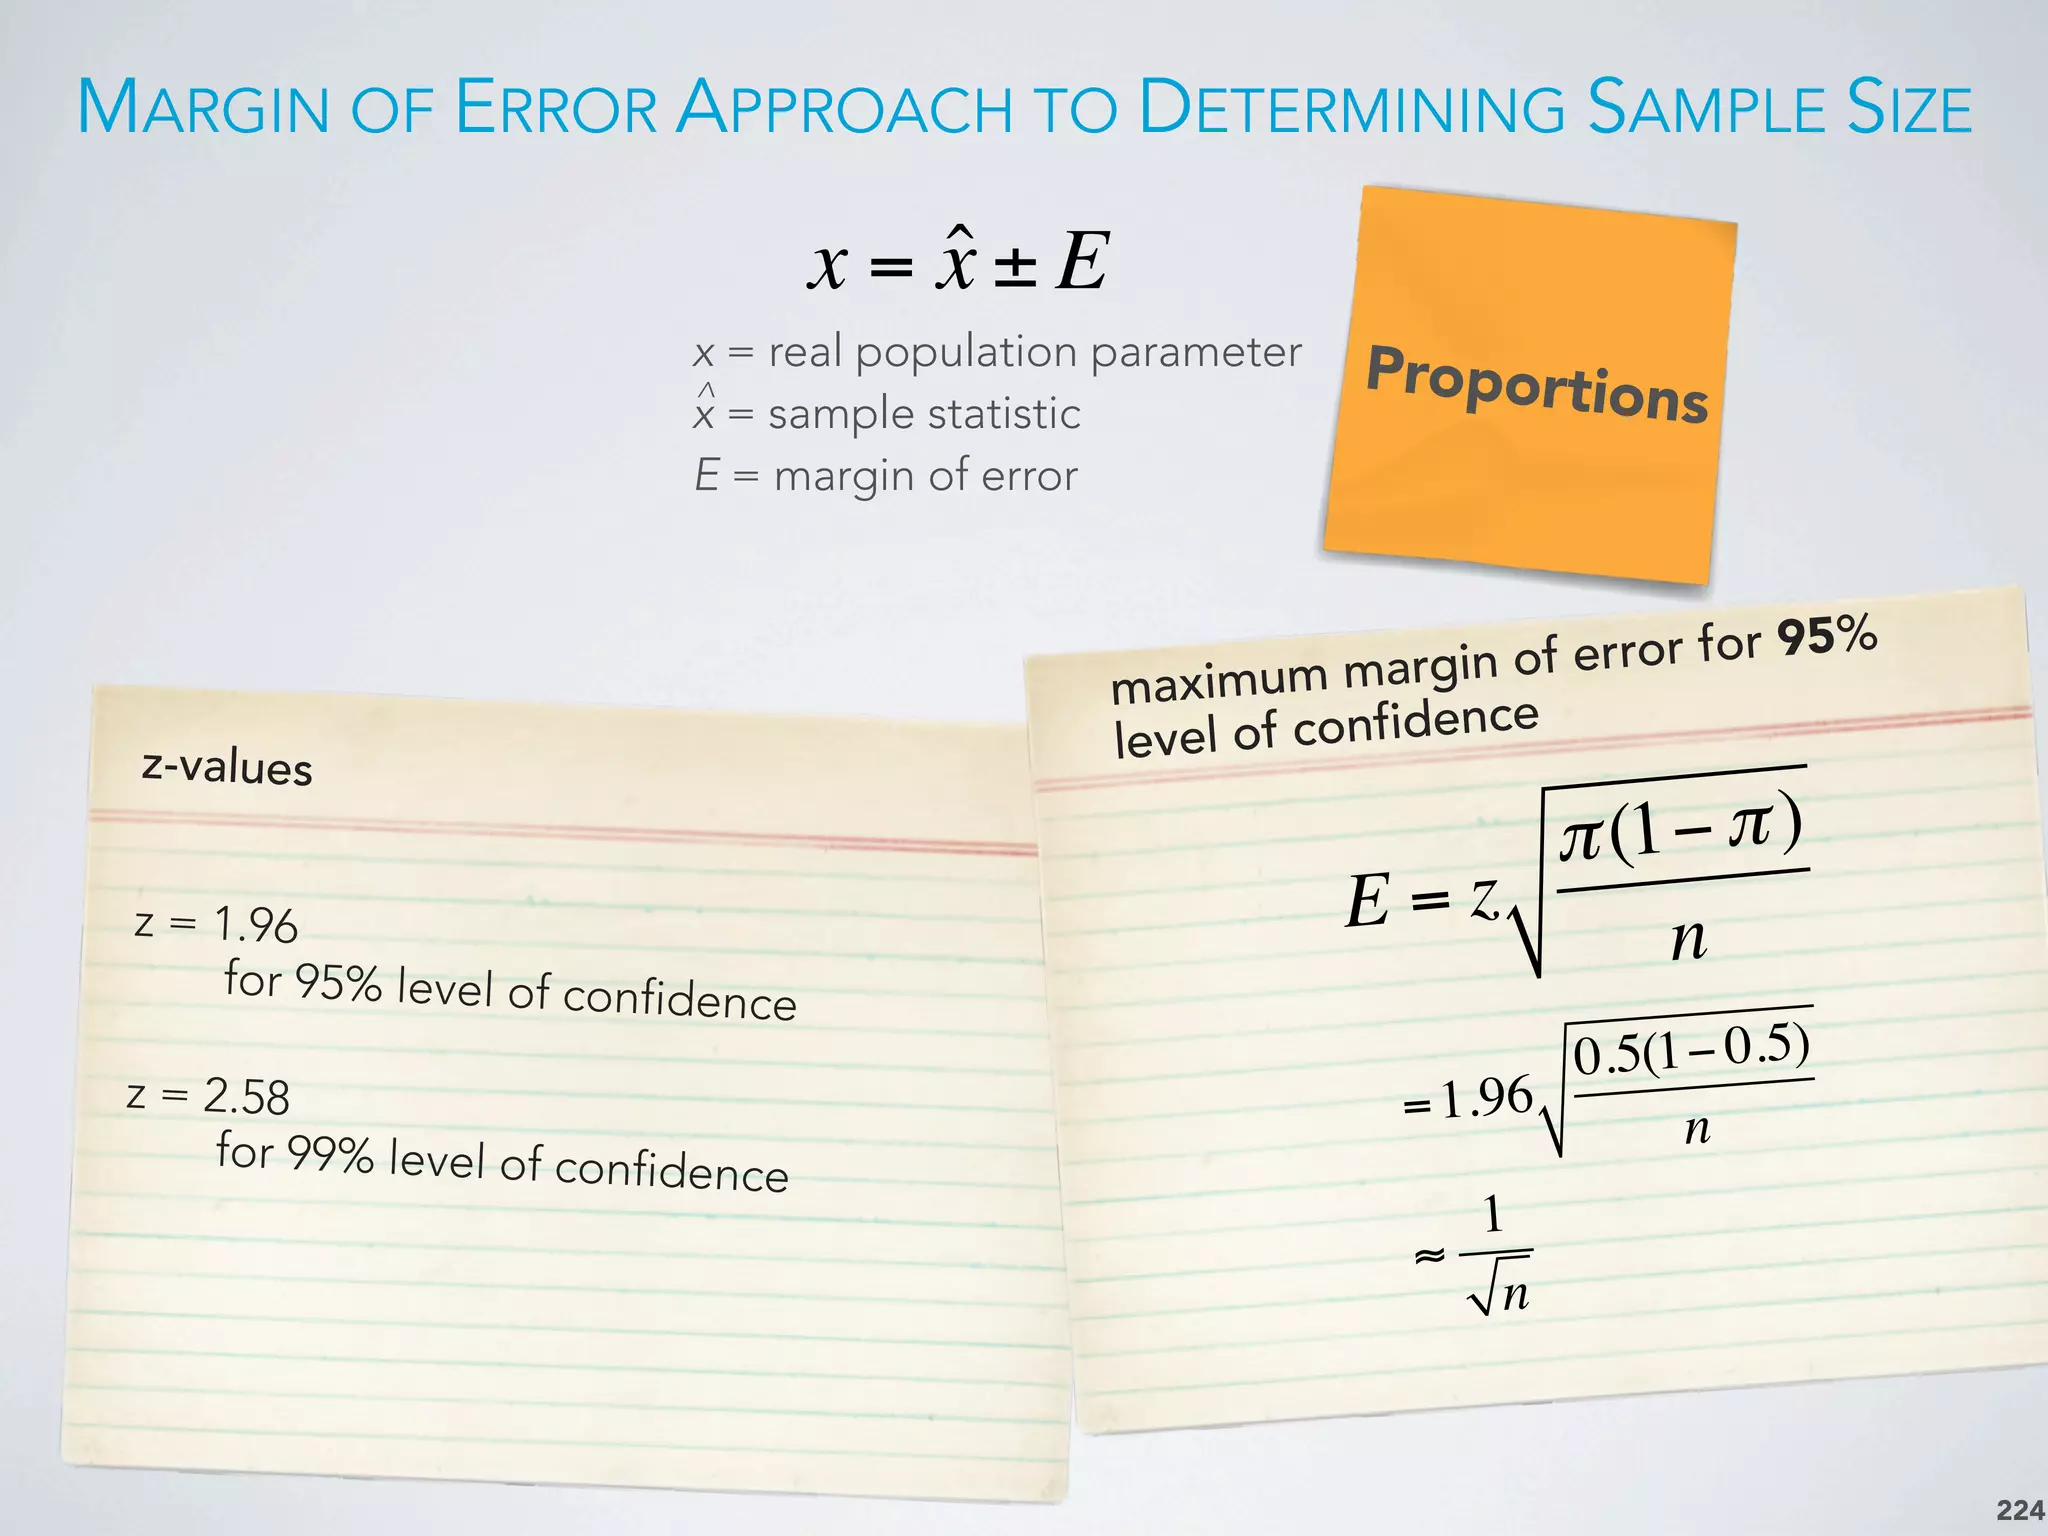
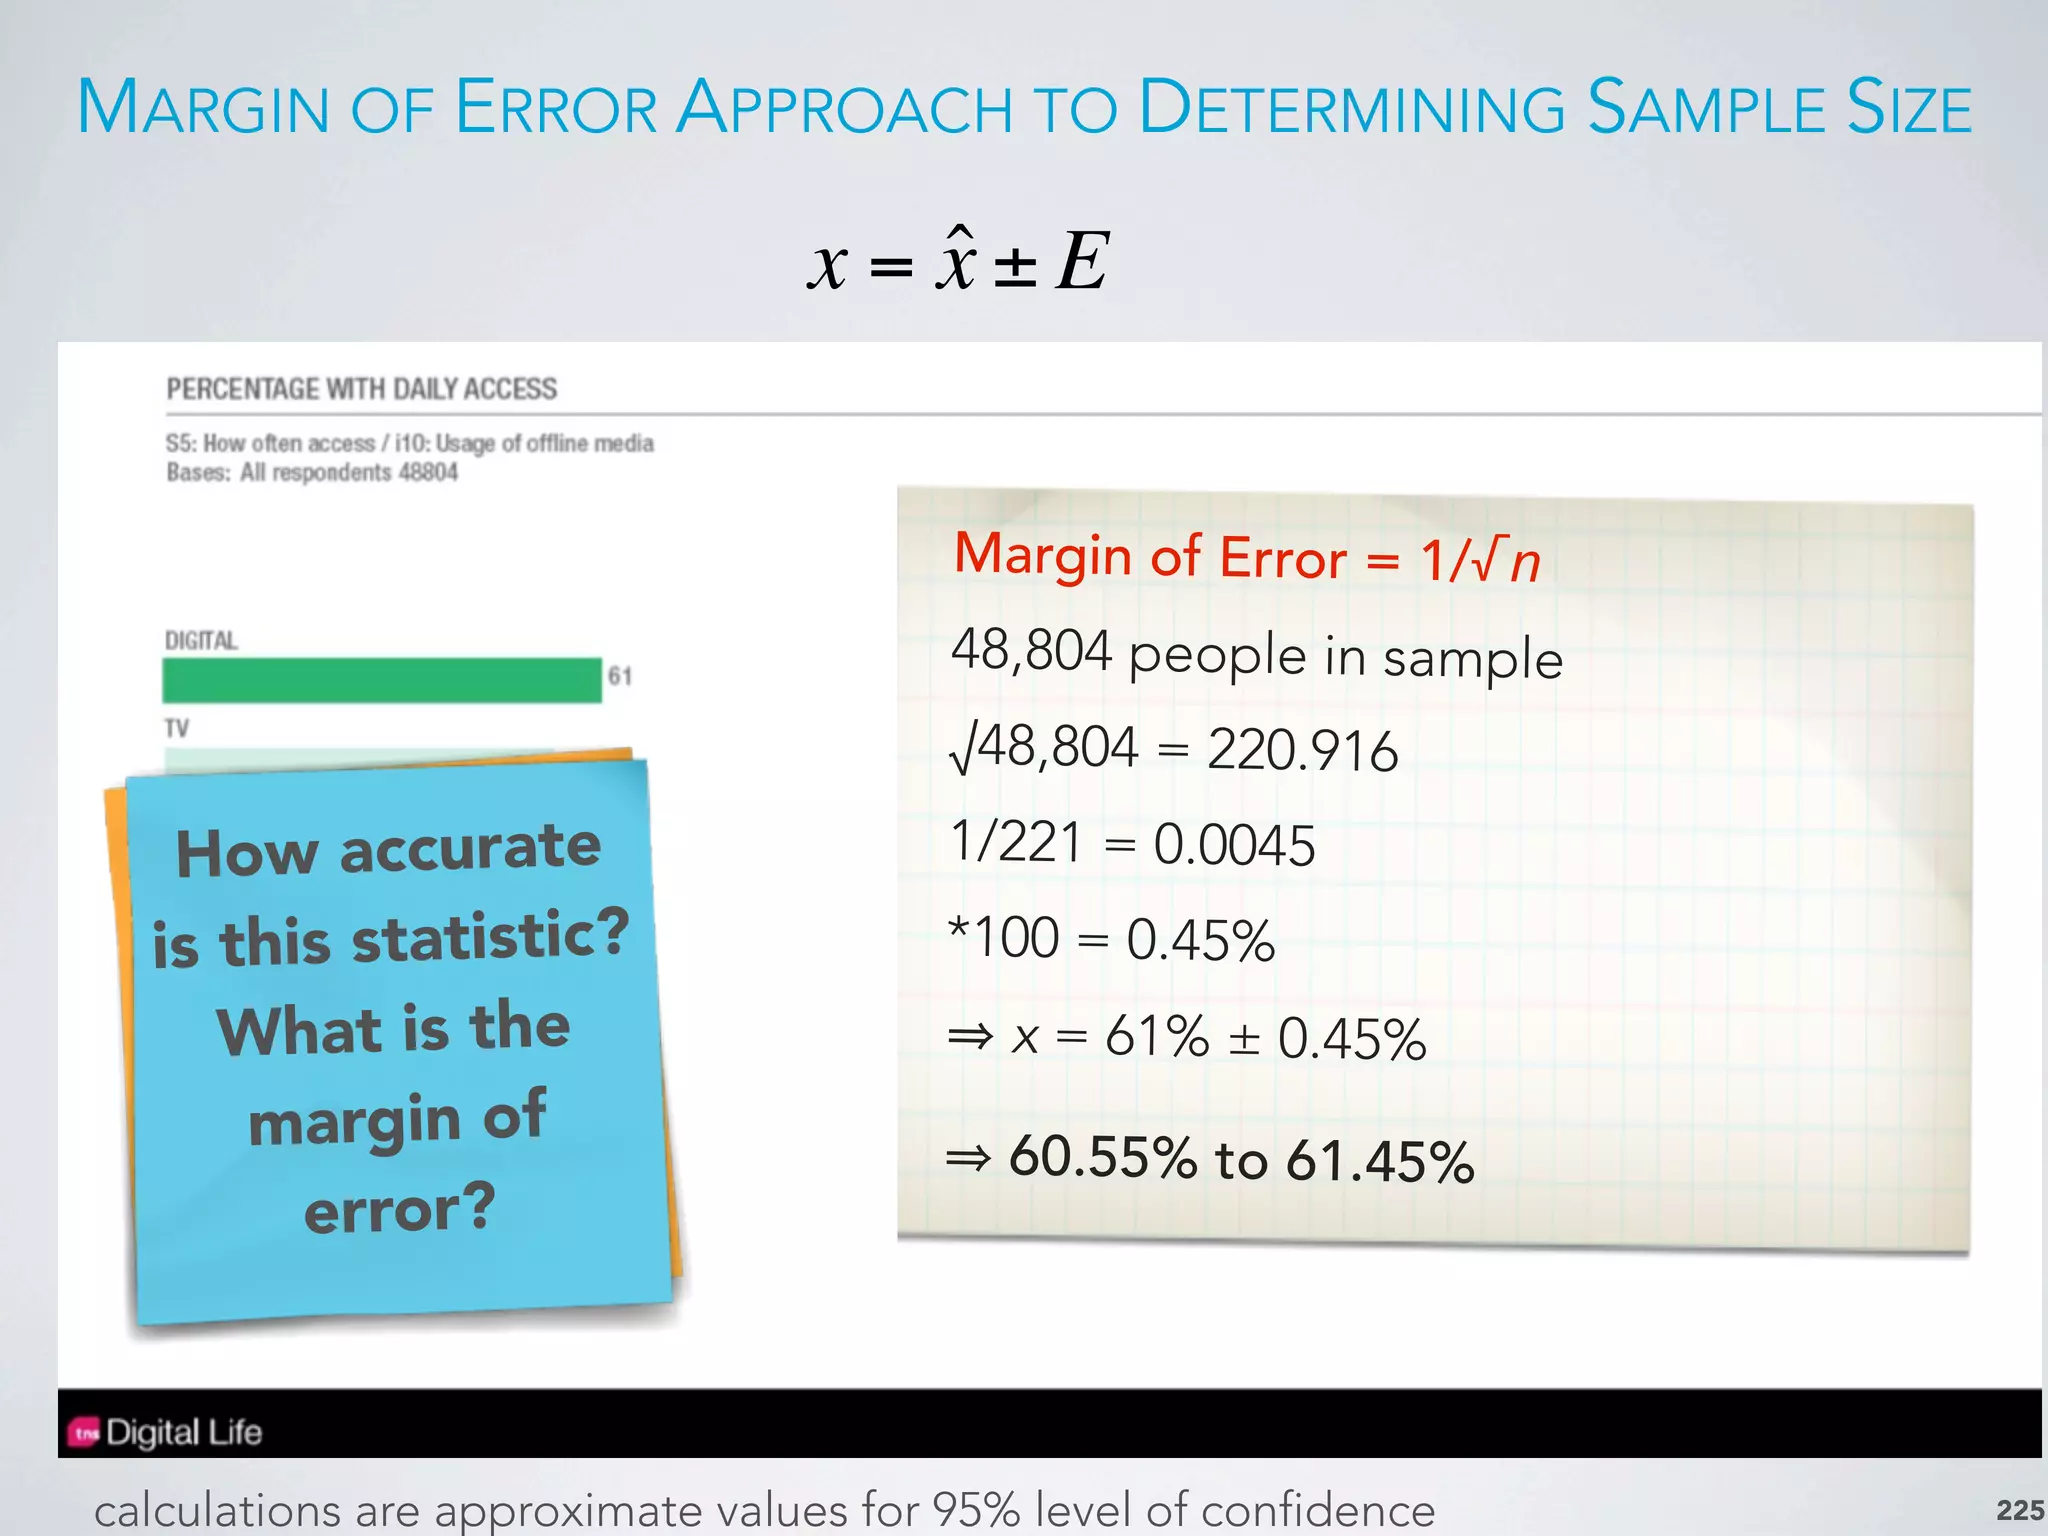
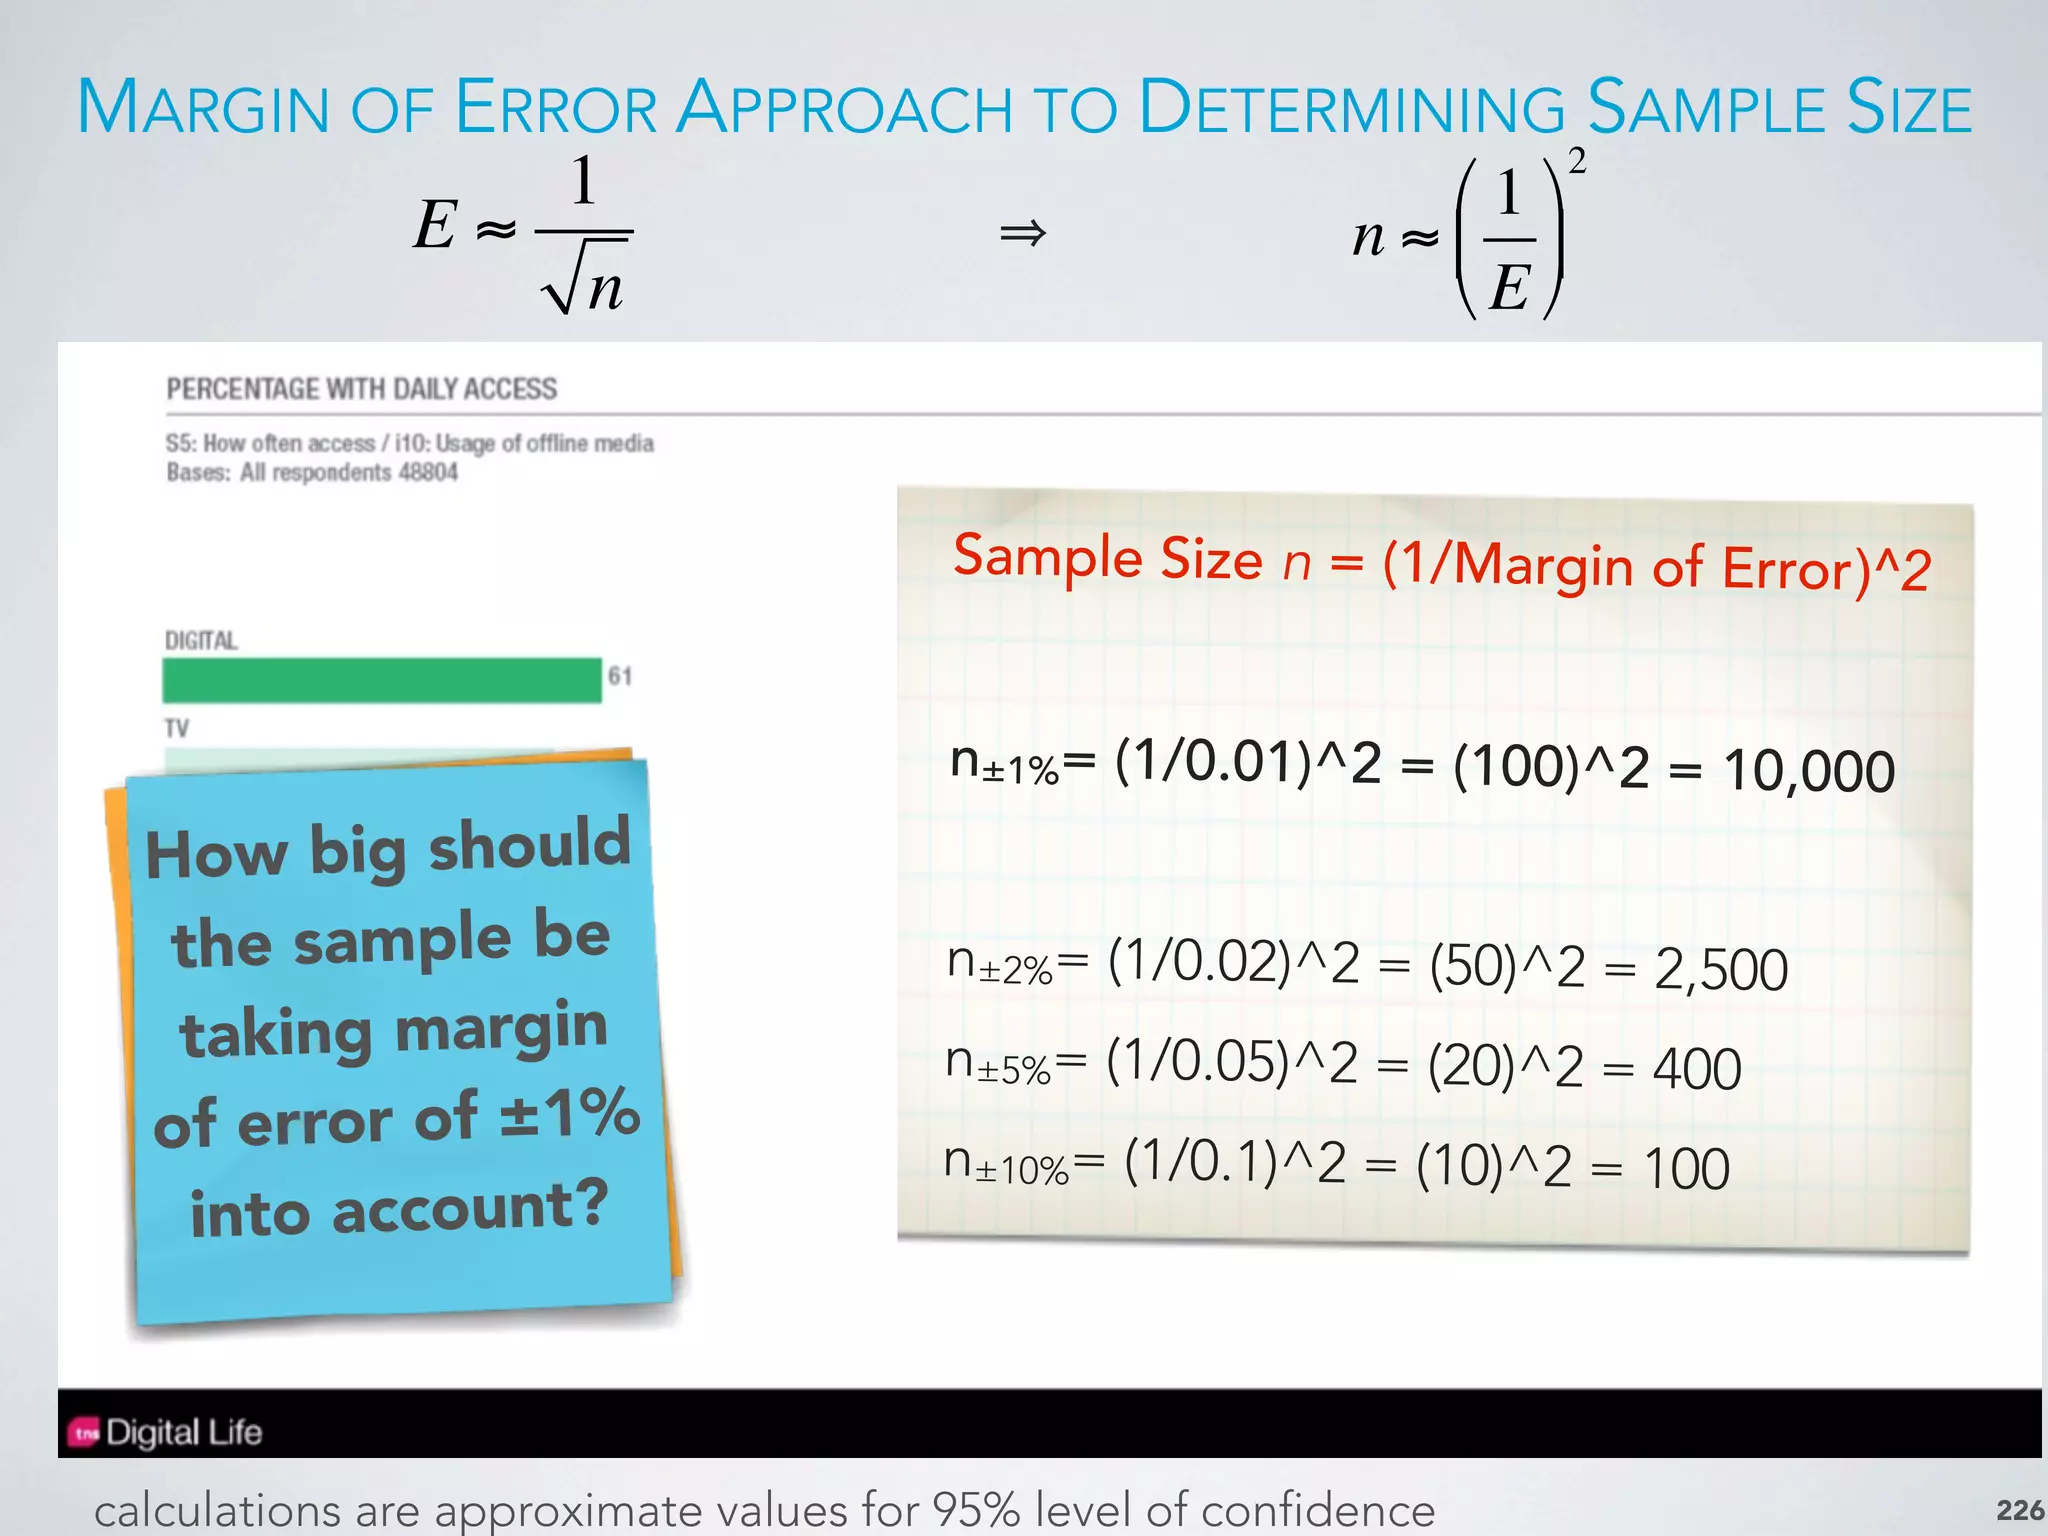
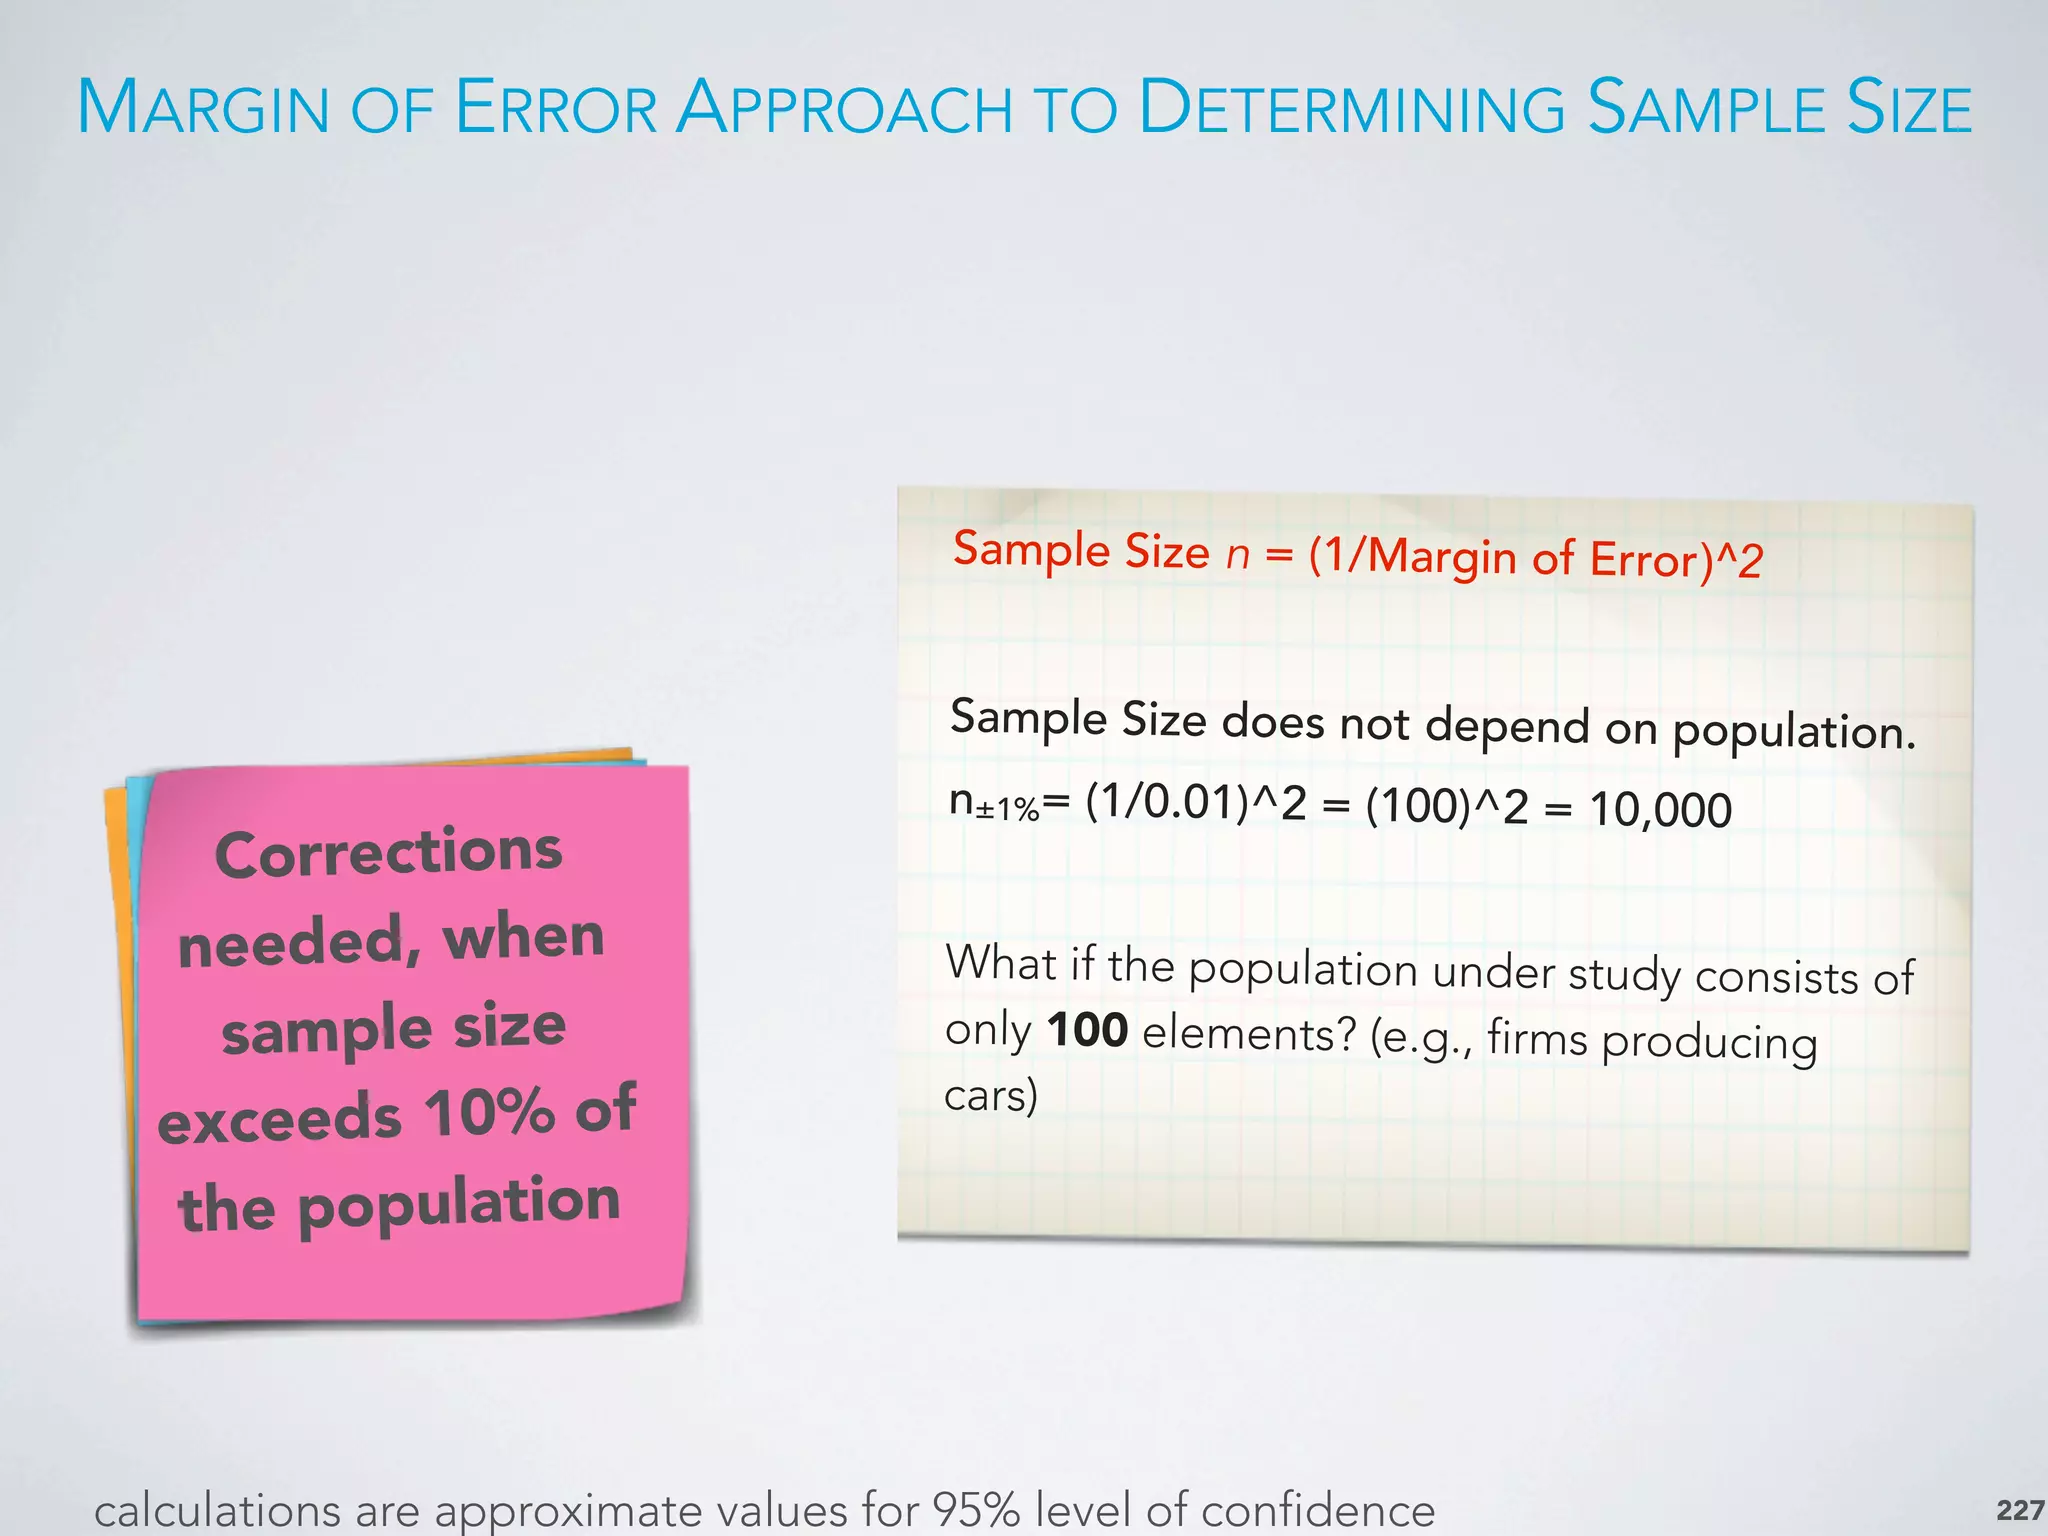
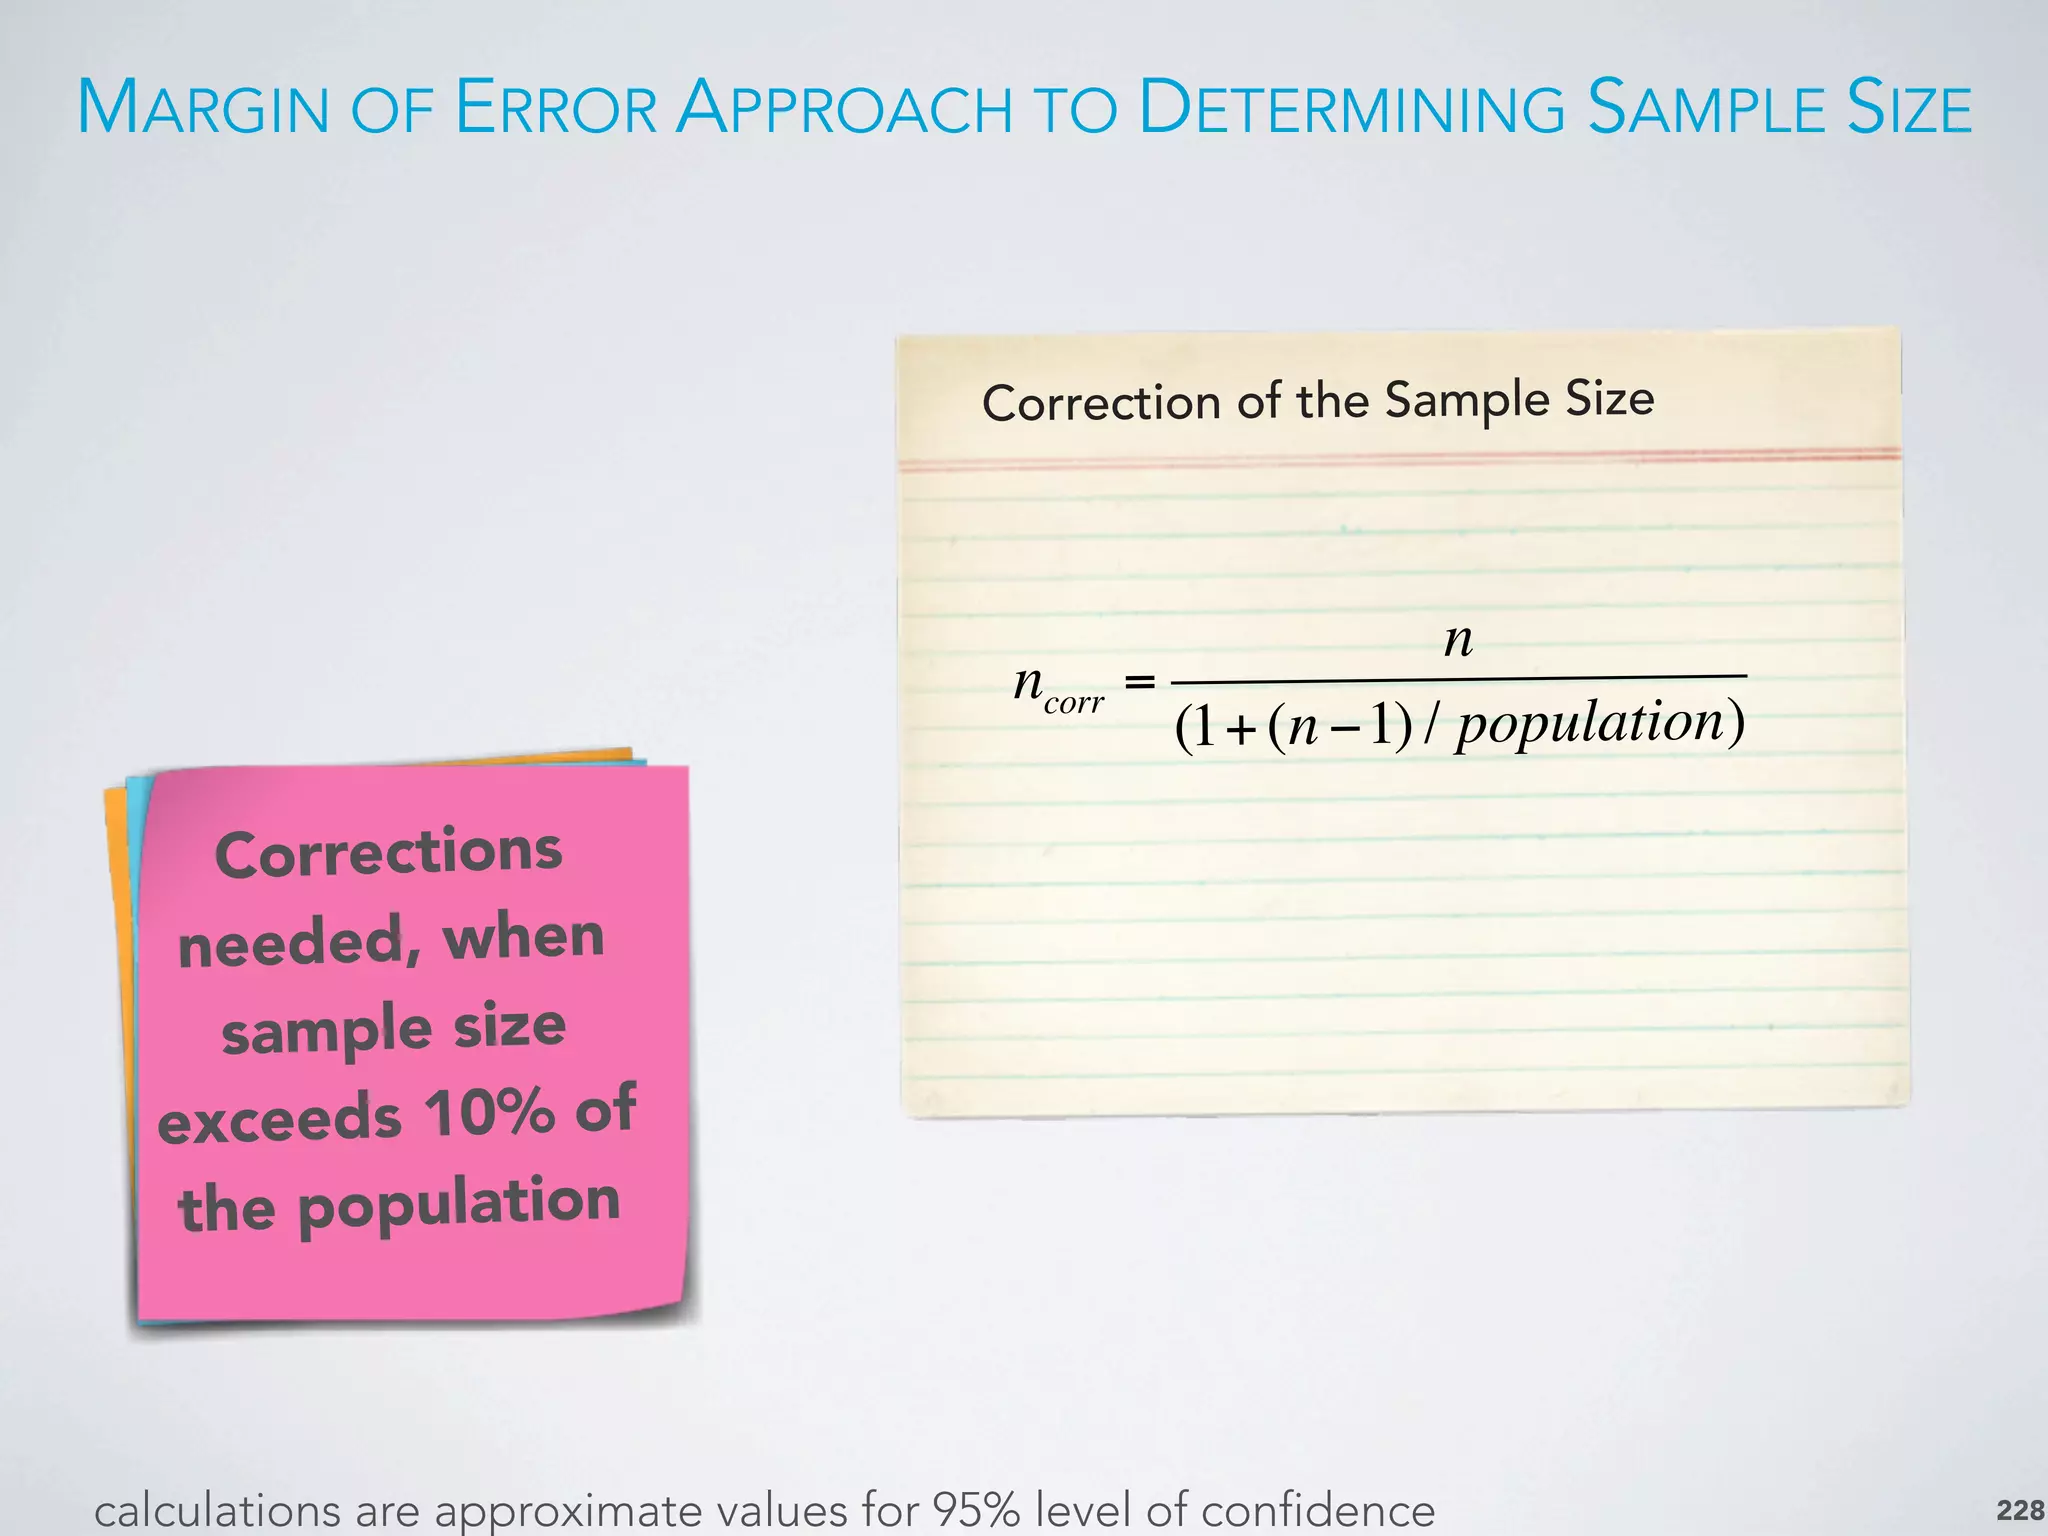
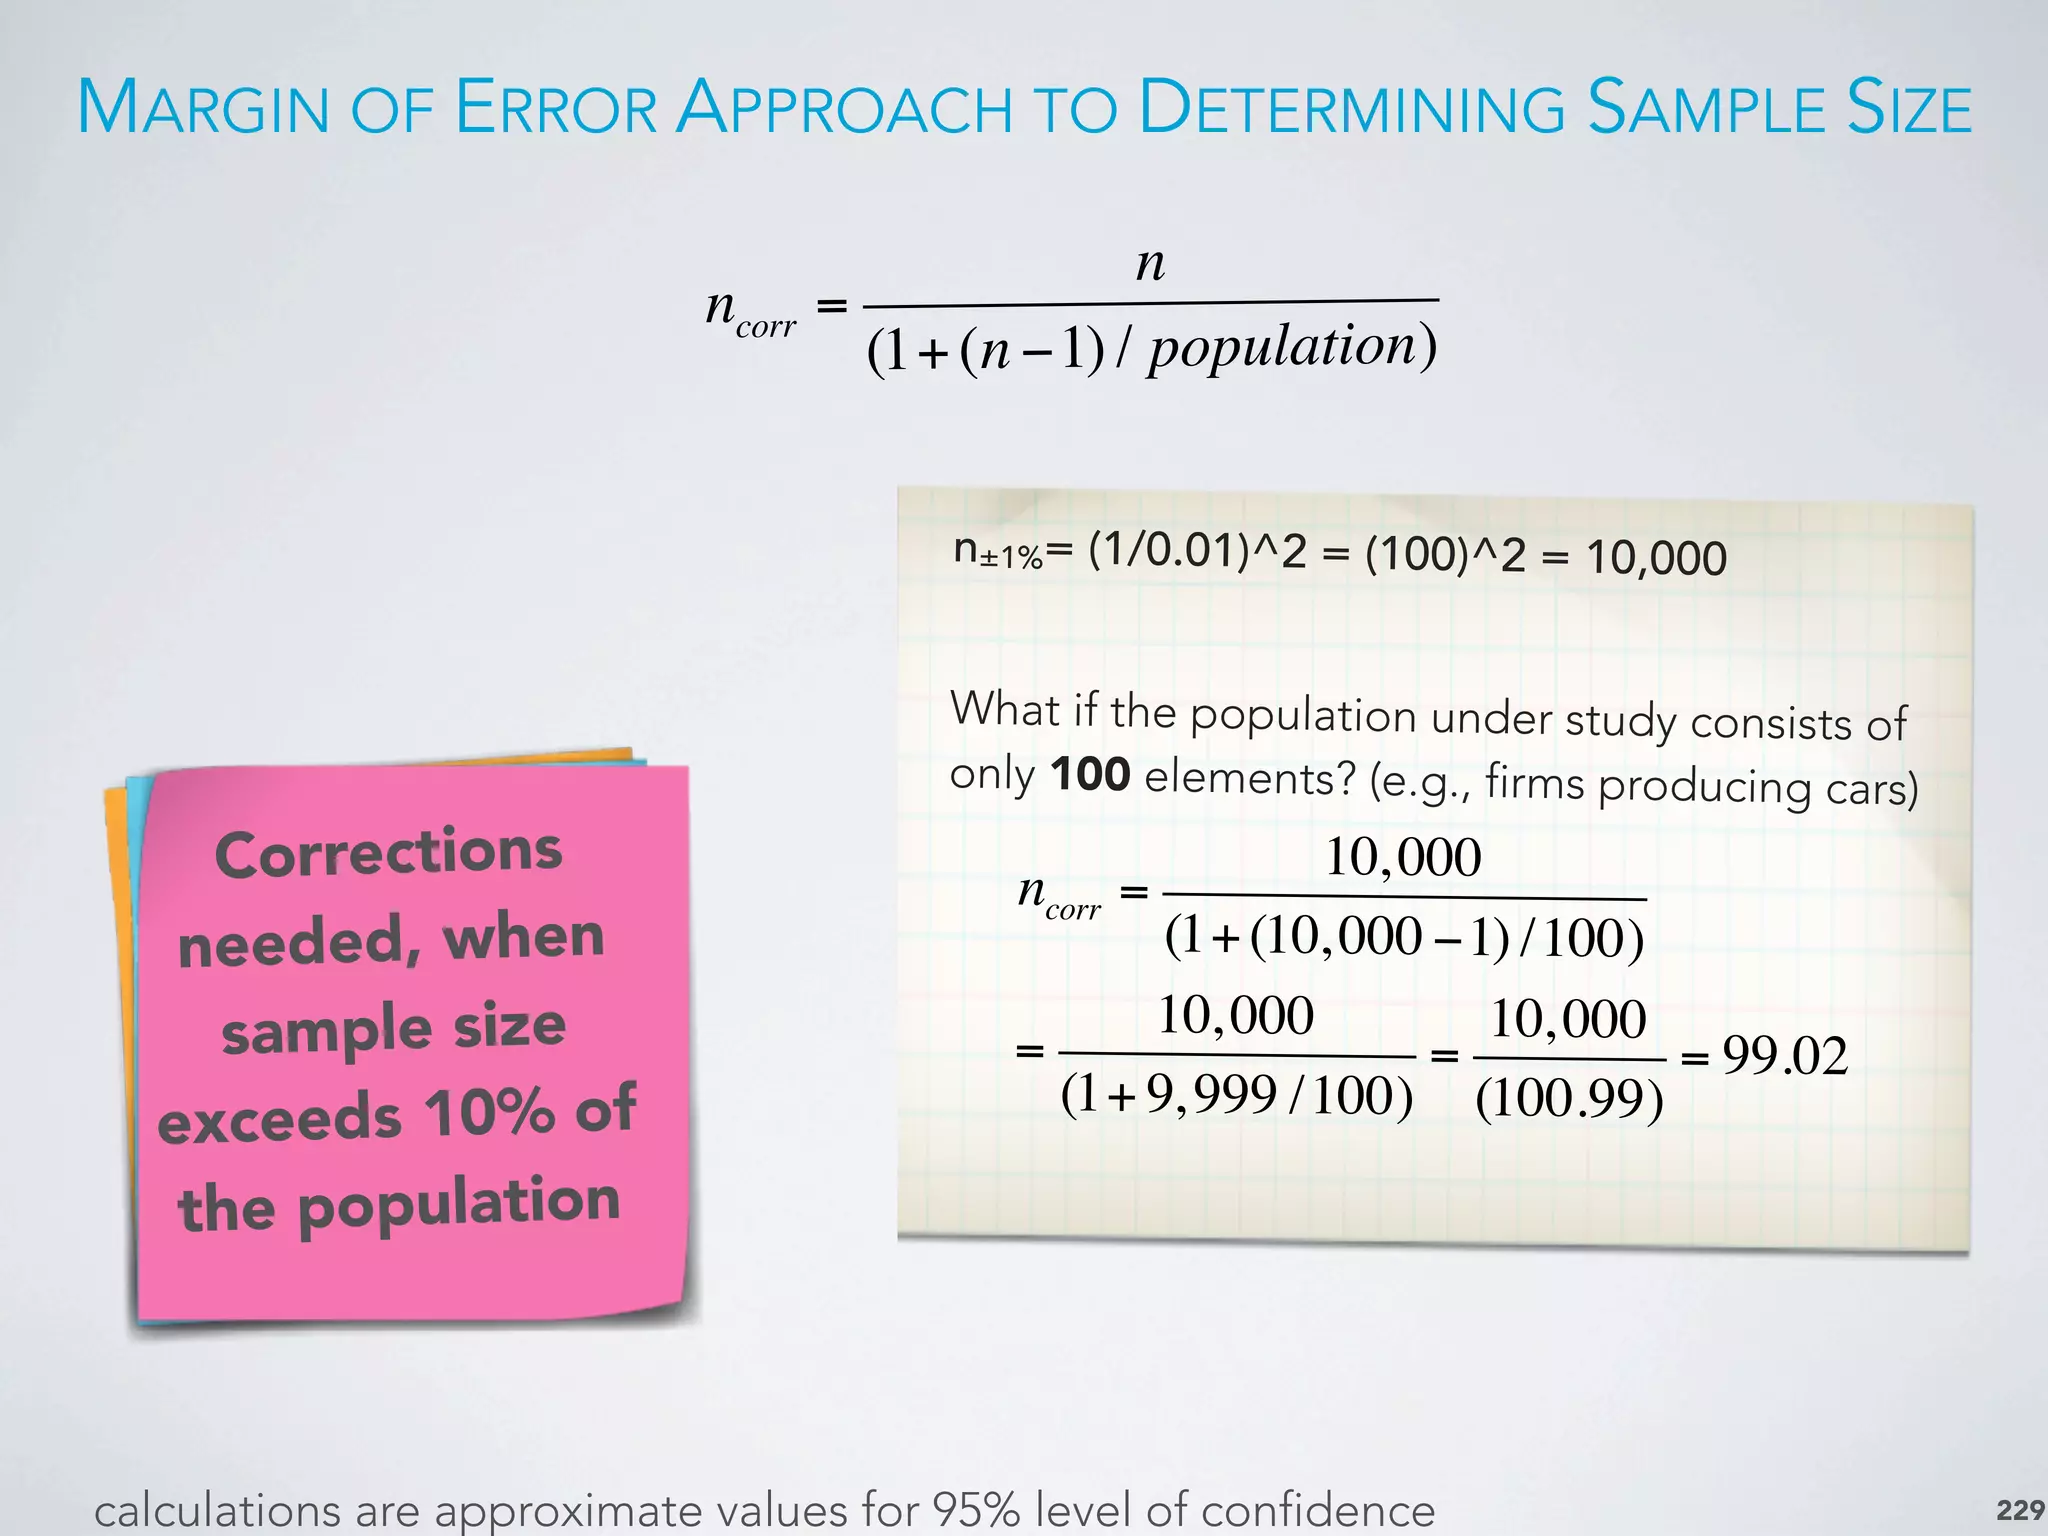
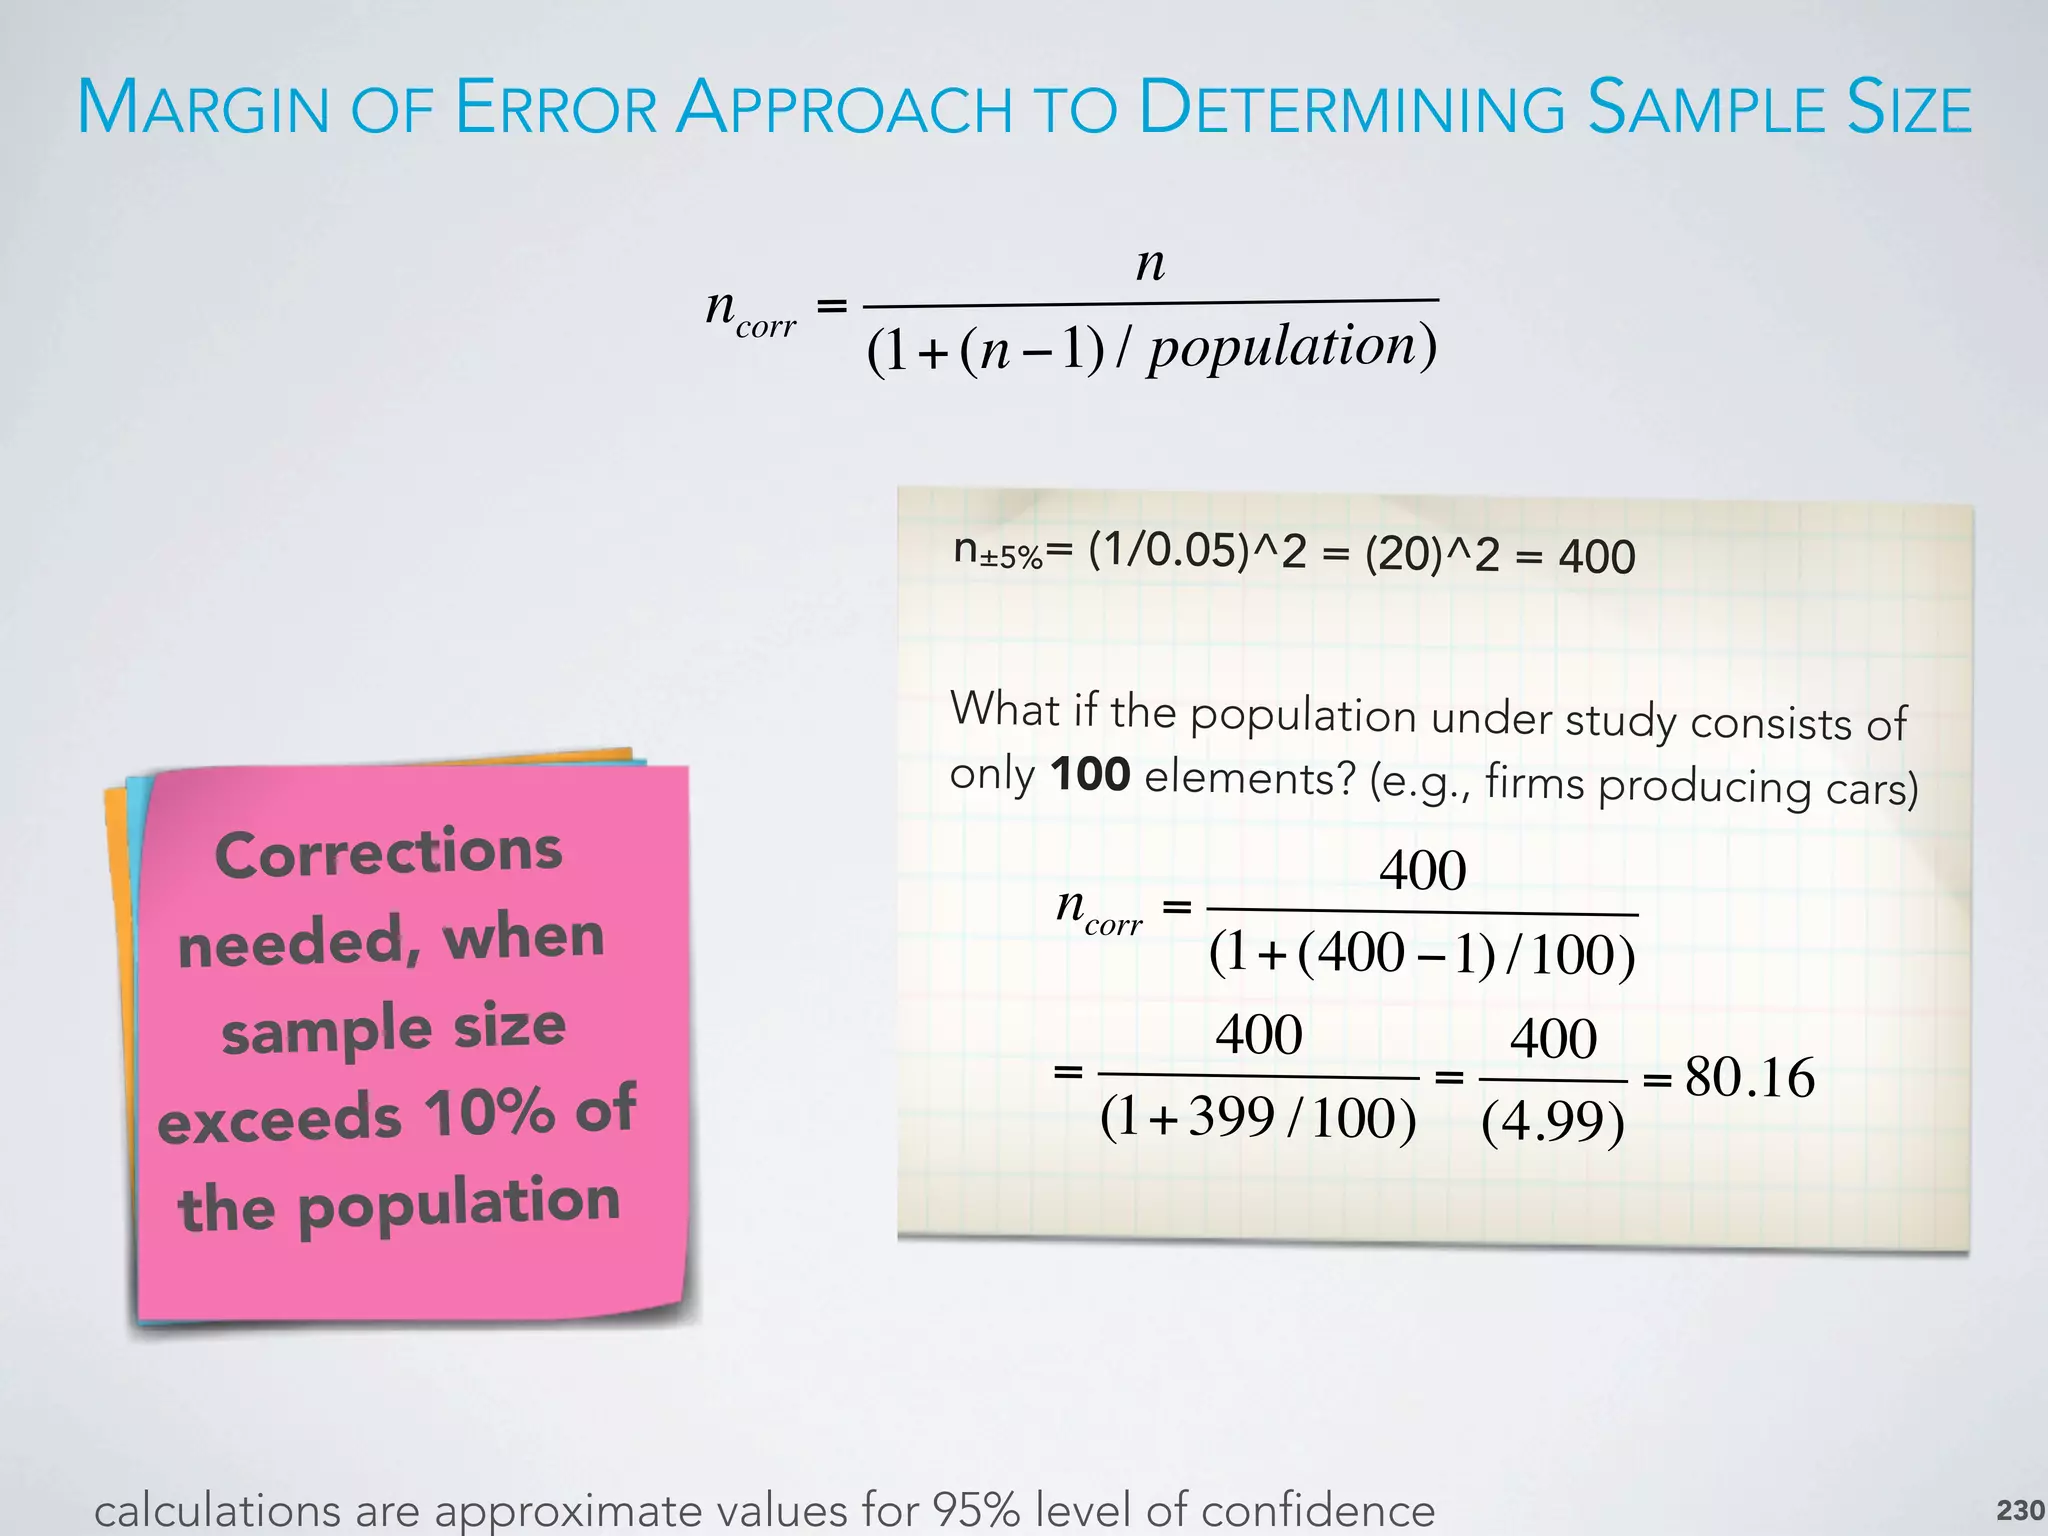
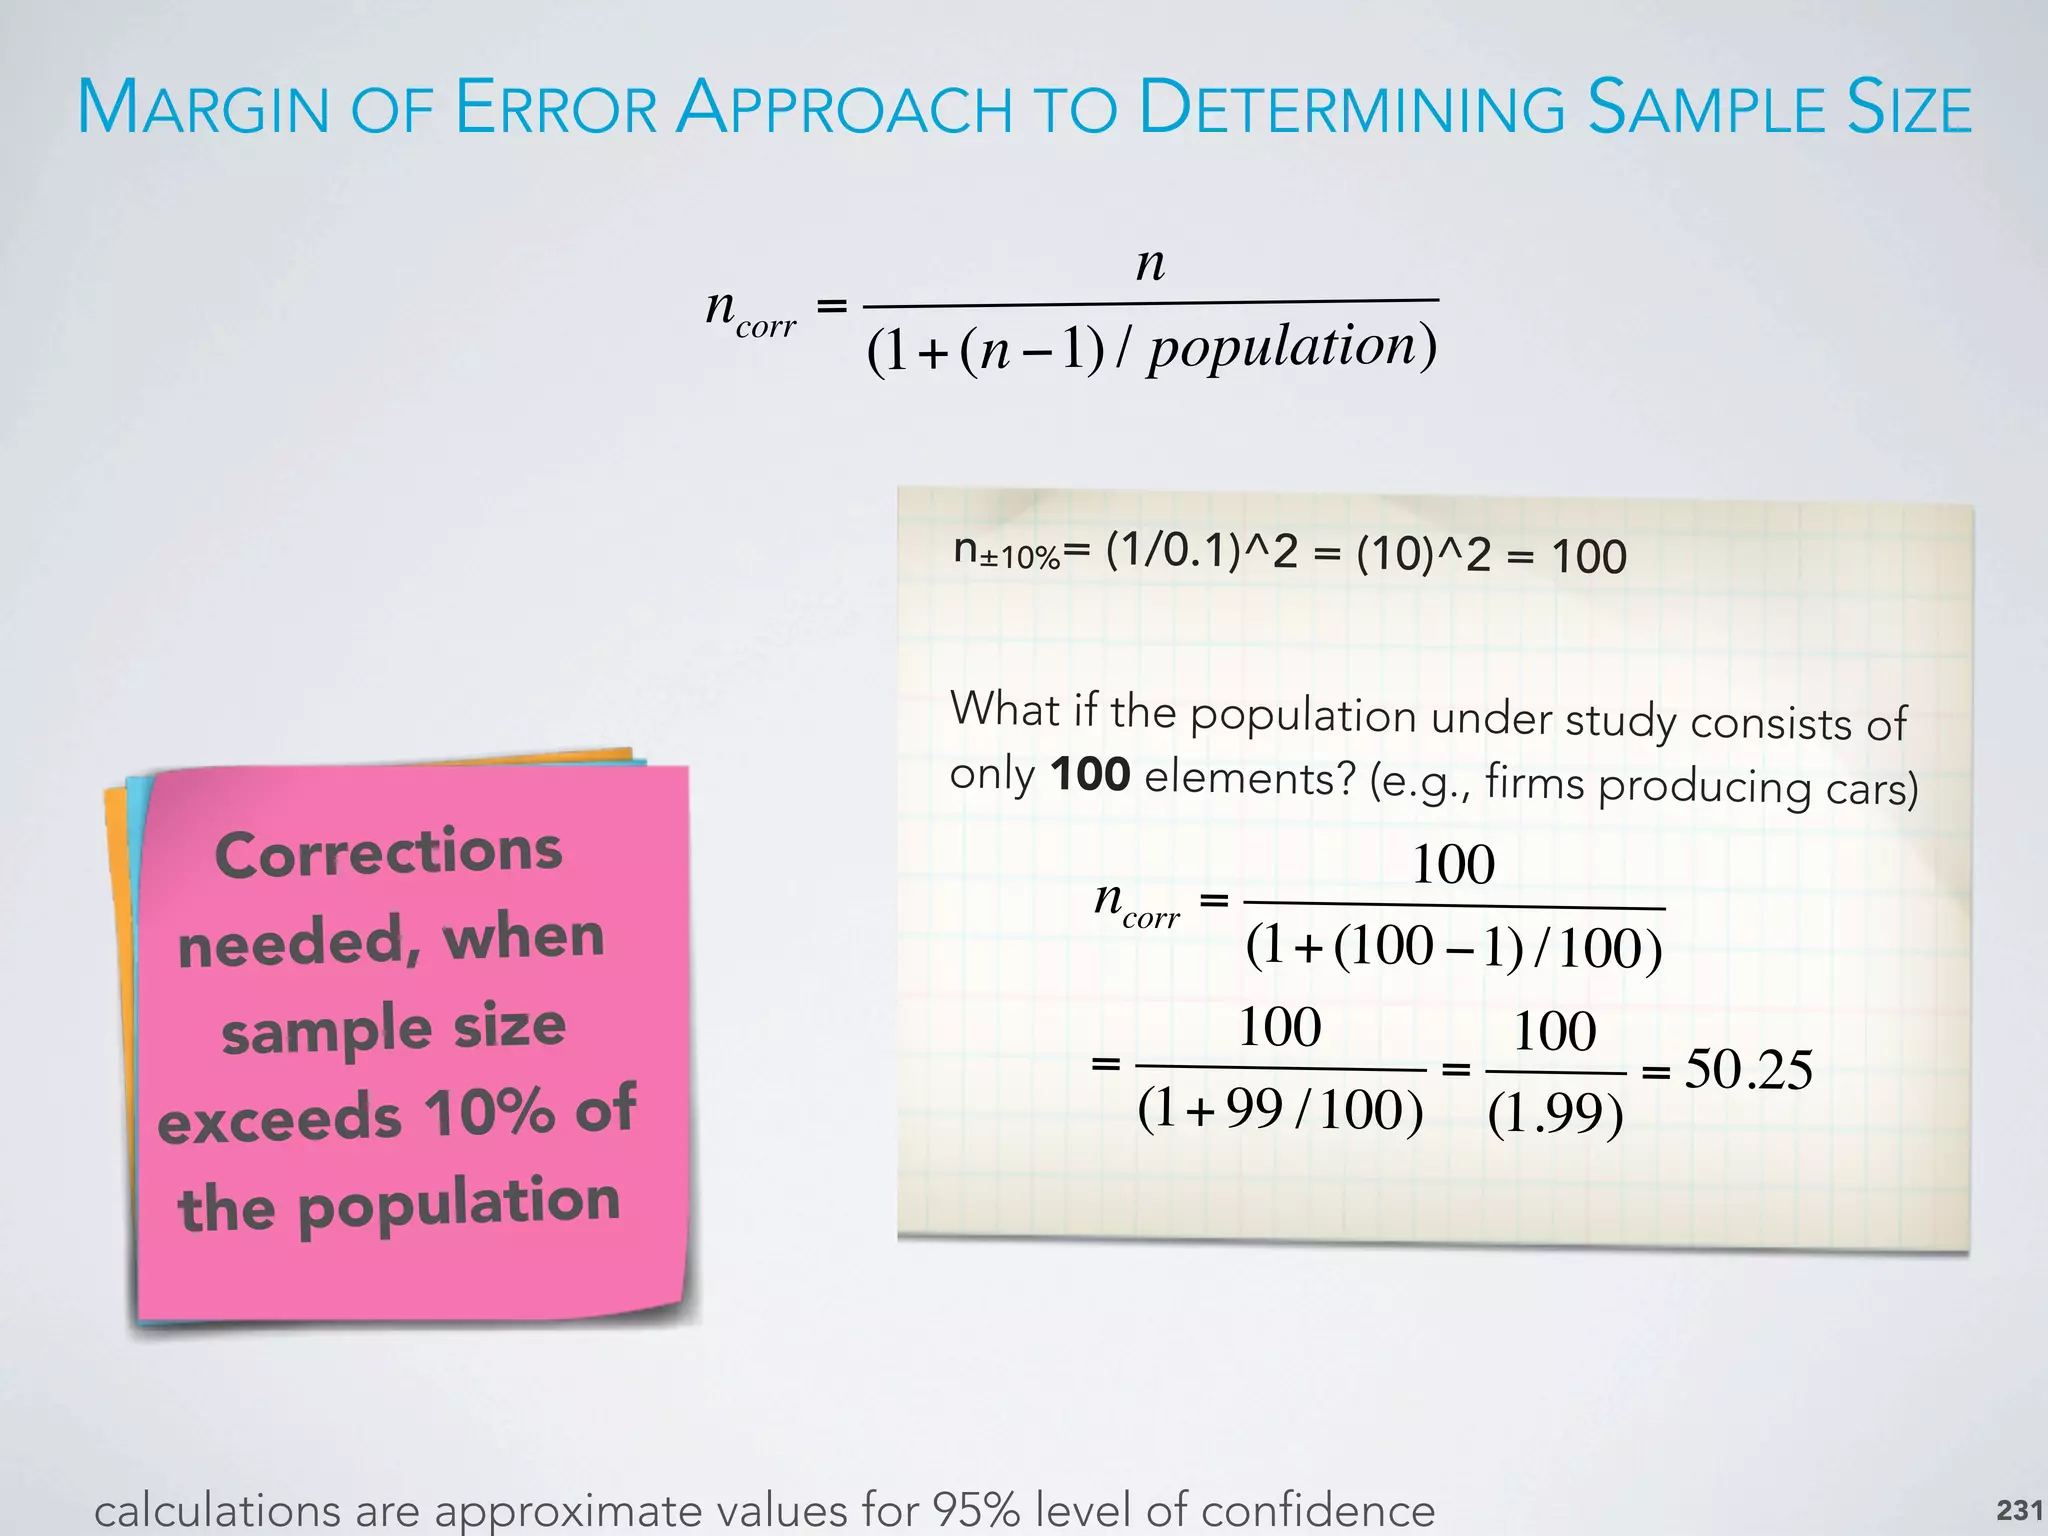
Overview of sampling strategies including non-probability and probability sampling types and their applications.
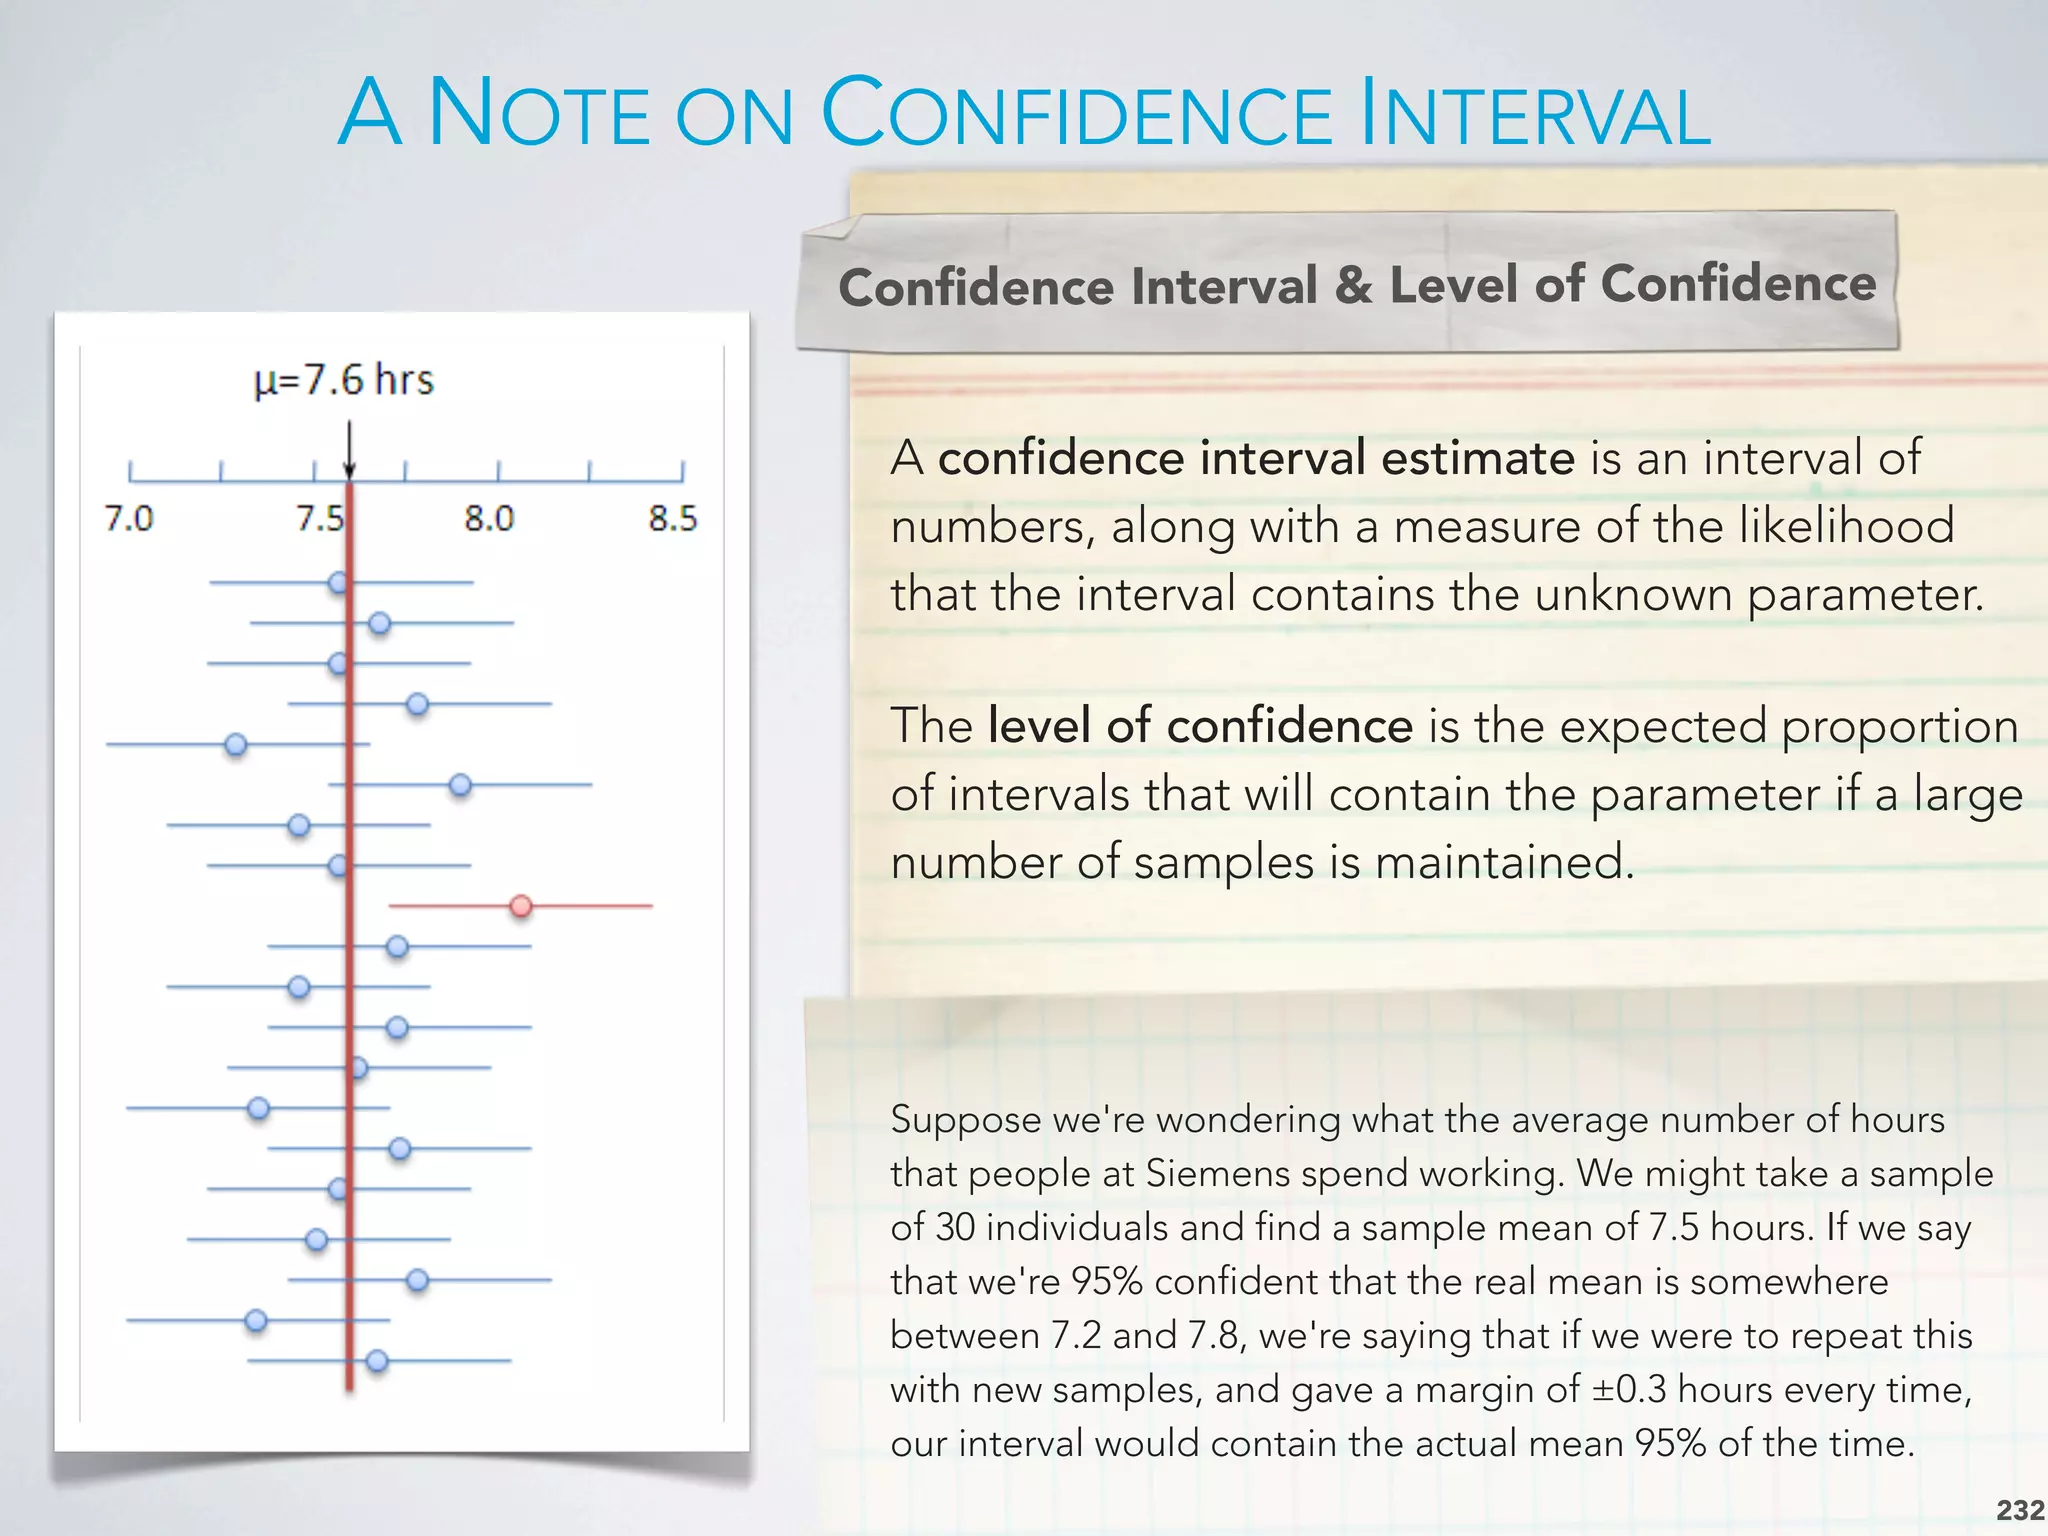
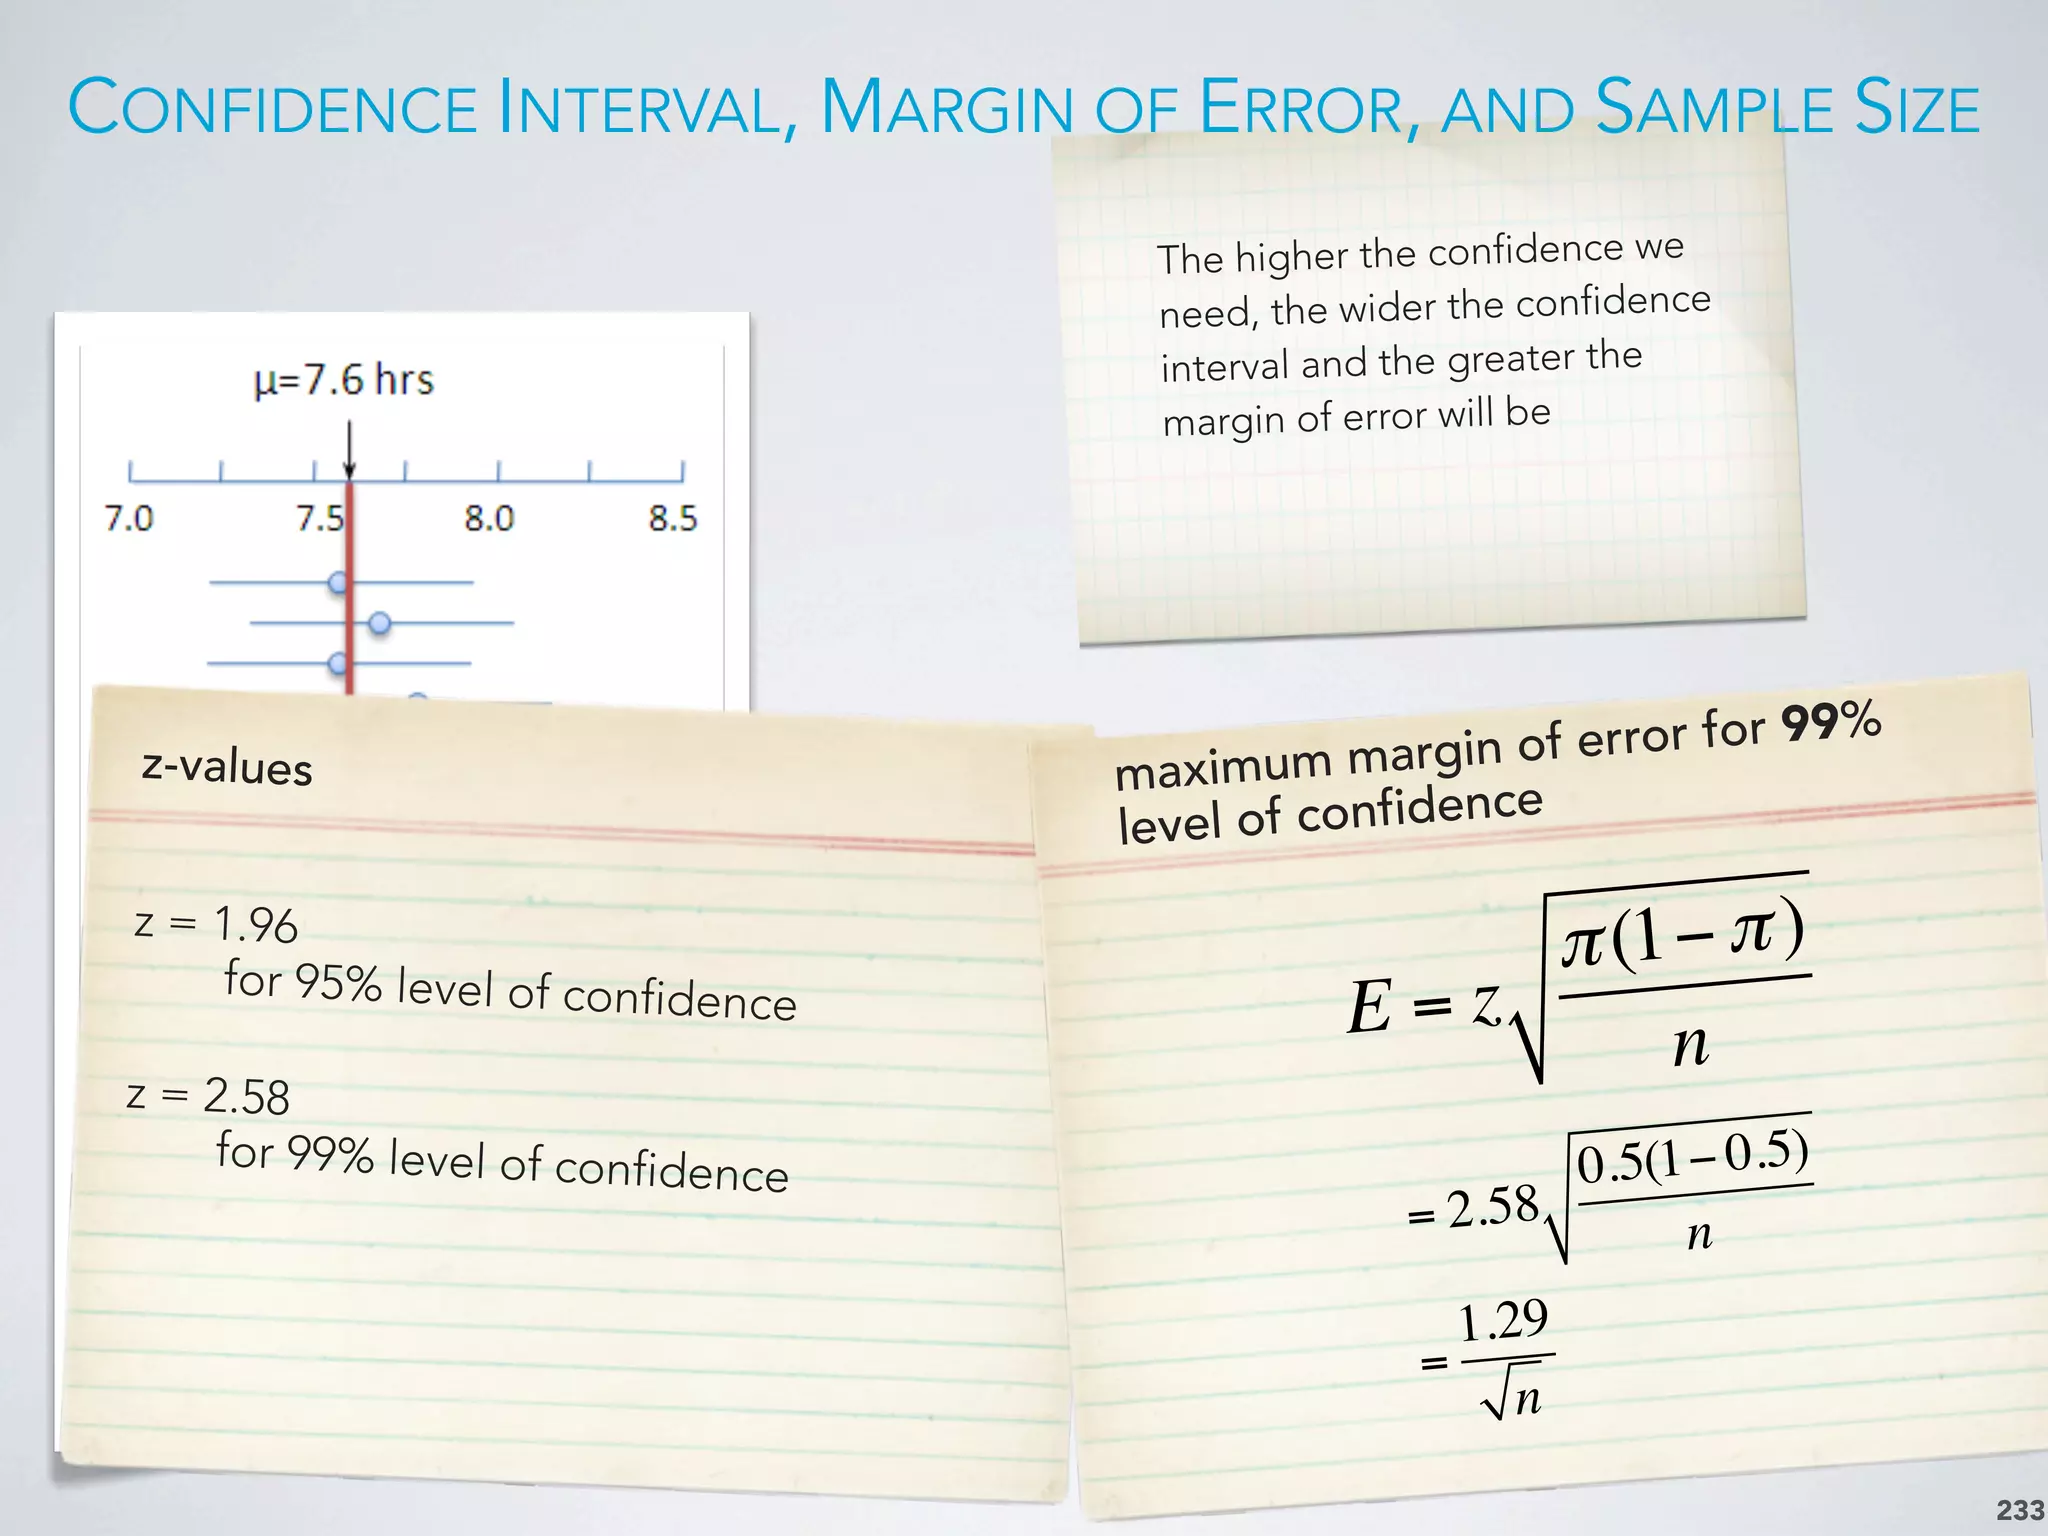
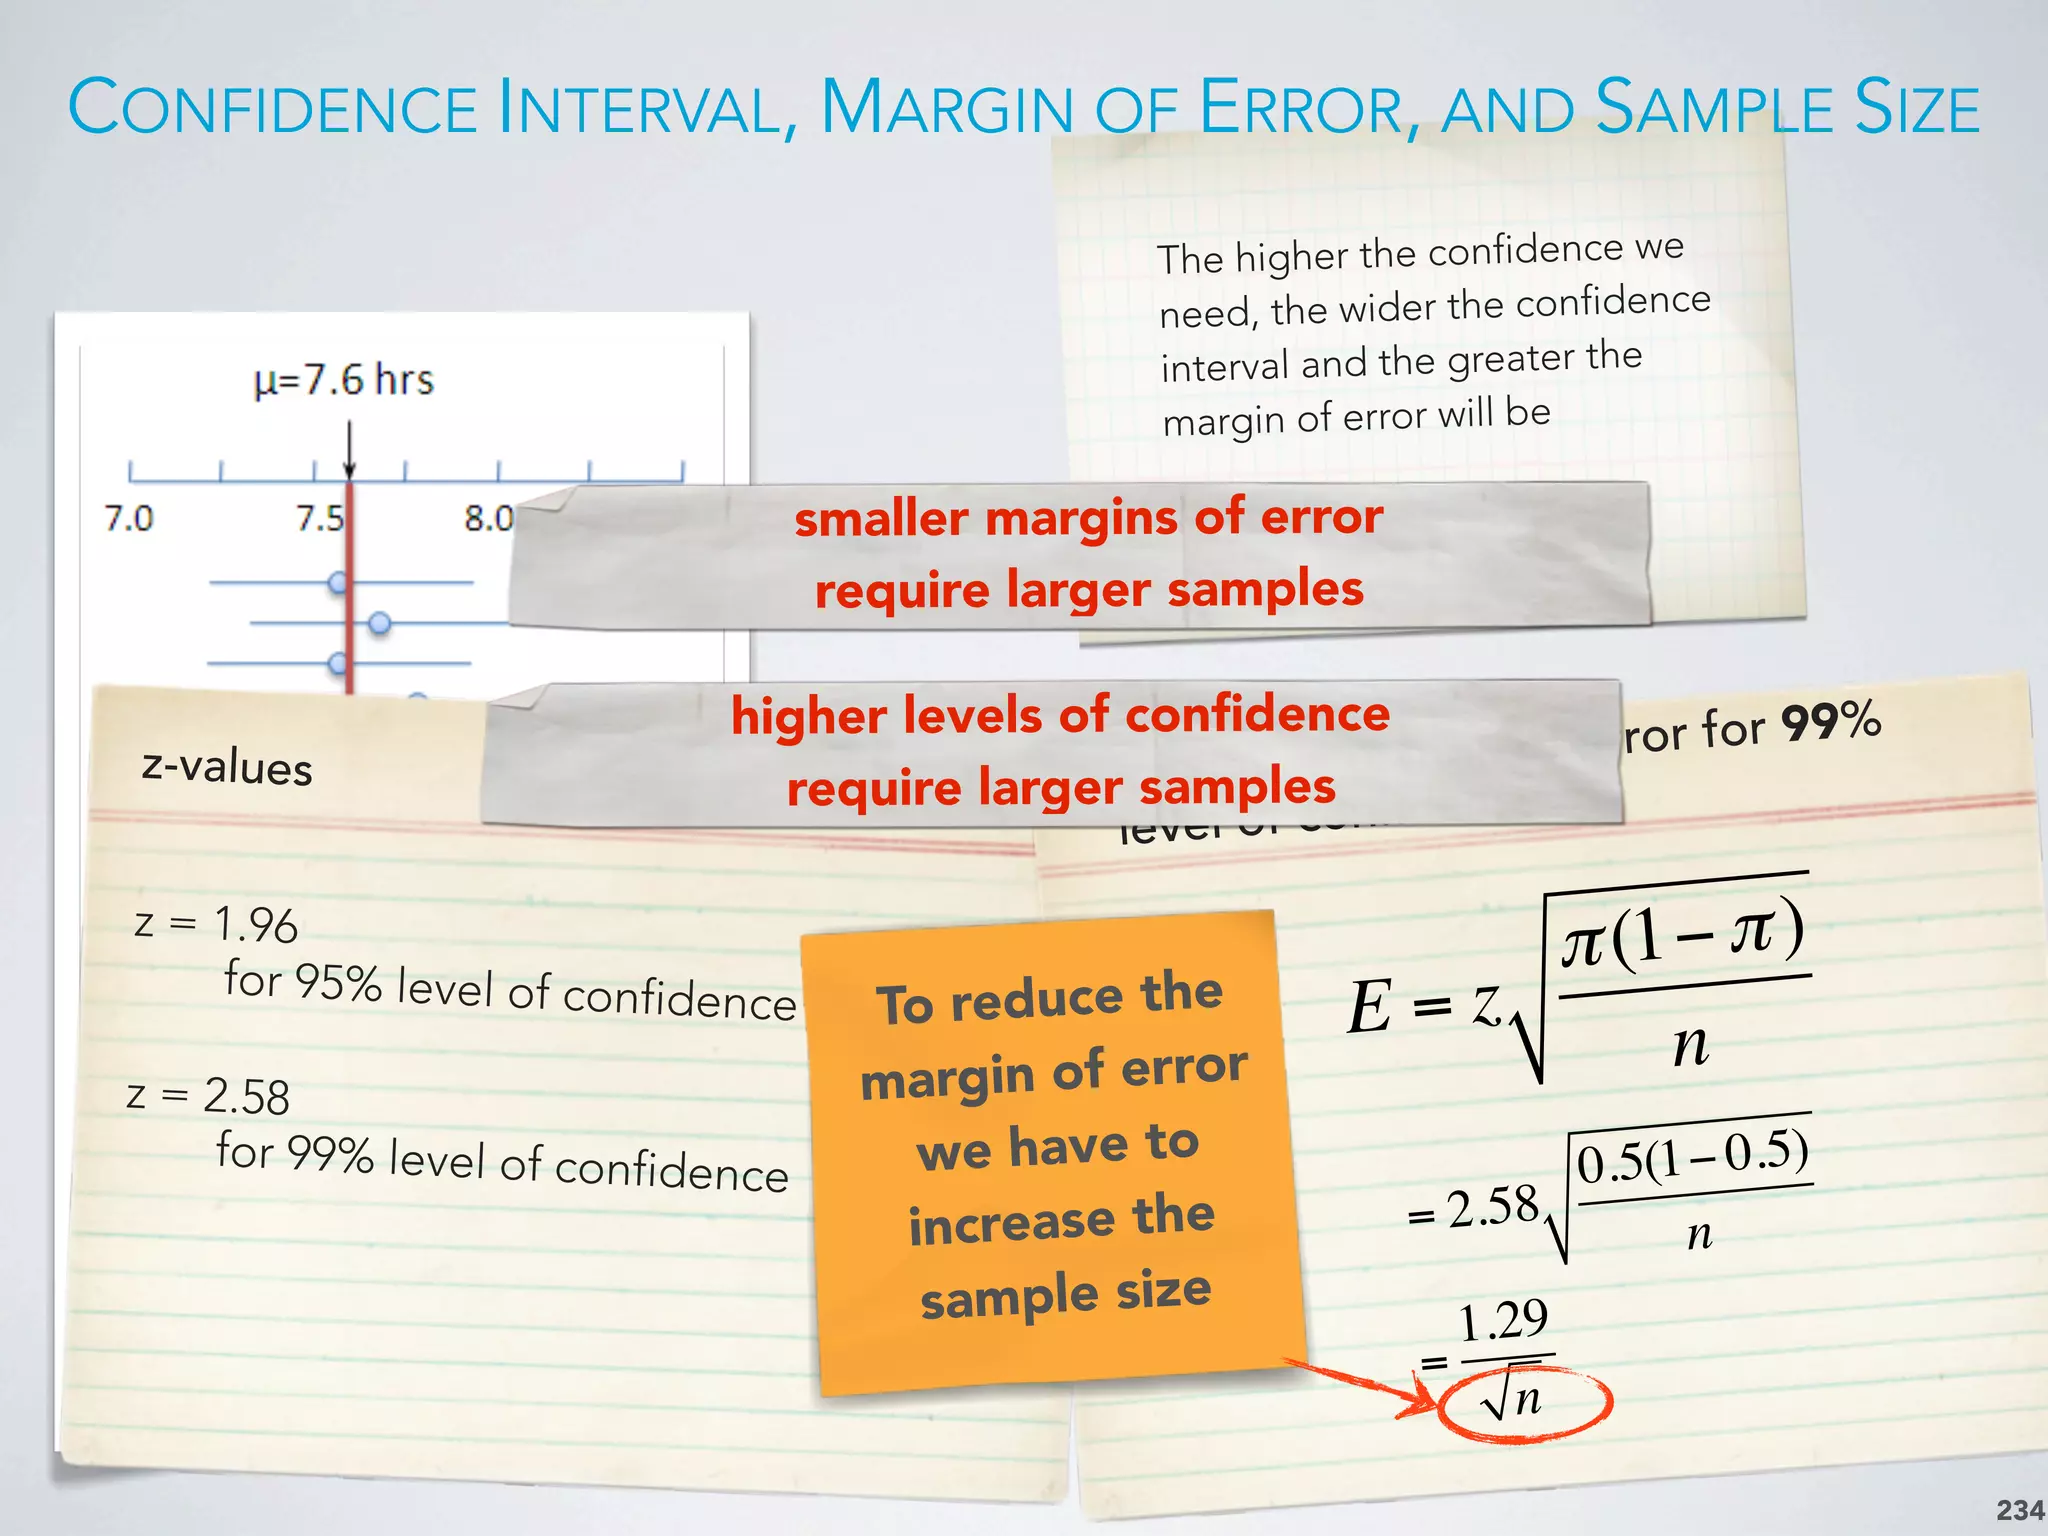
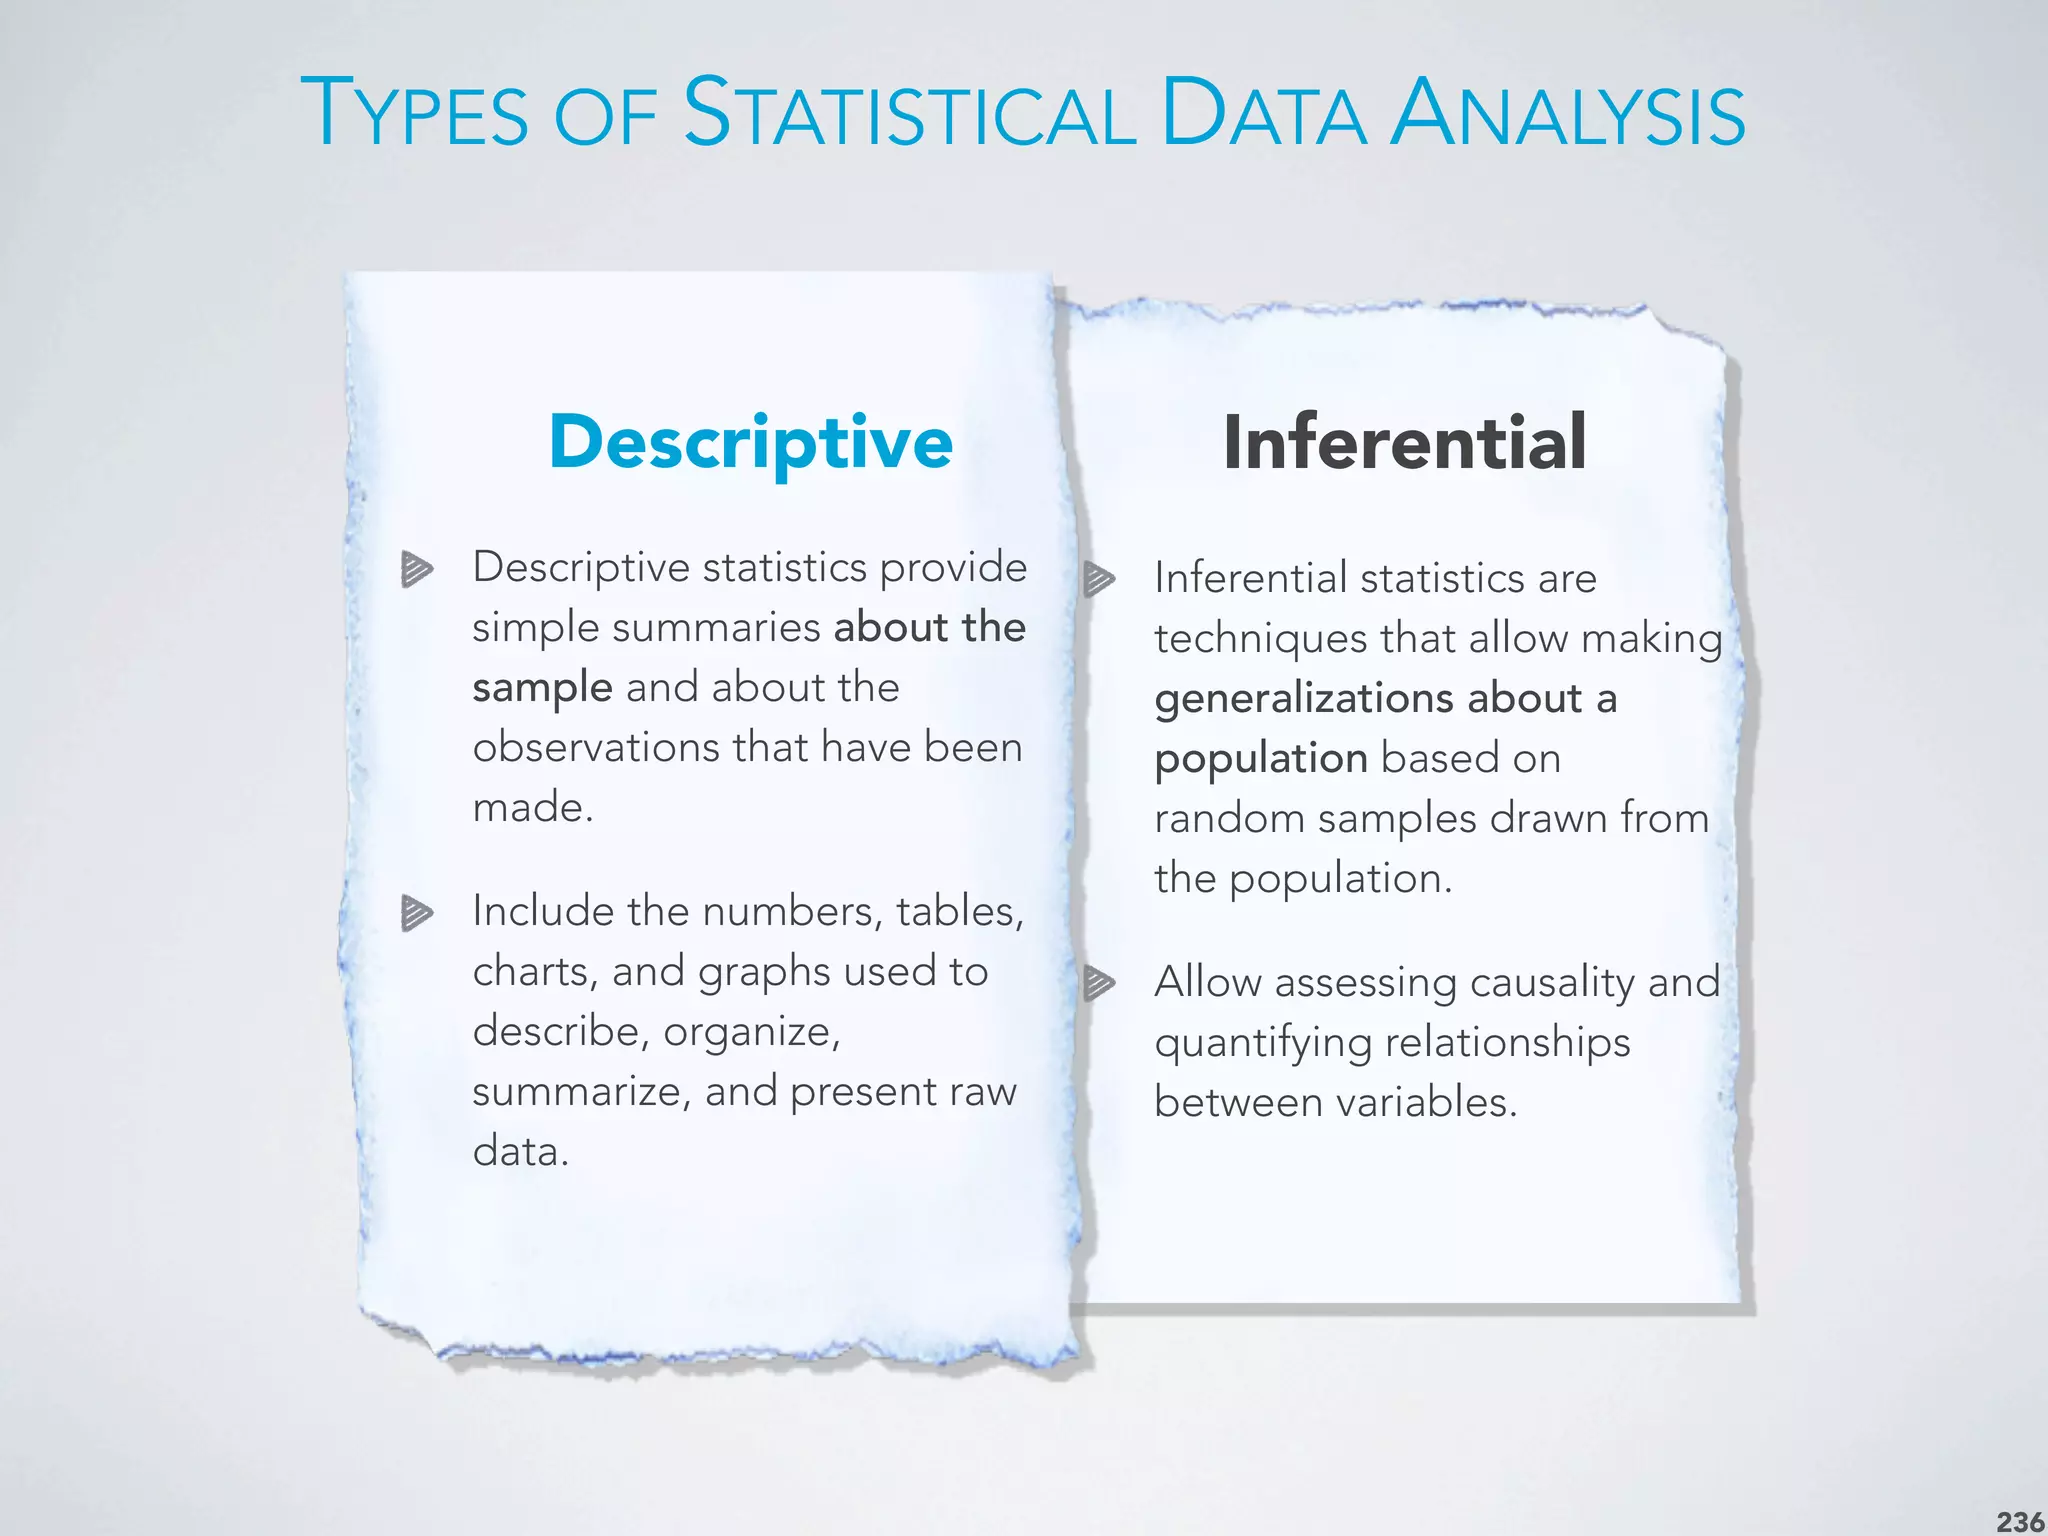
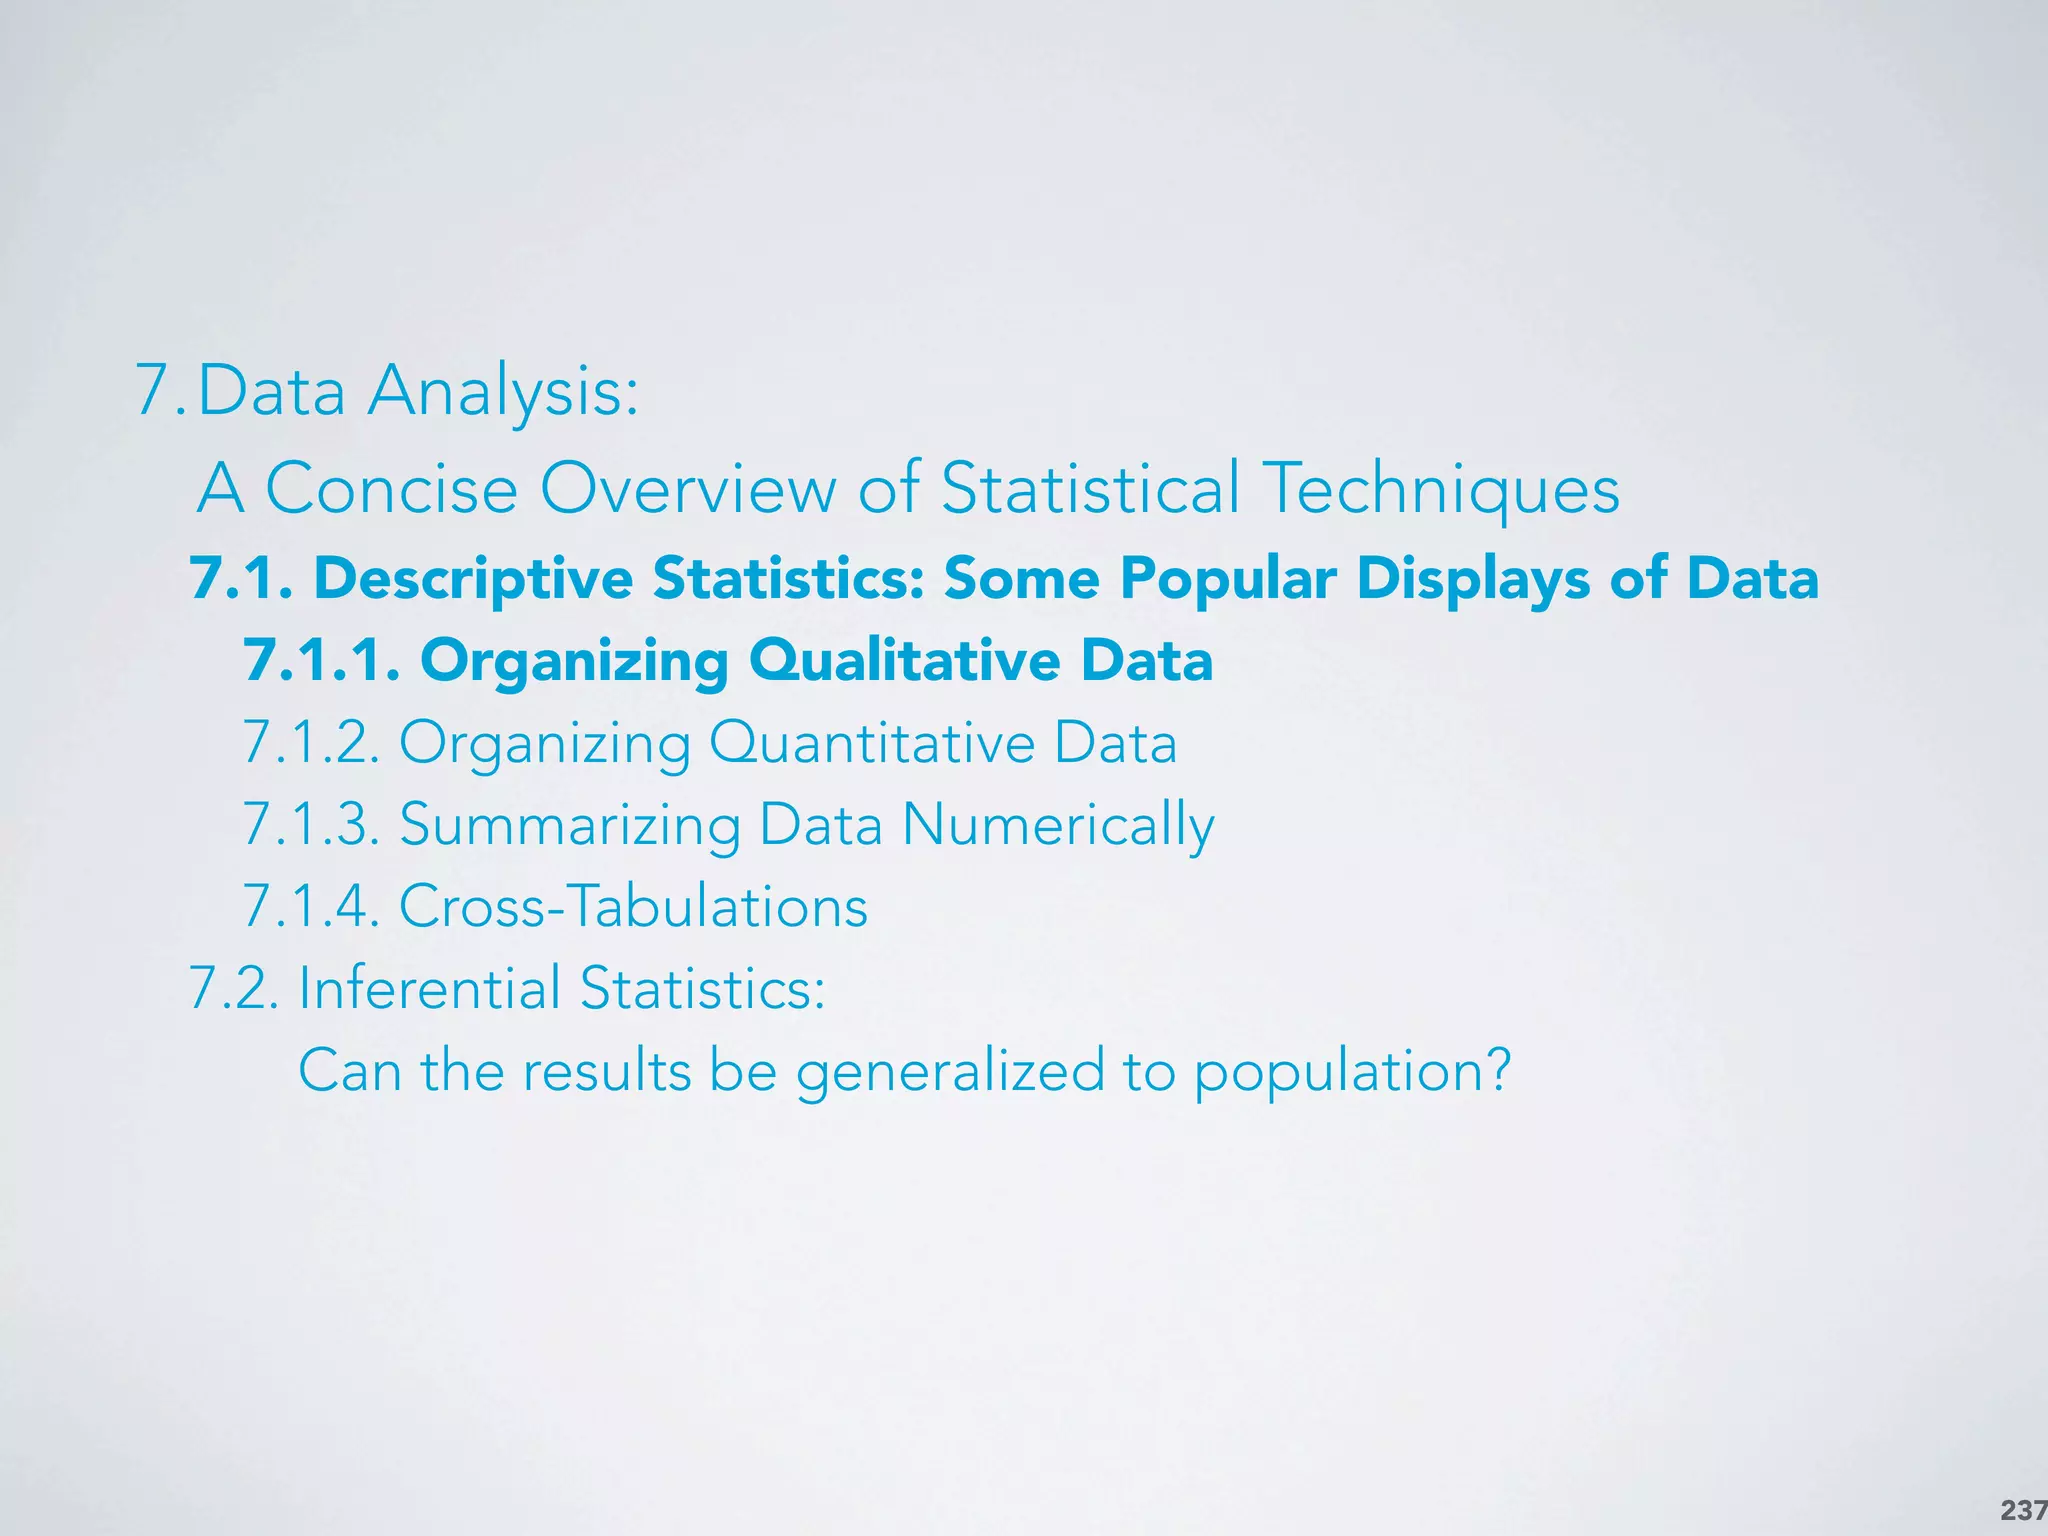
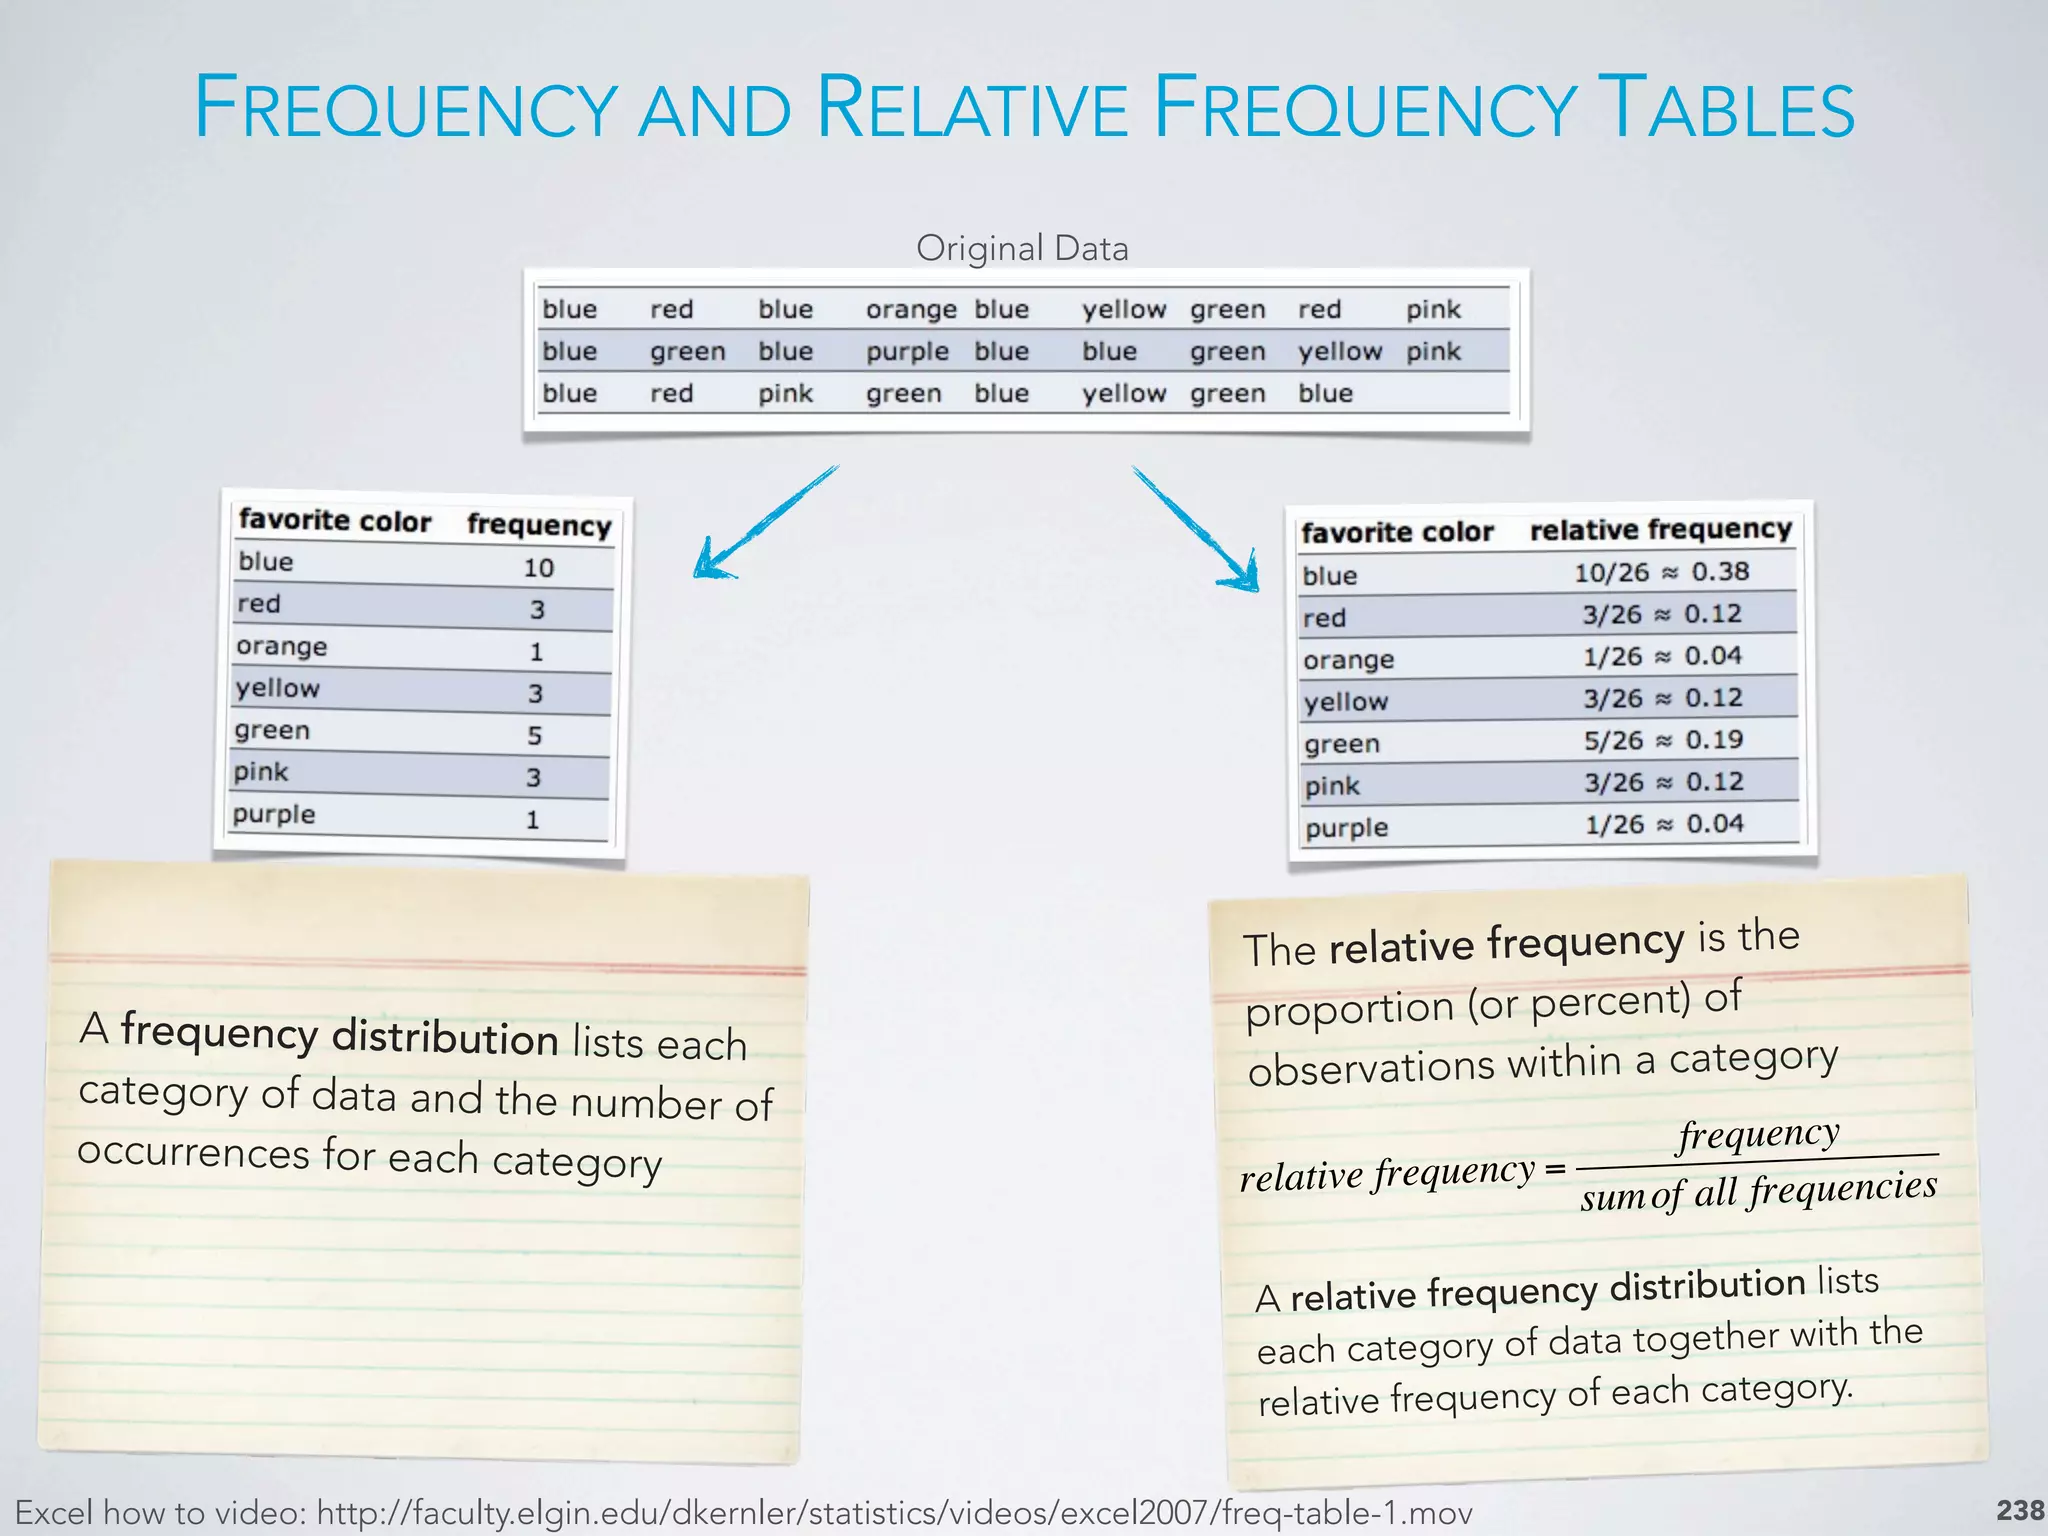
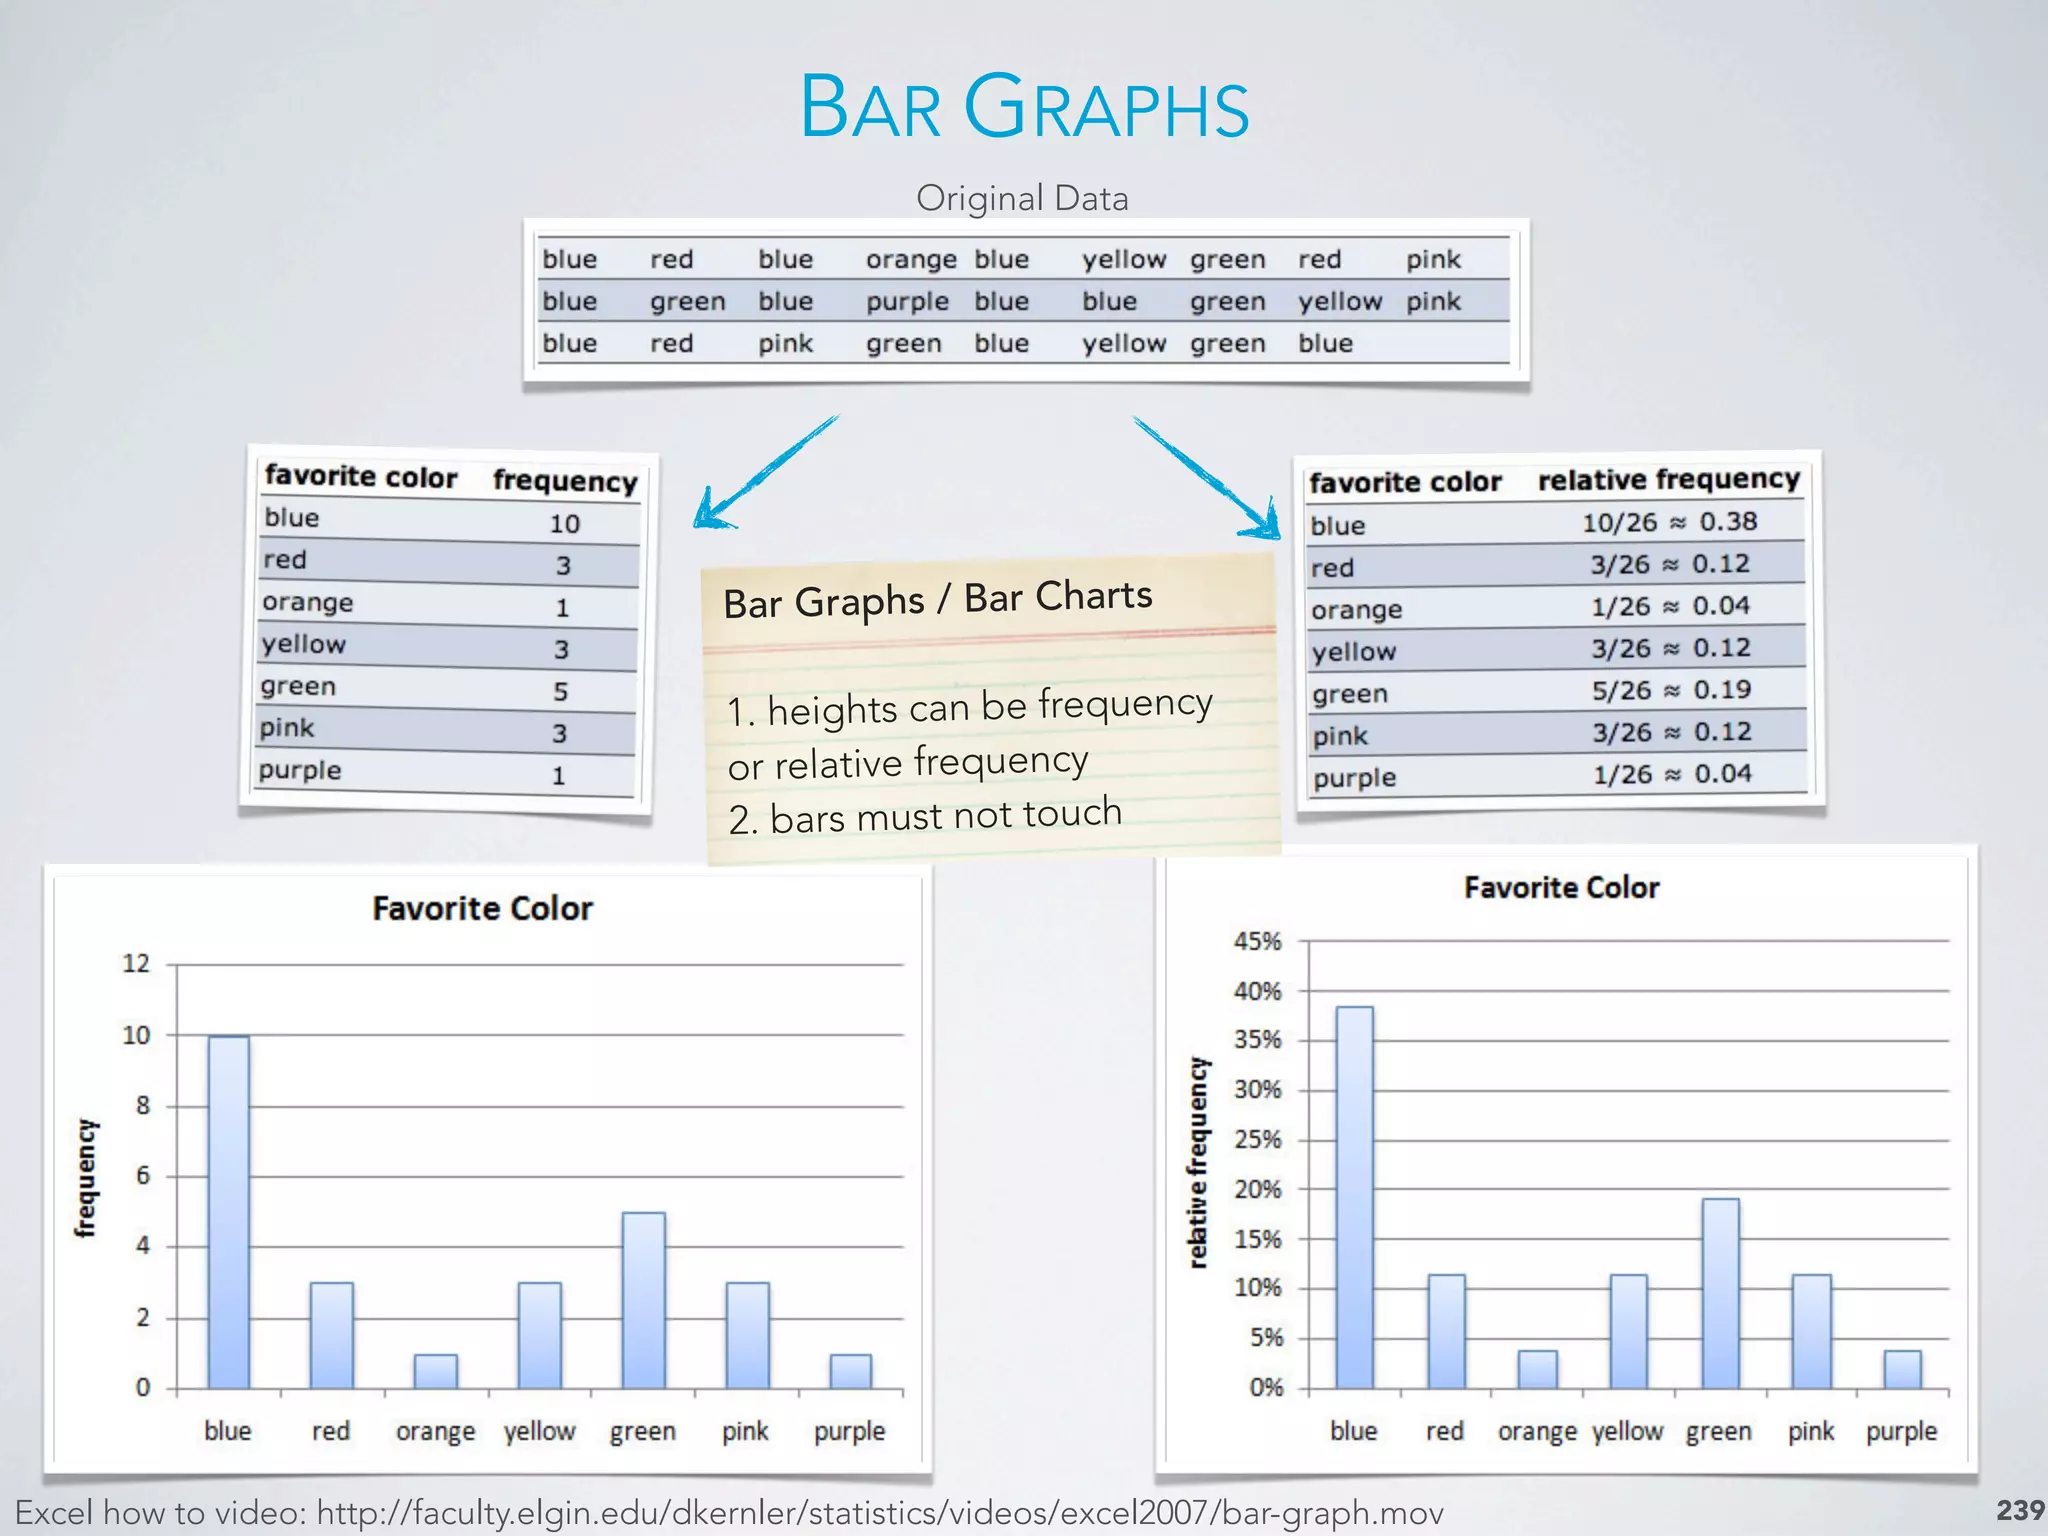
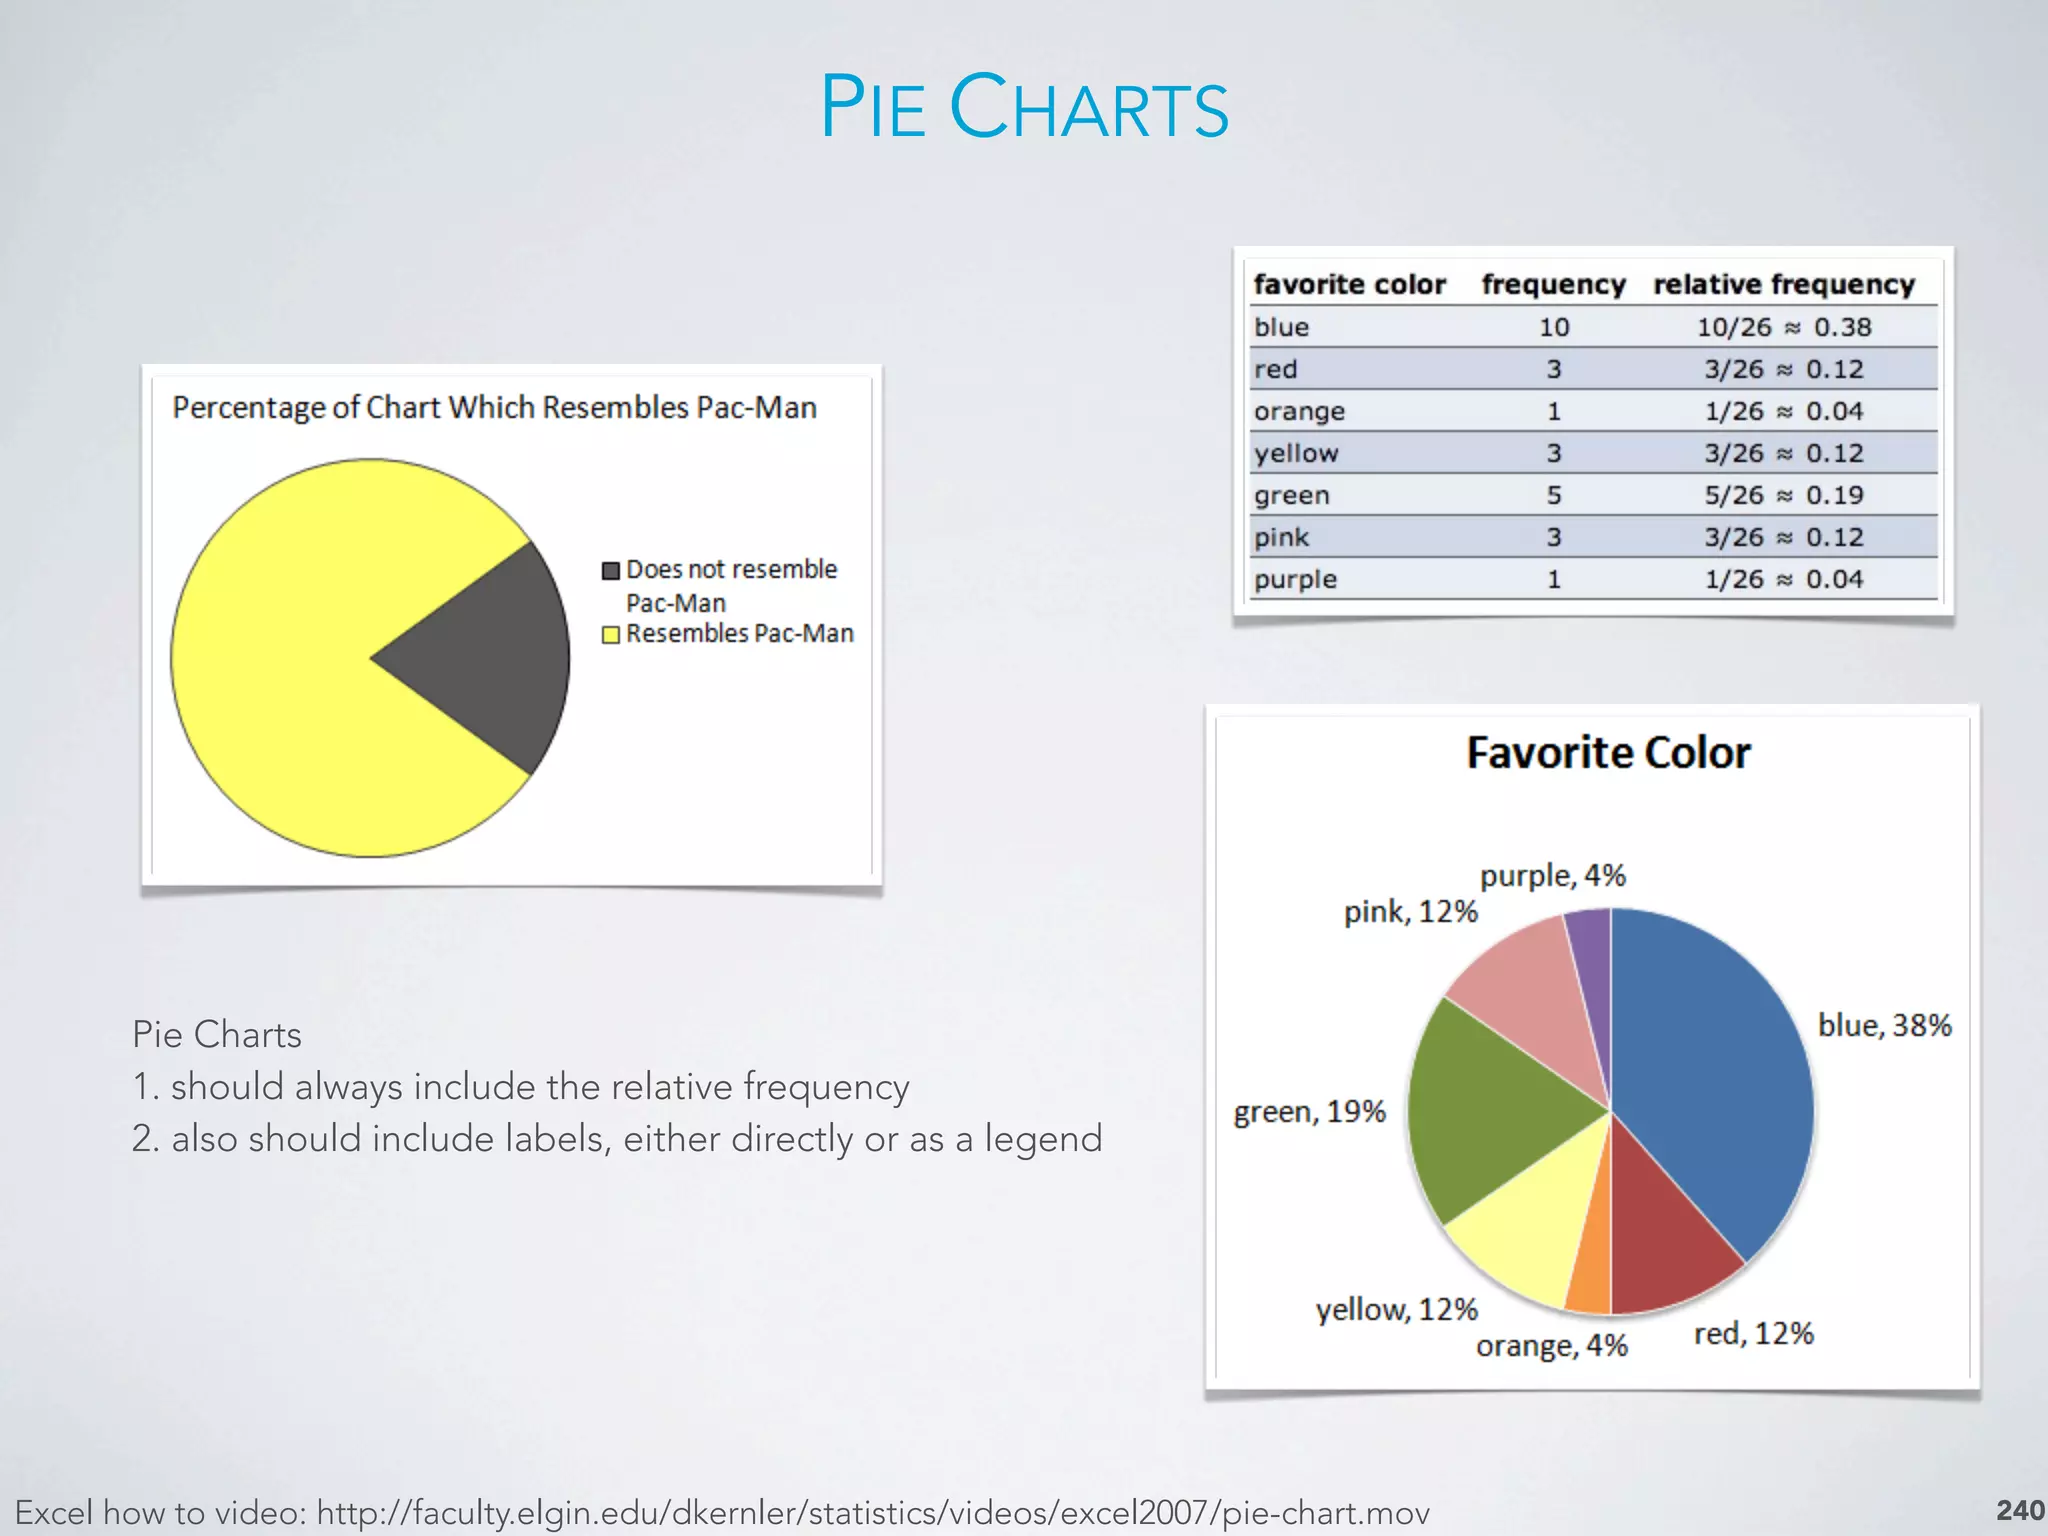
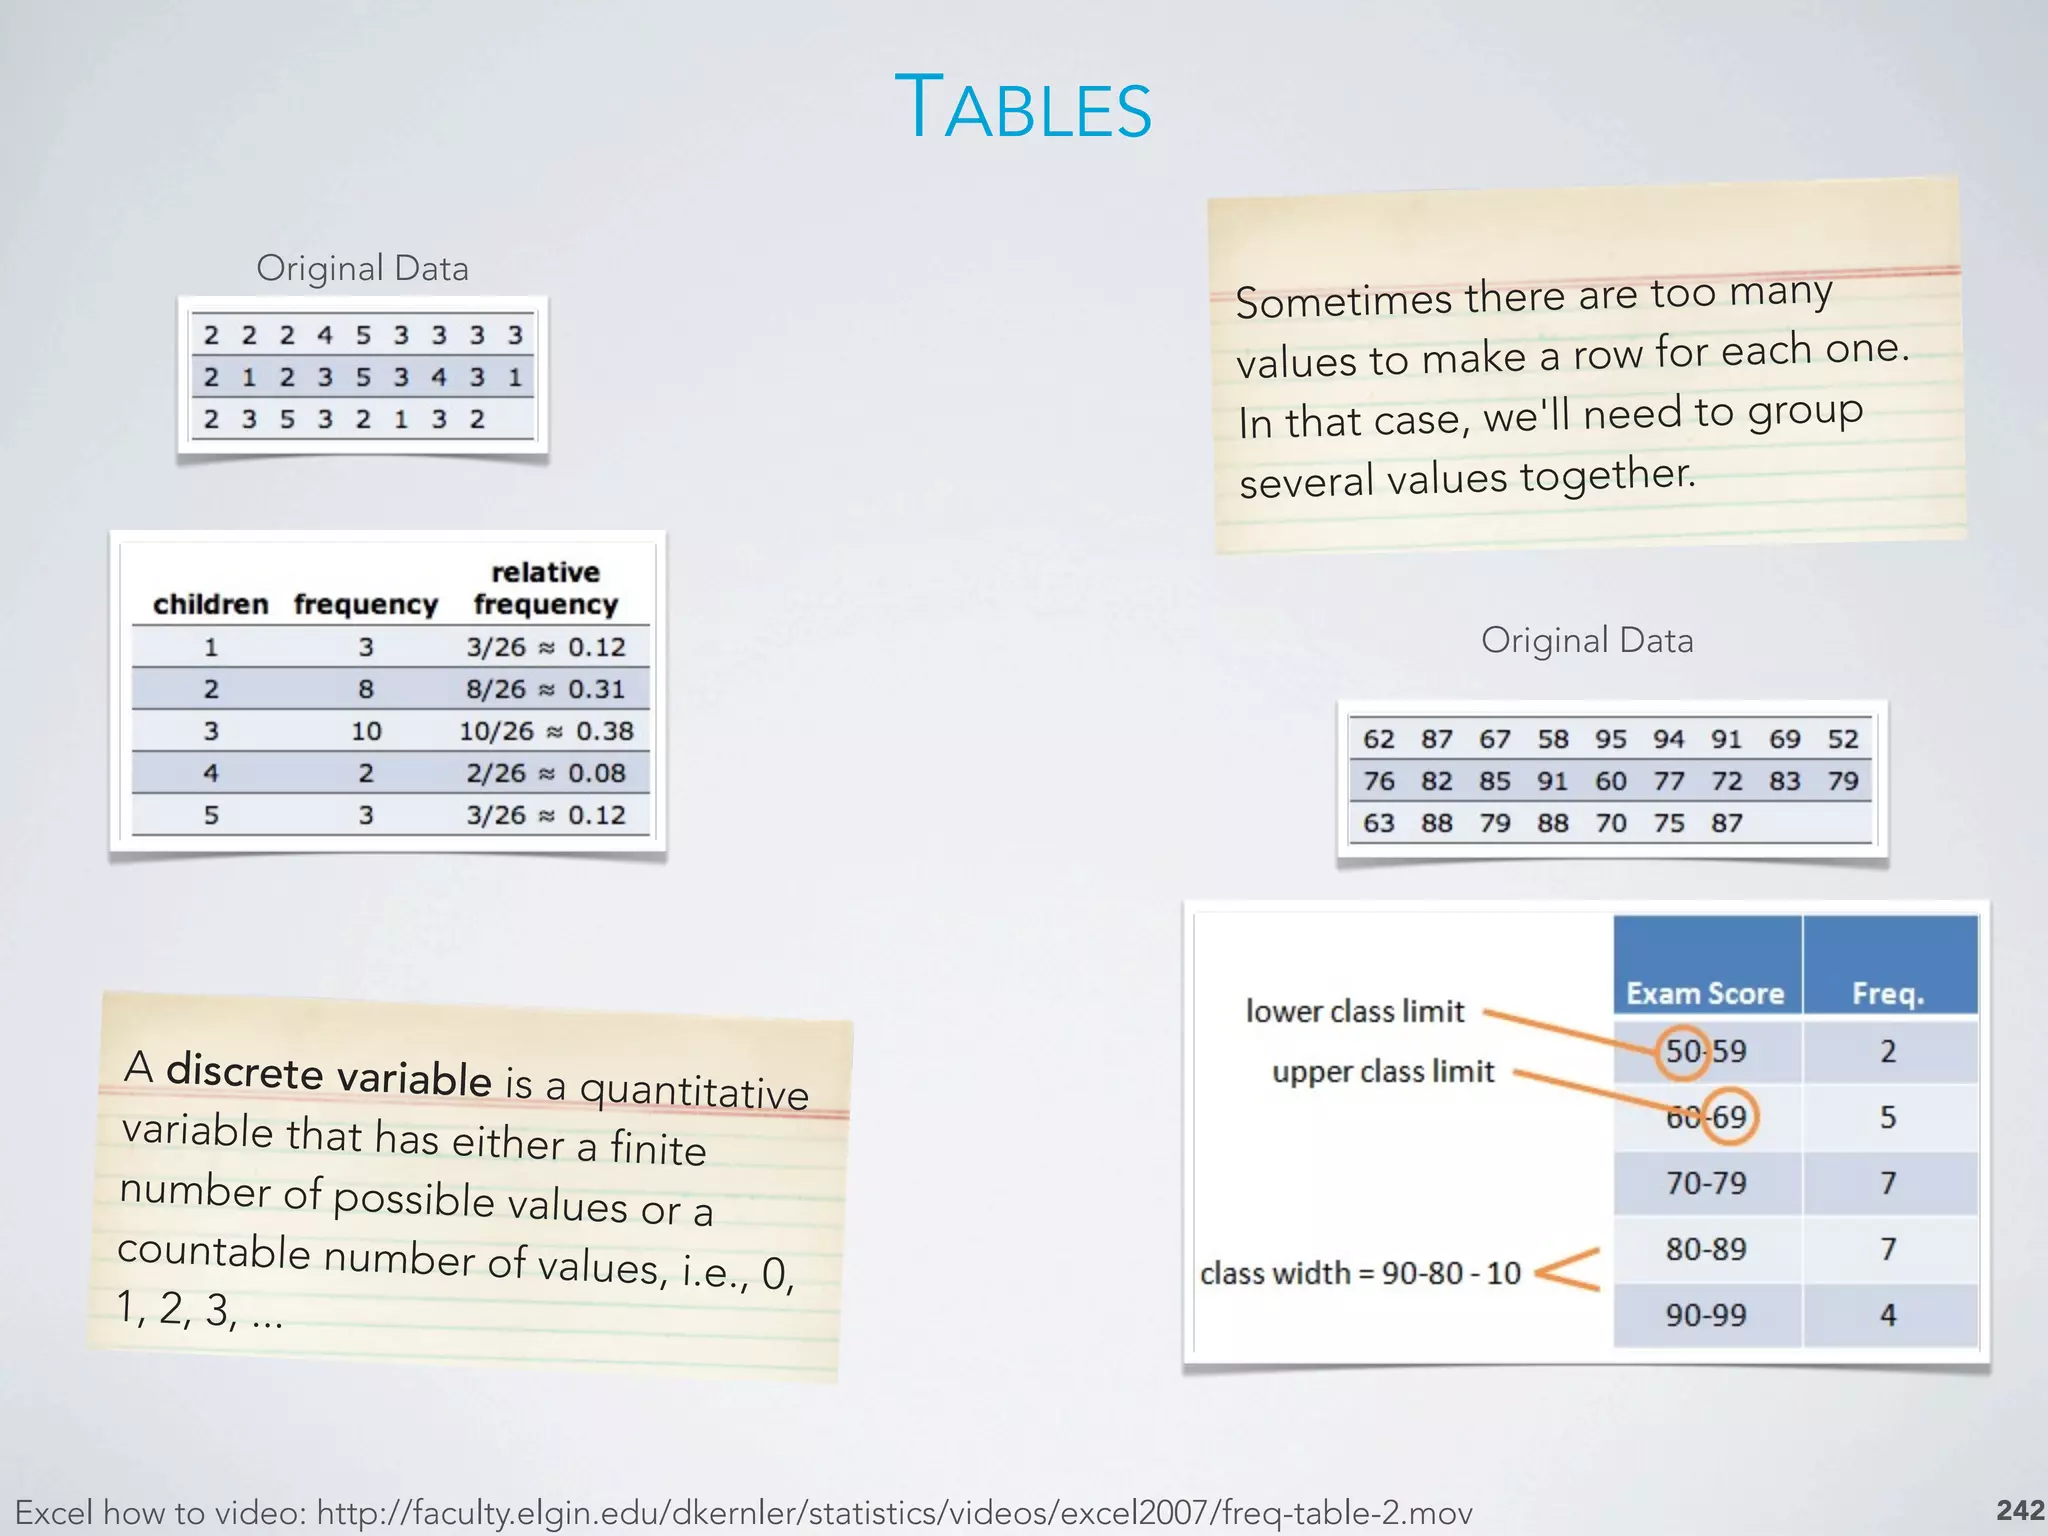
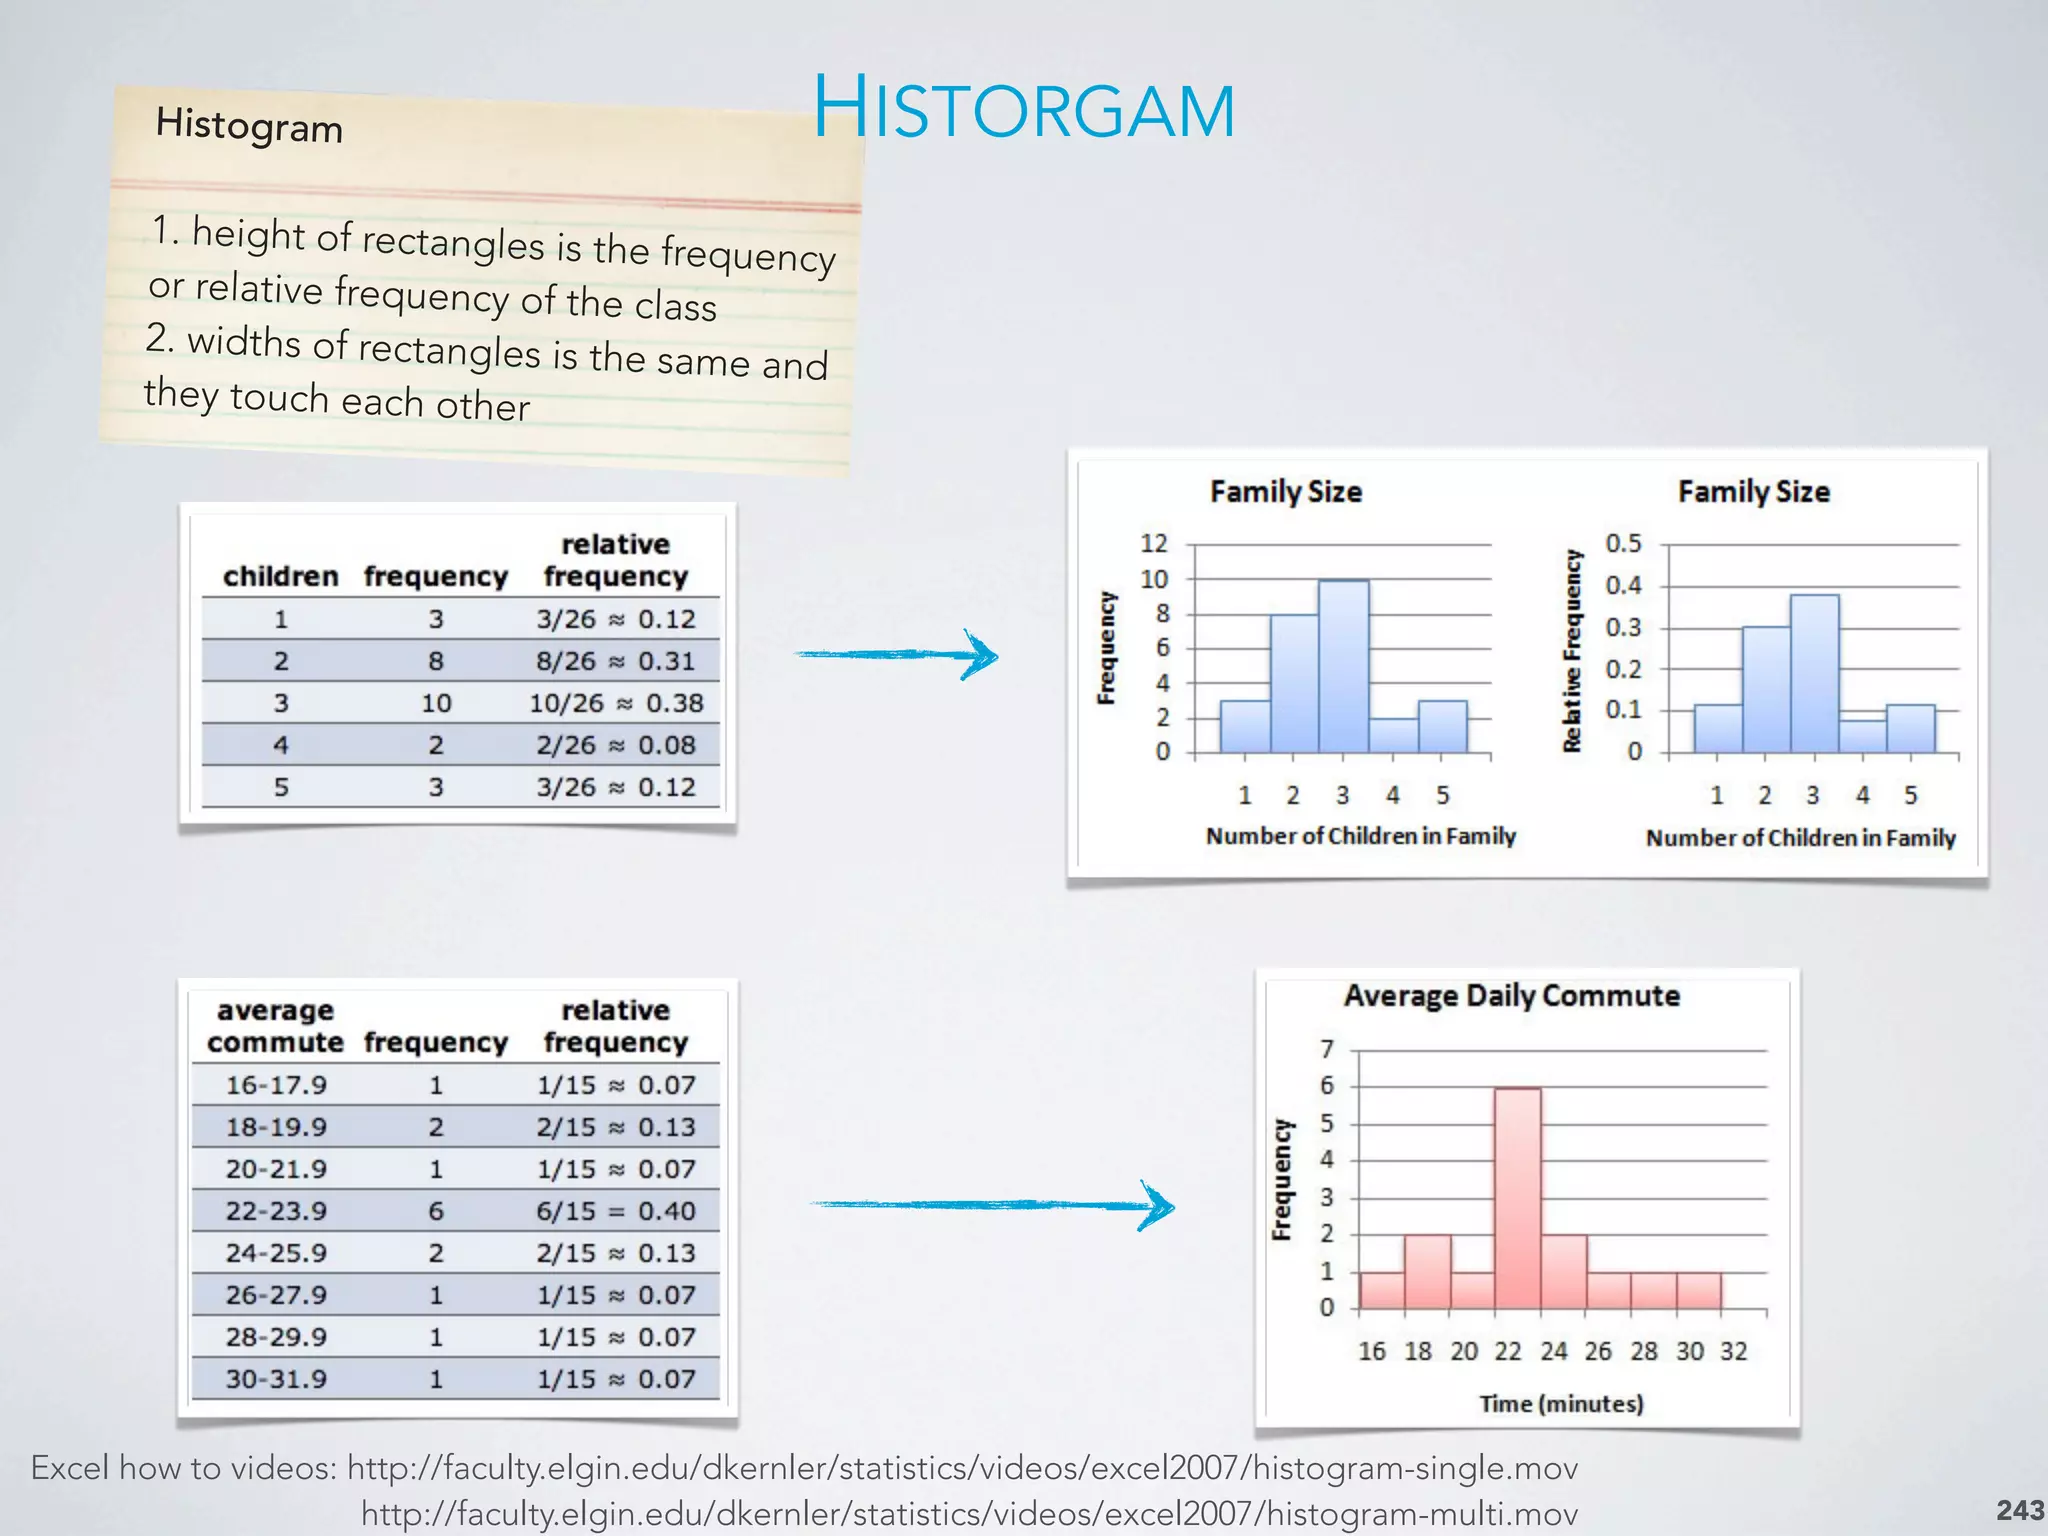
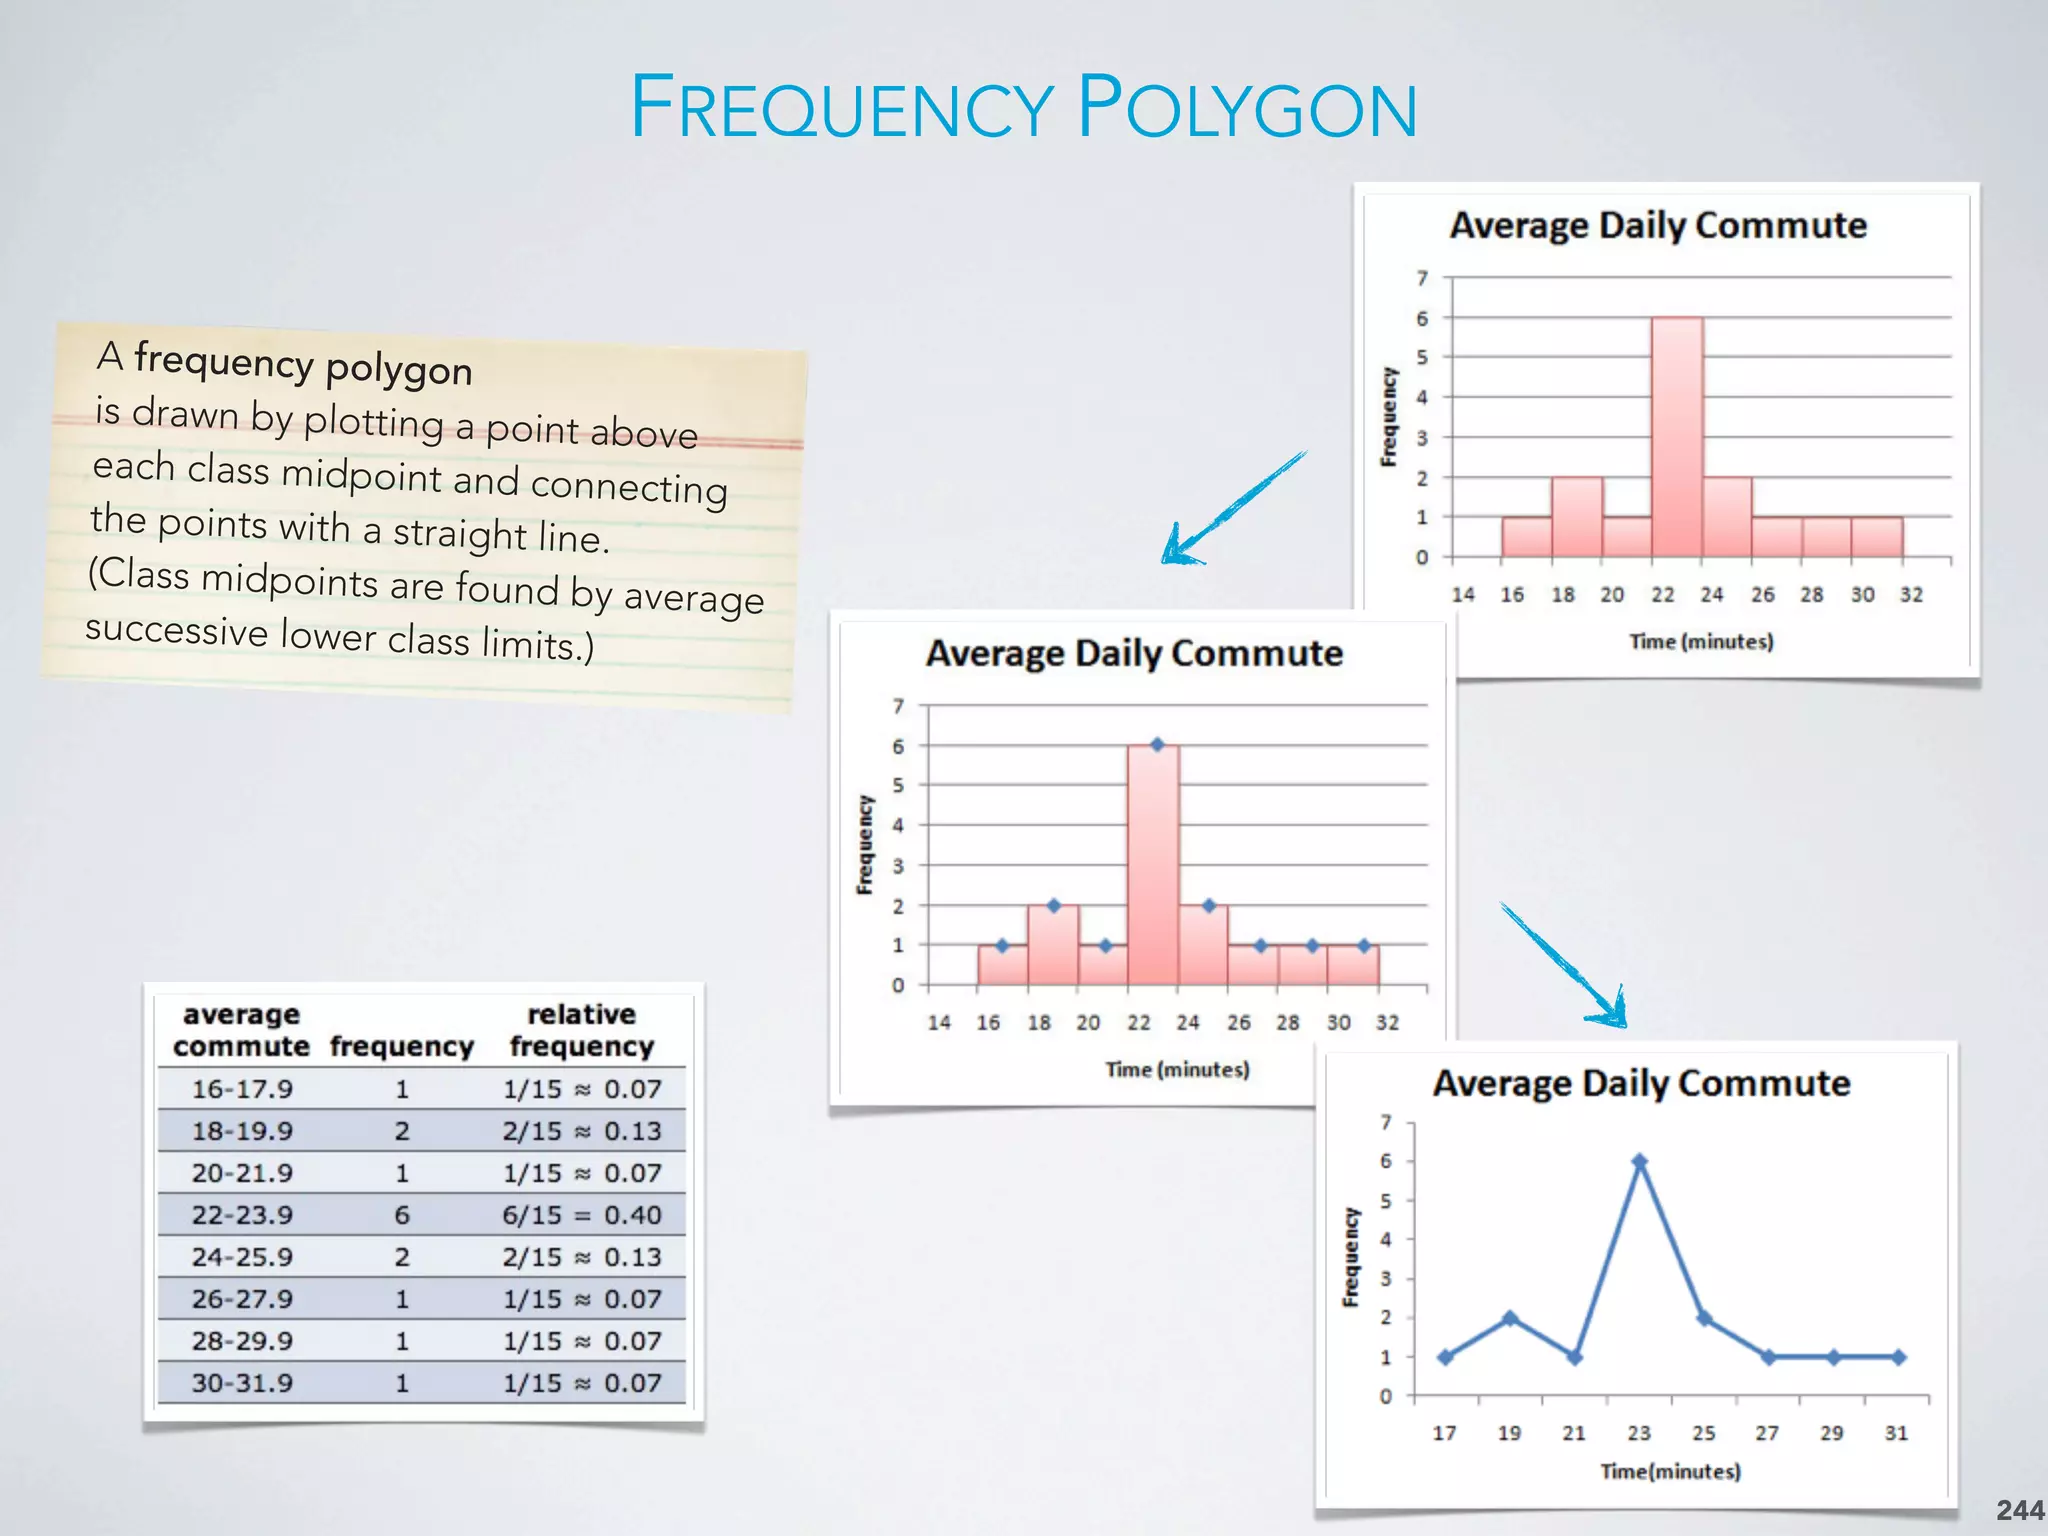
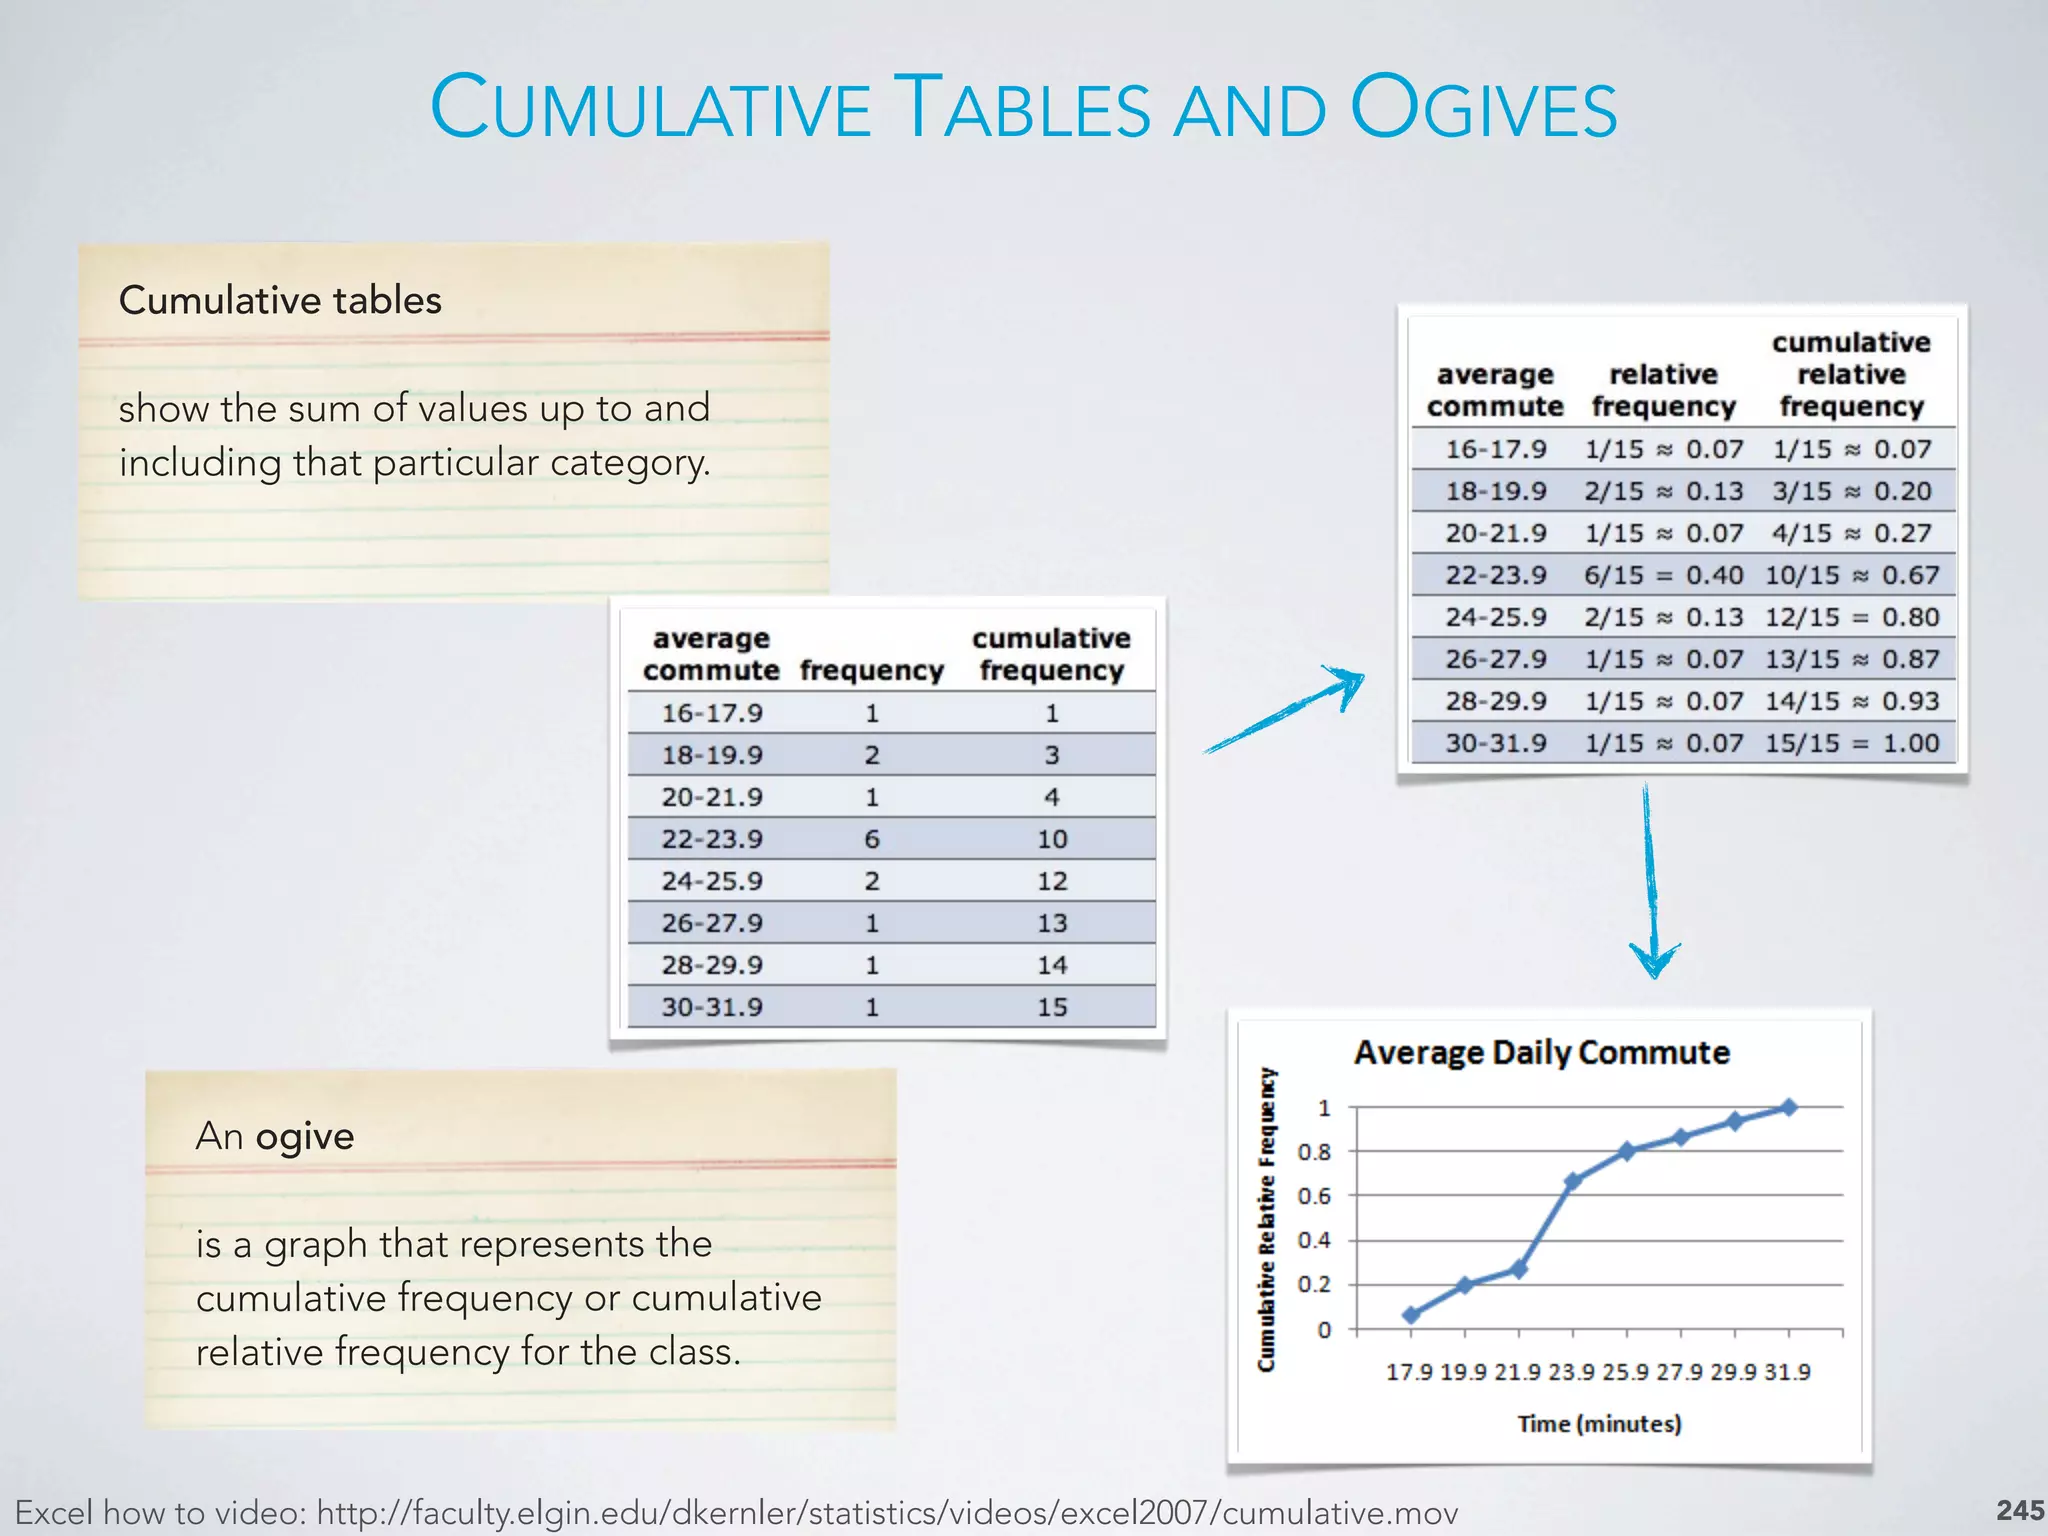
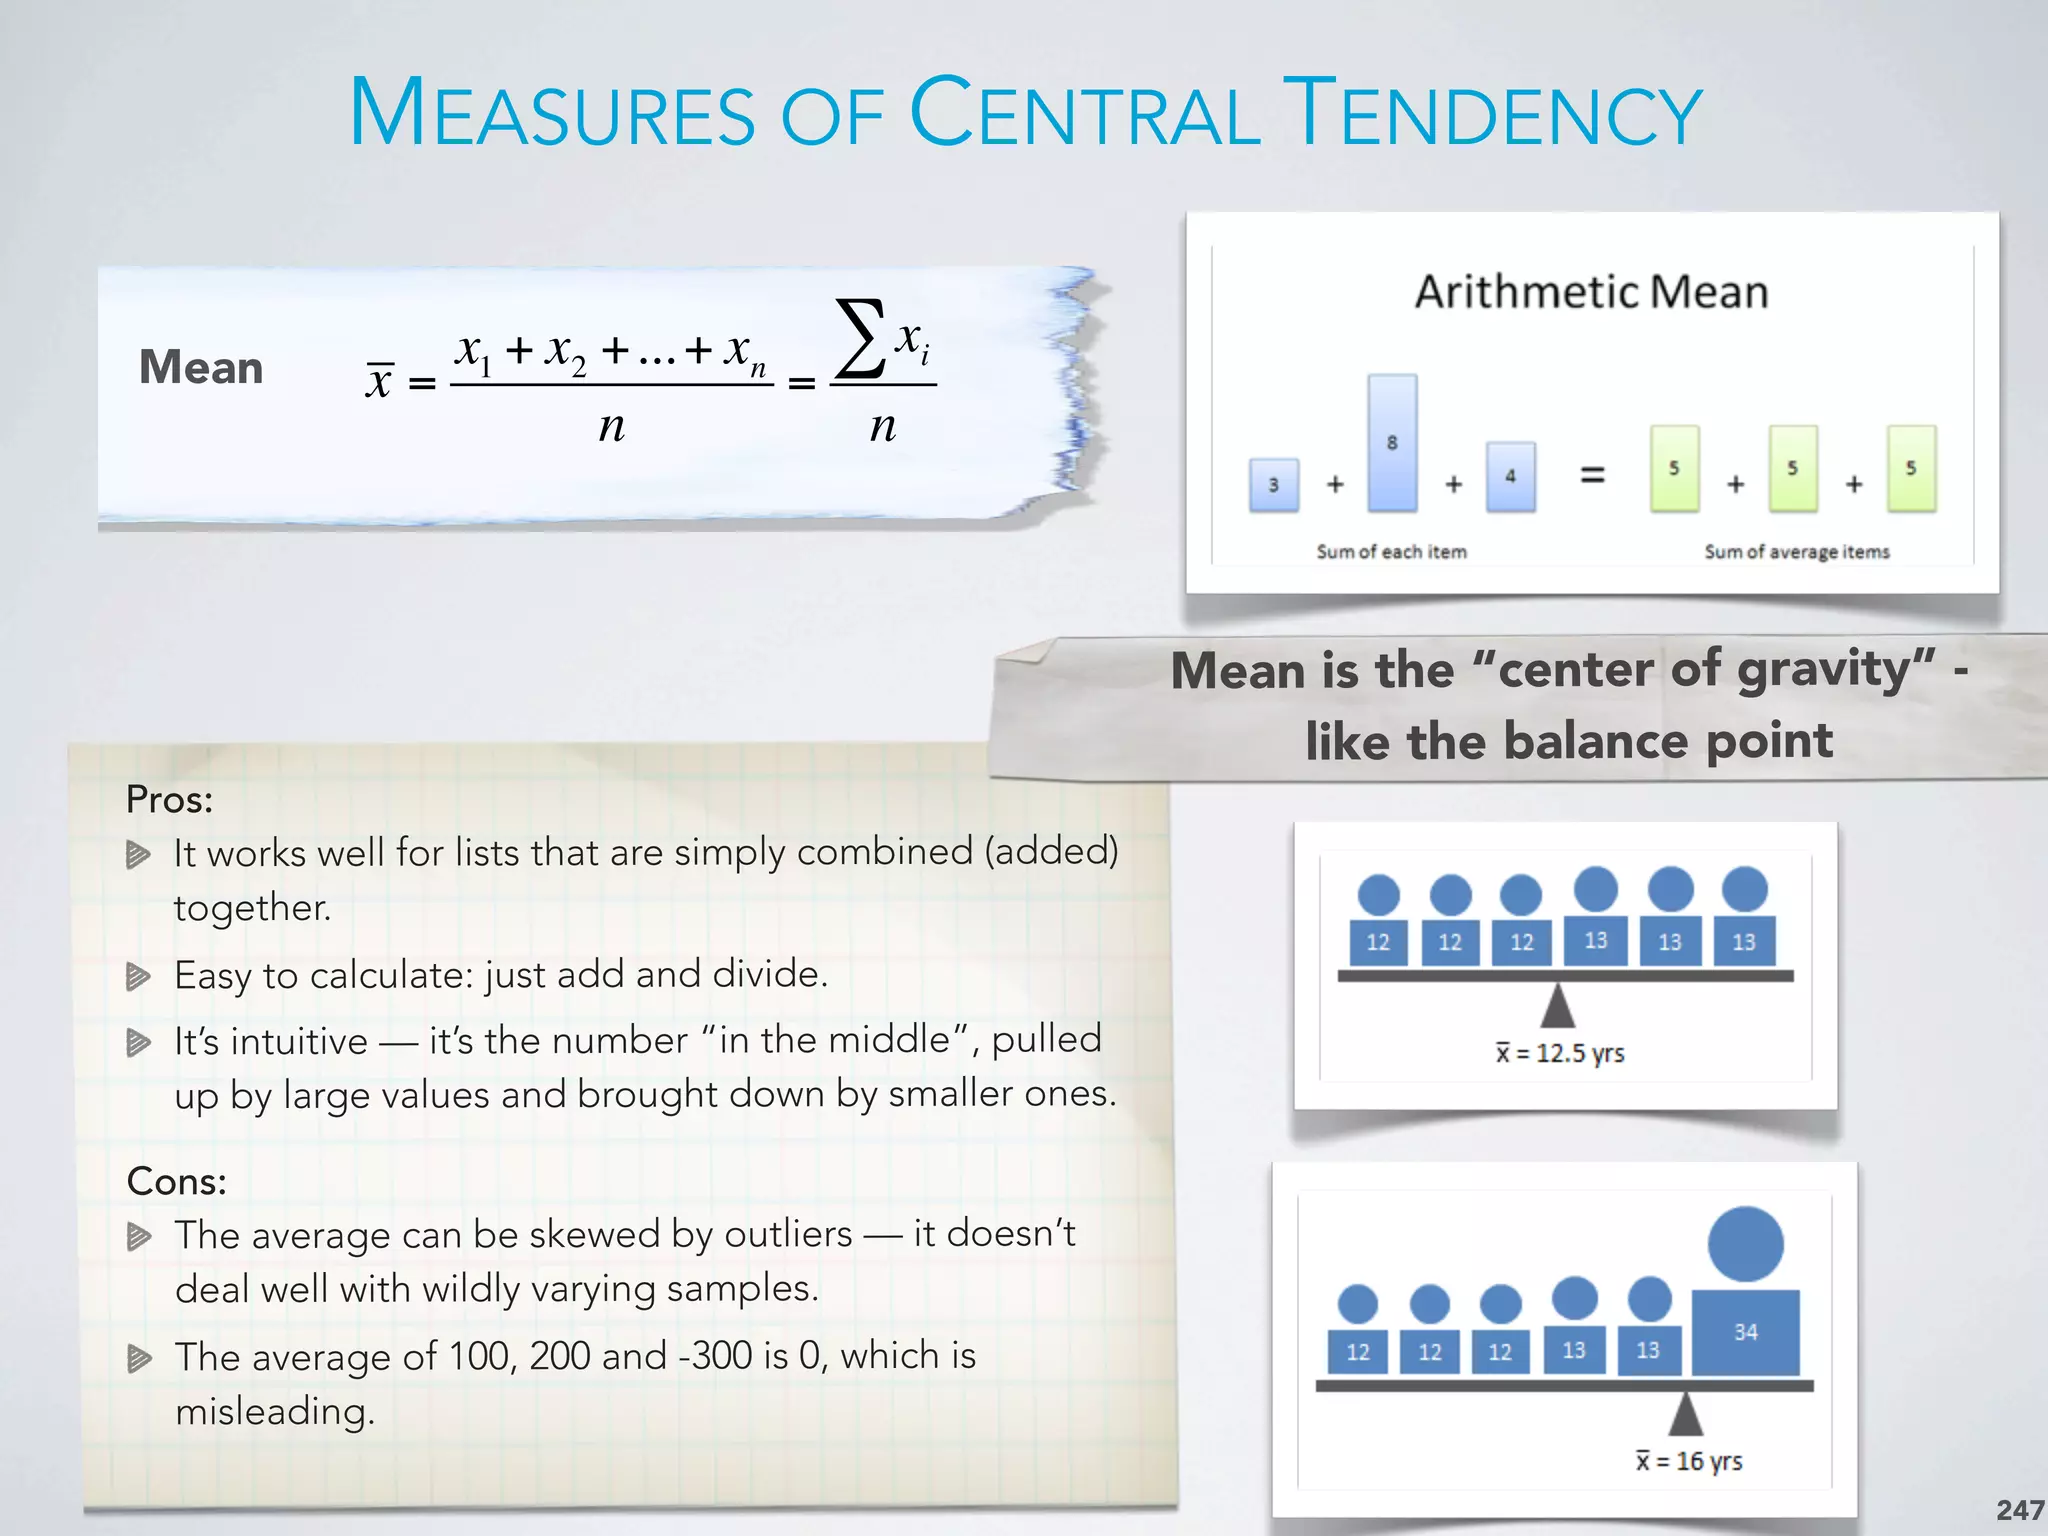
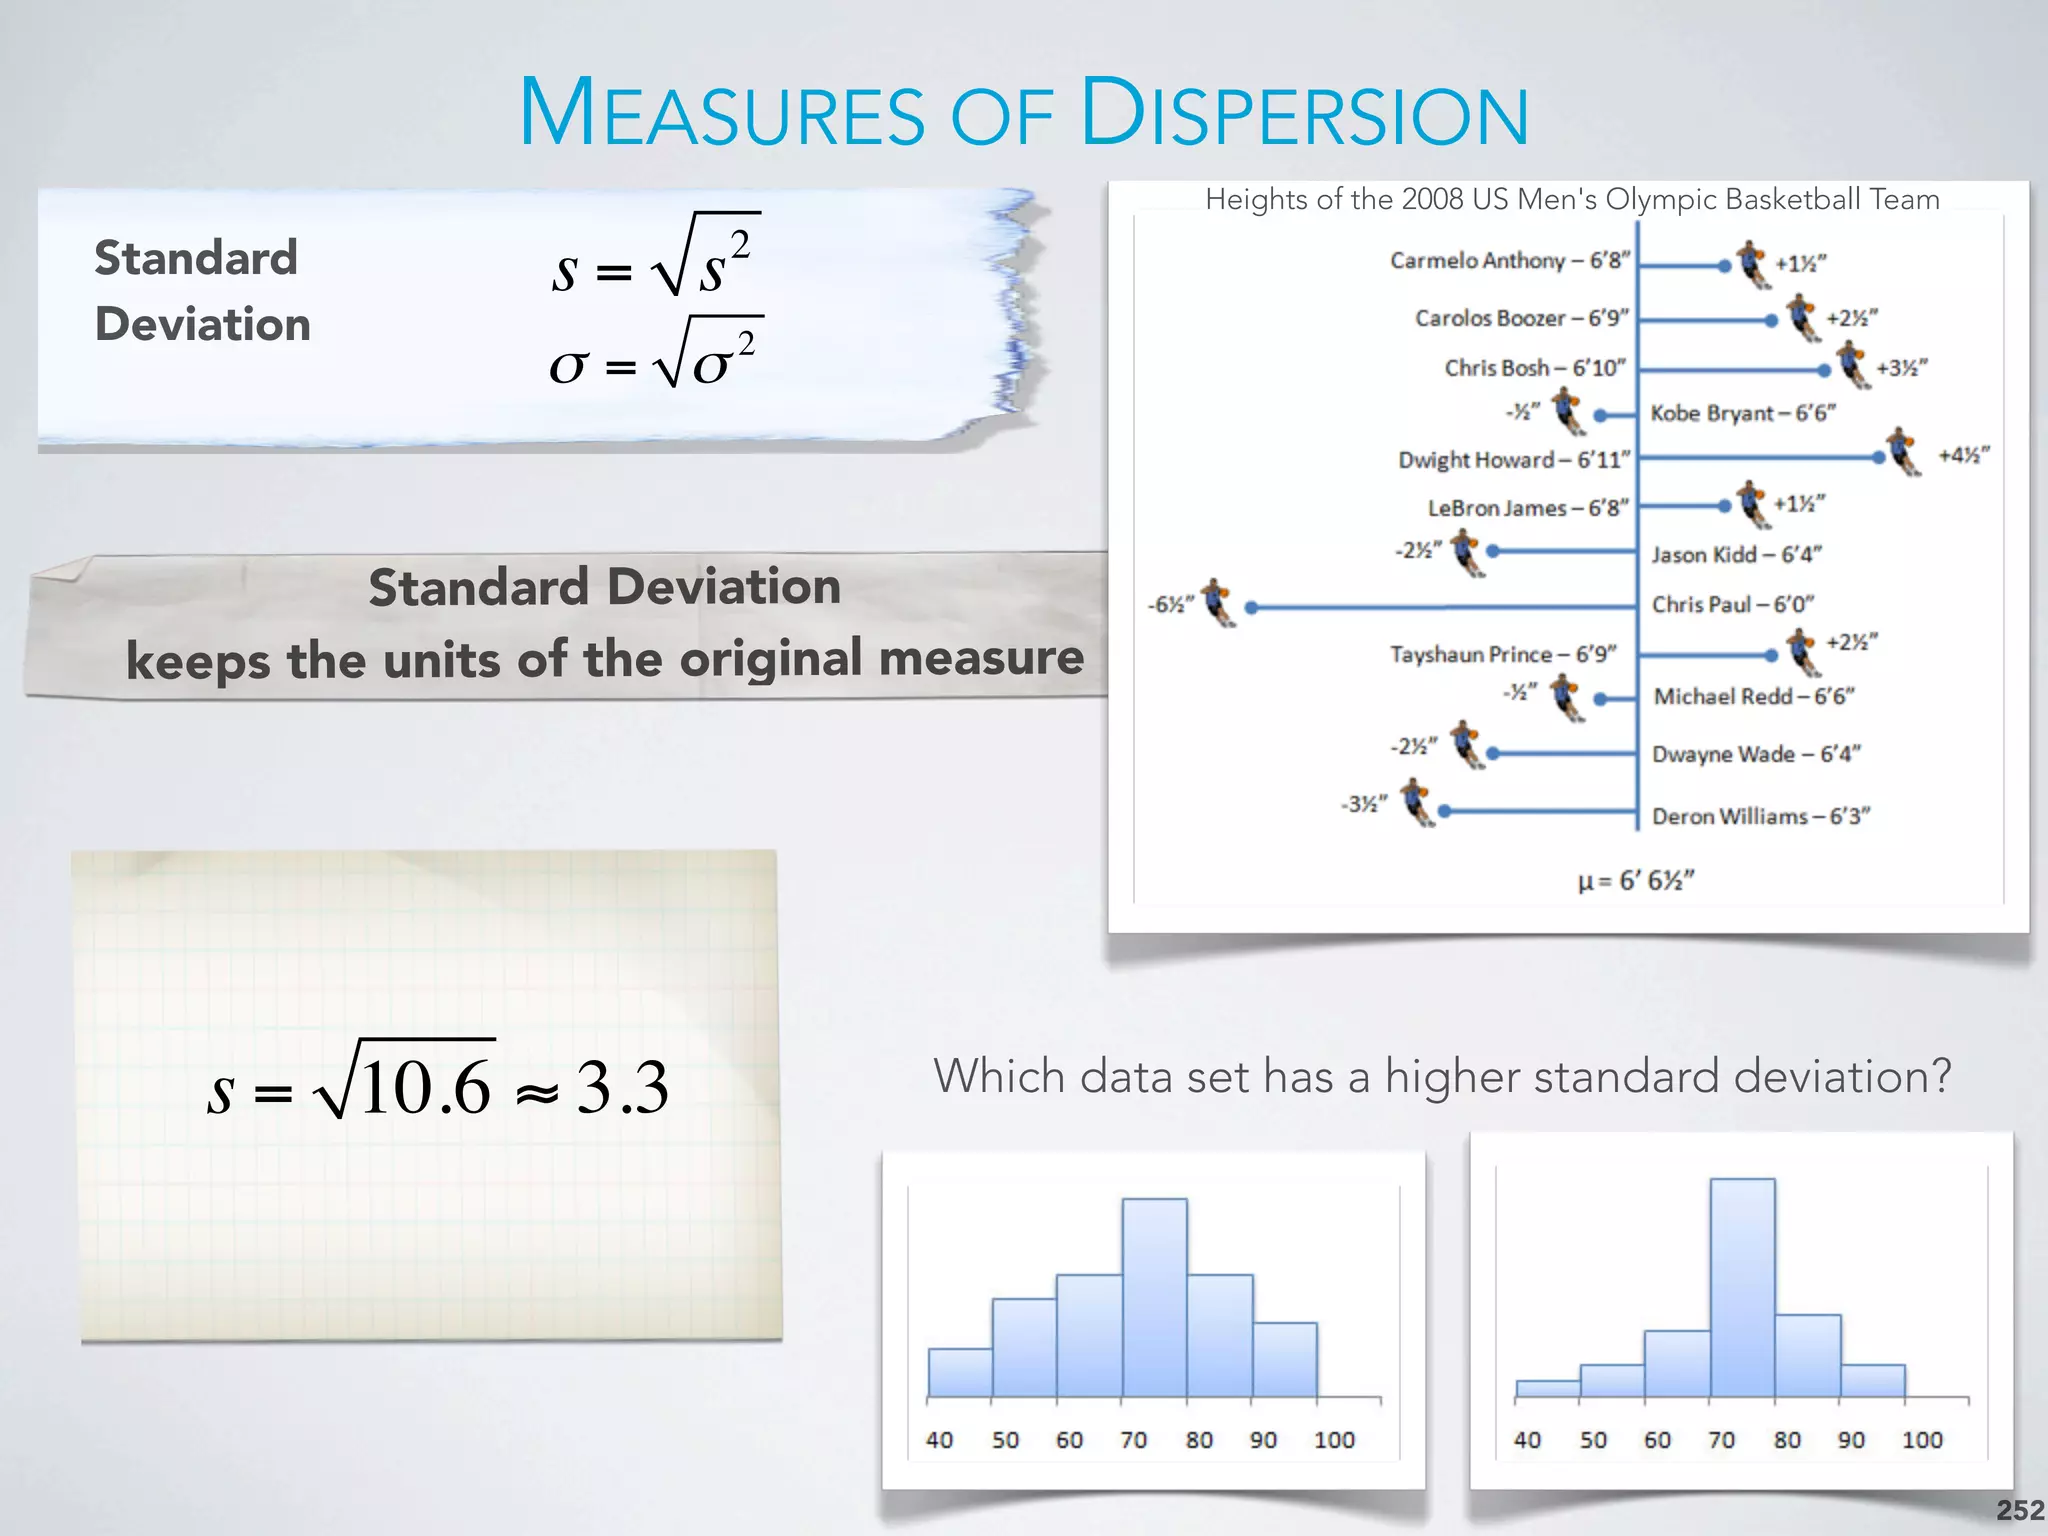
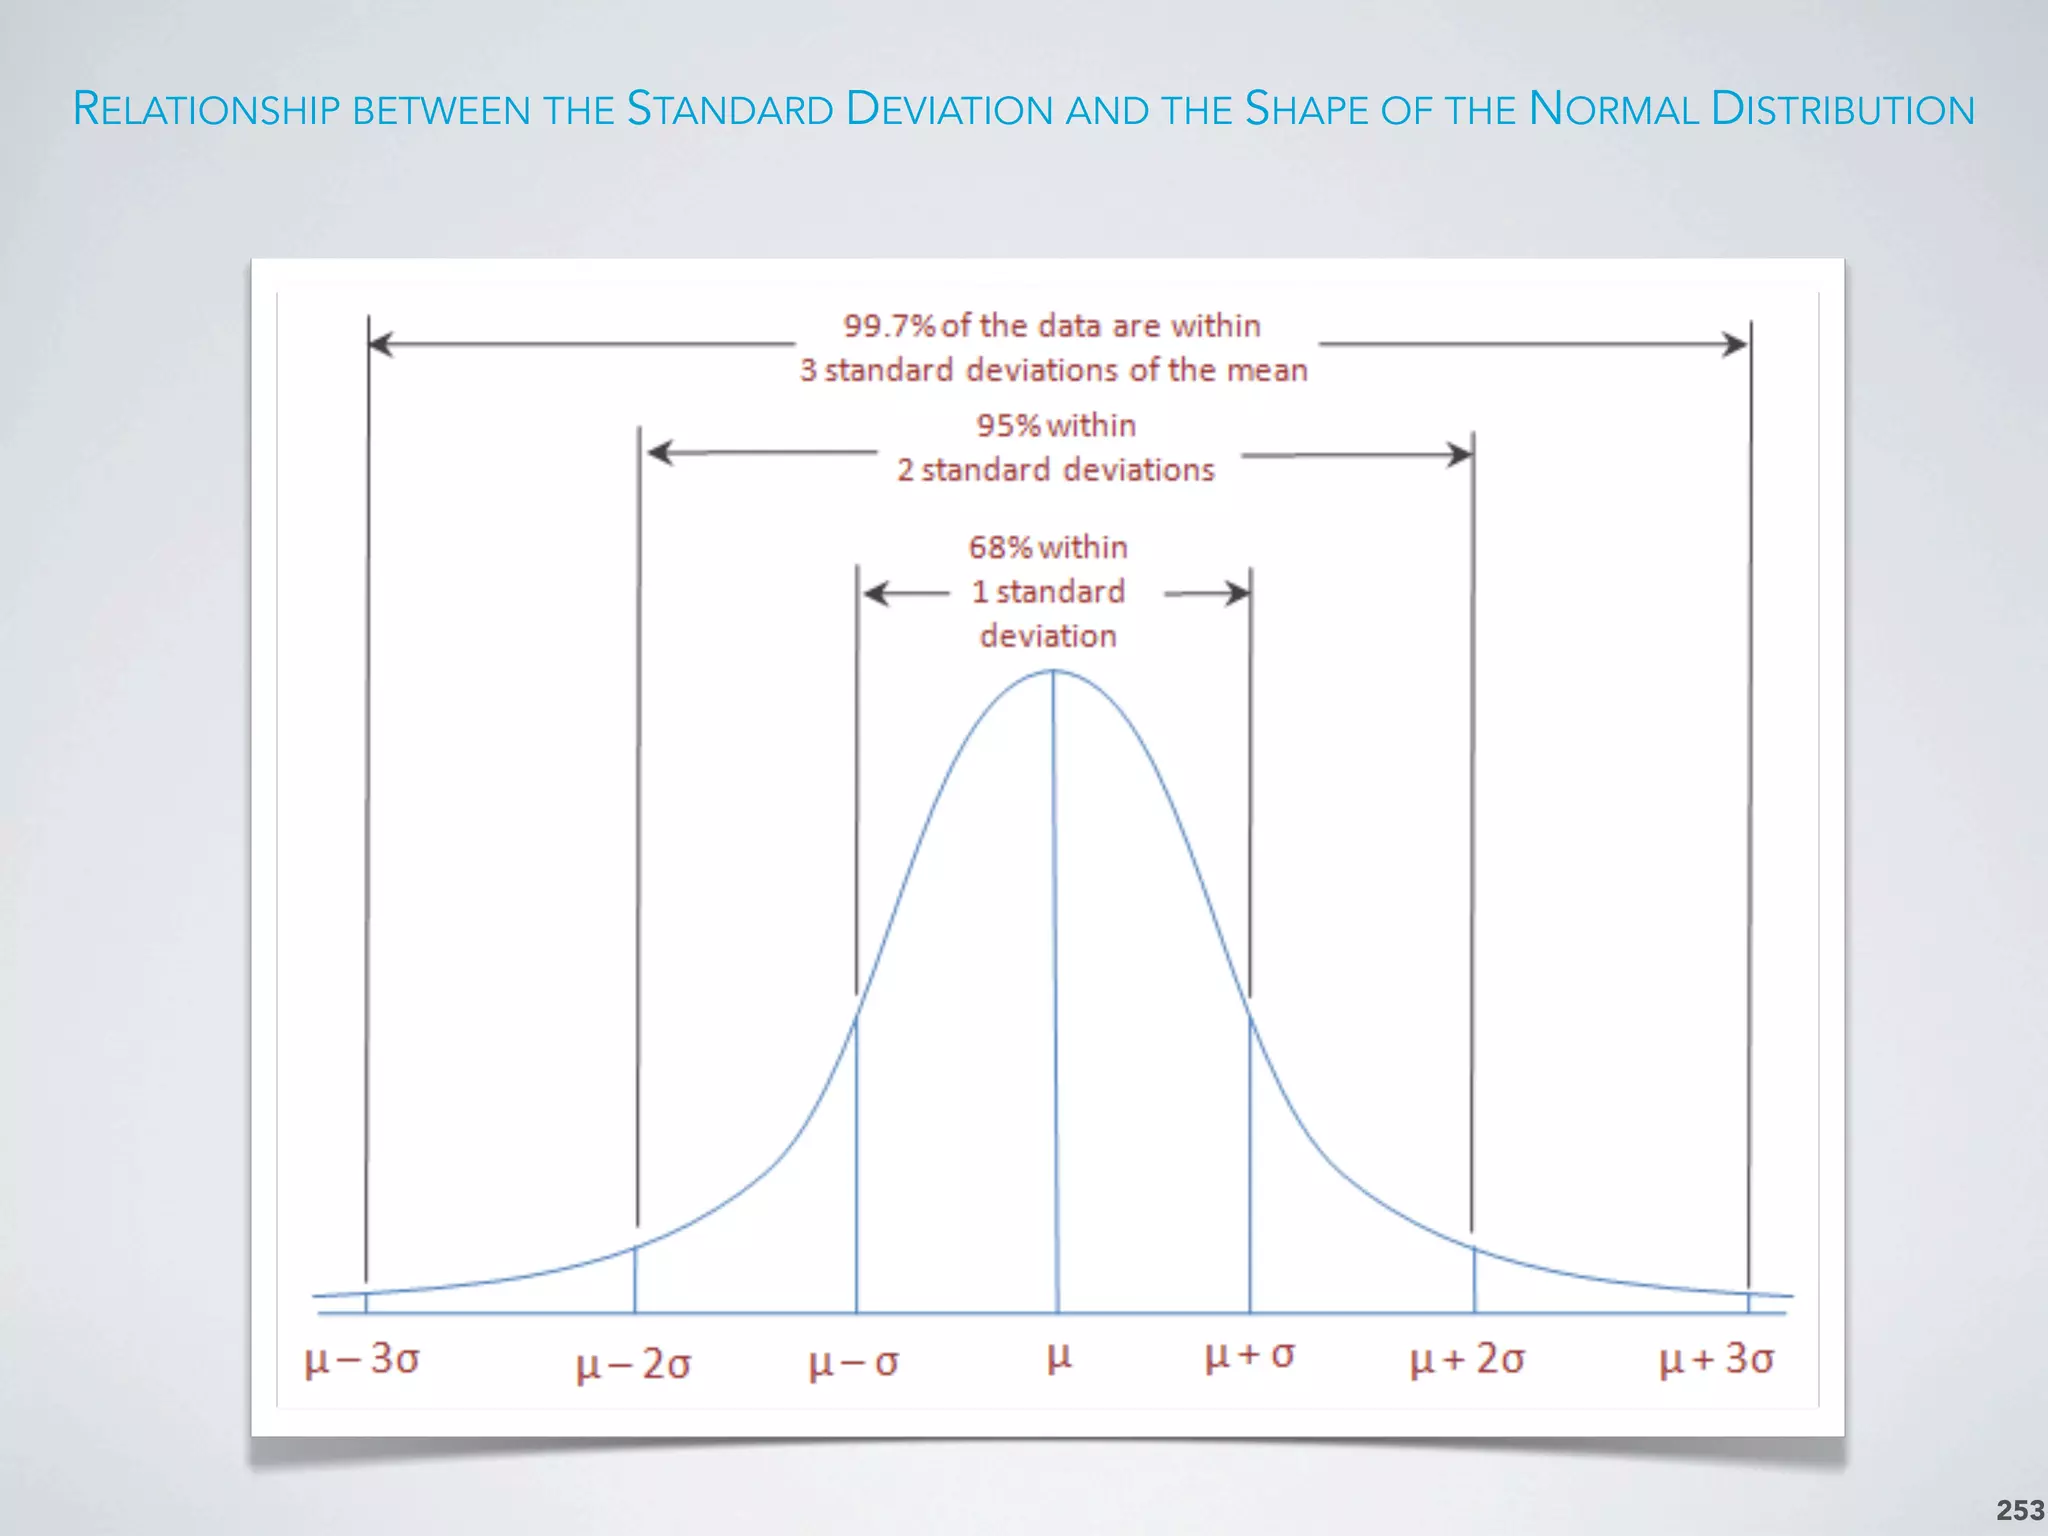
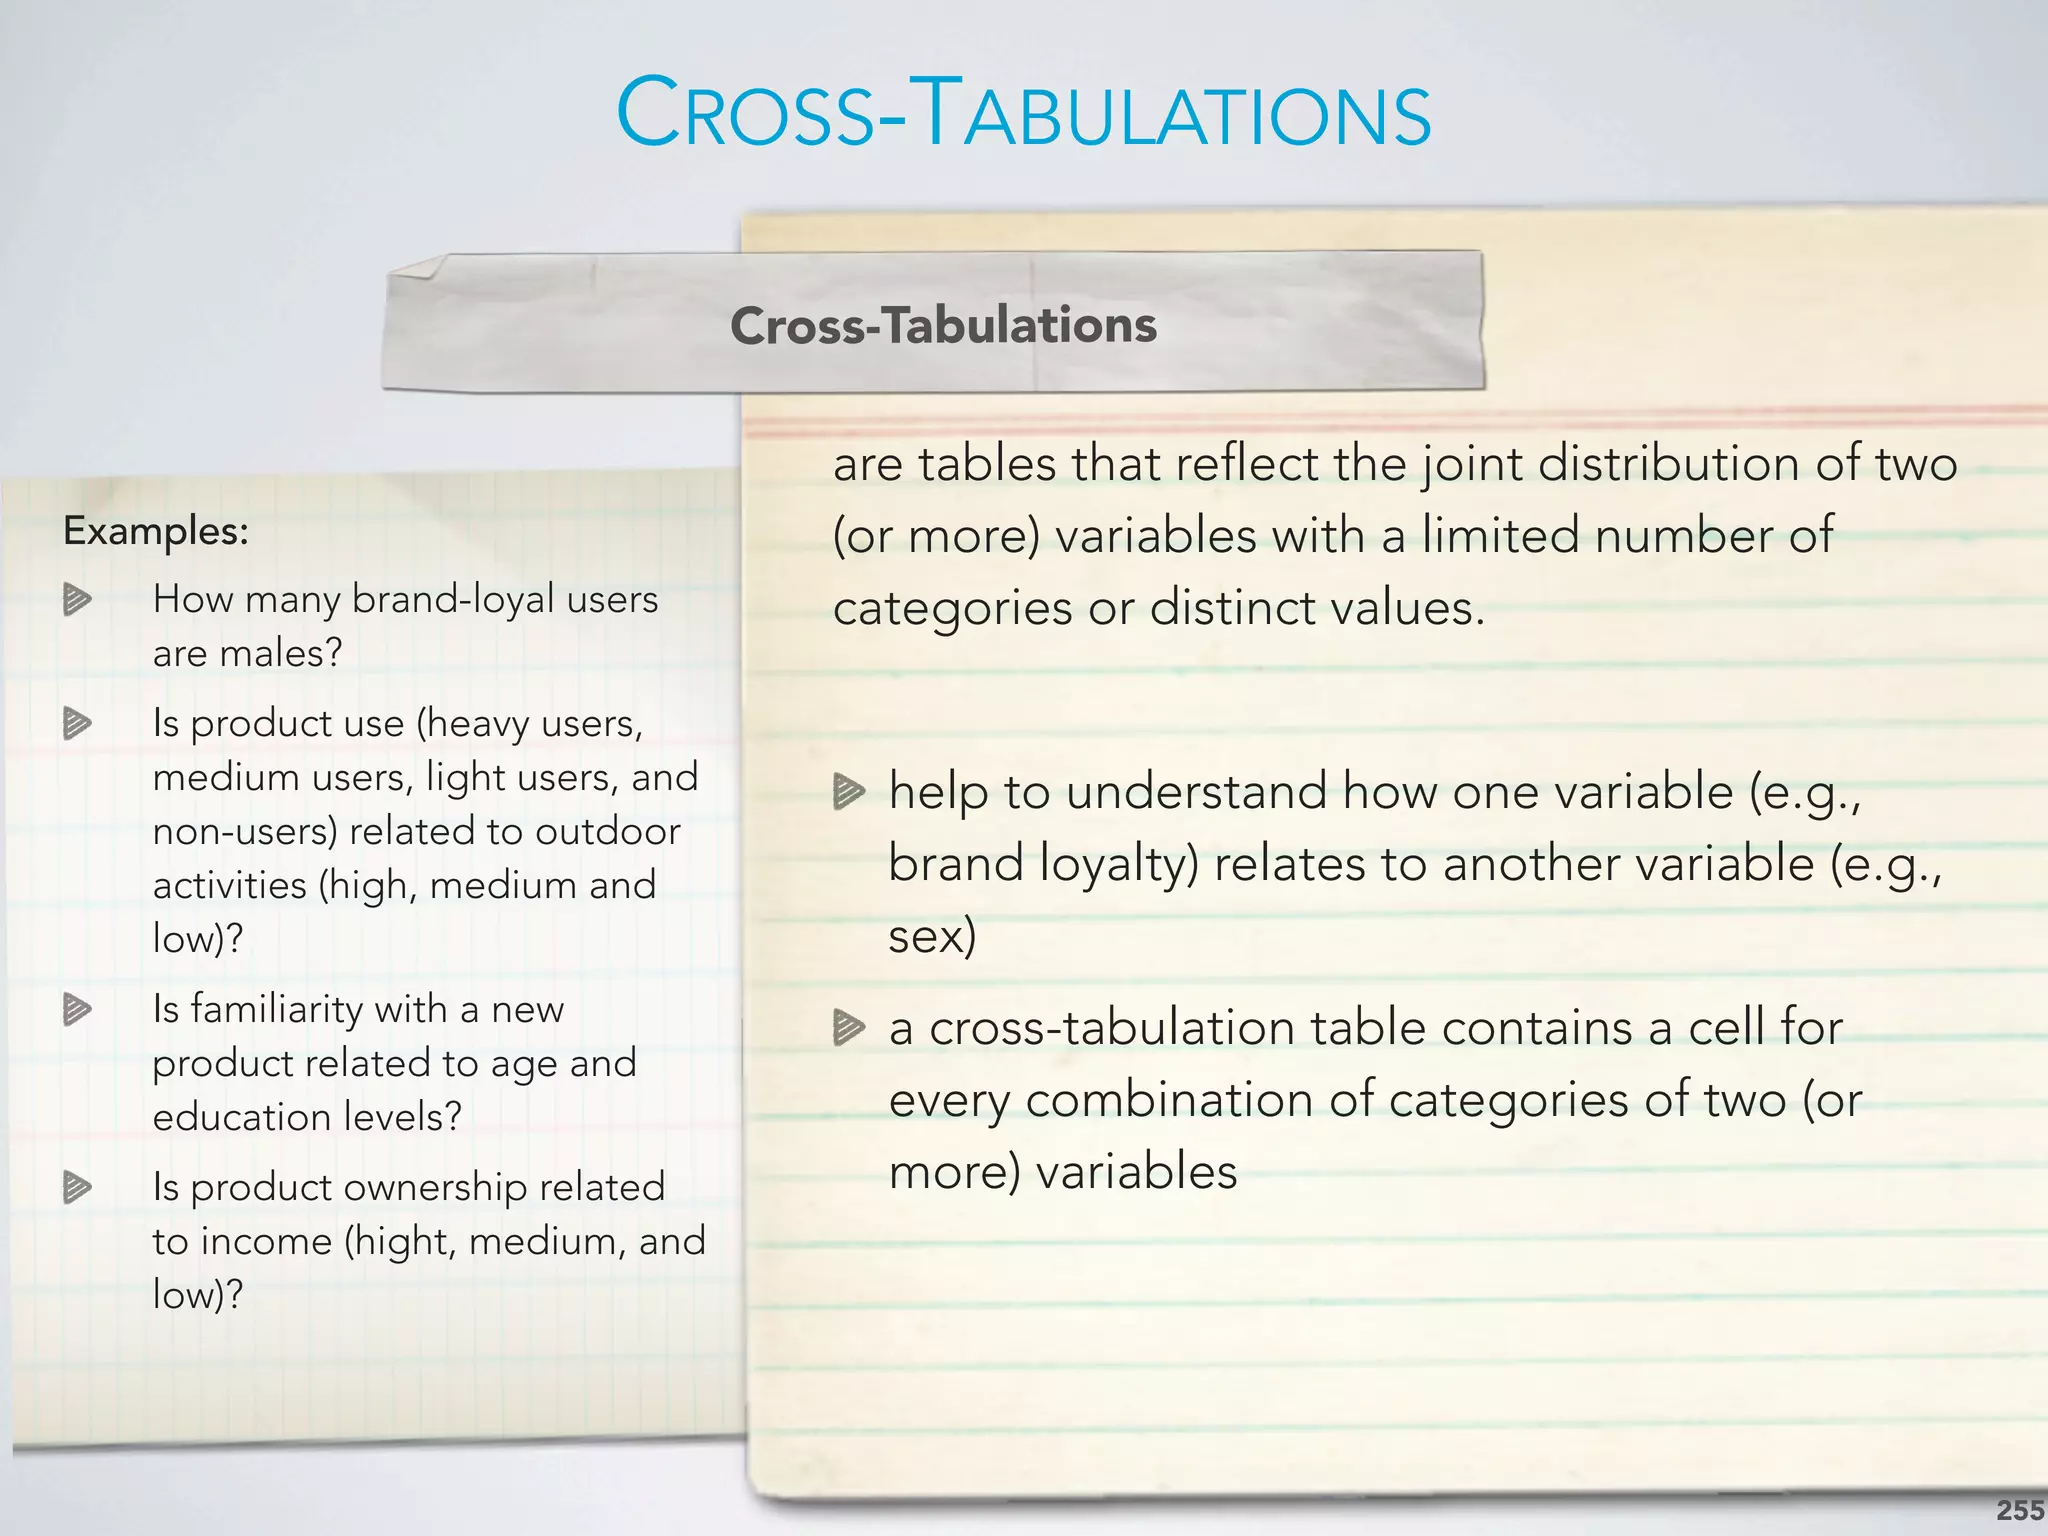
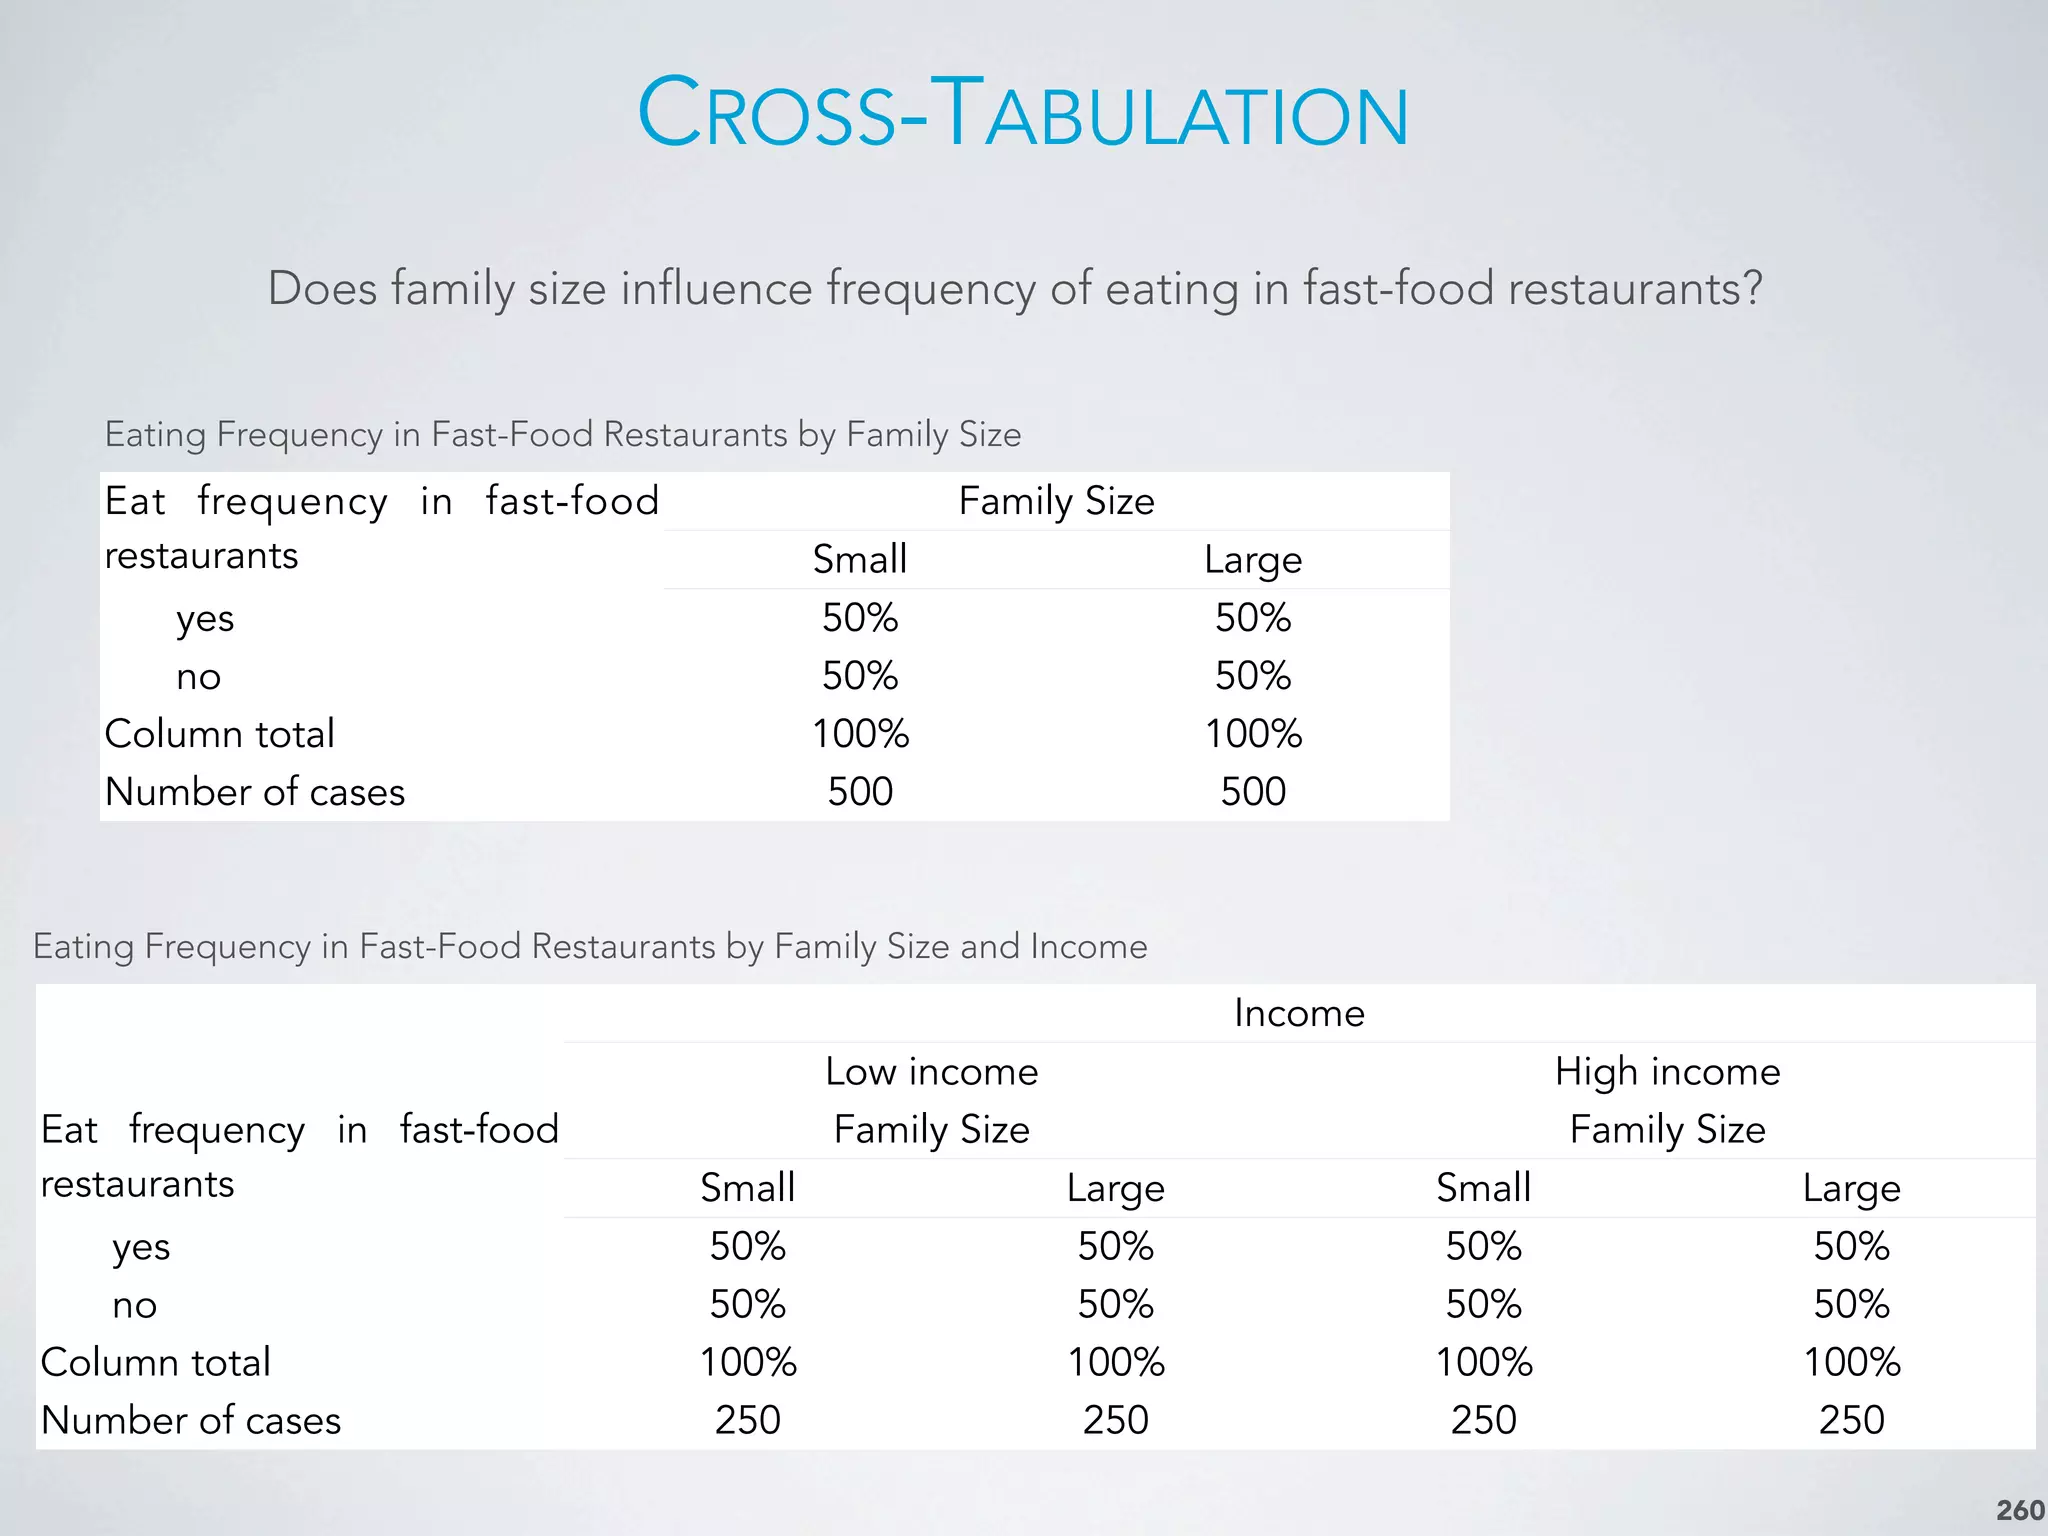
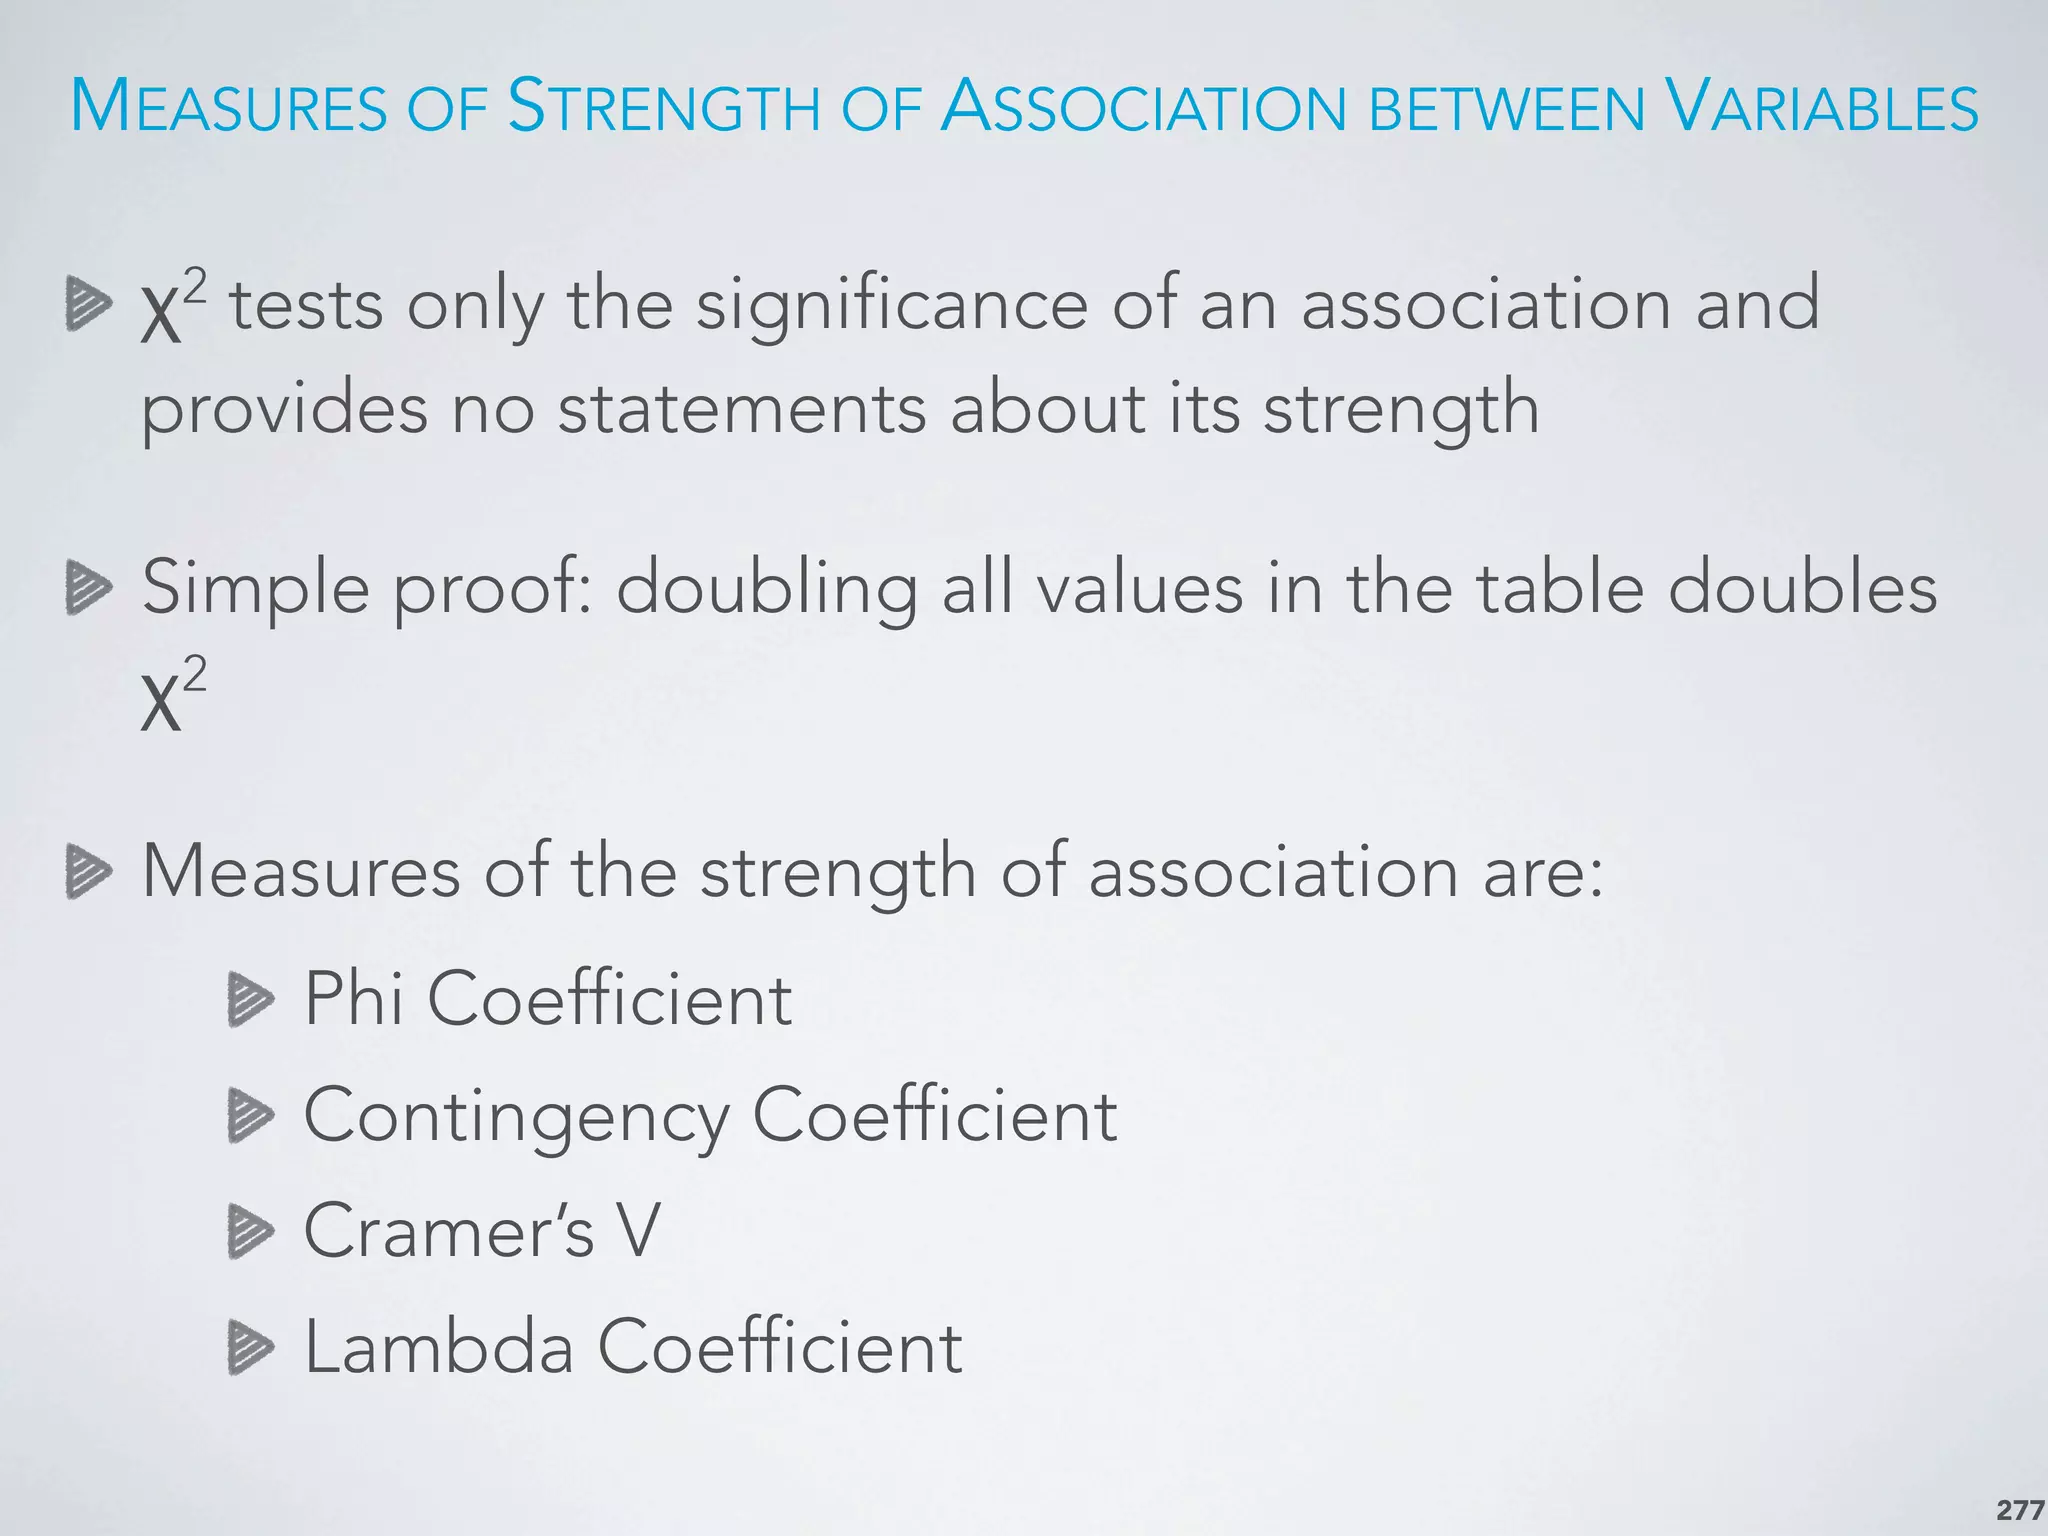
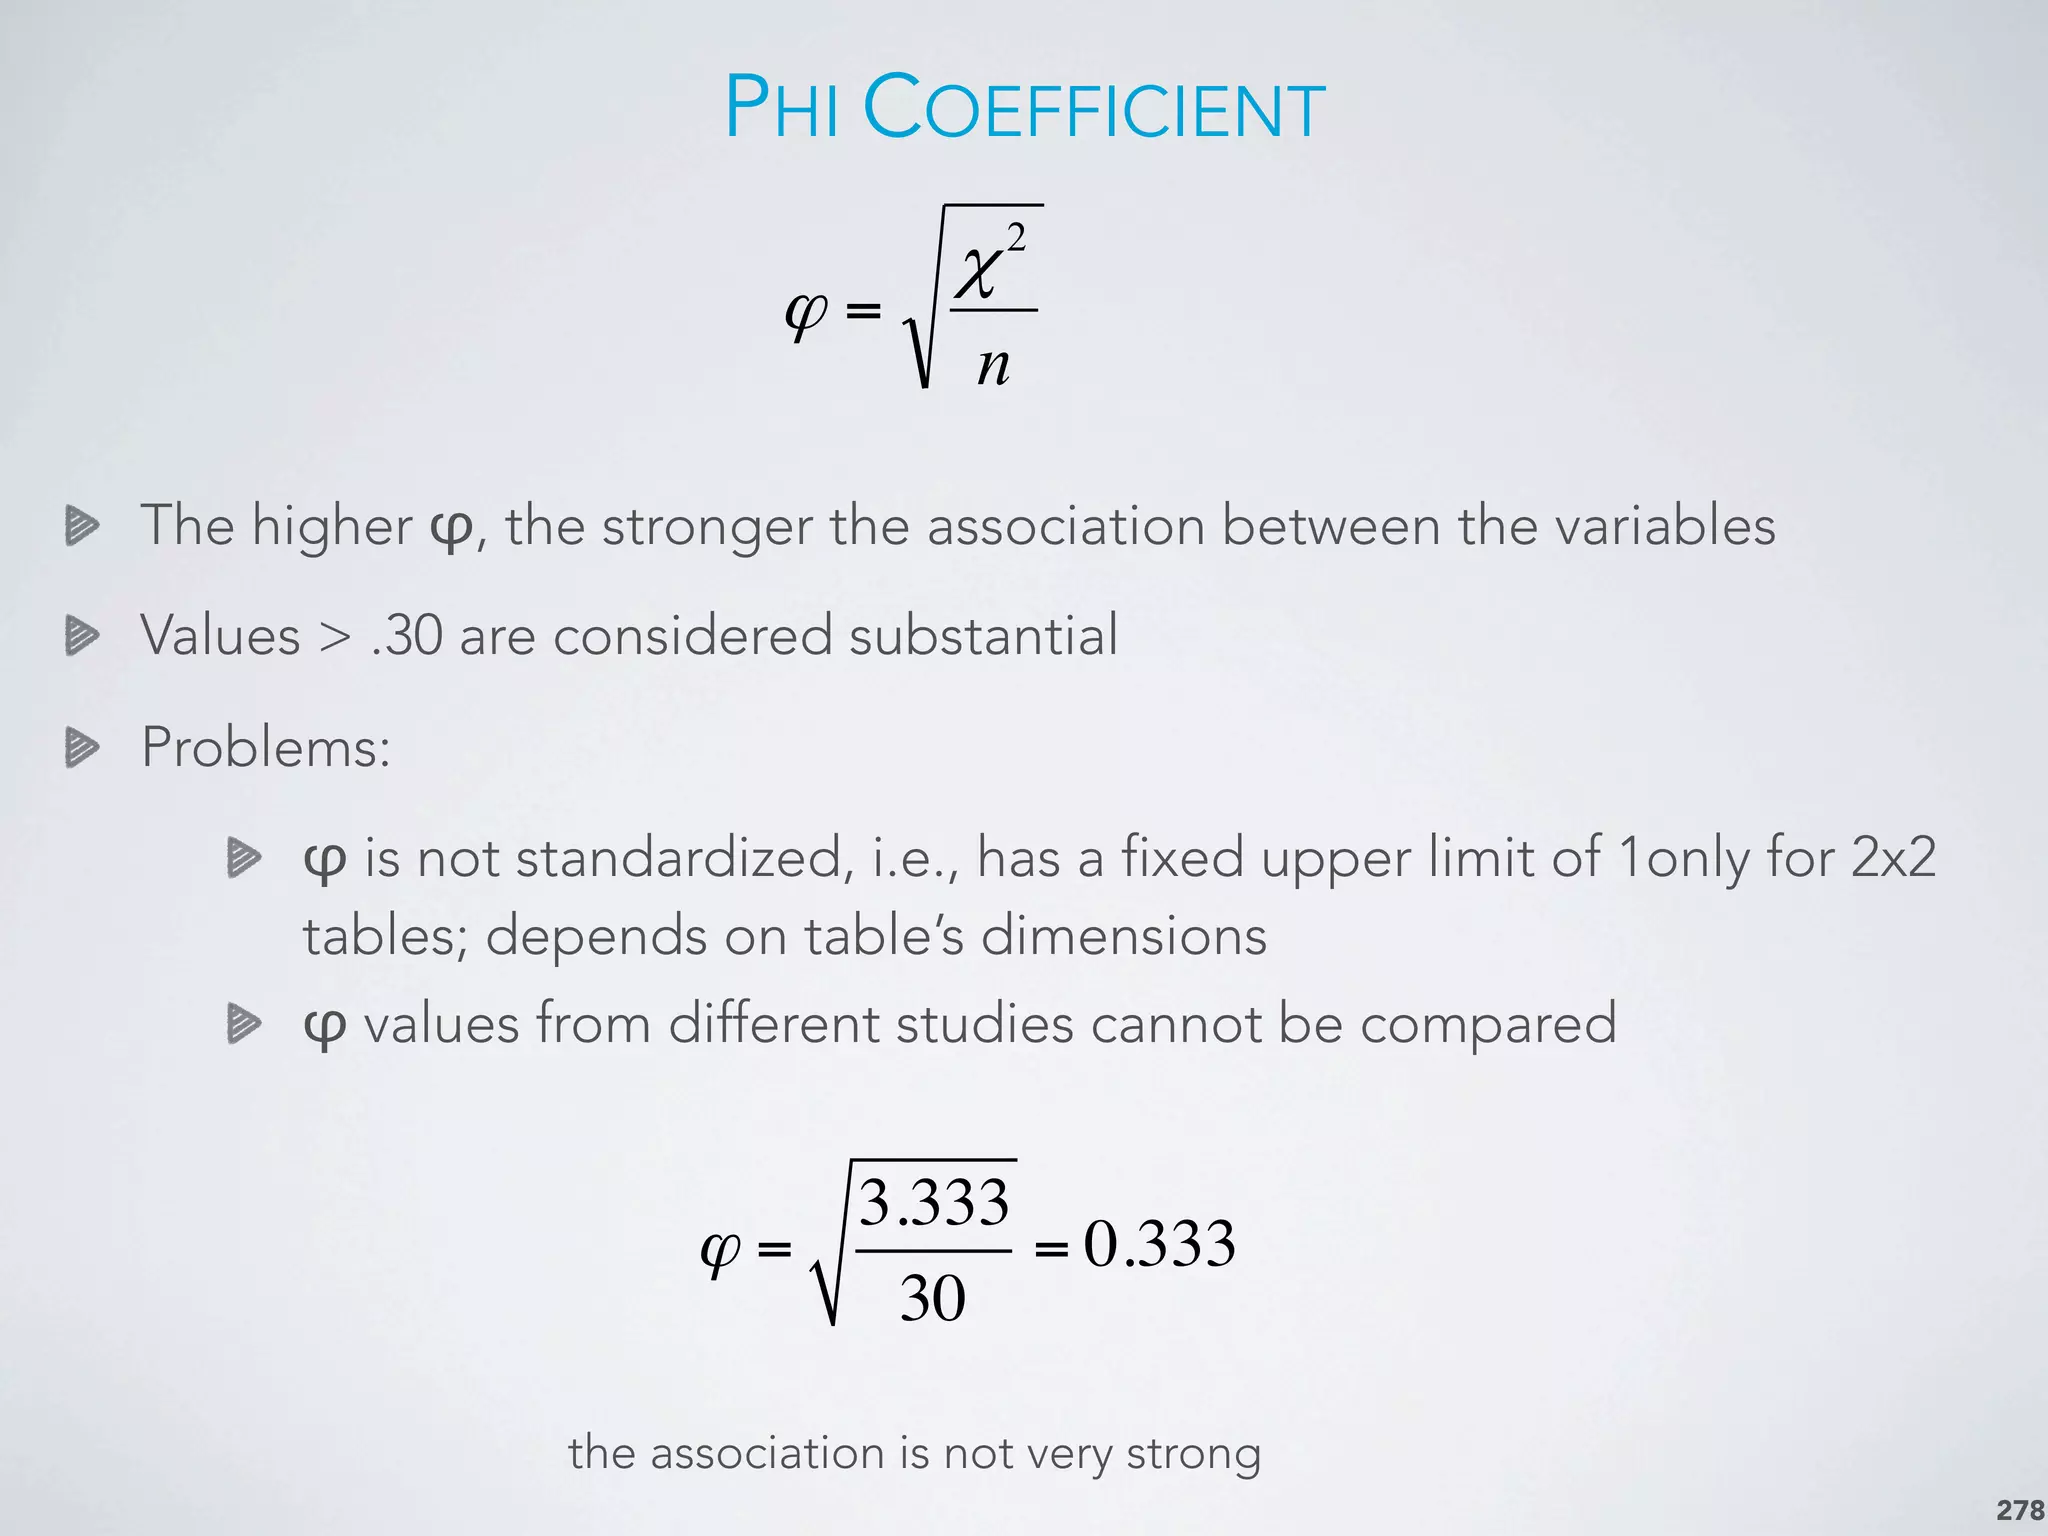
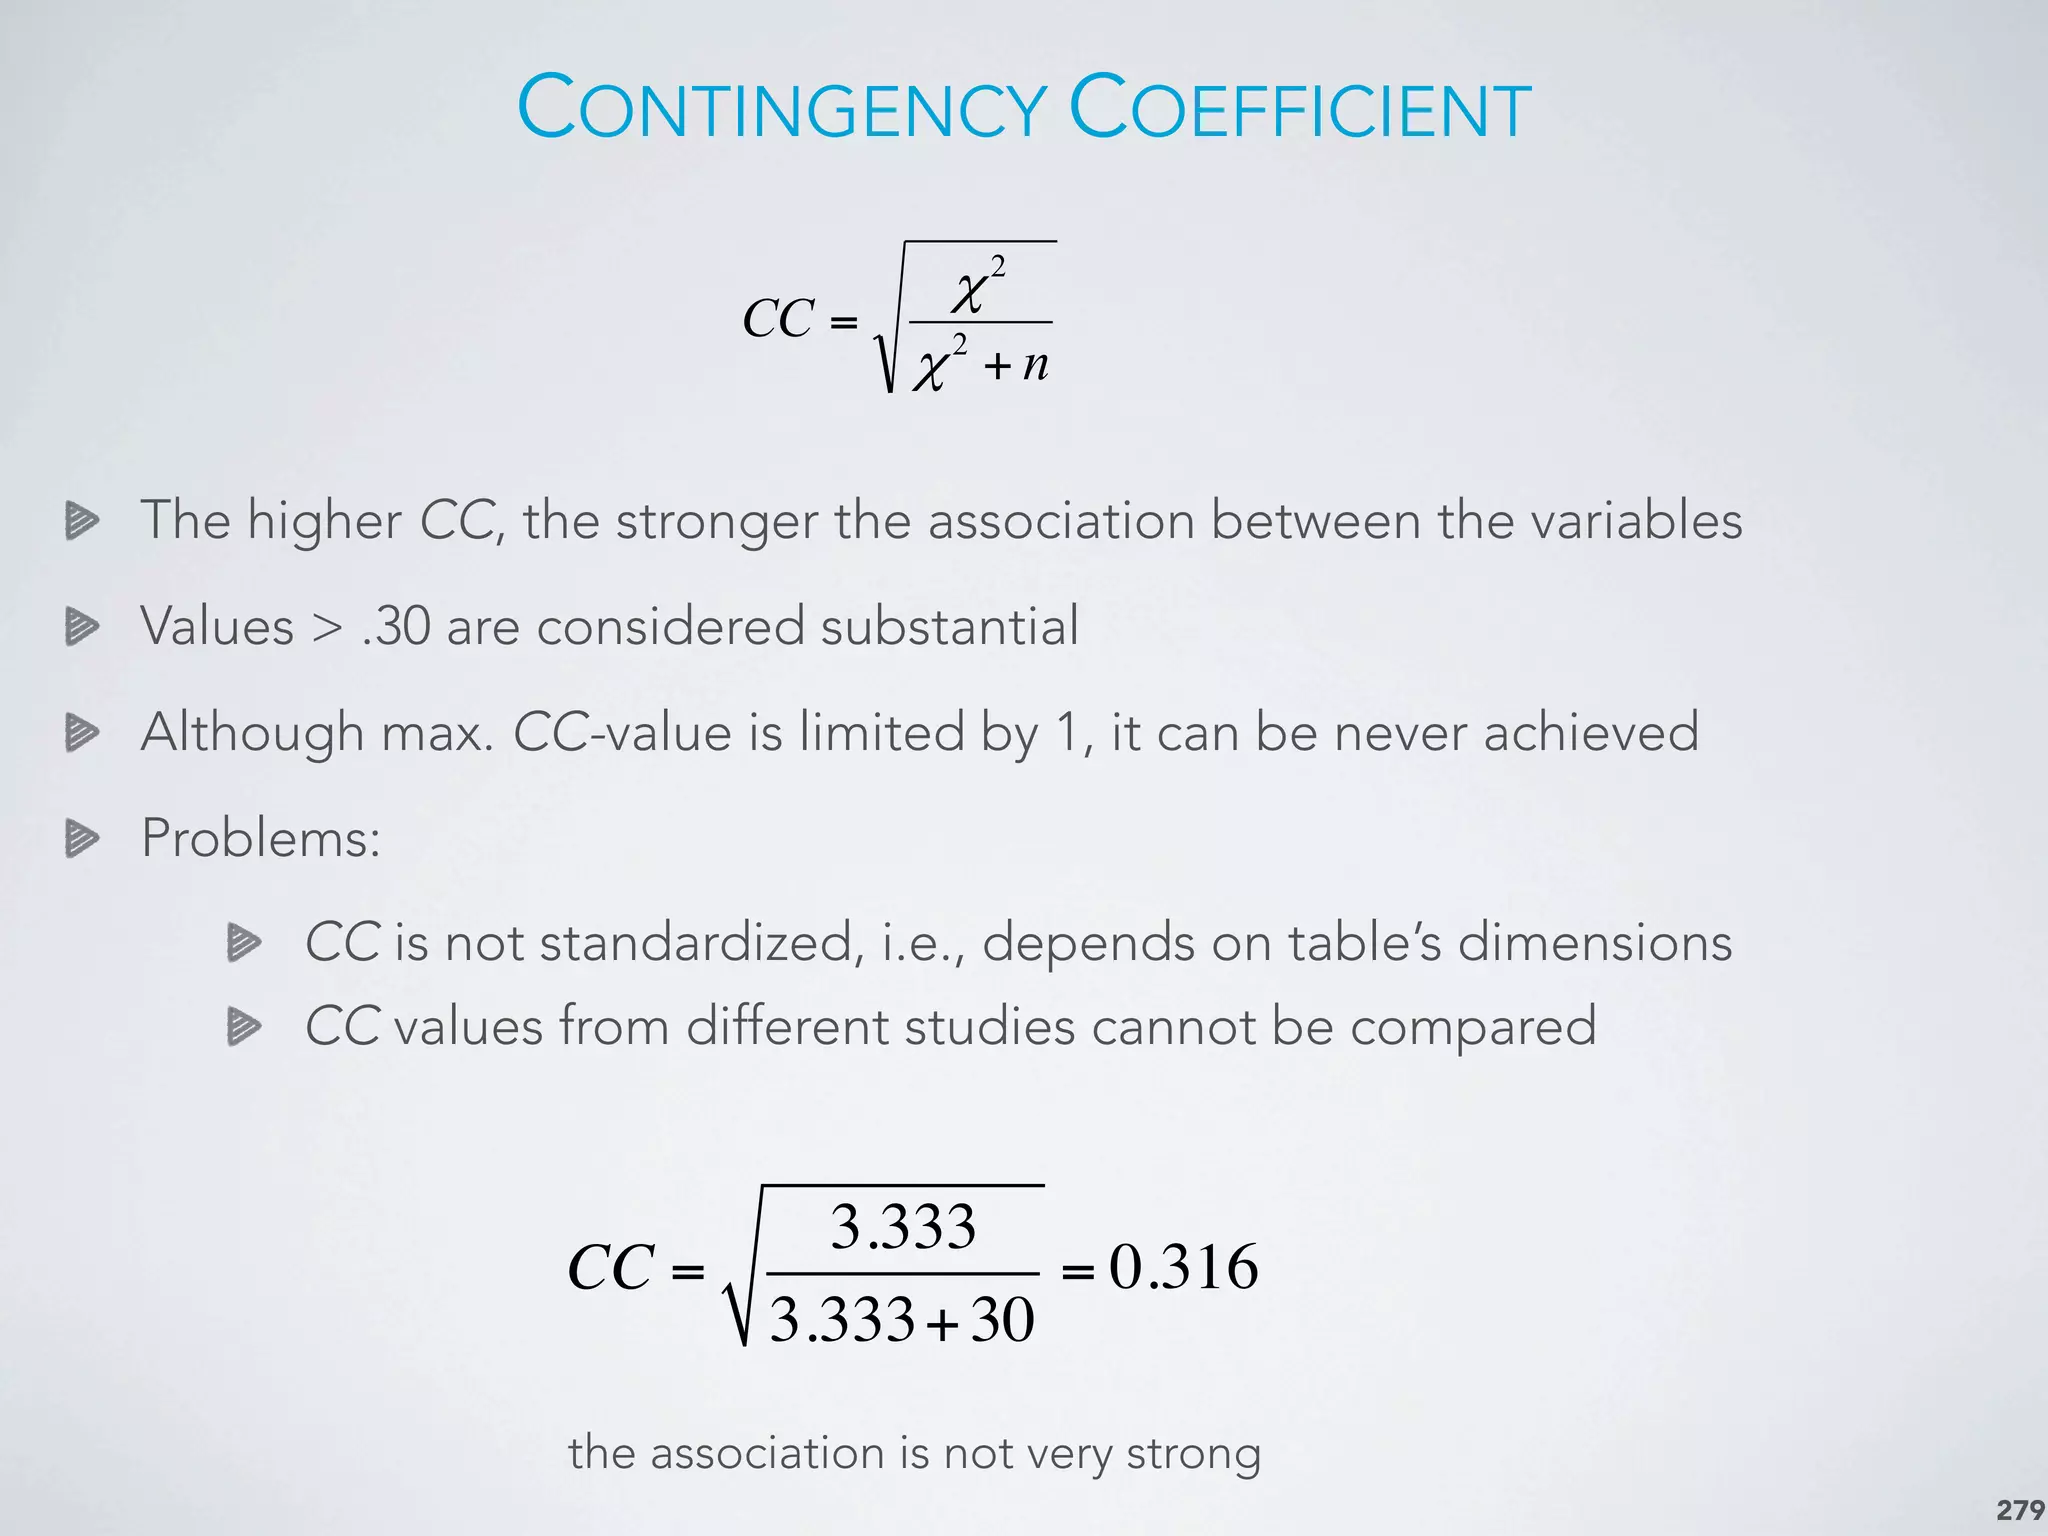
A concise overview of statistical methods used in data analysis, focusing on descriptive and inferential statistics.
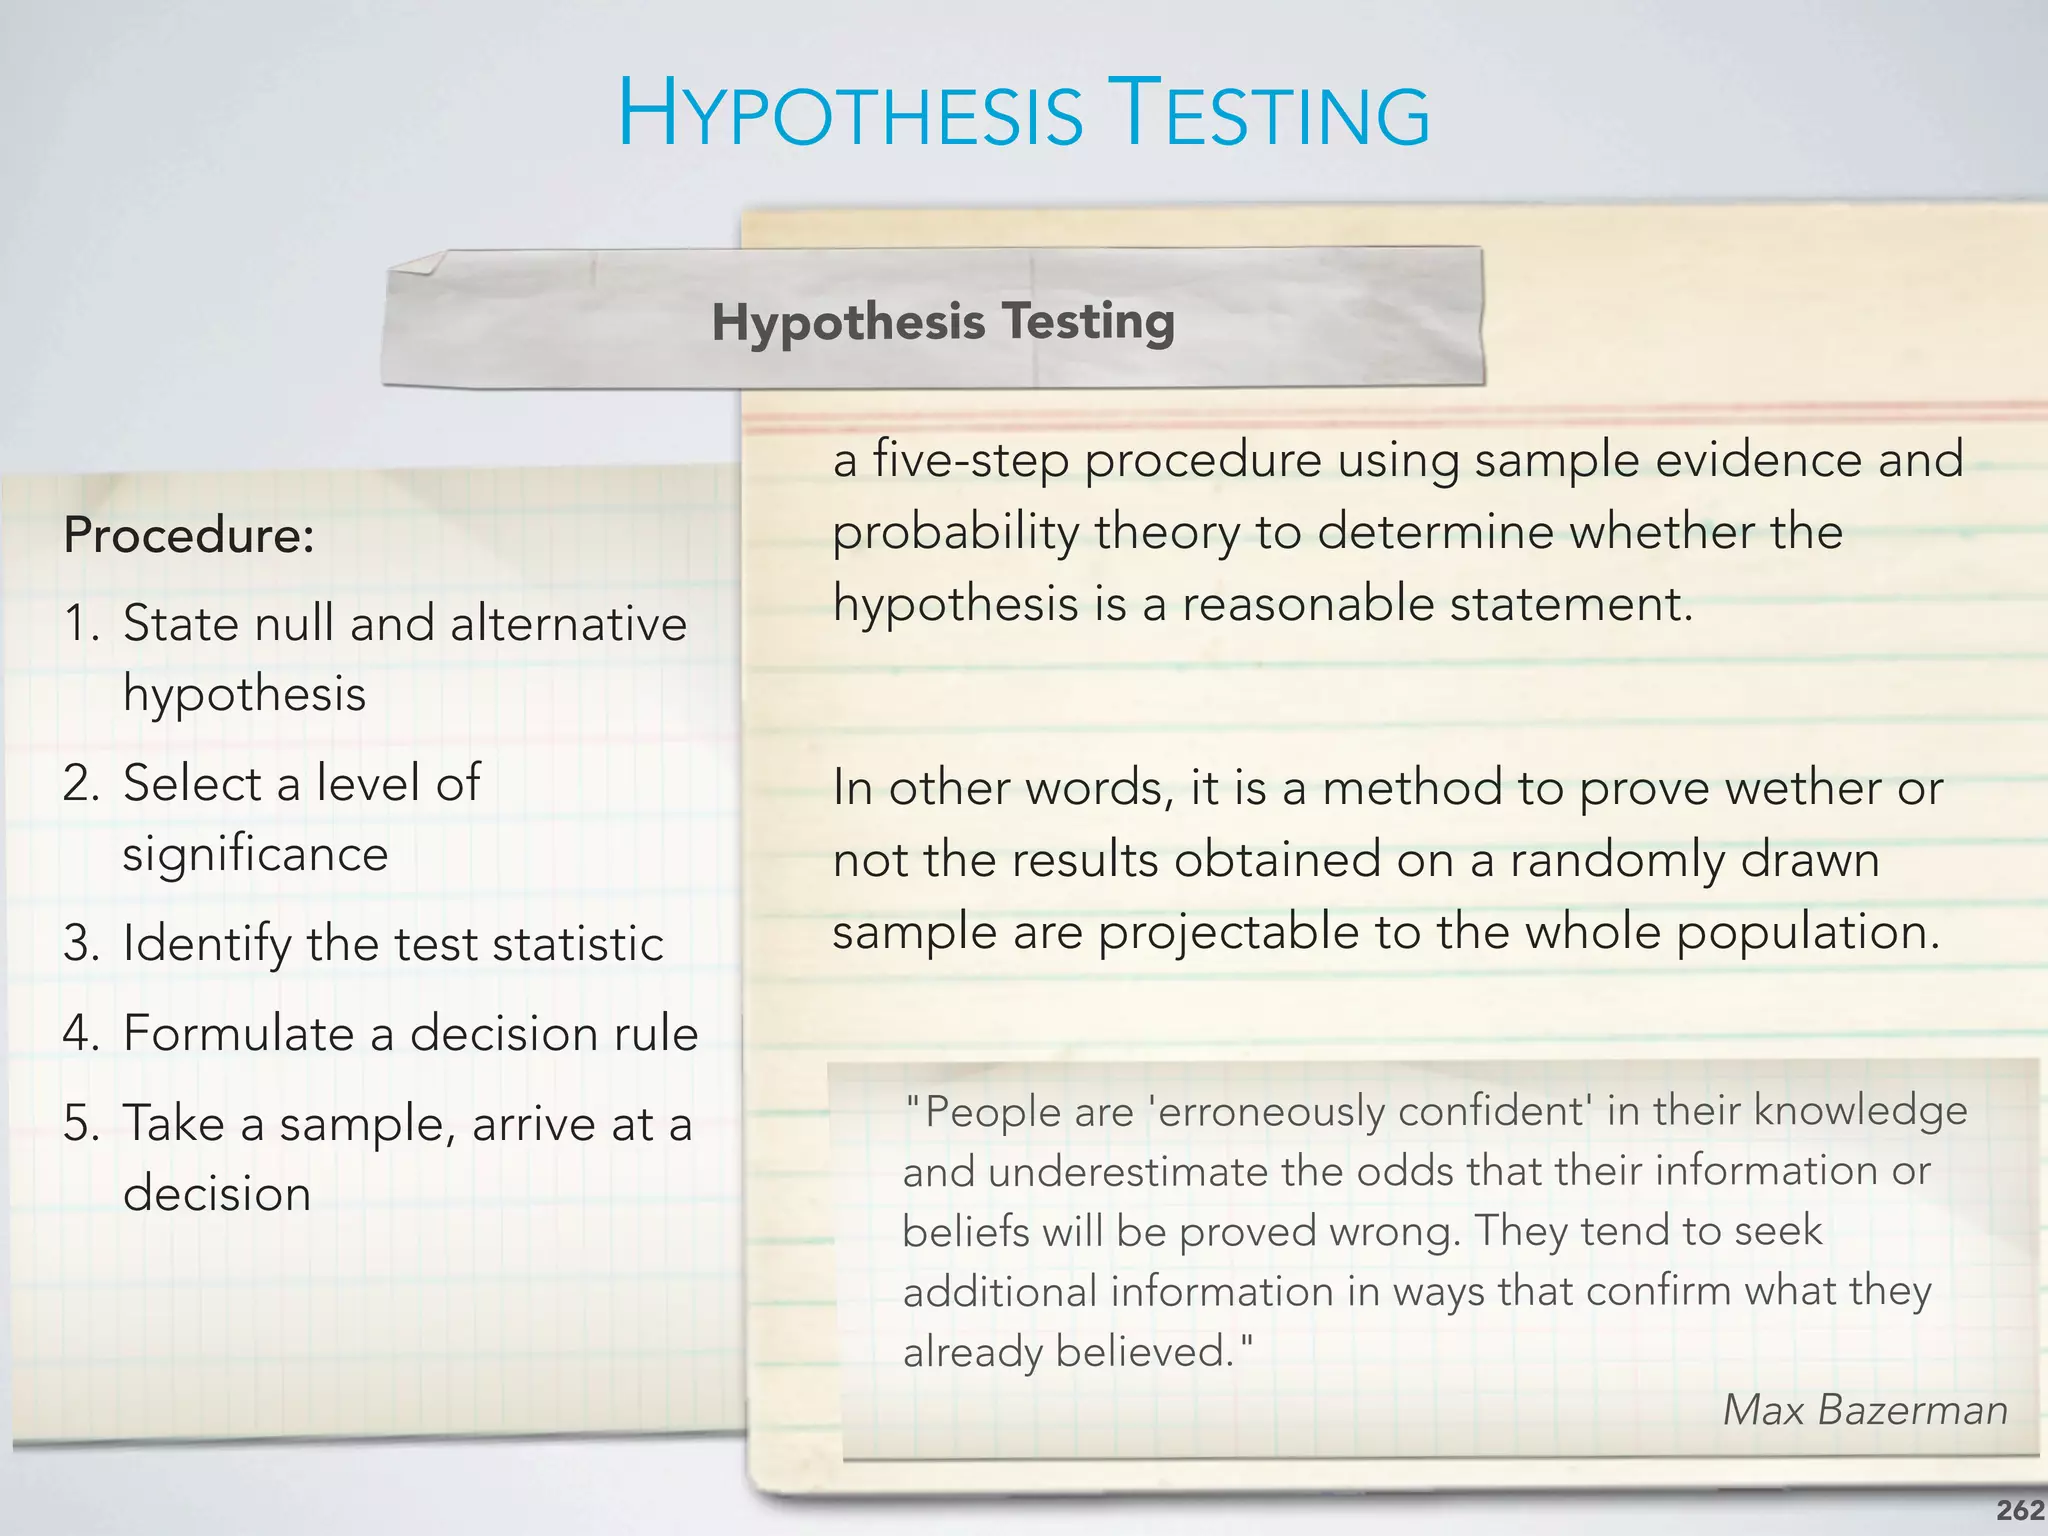
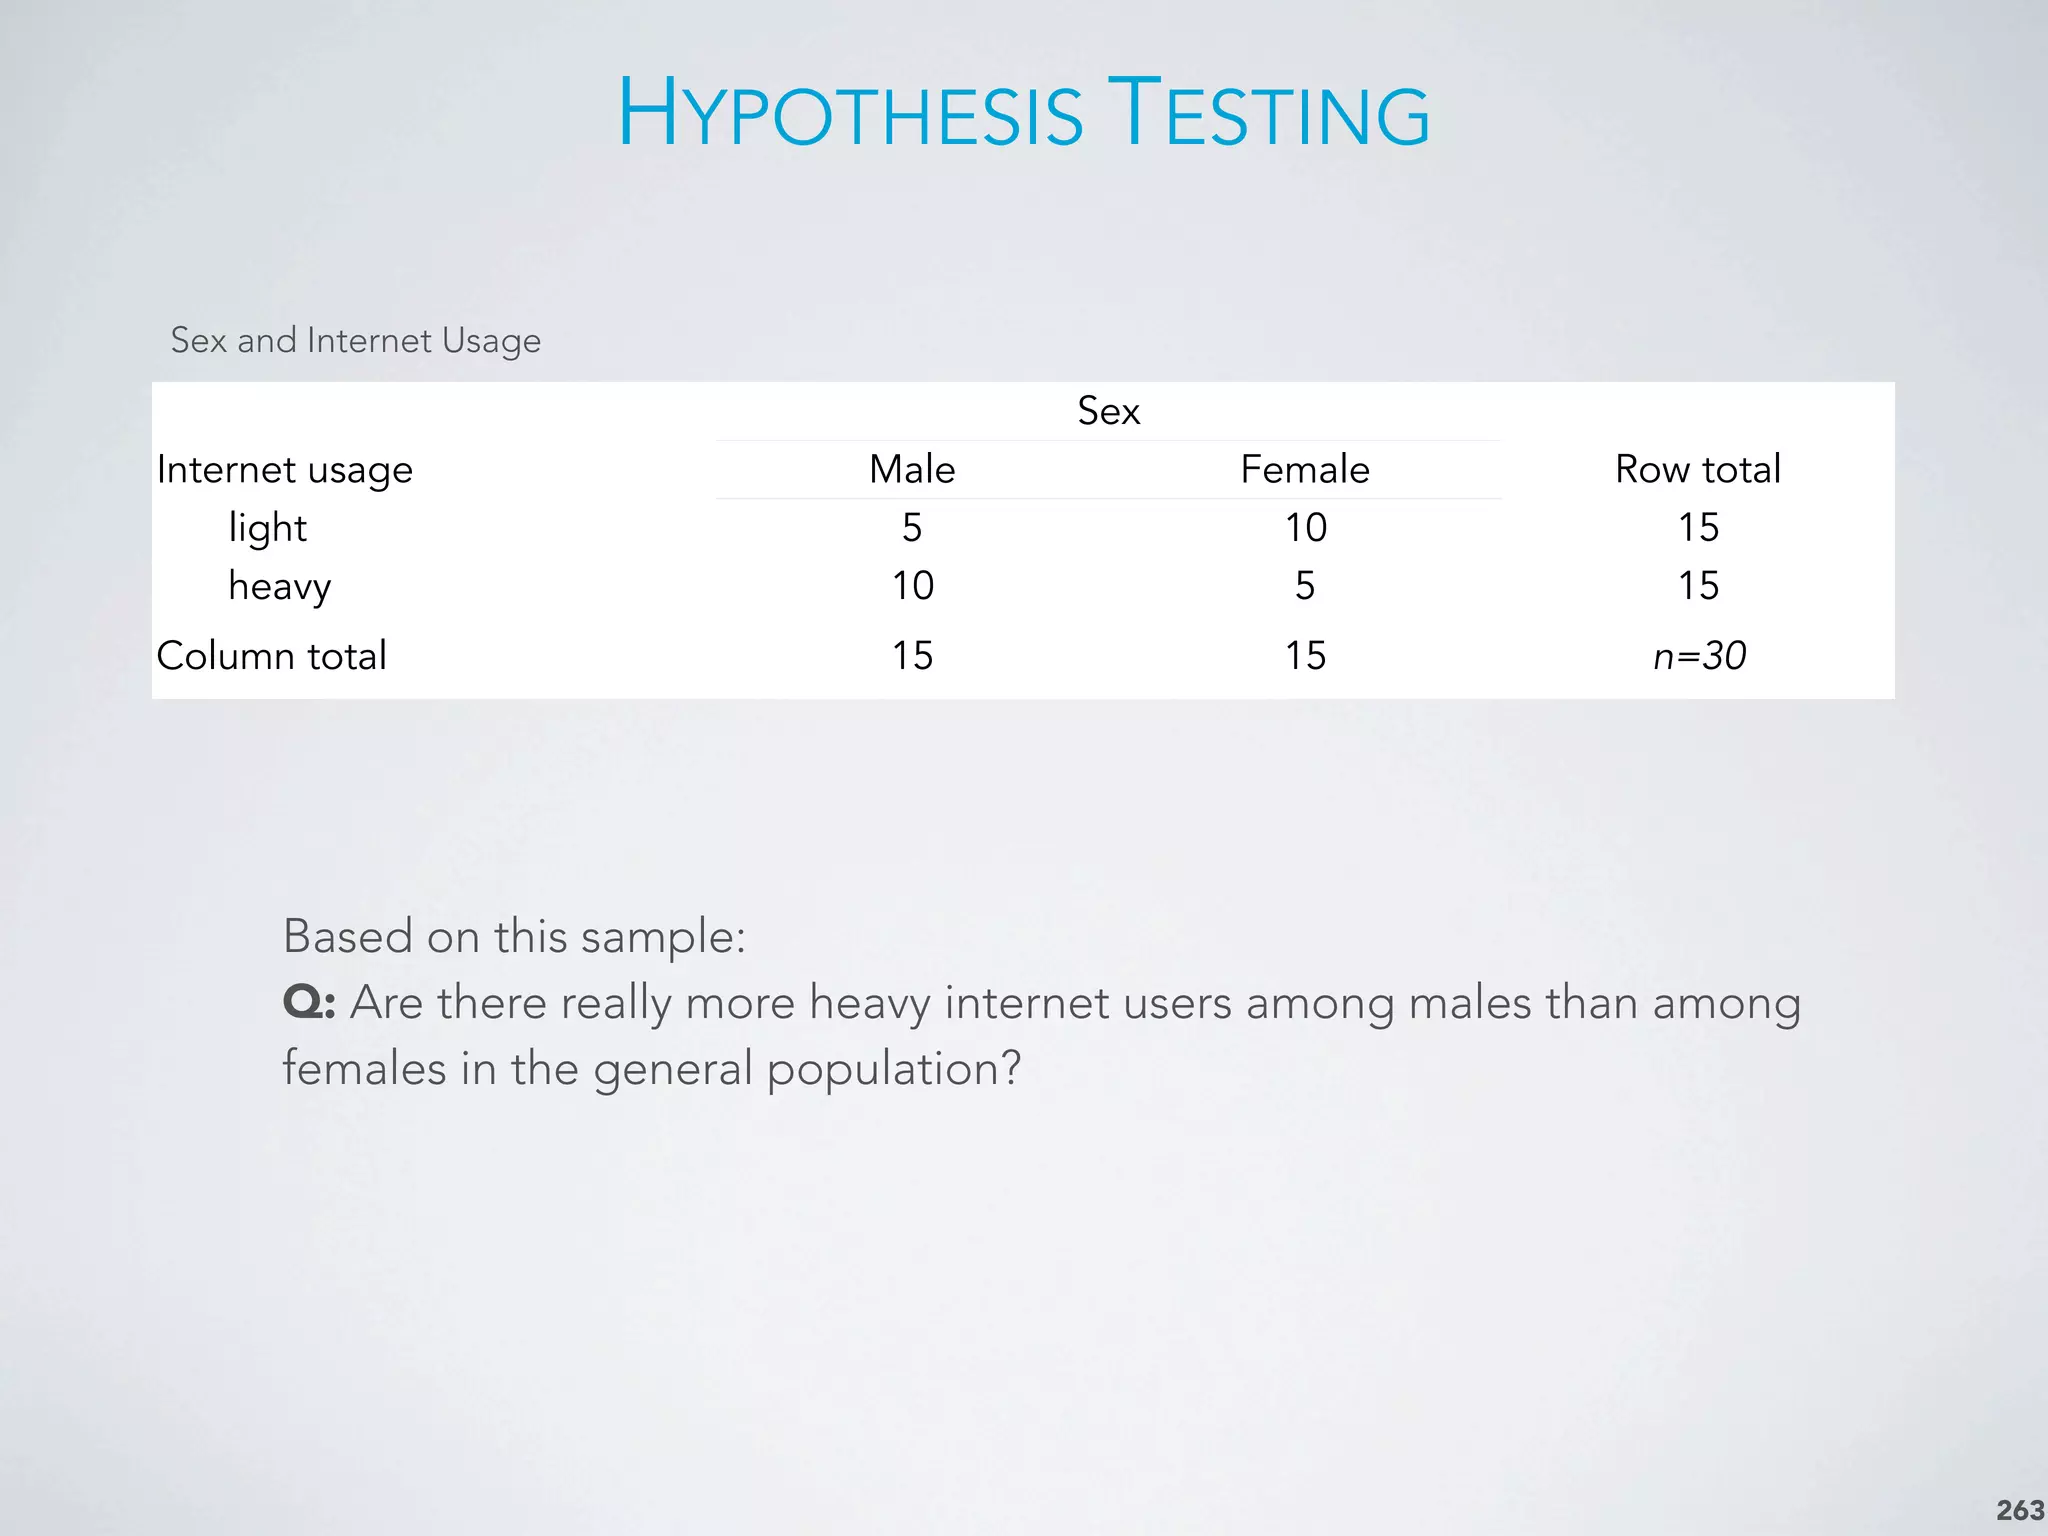
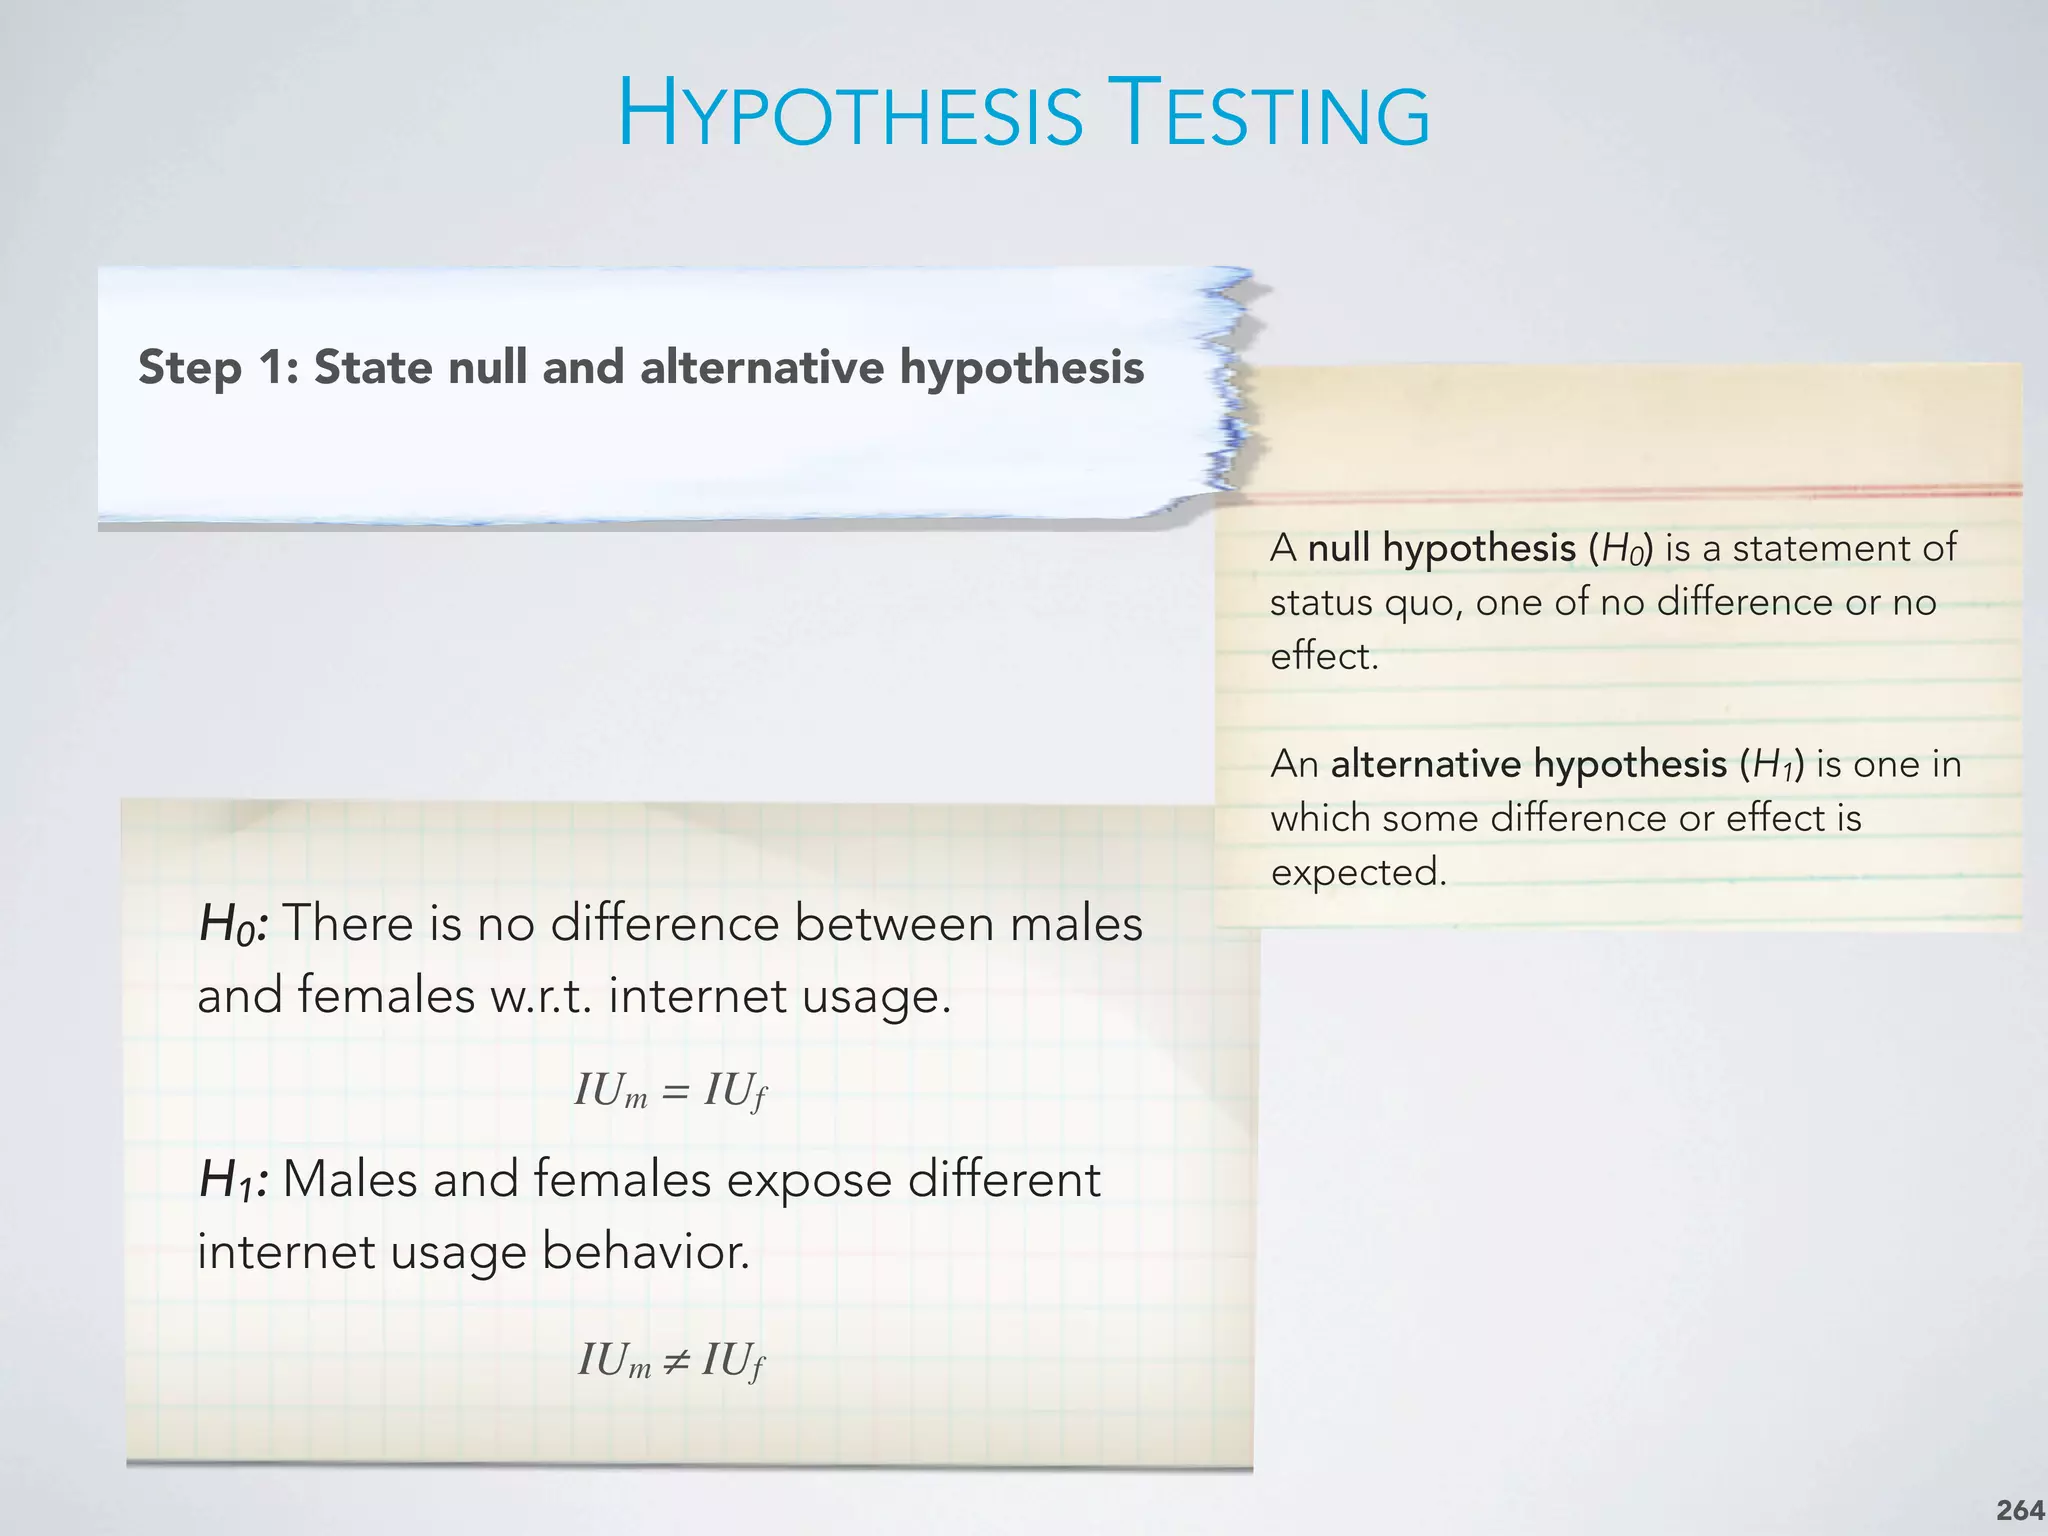
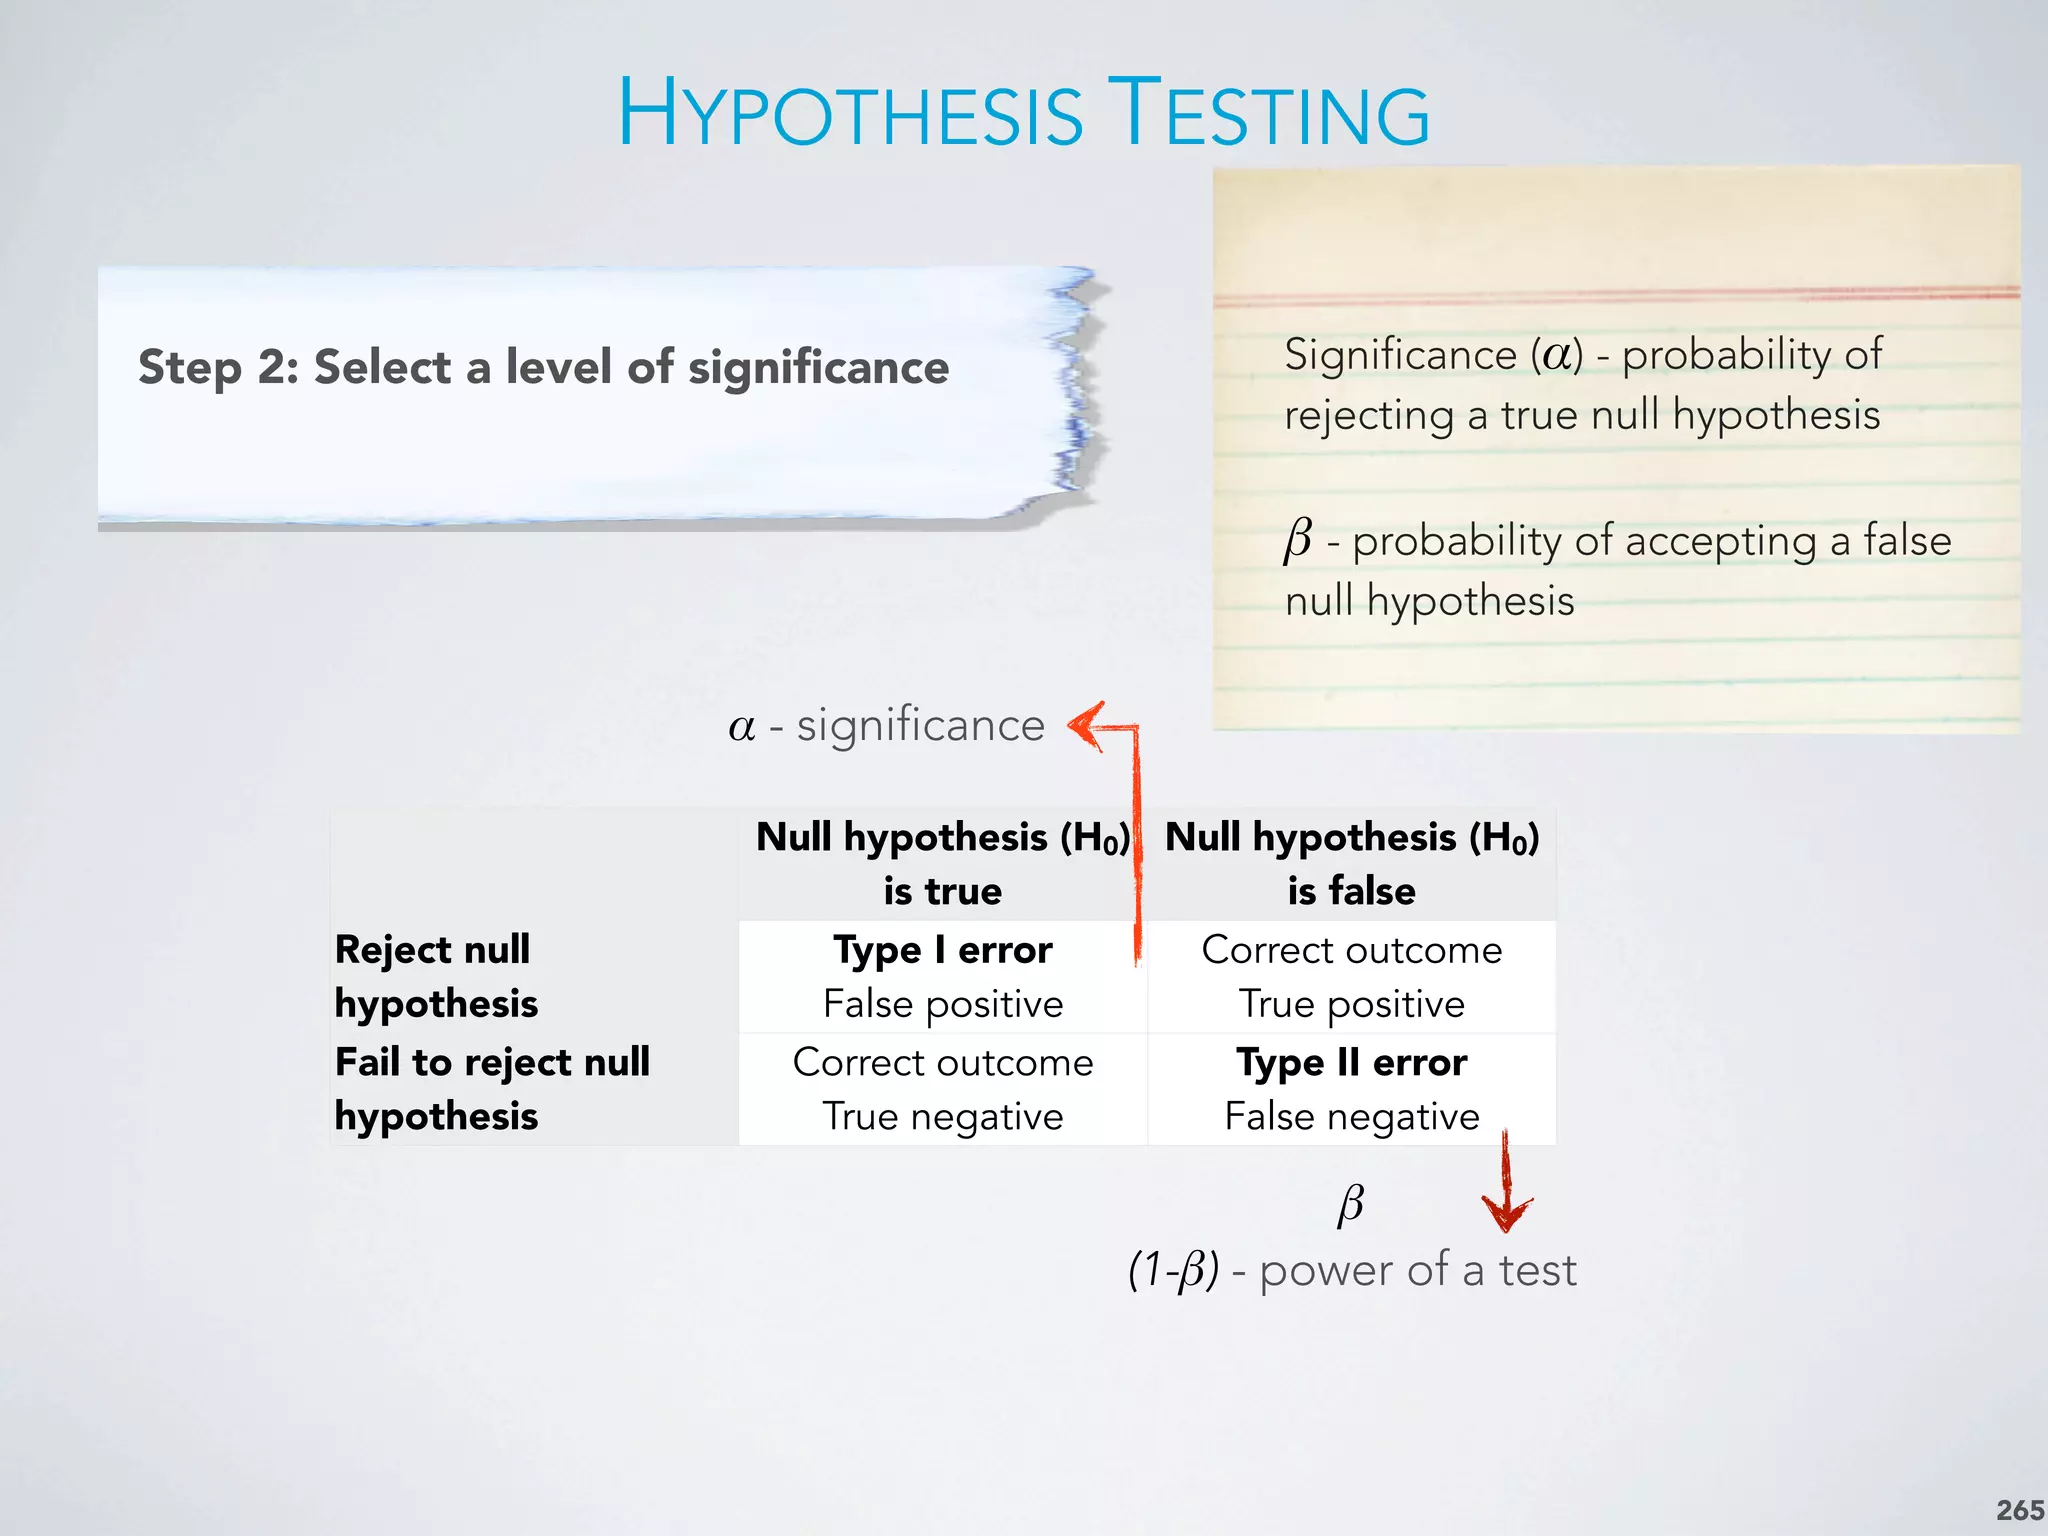
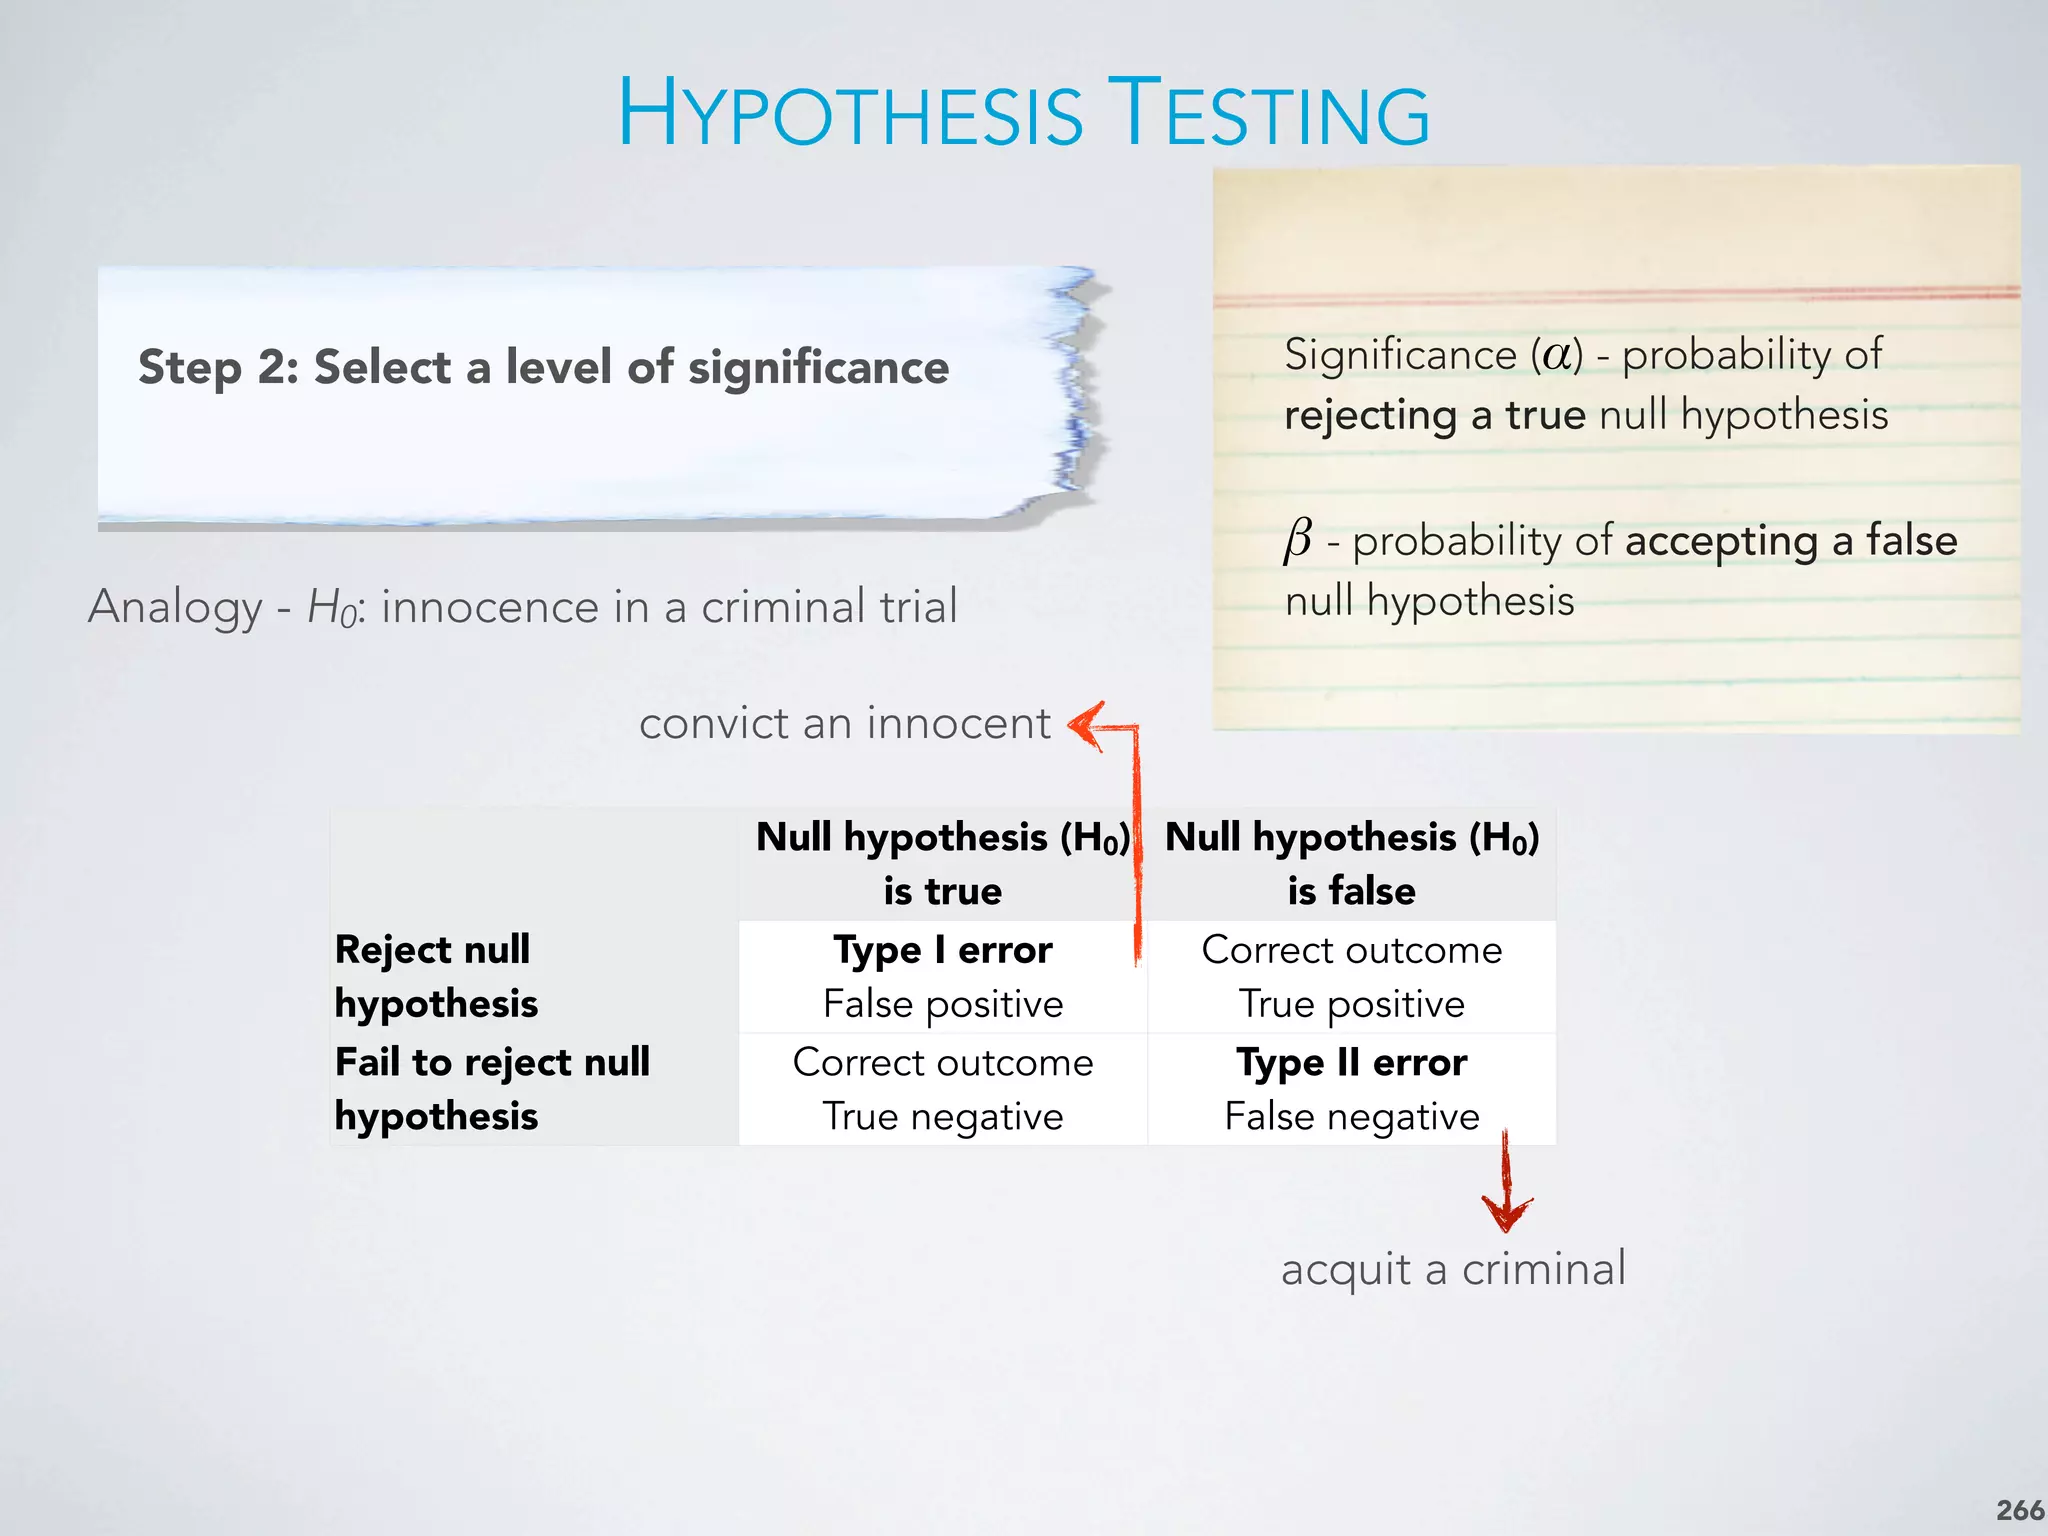
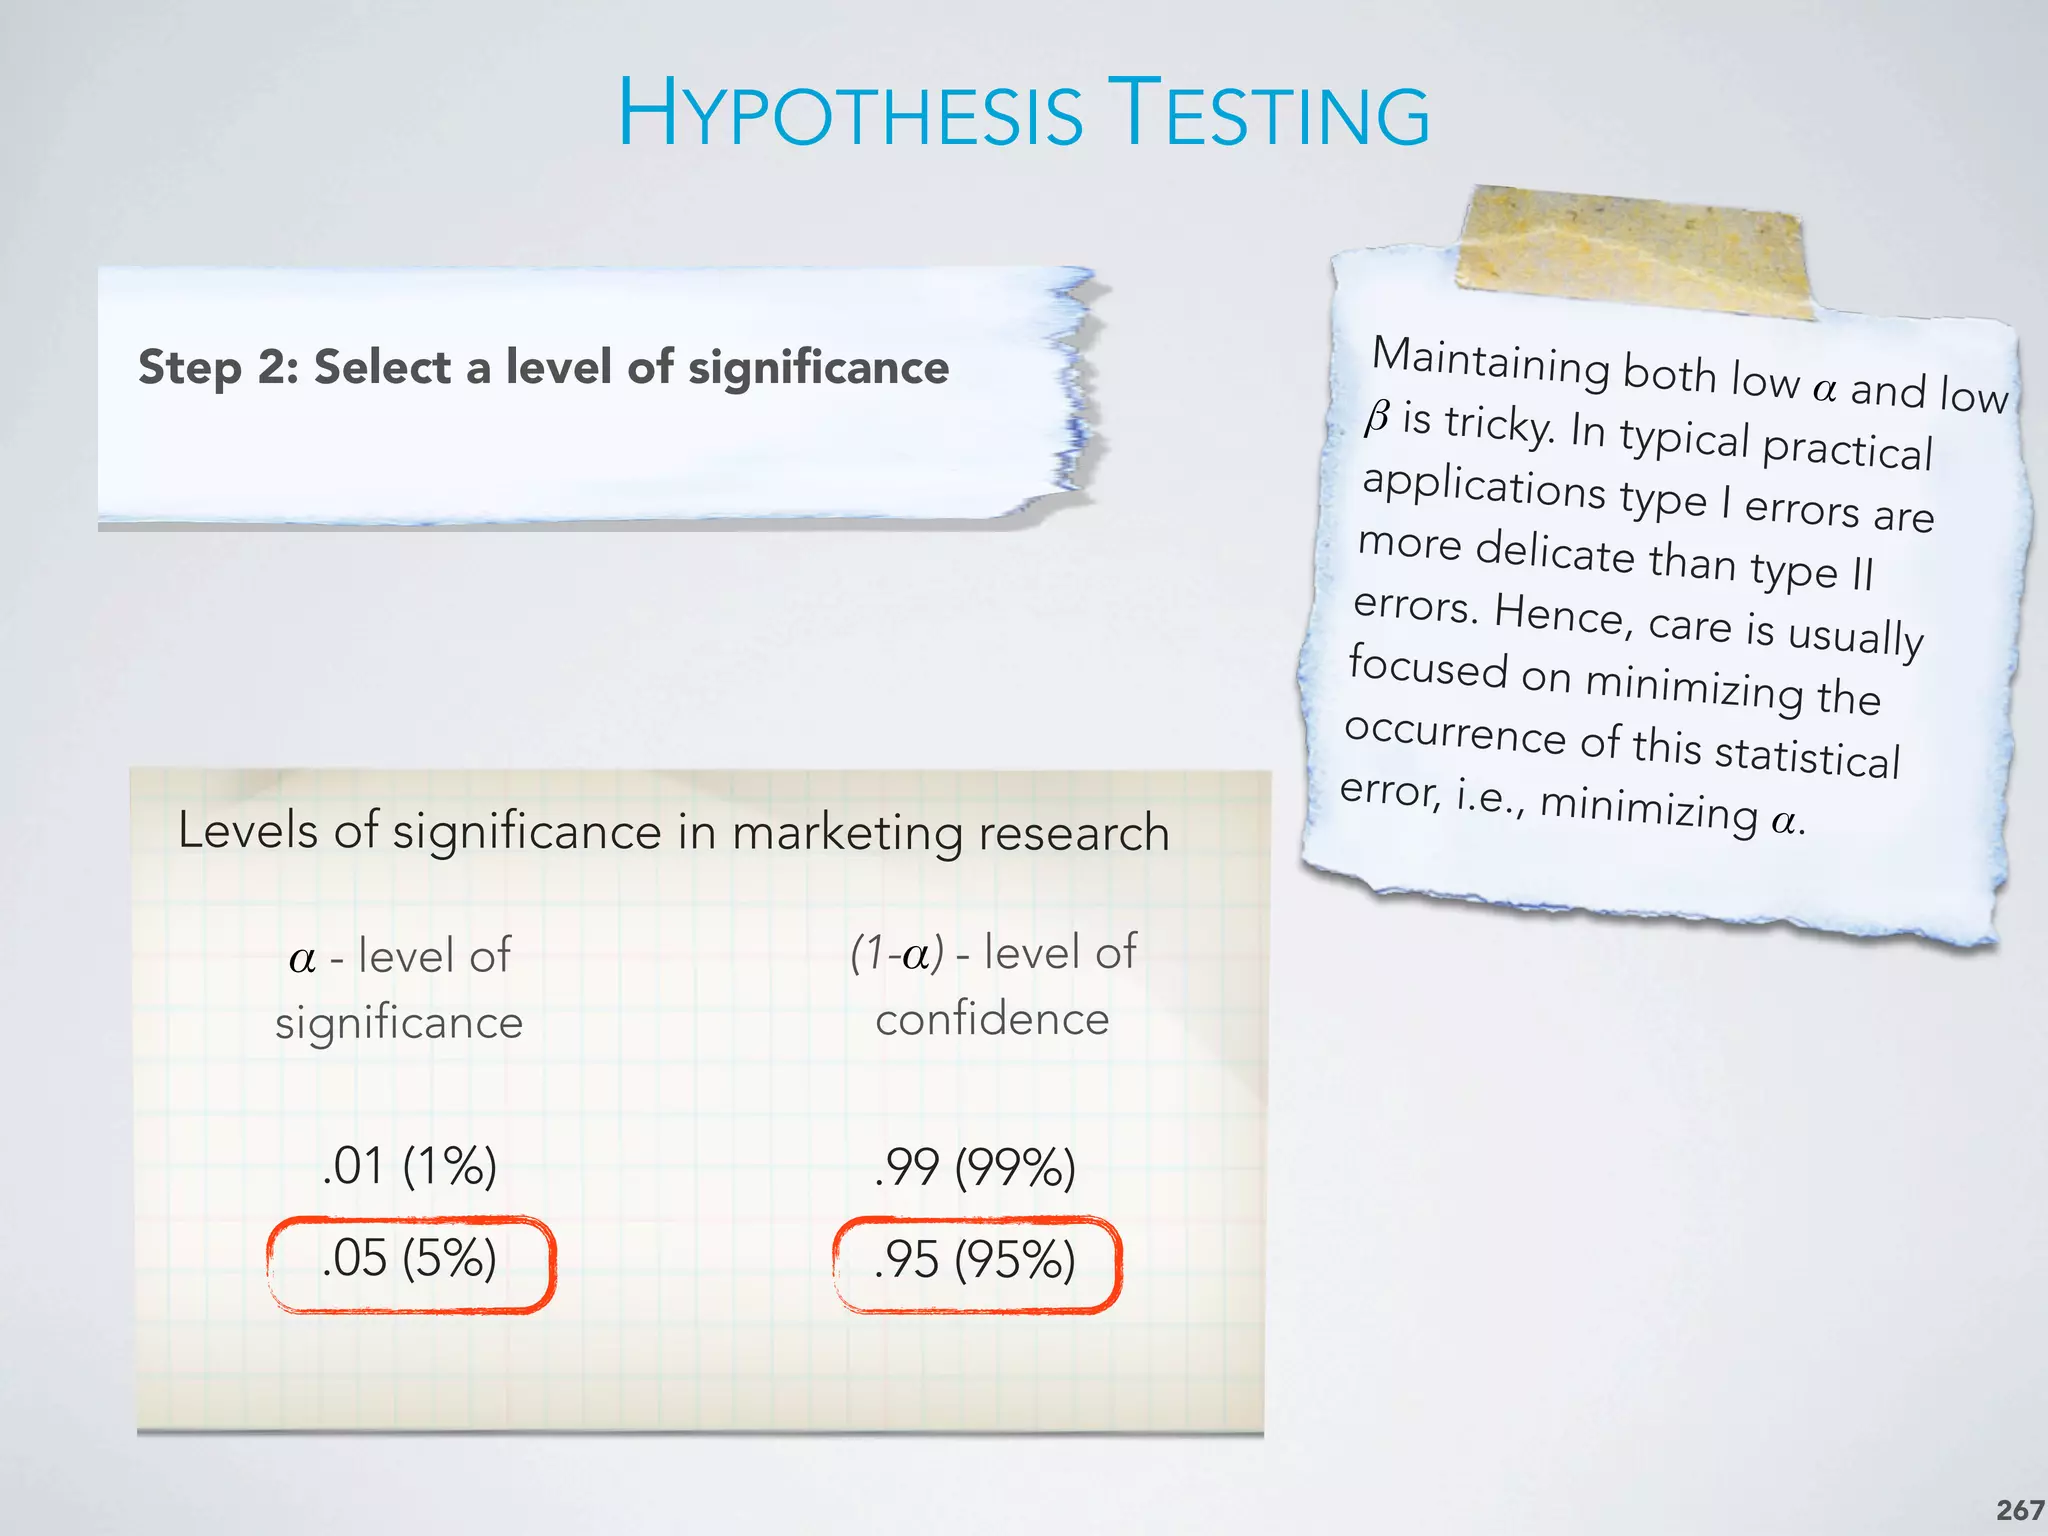
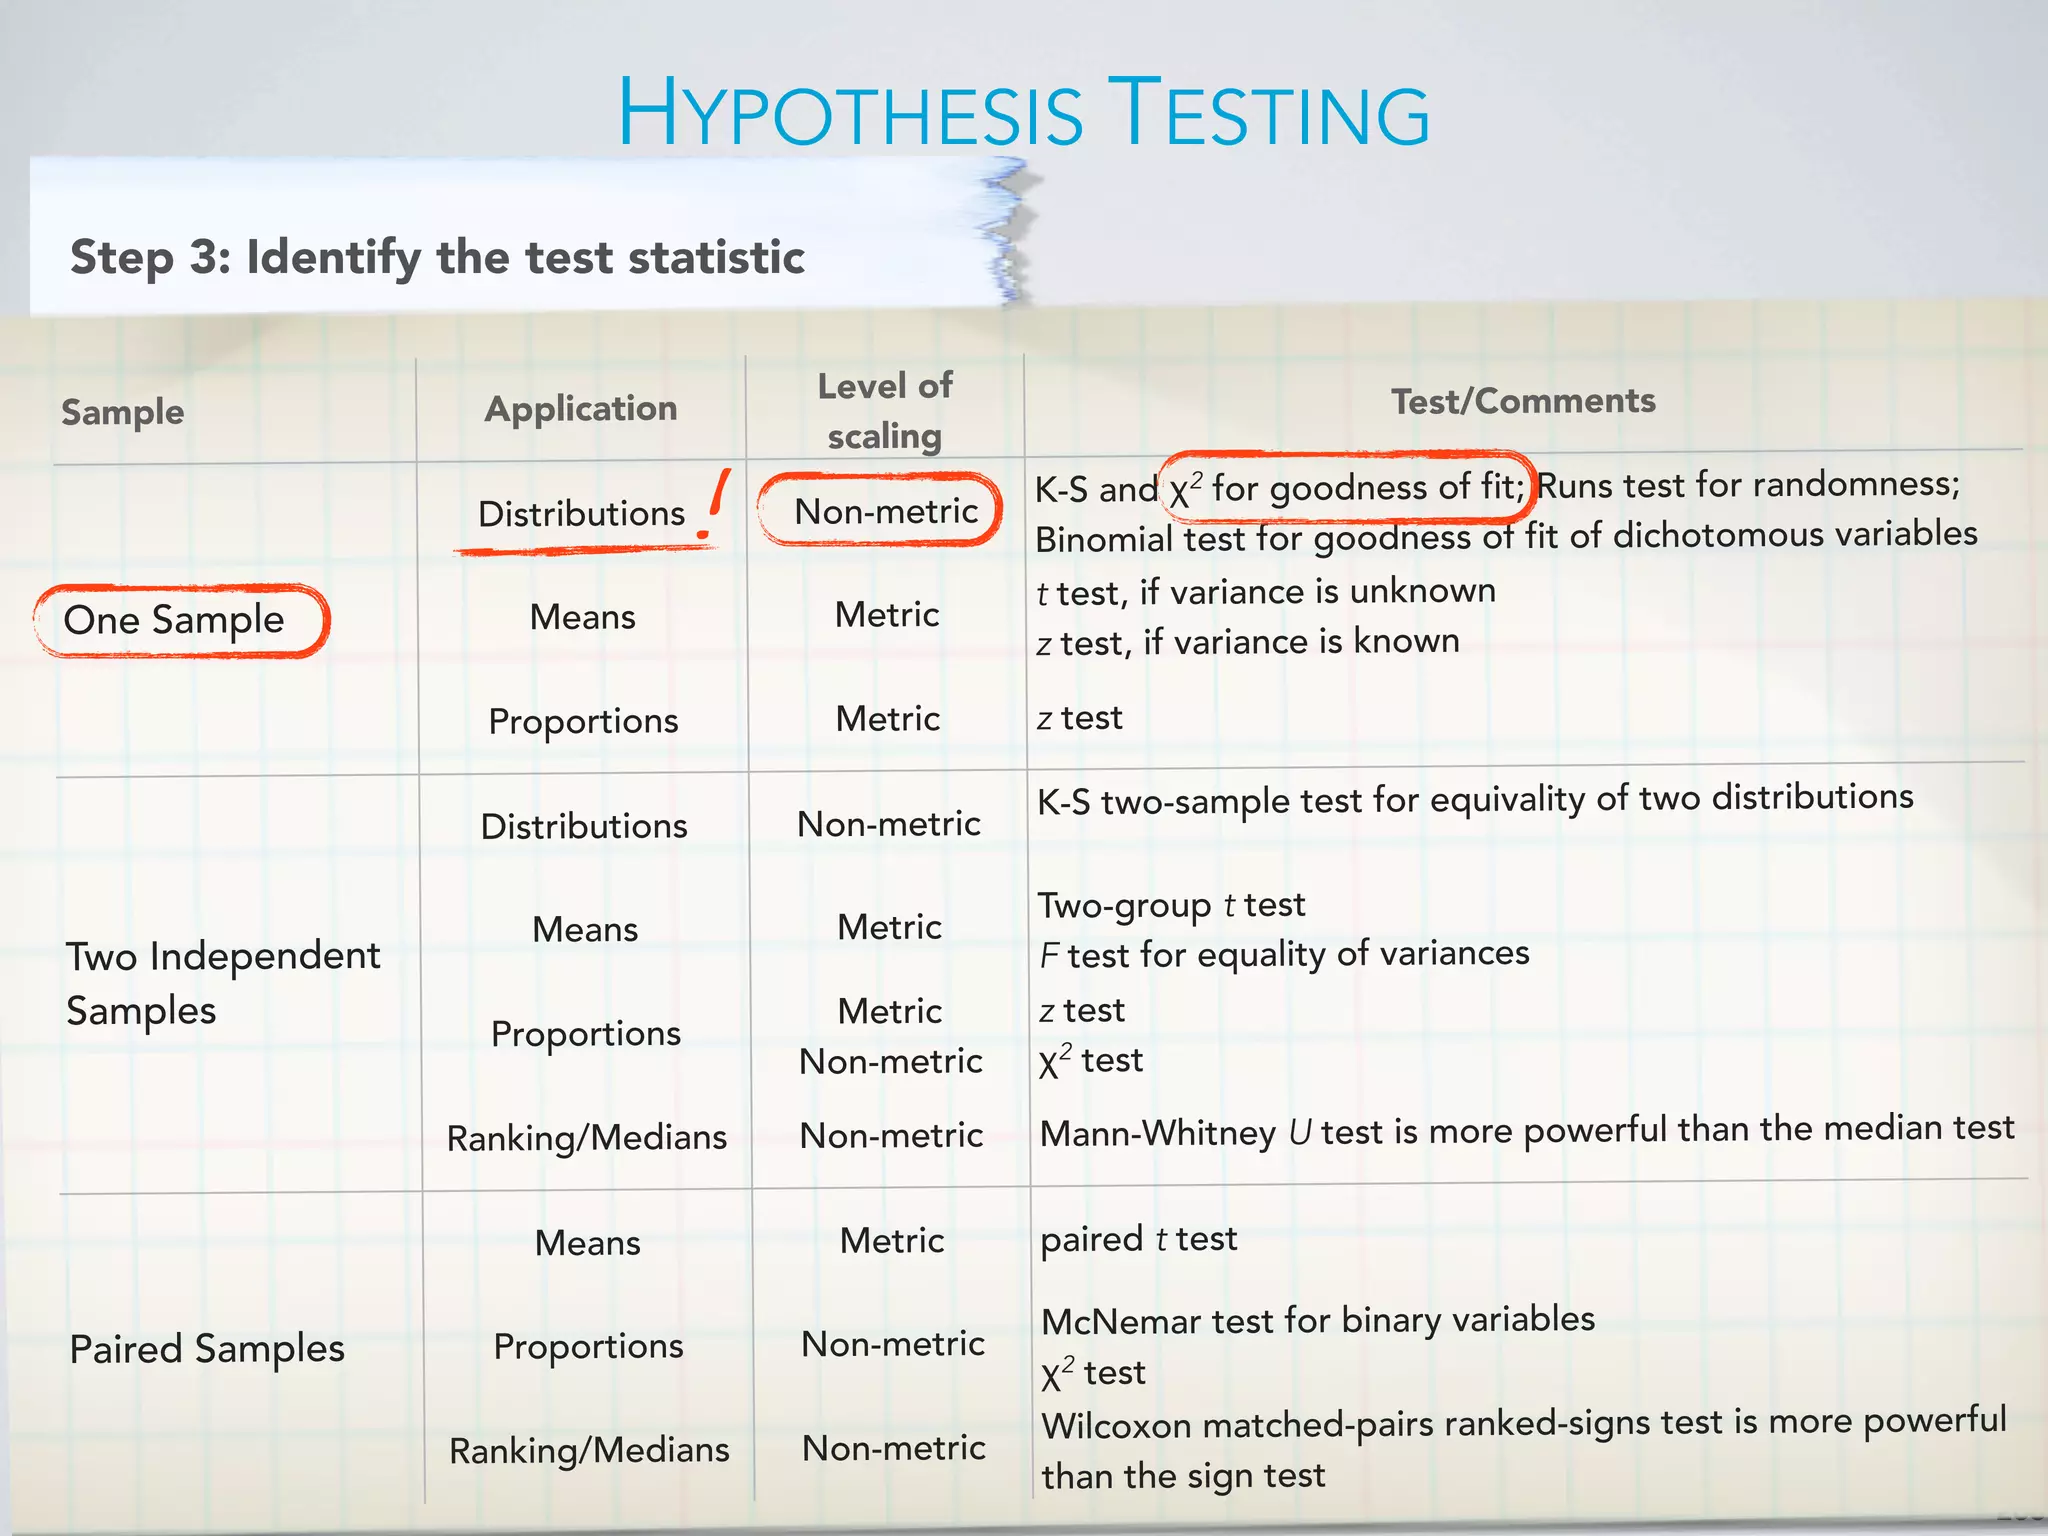
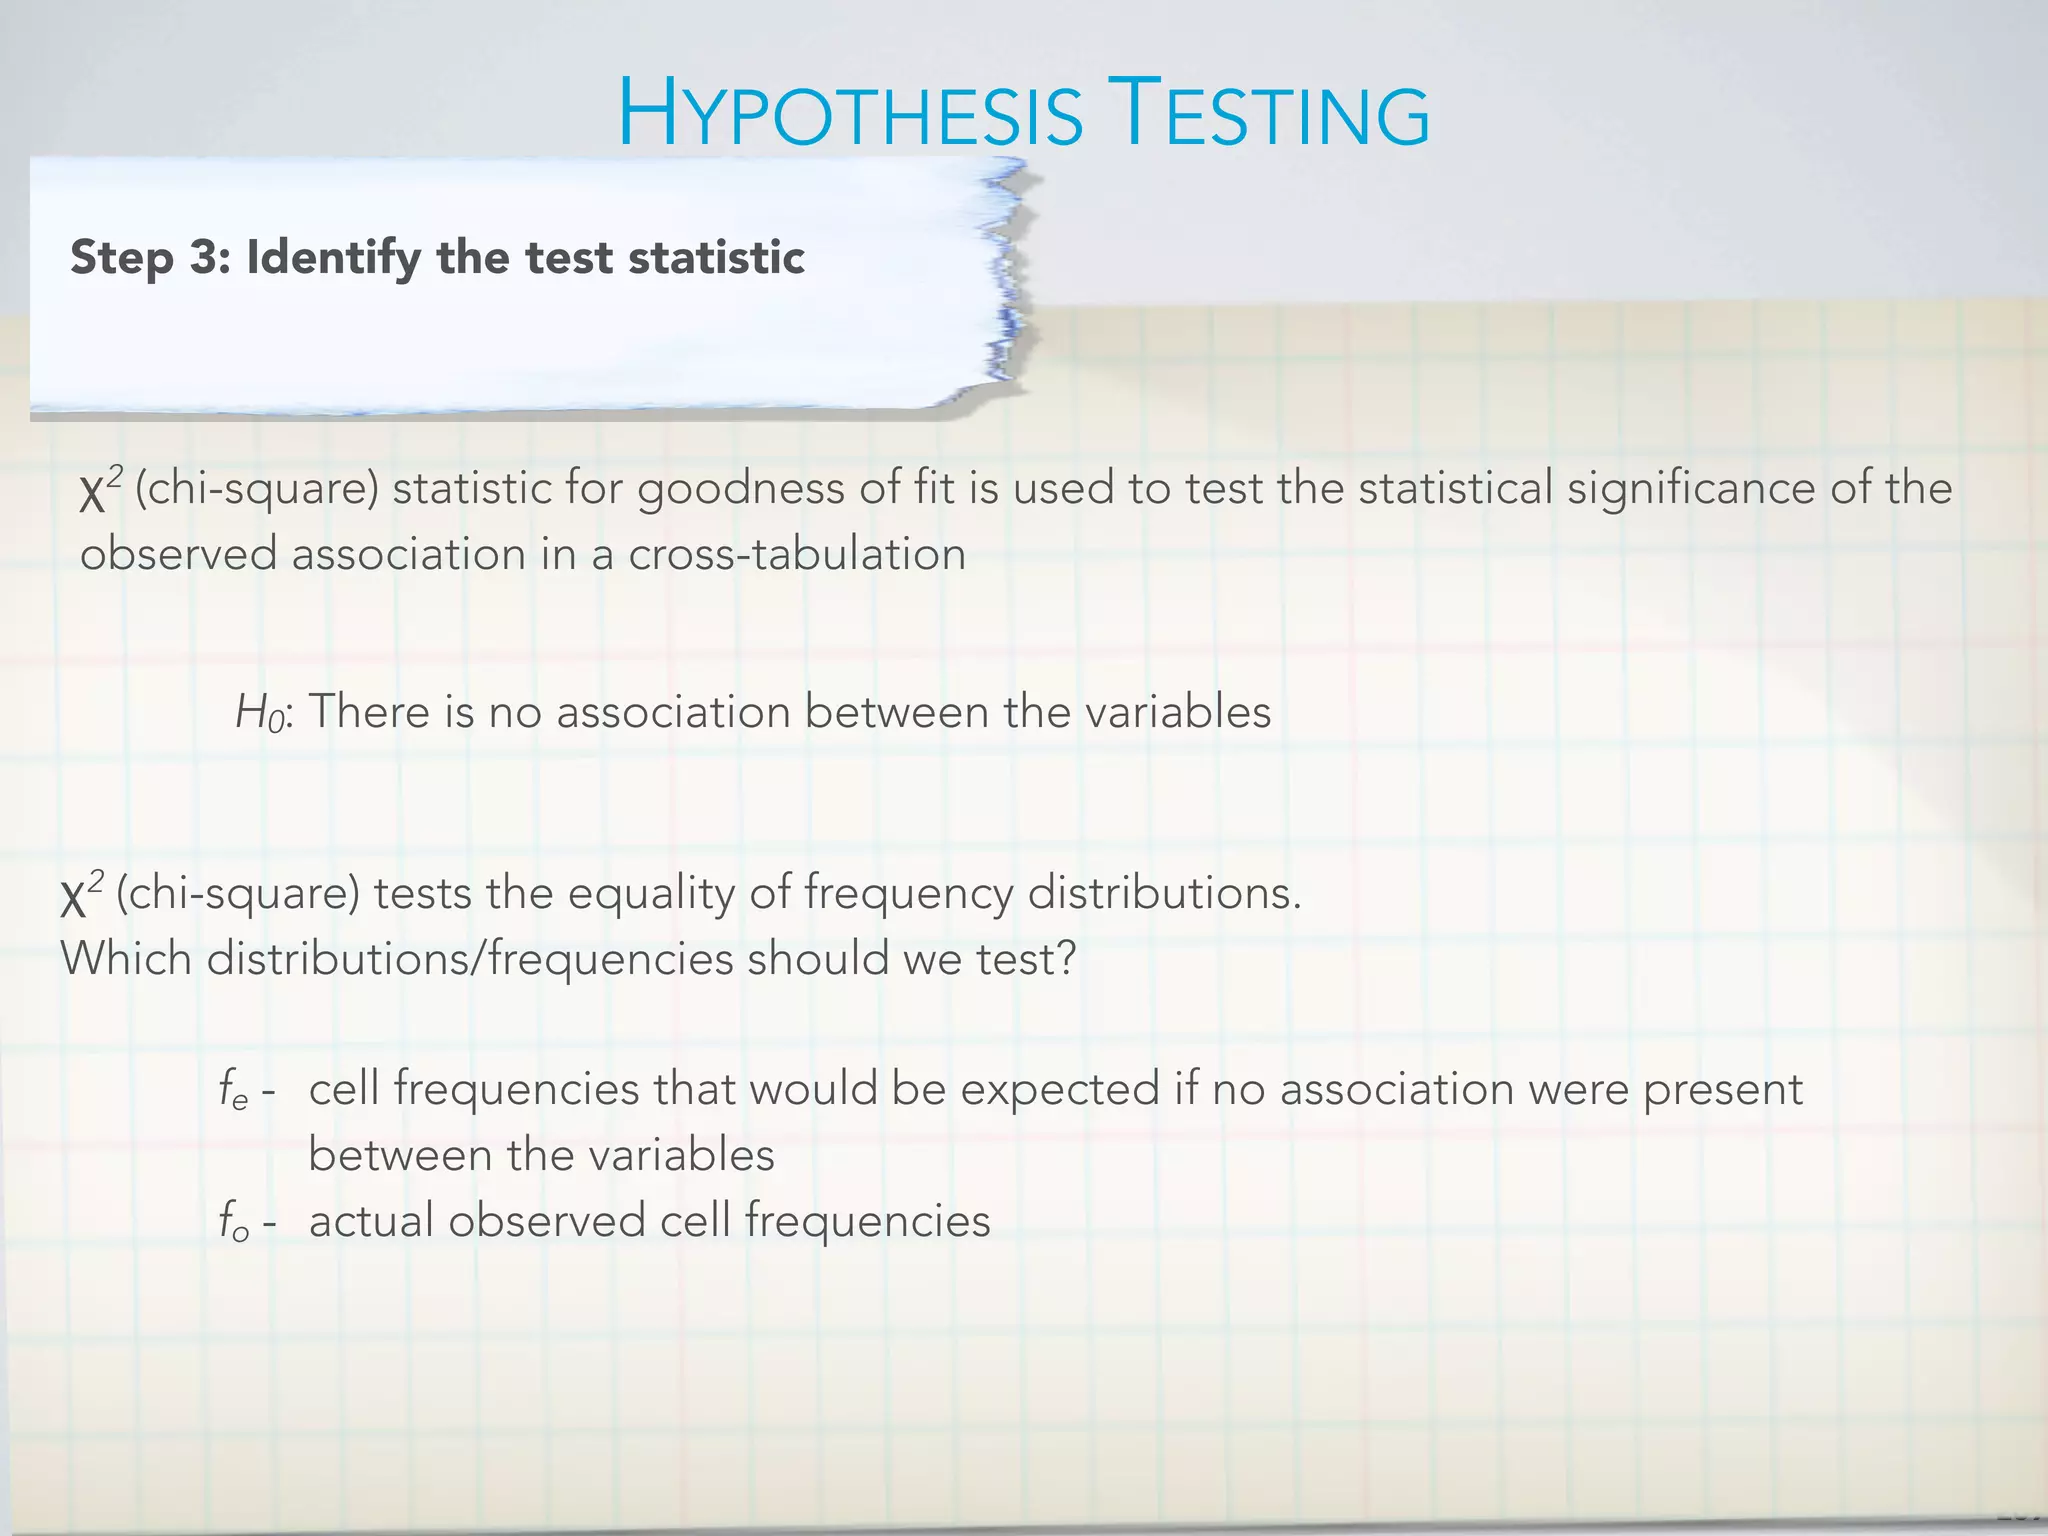
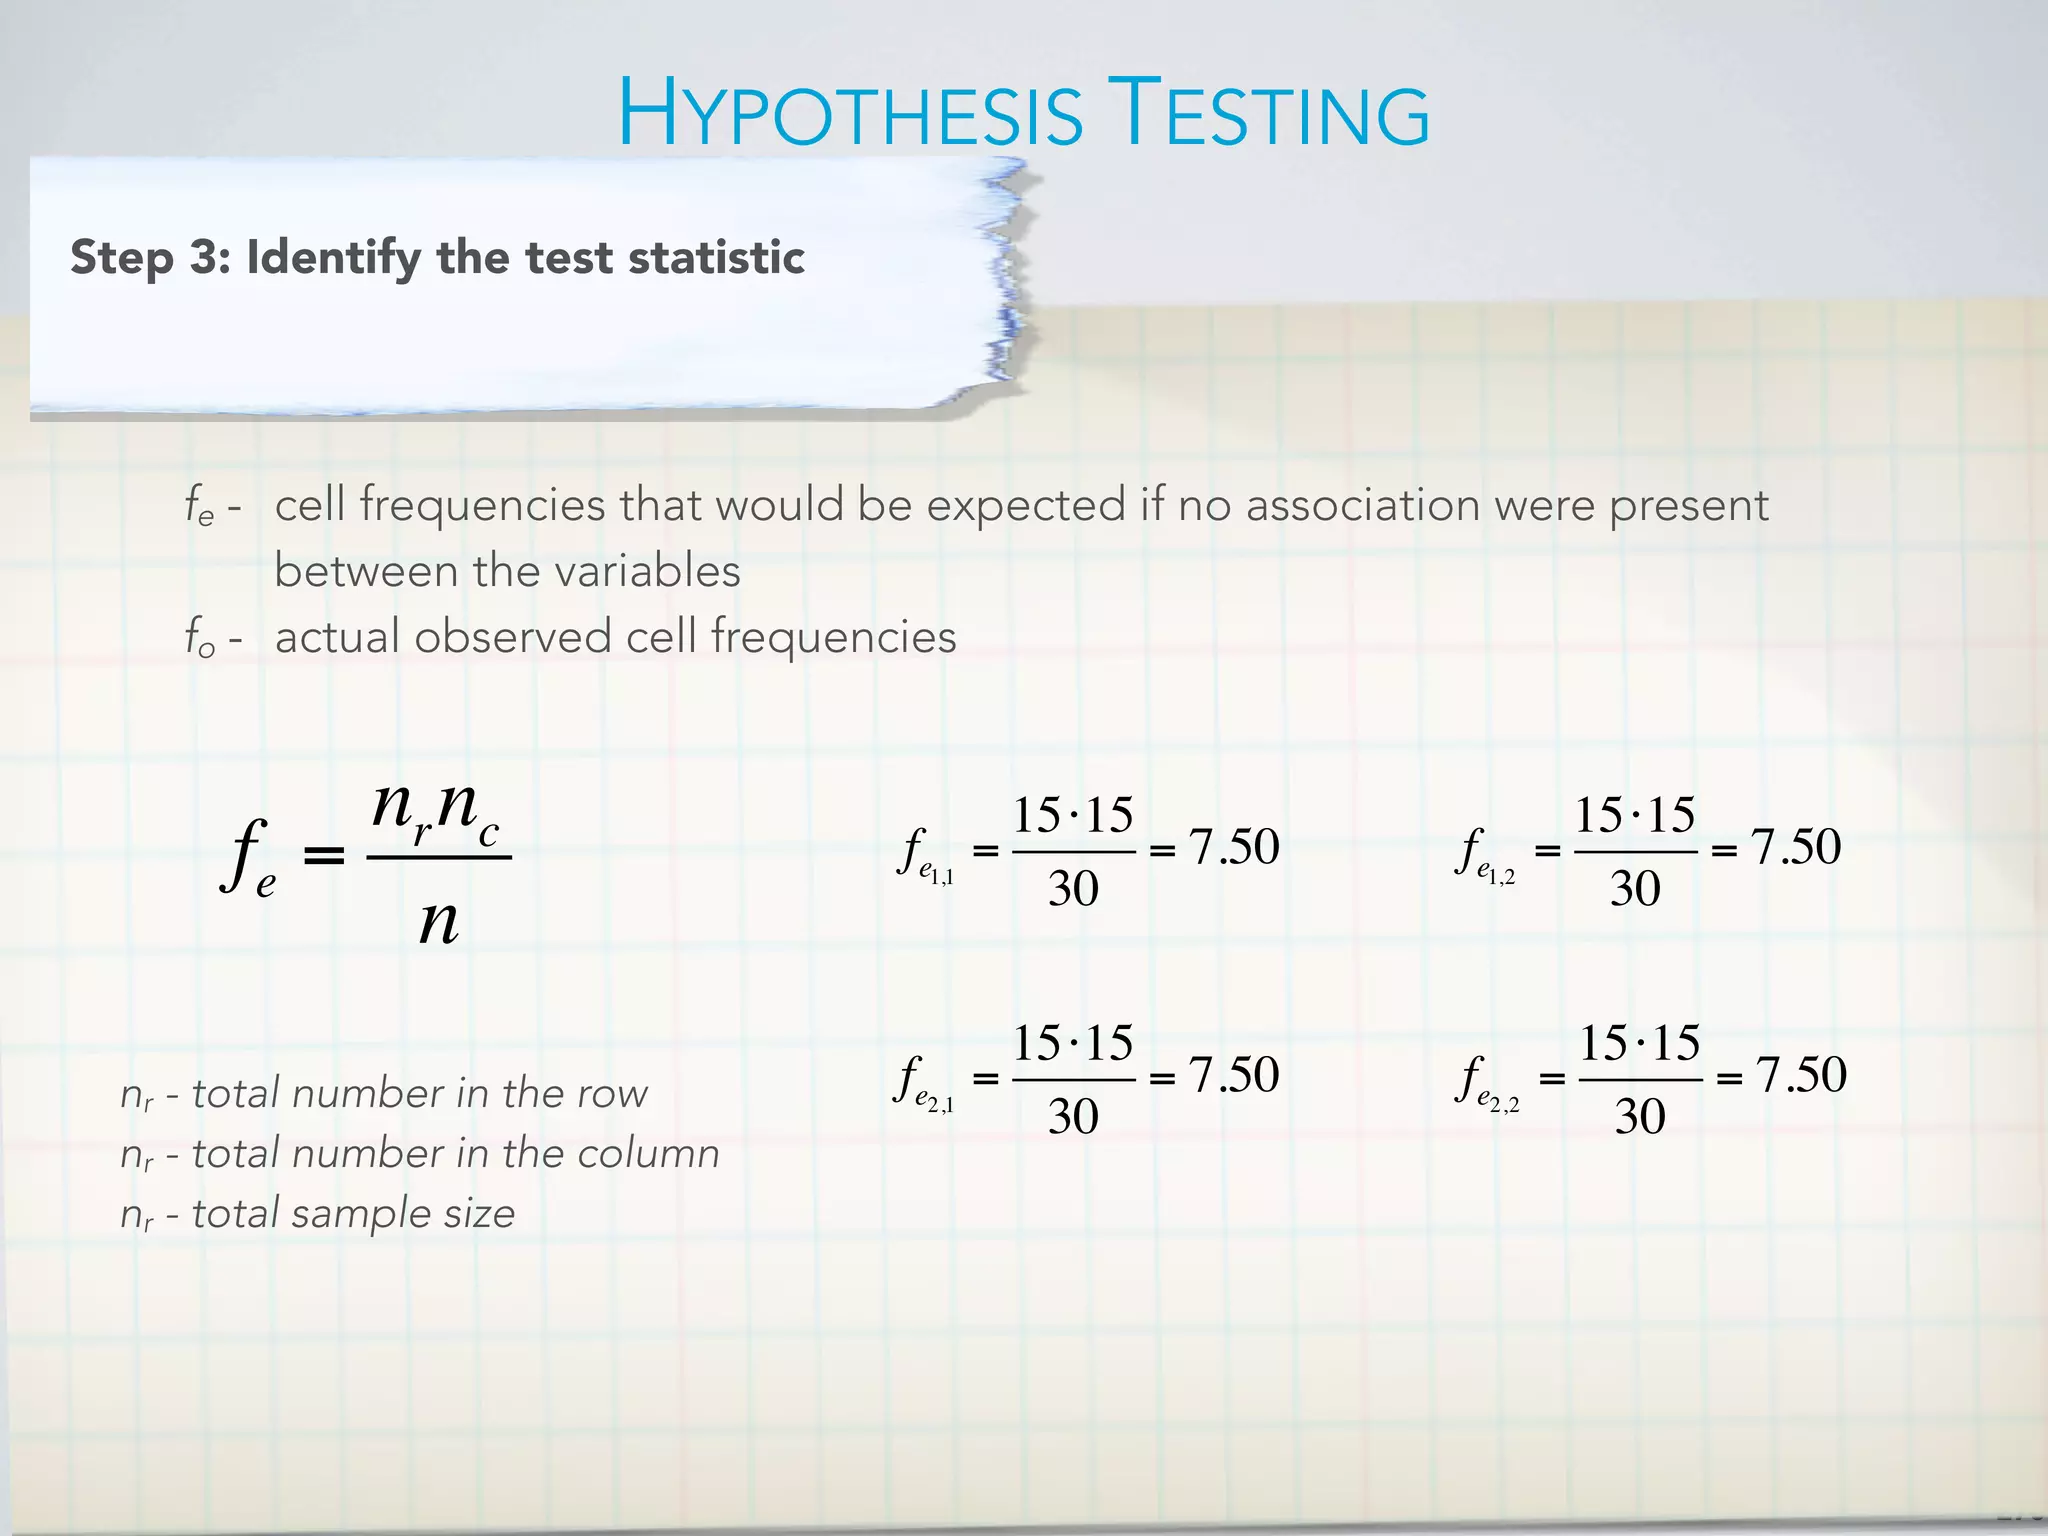
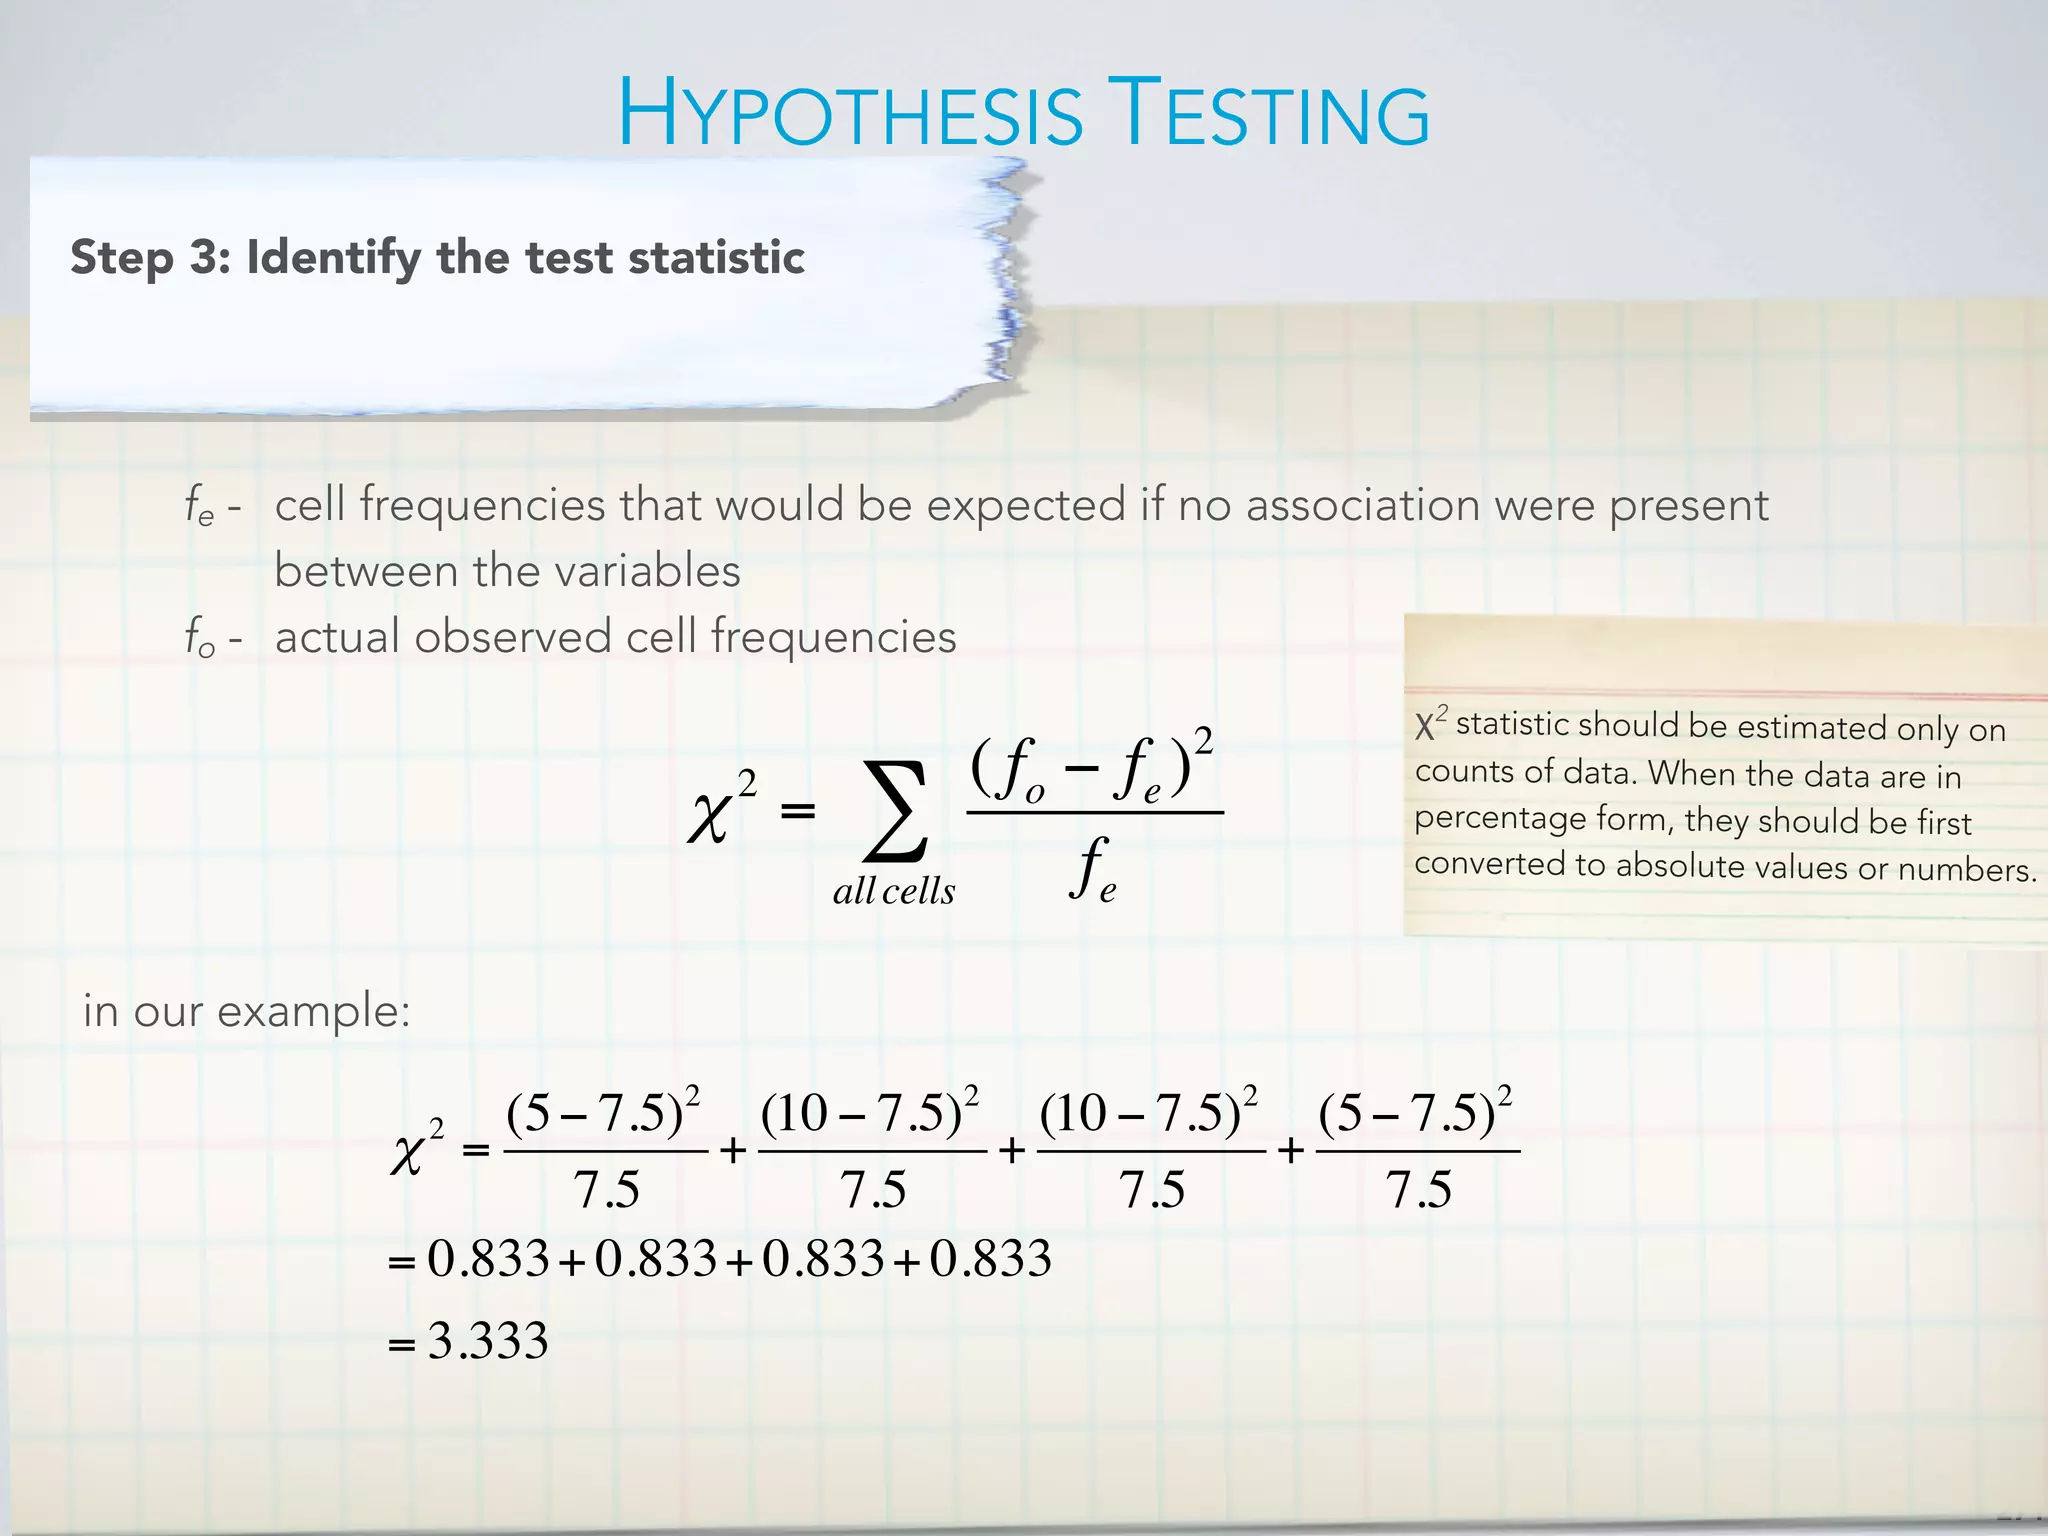
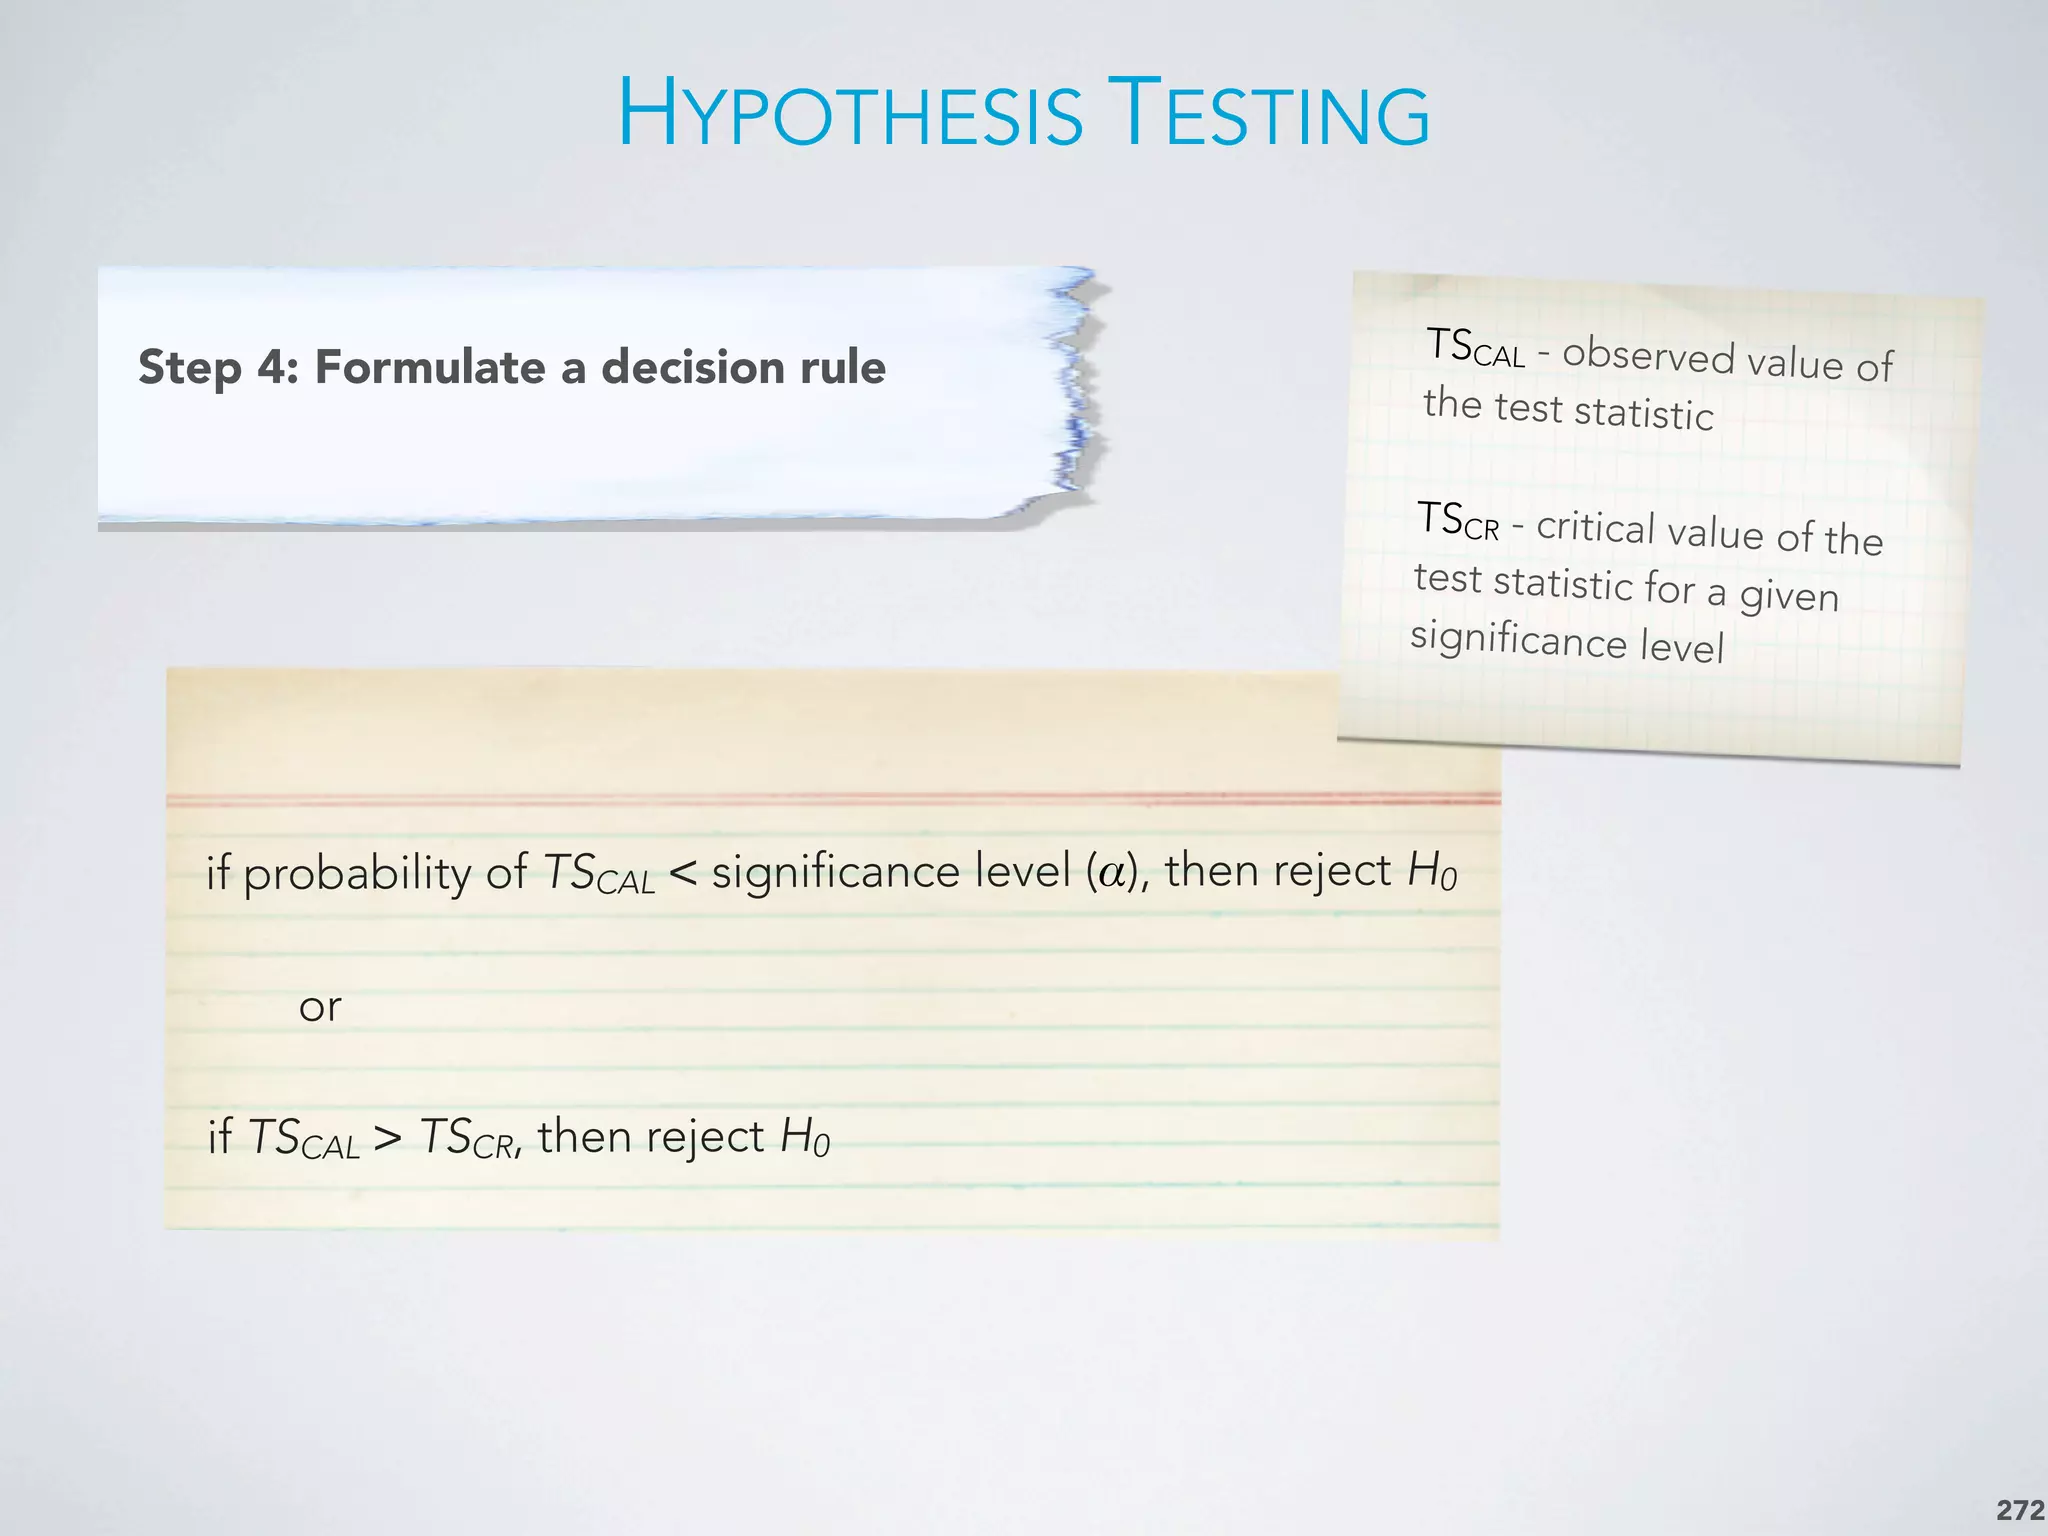
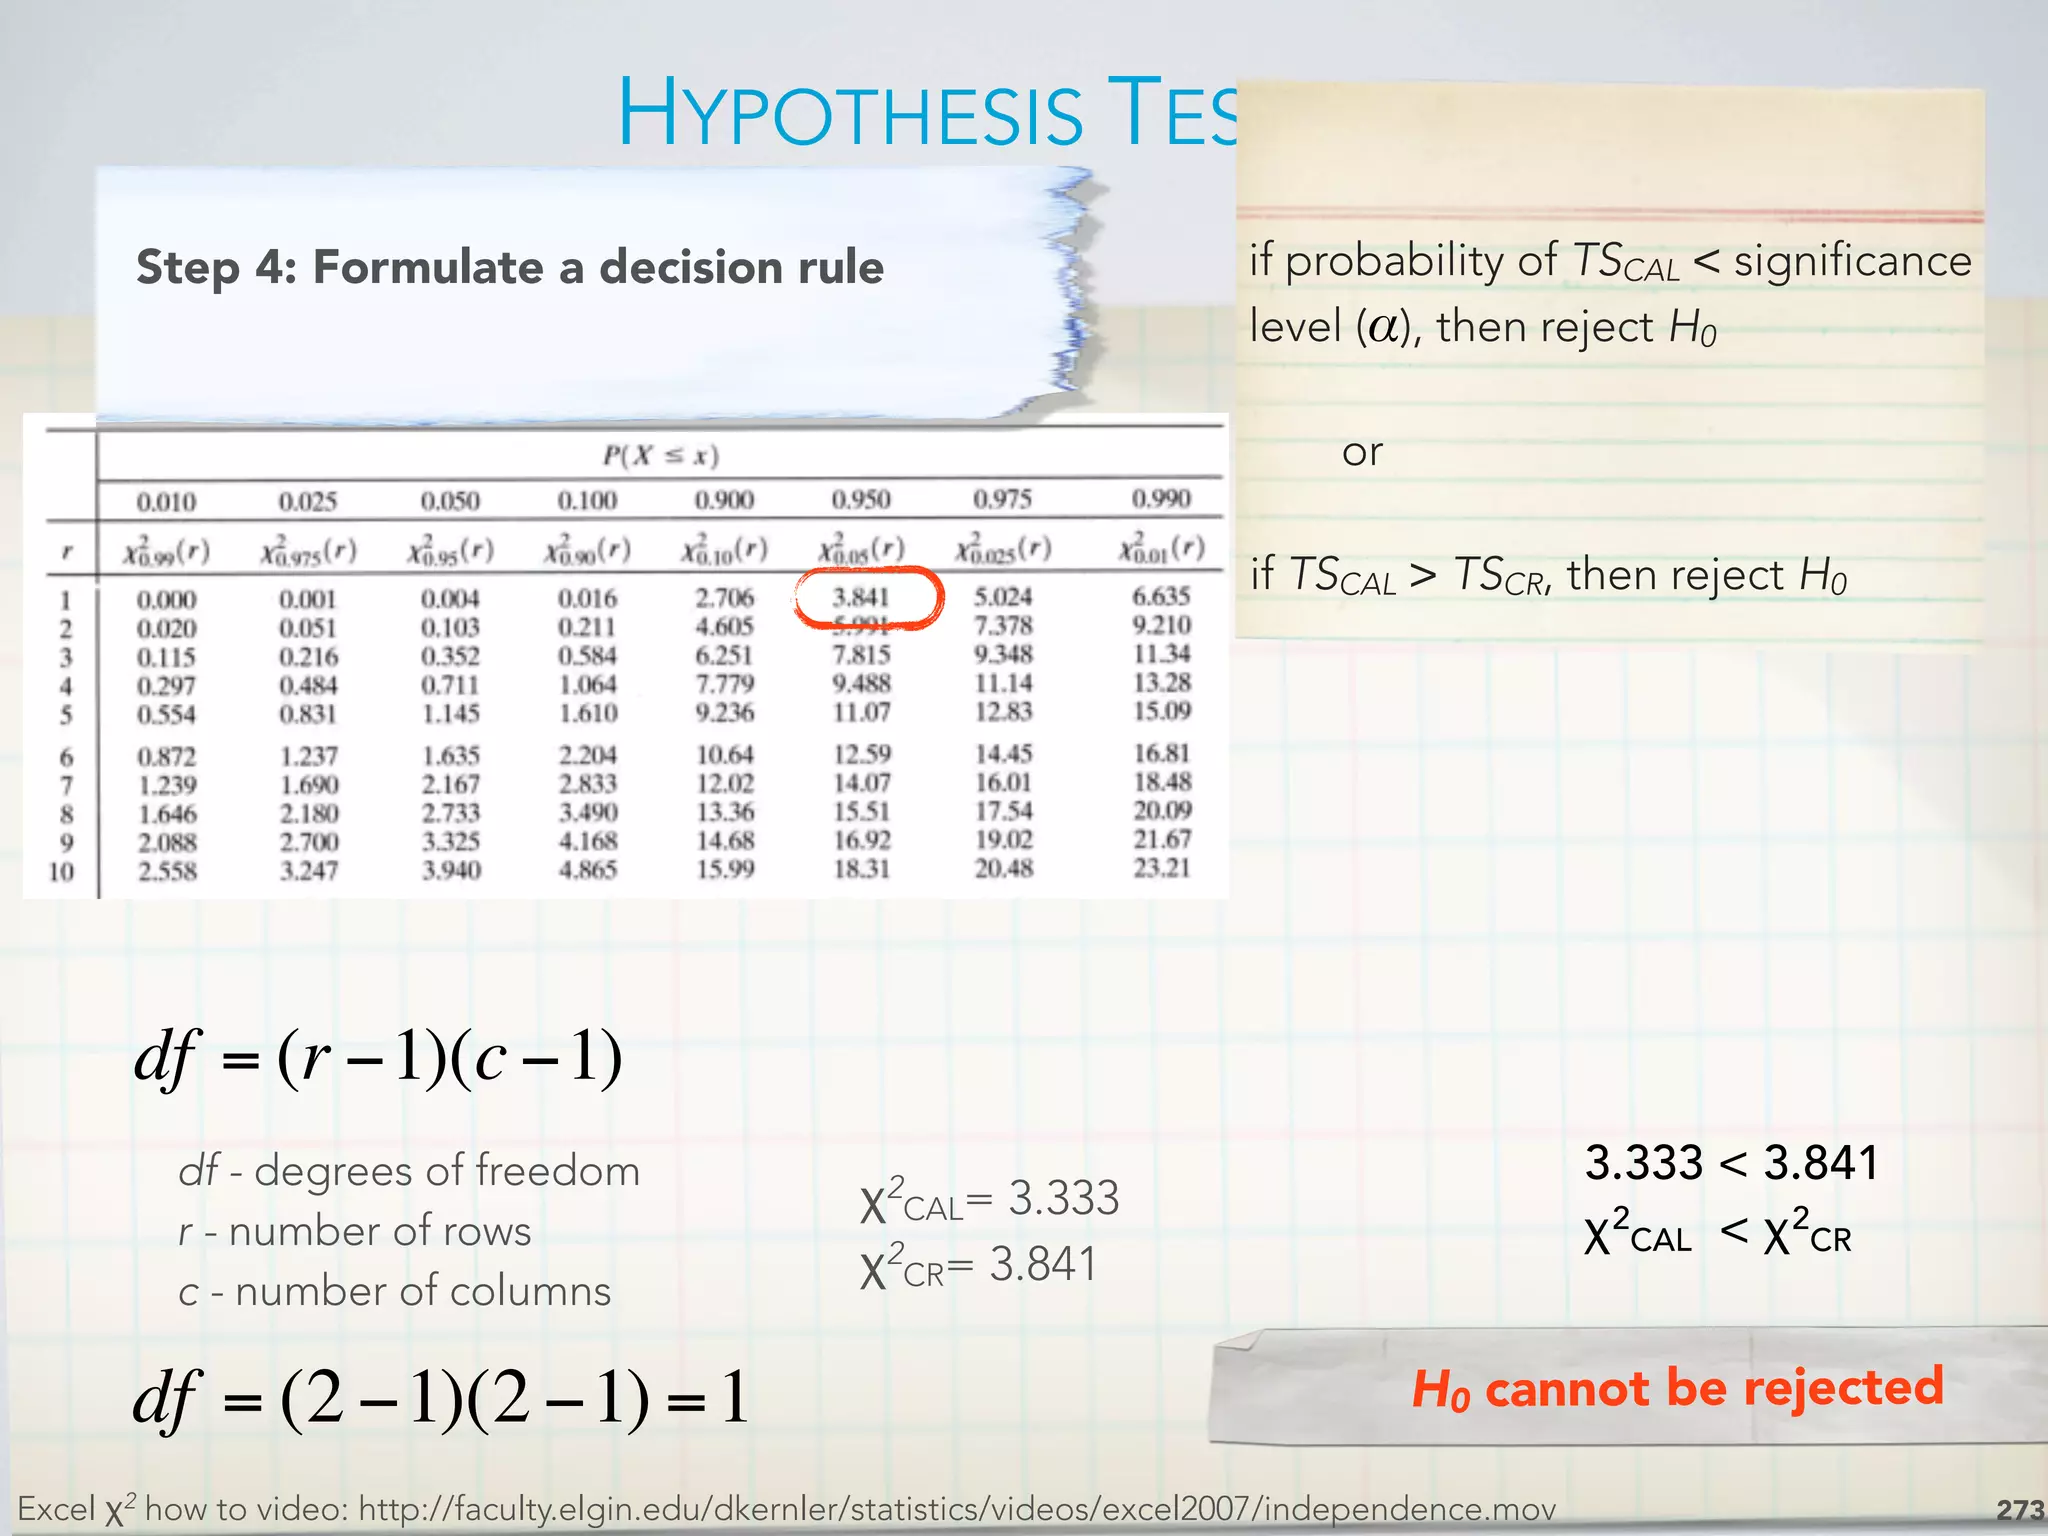
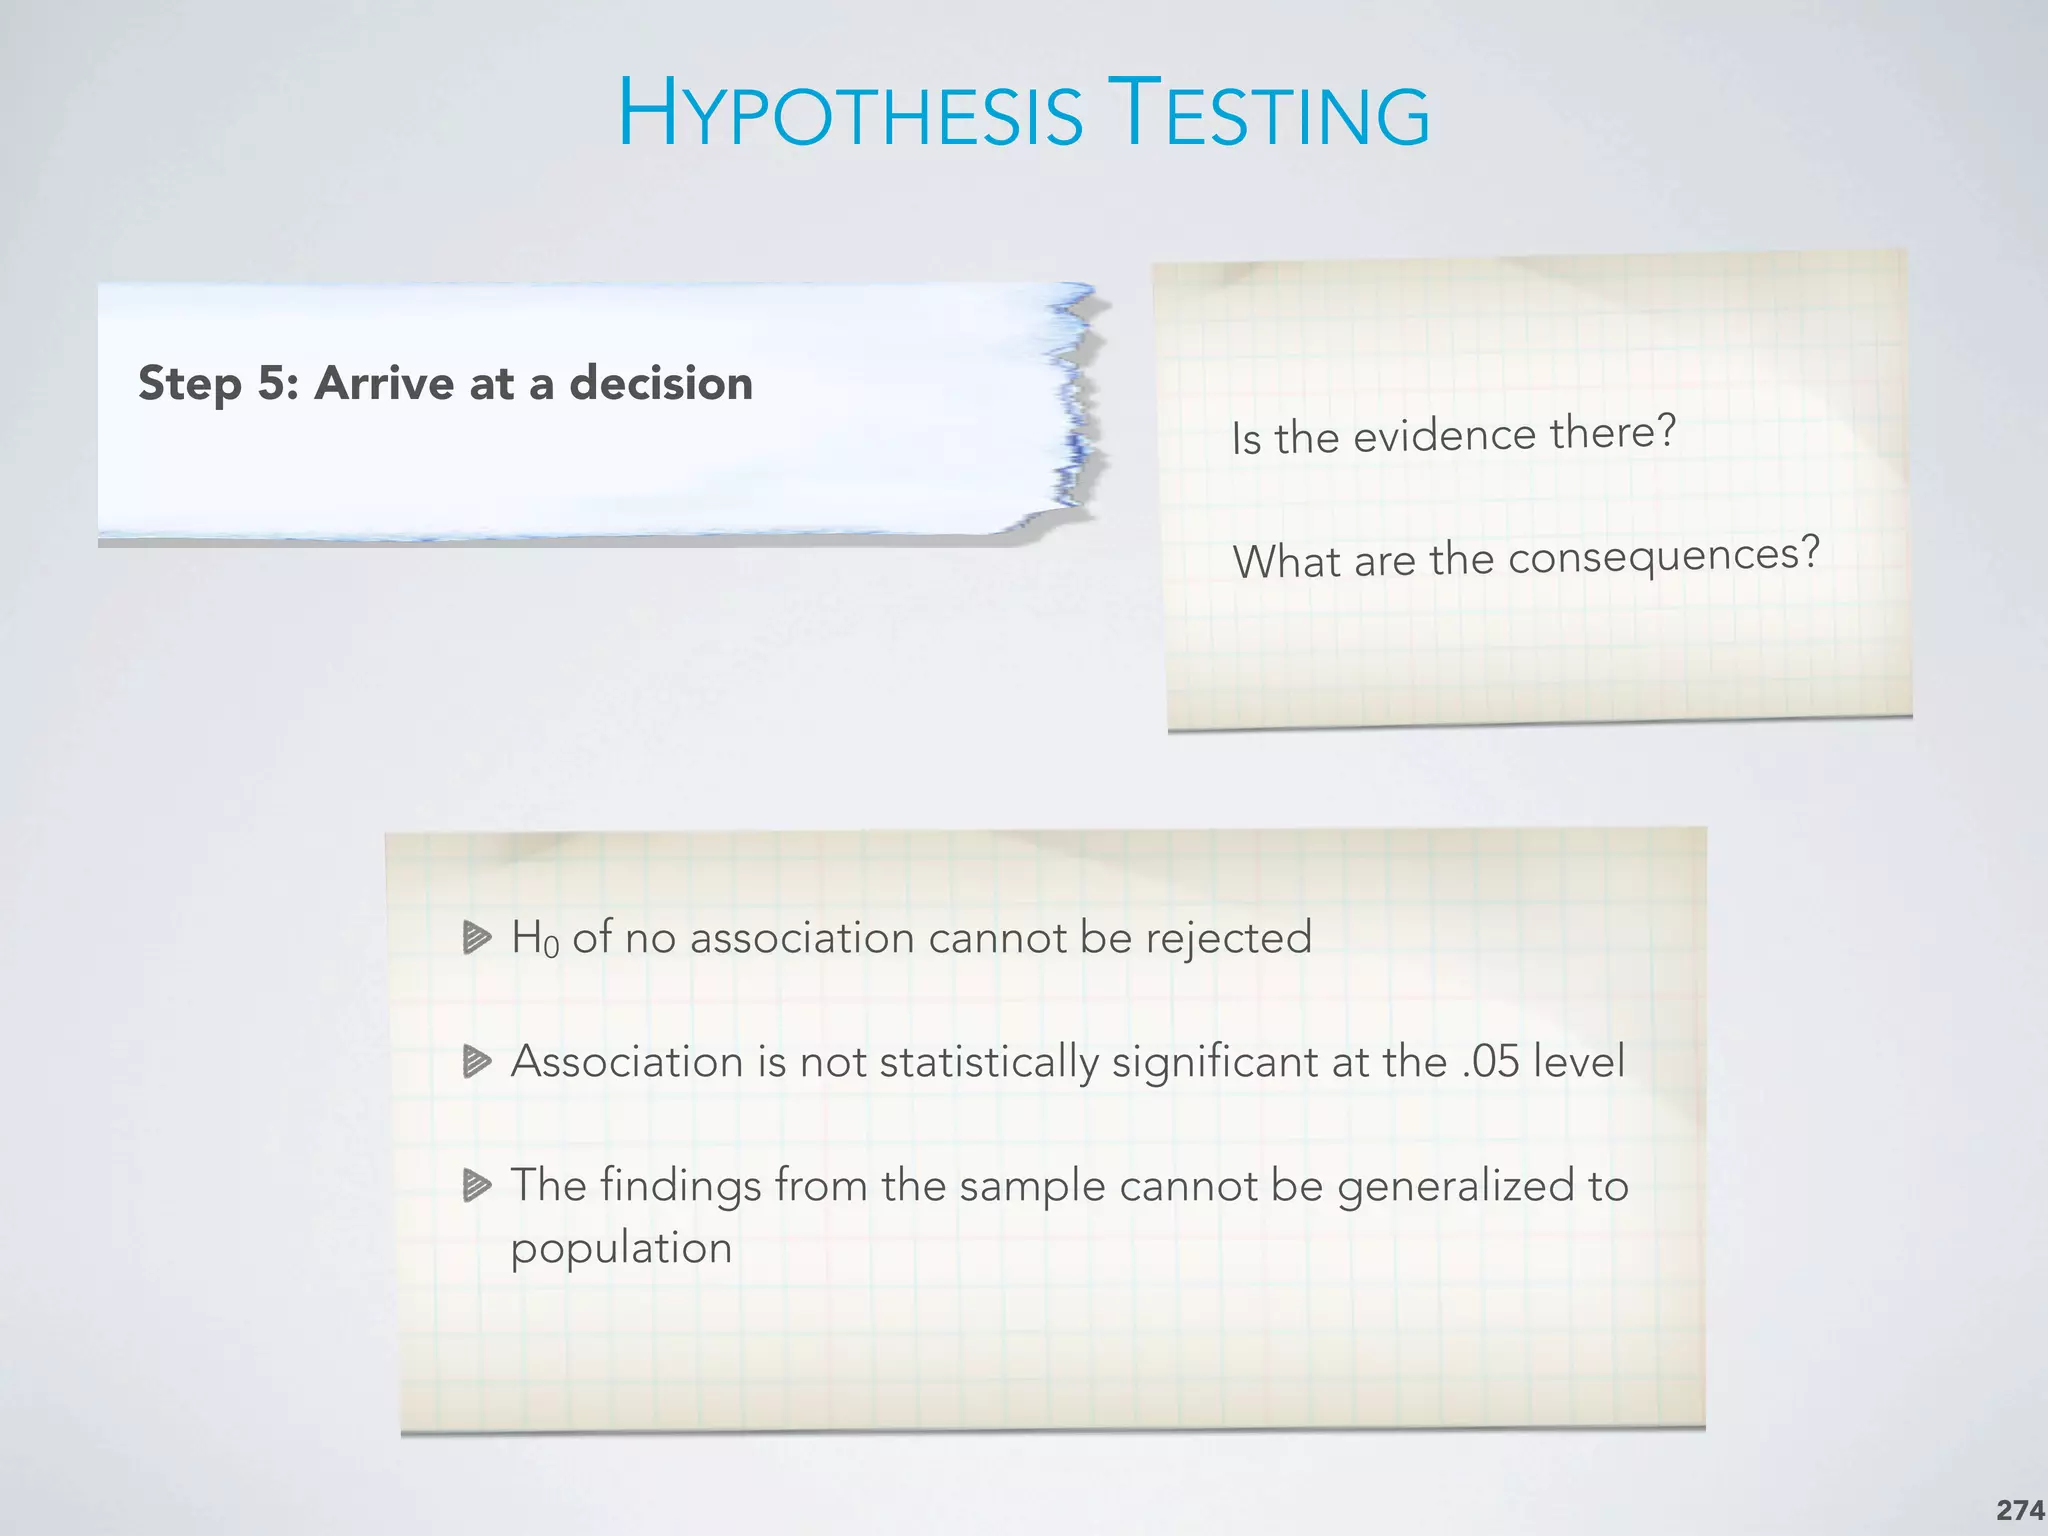
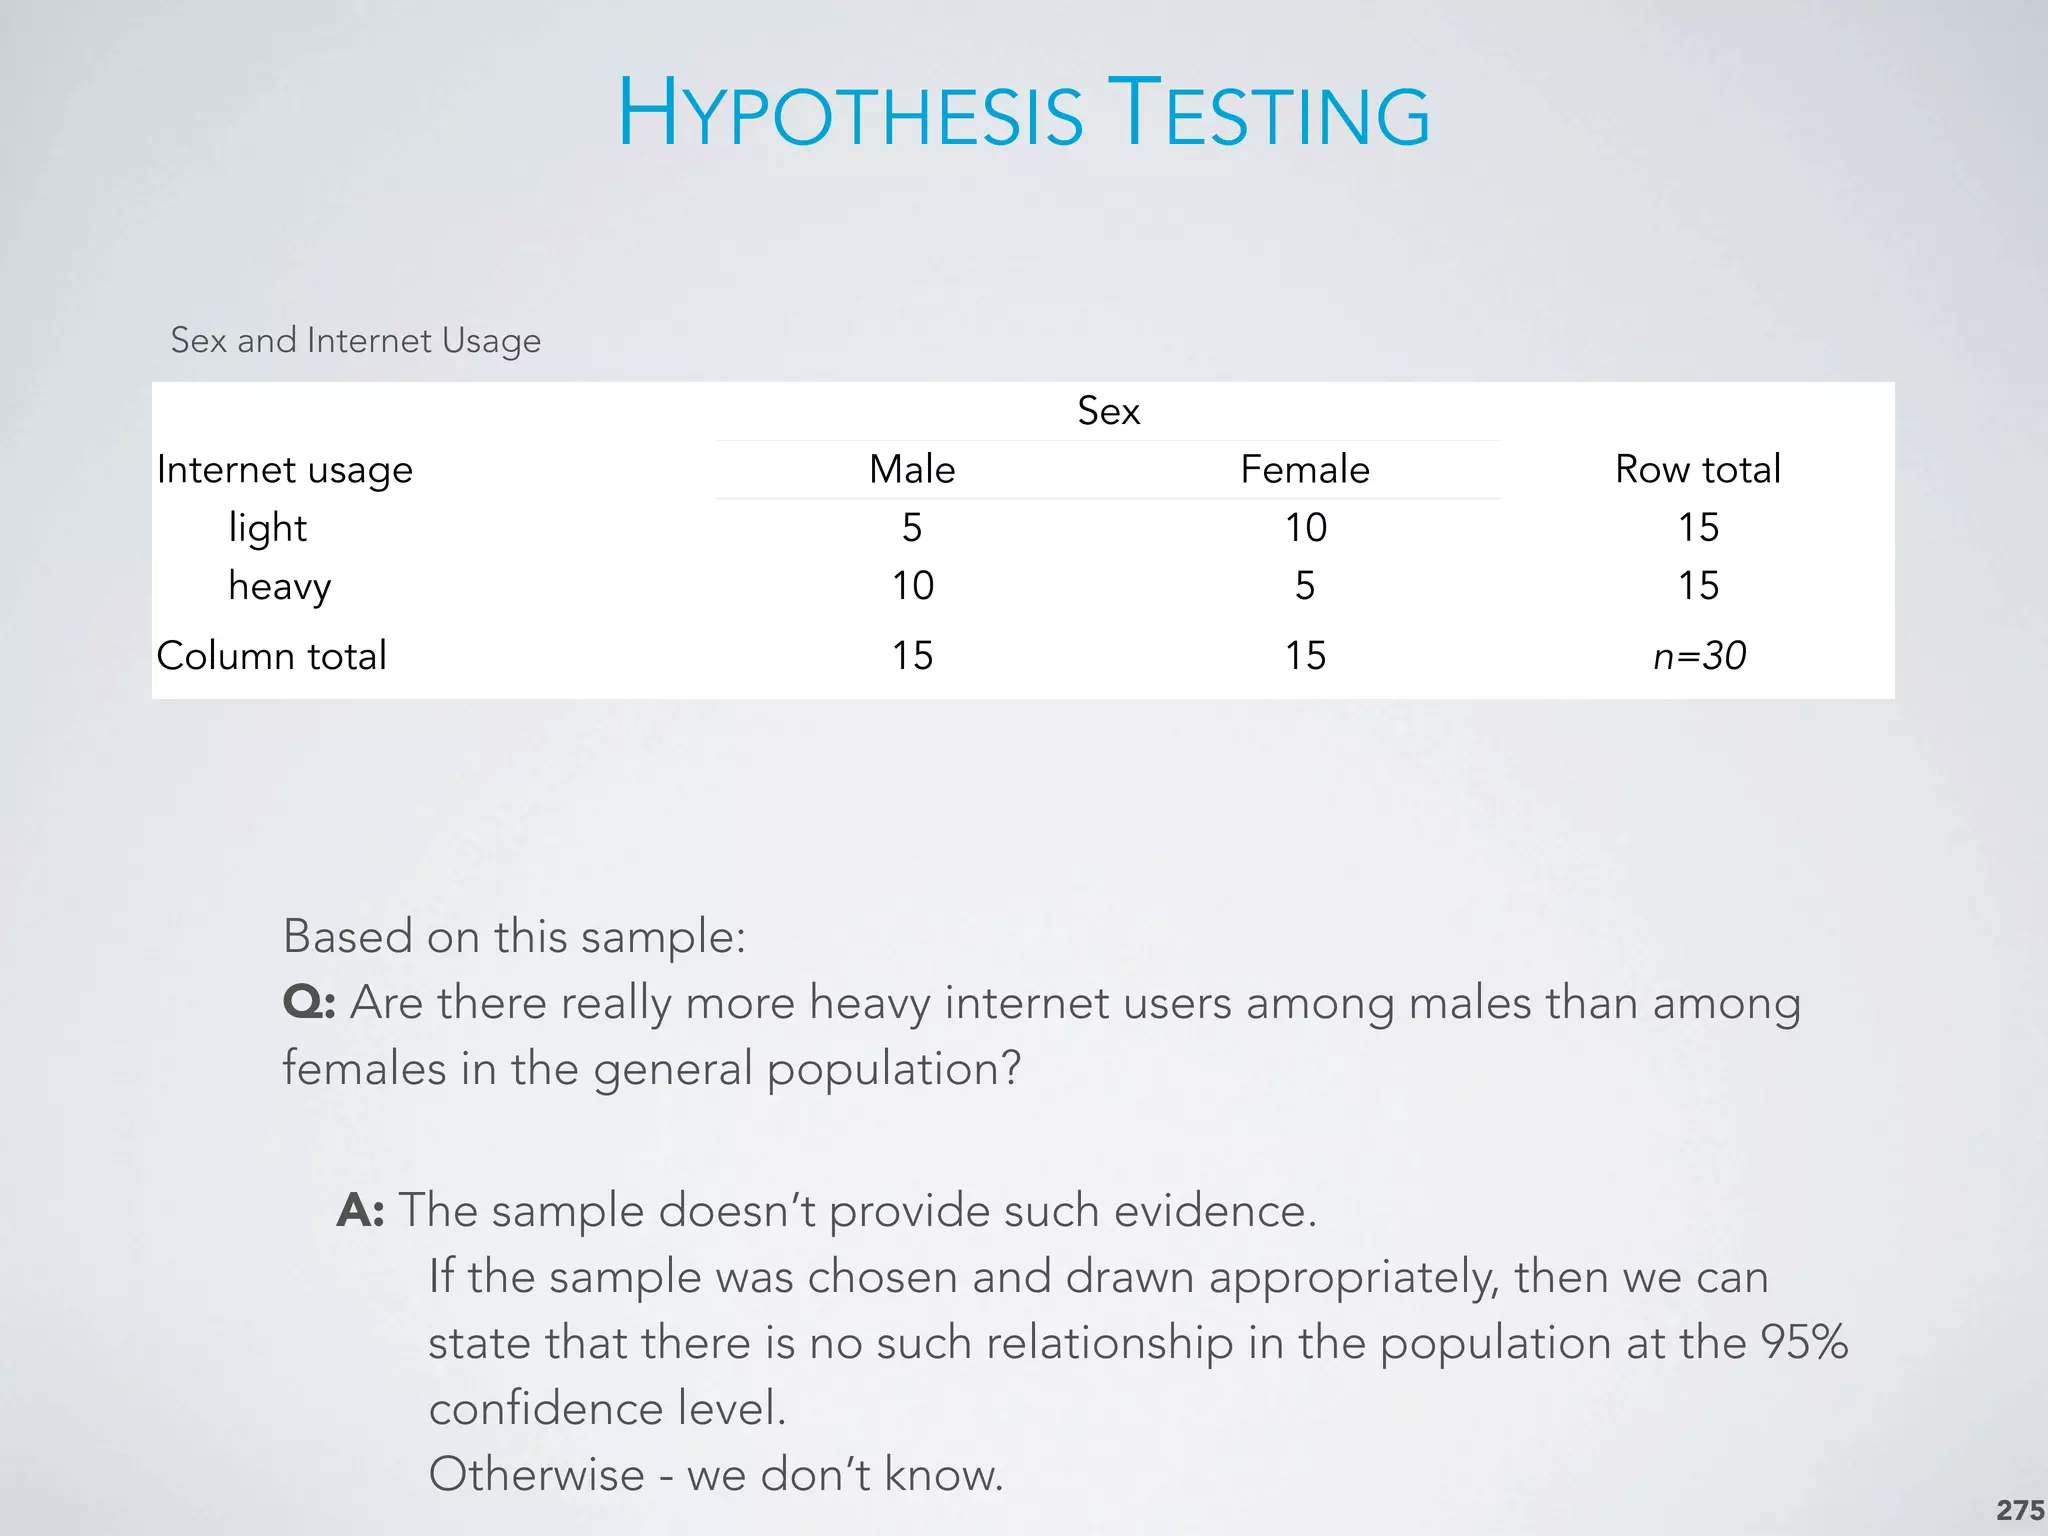
A step-by-step approach to hypothesis testing in marketing research, including significance levels and decision rules.
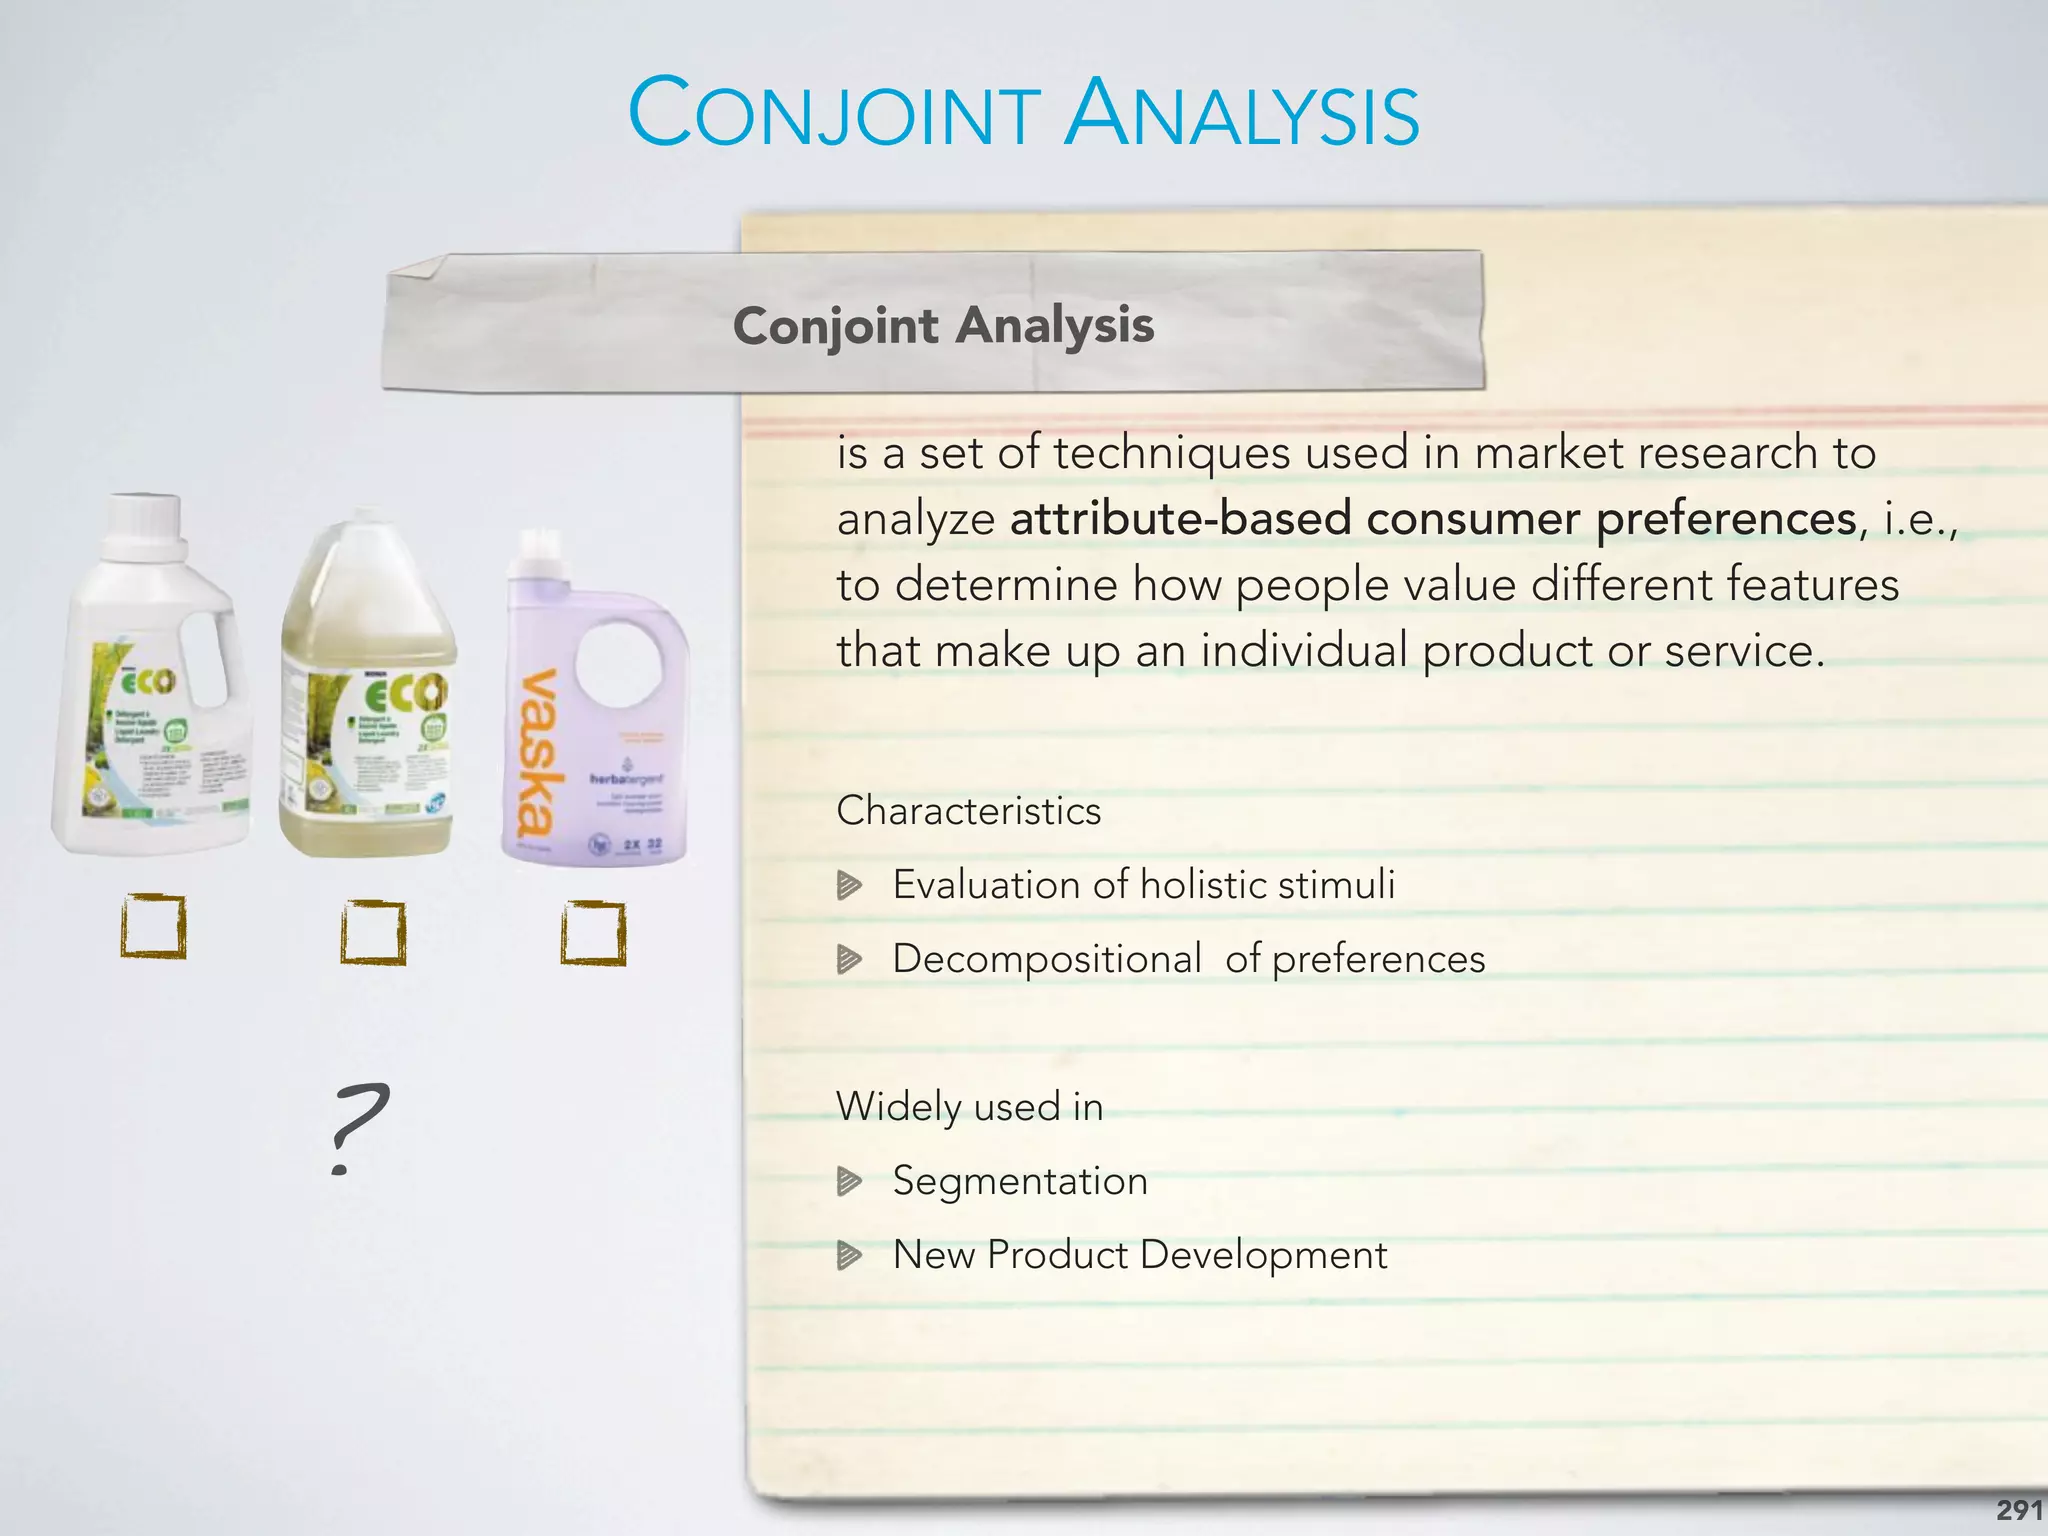
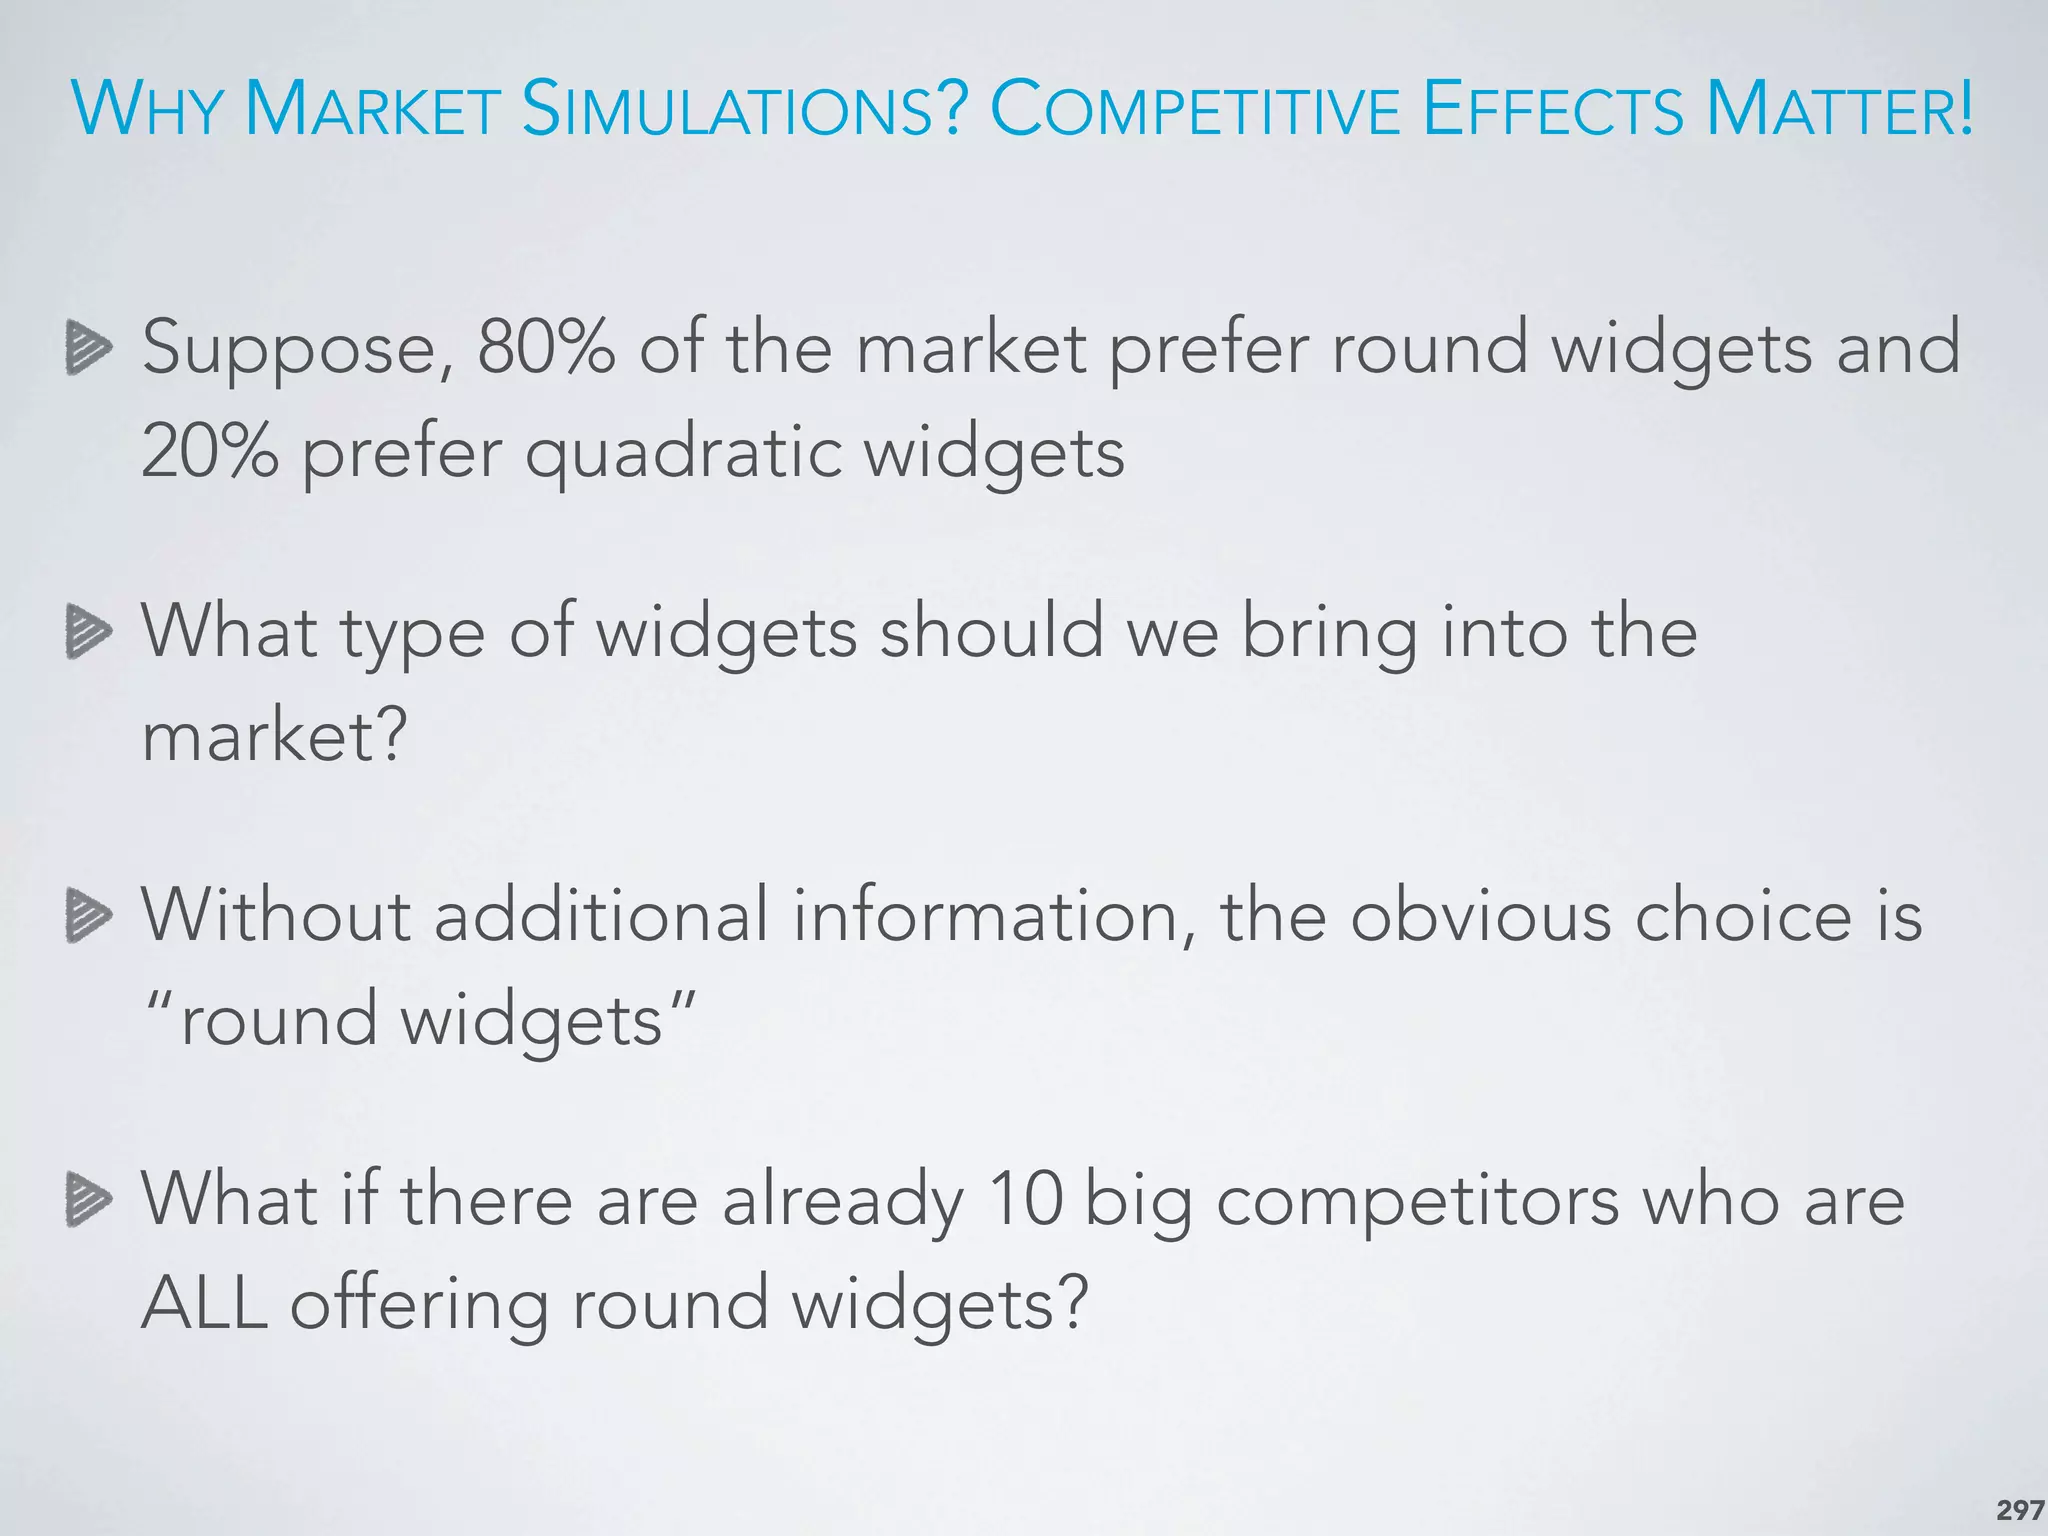
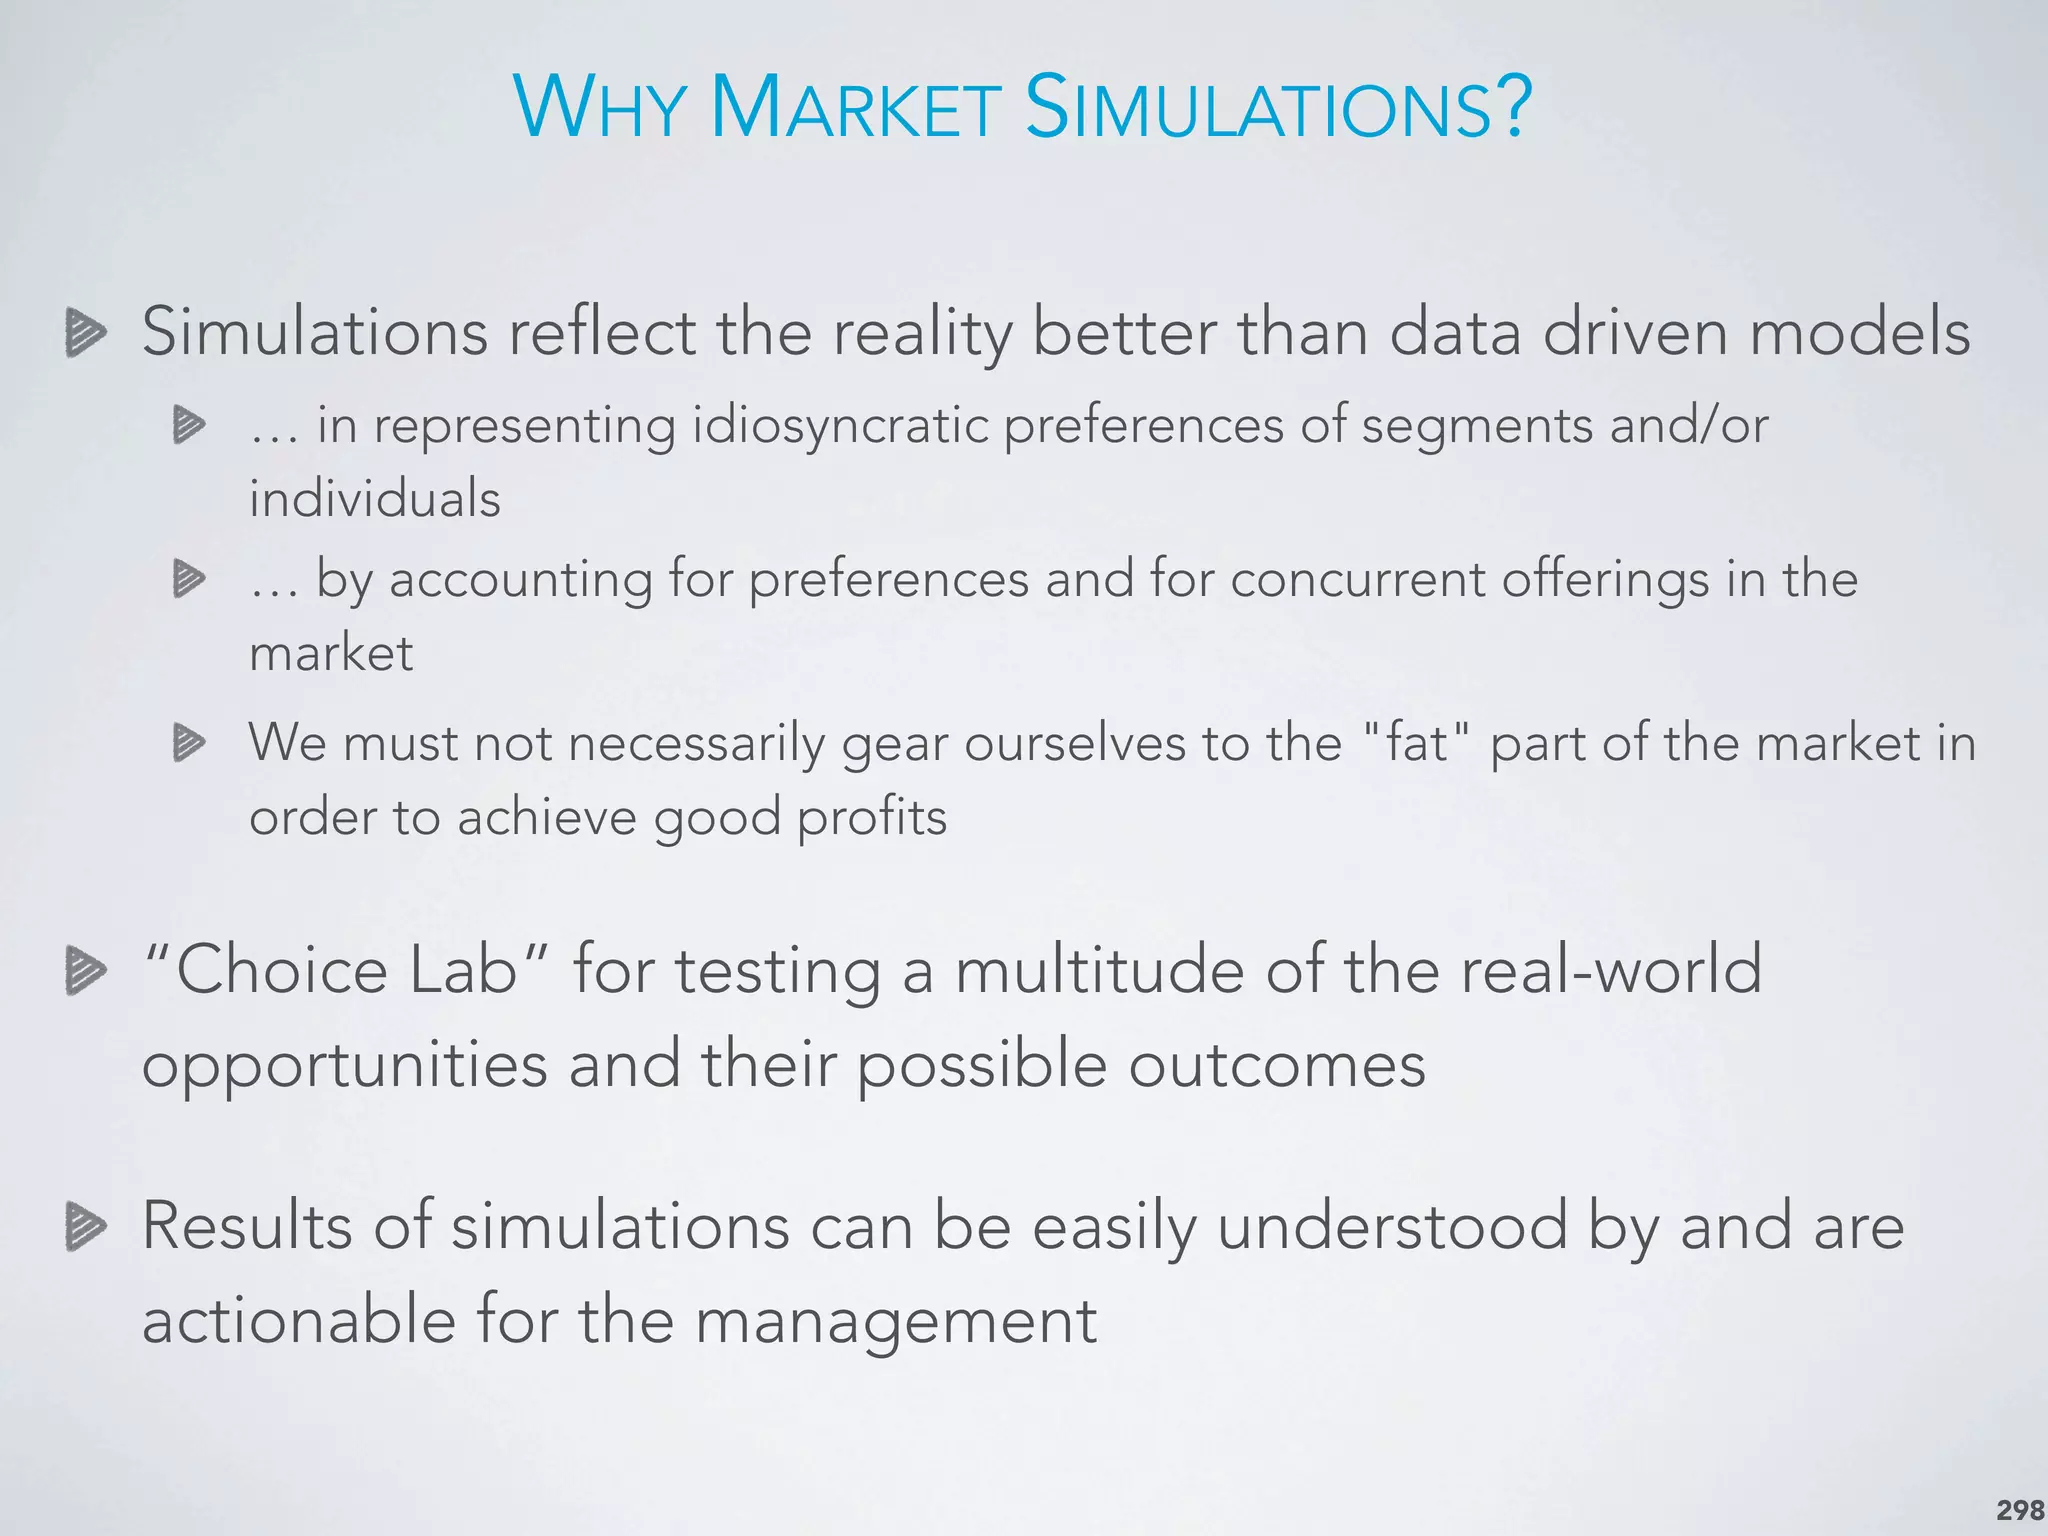
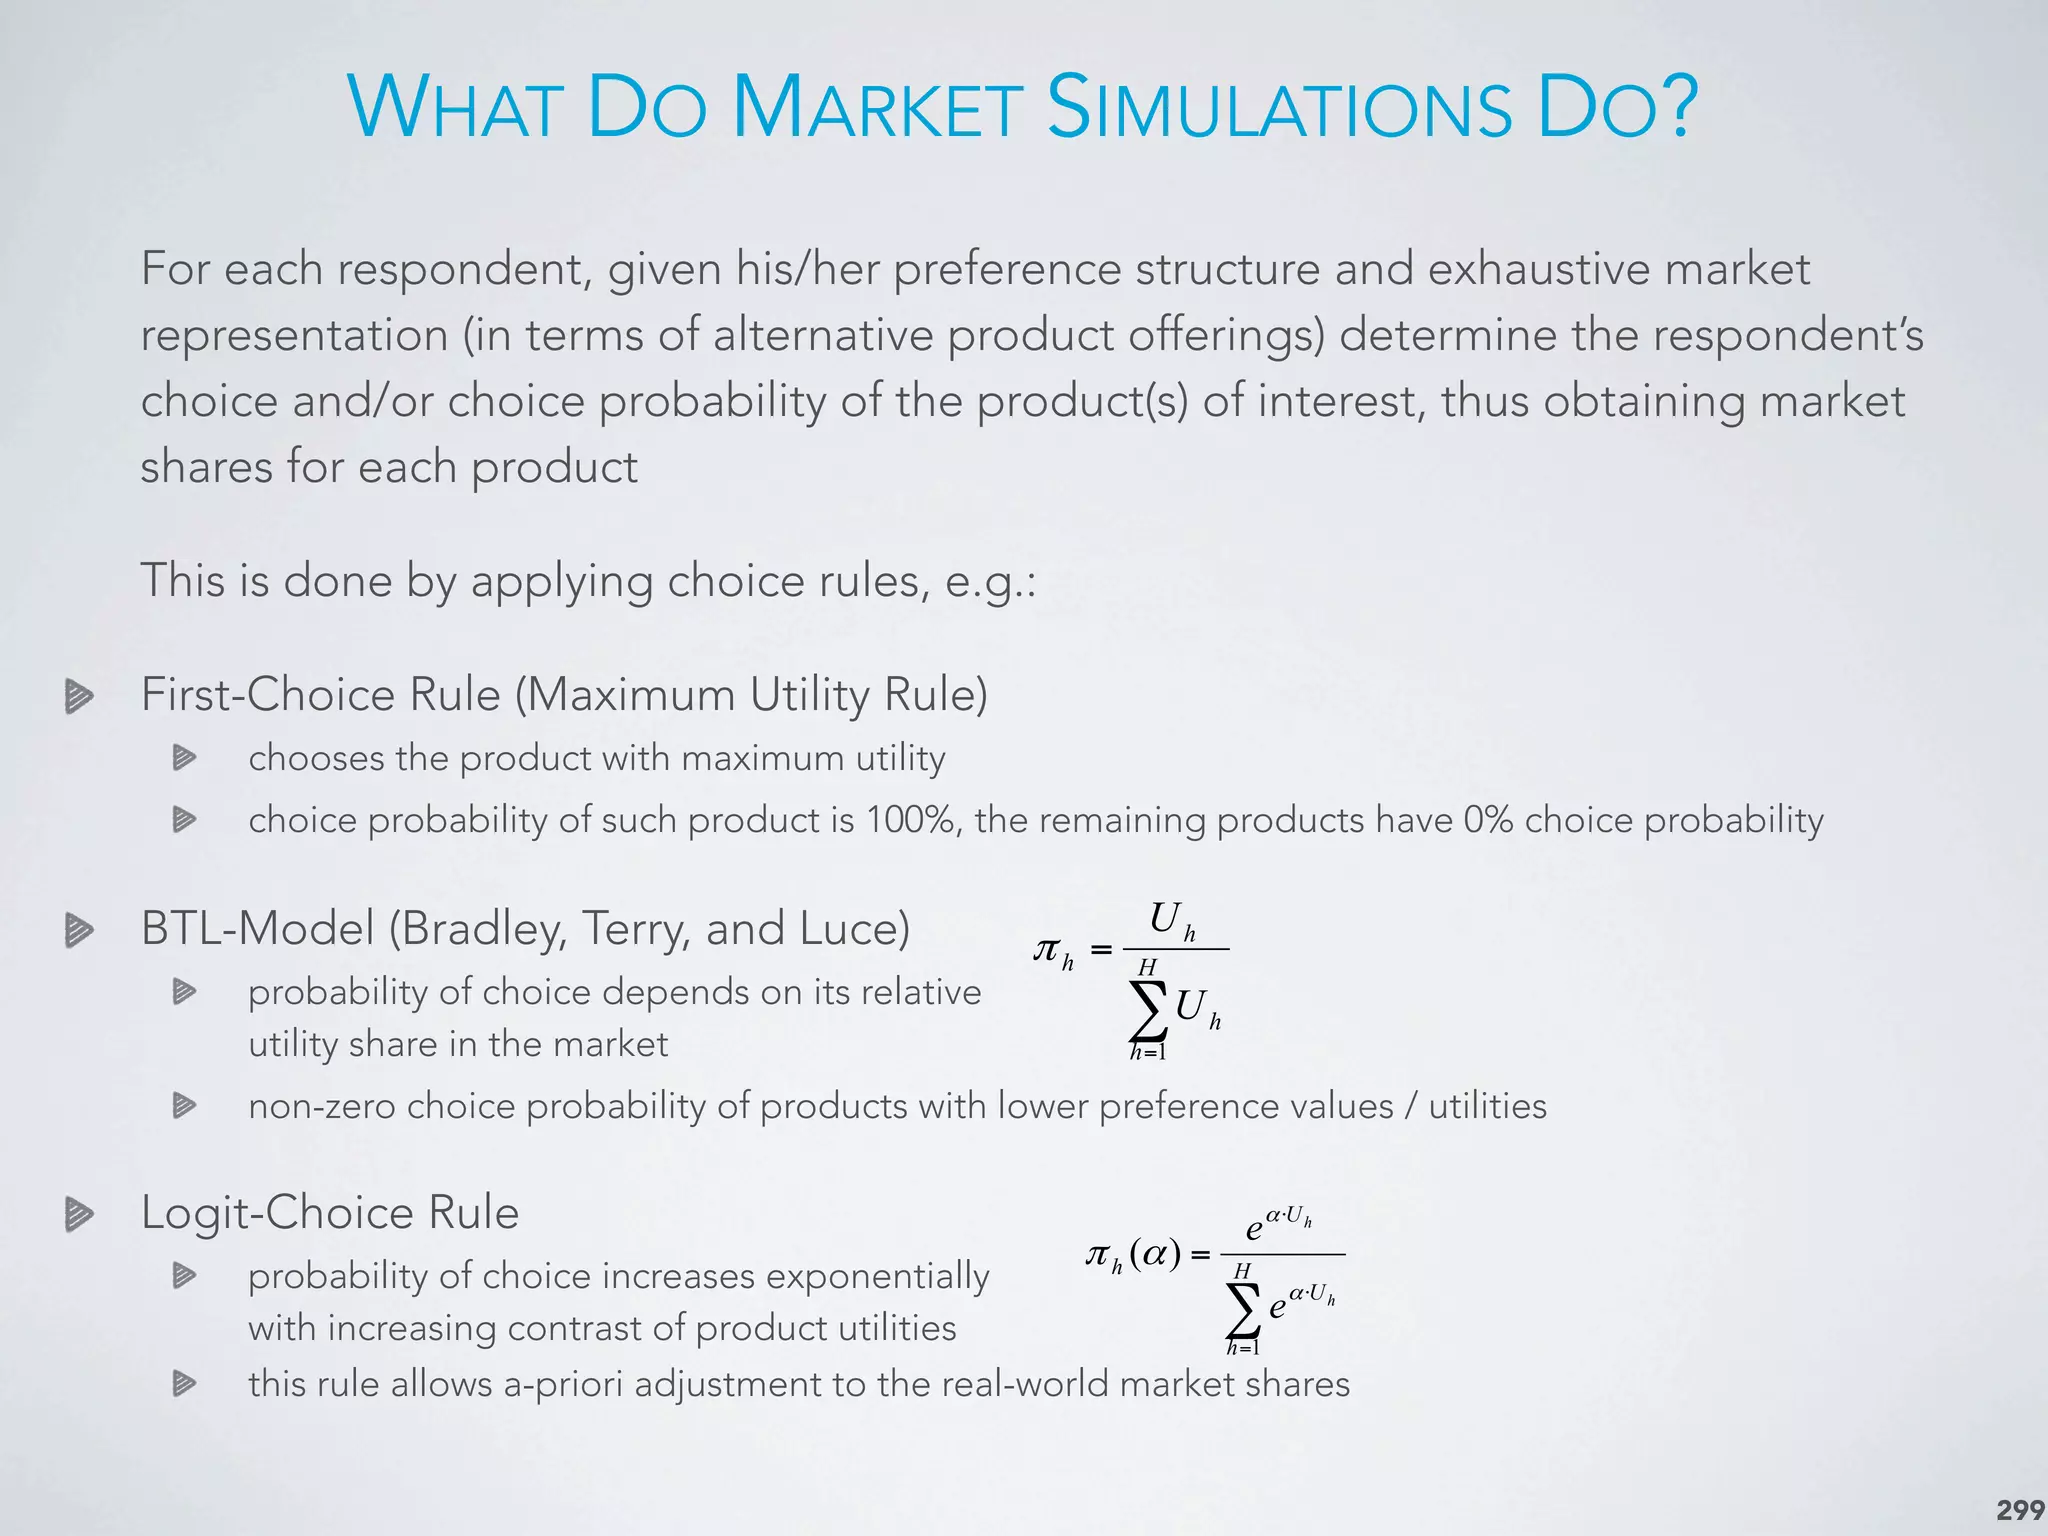
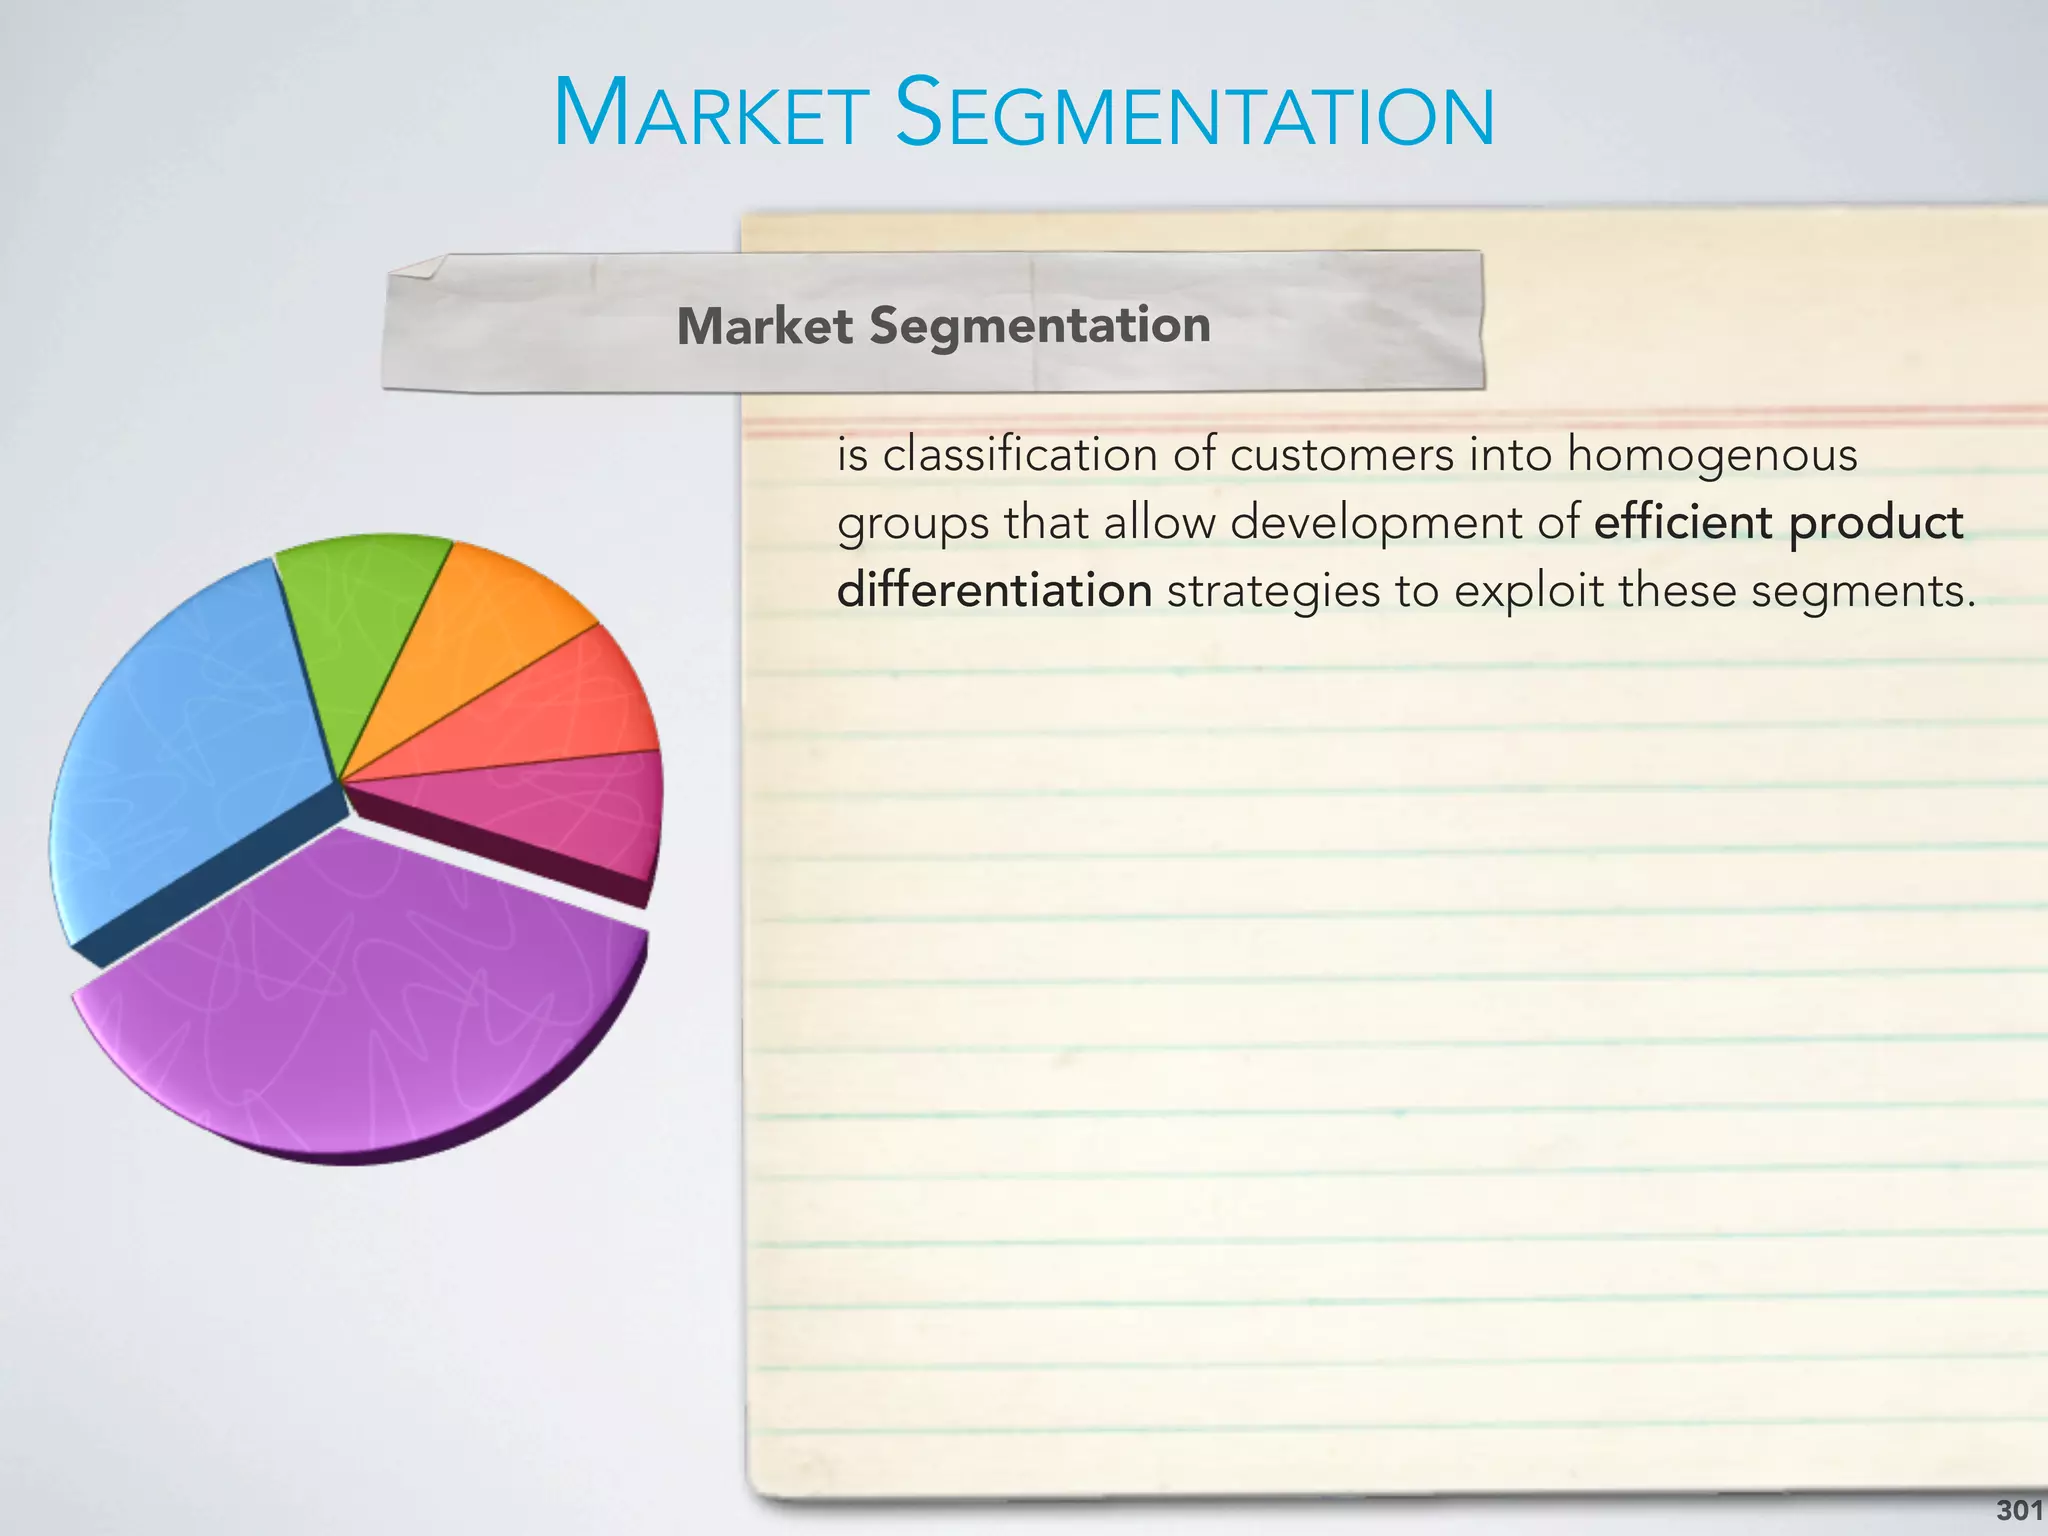
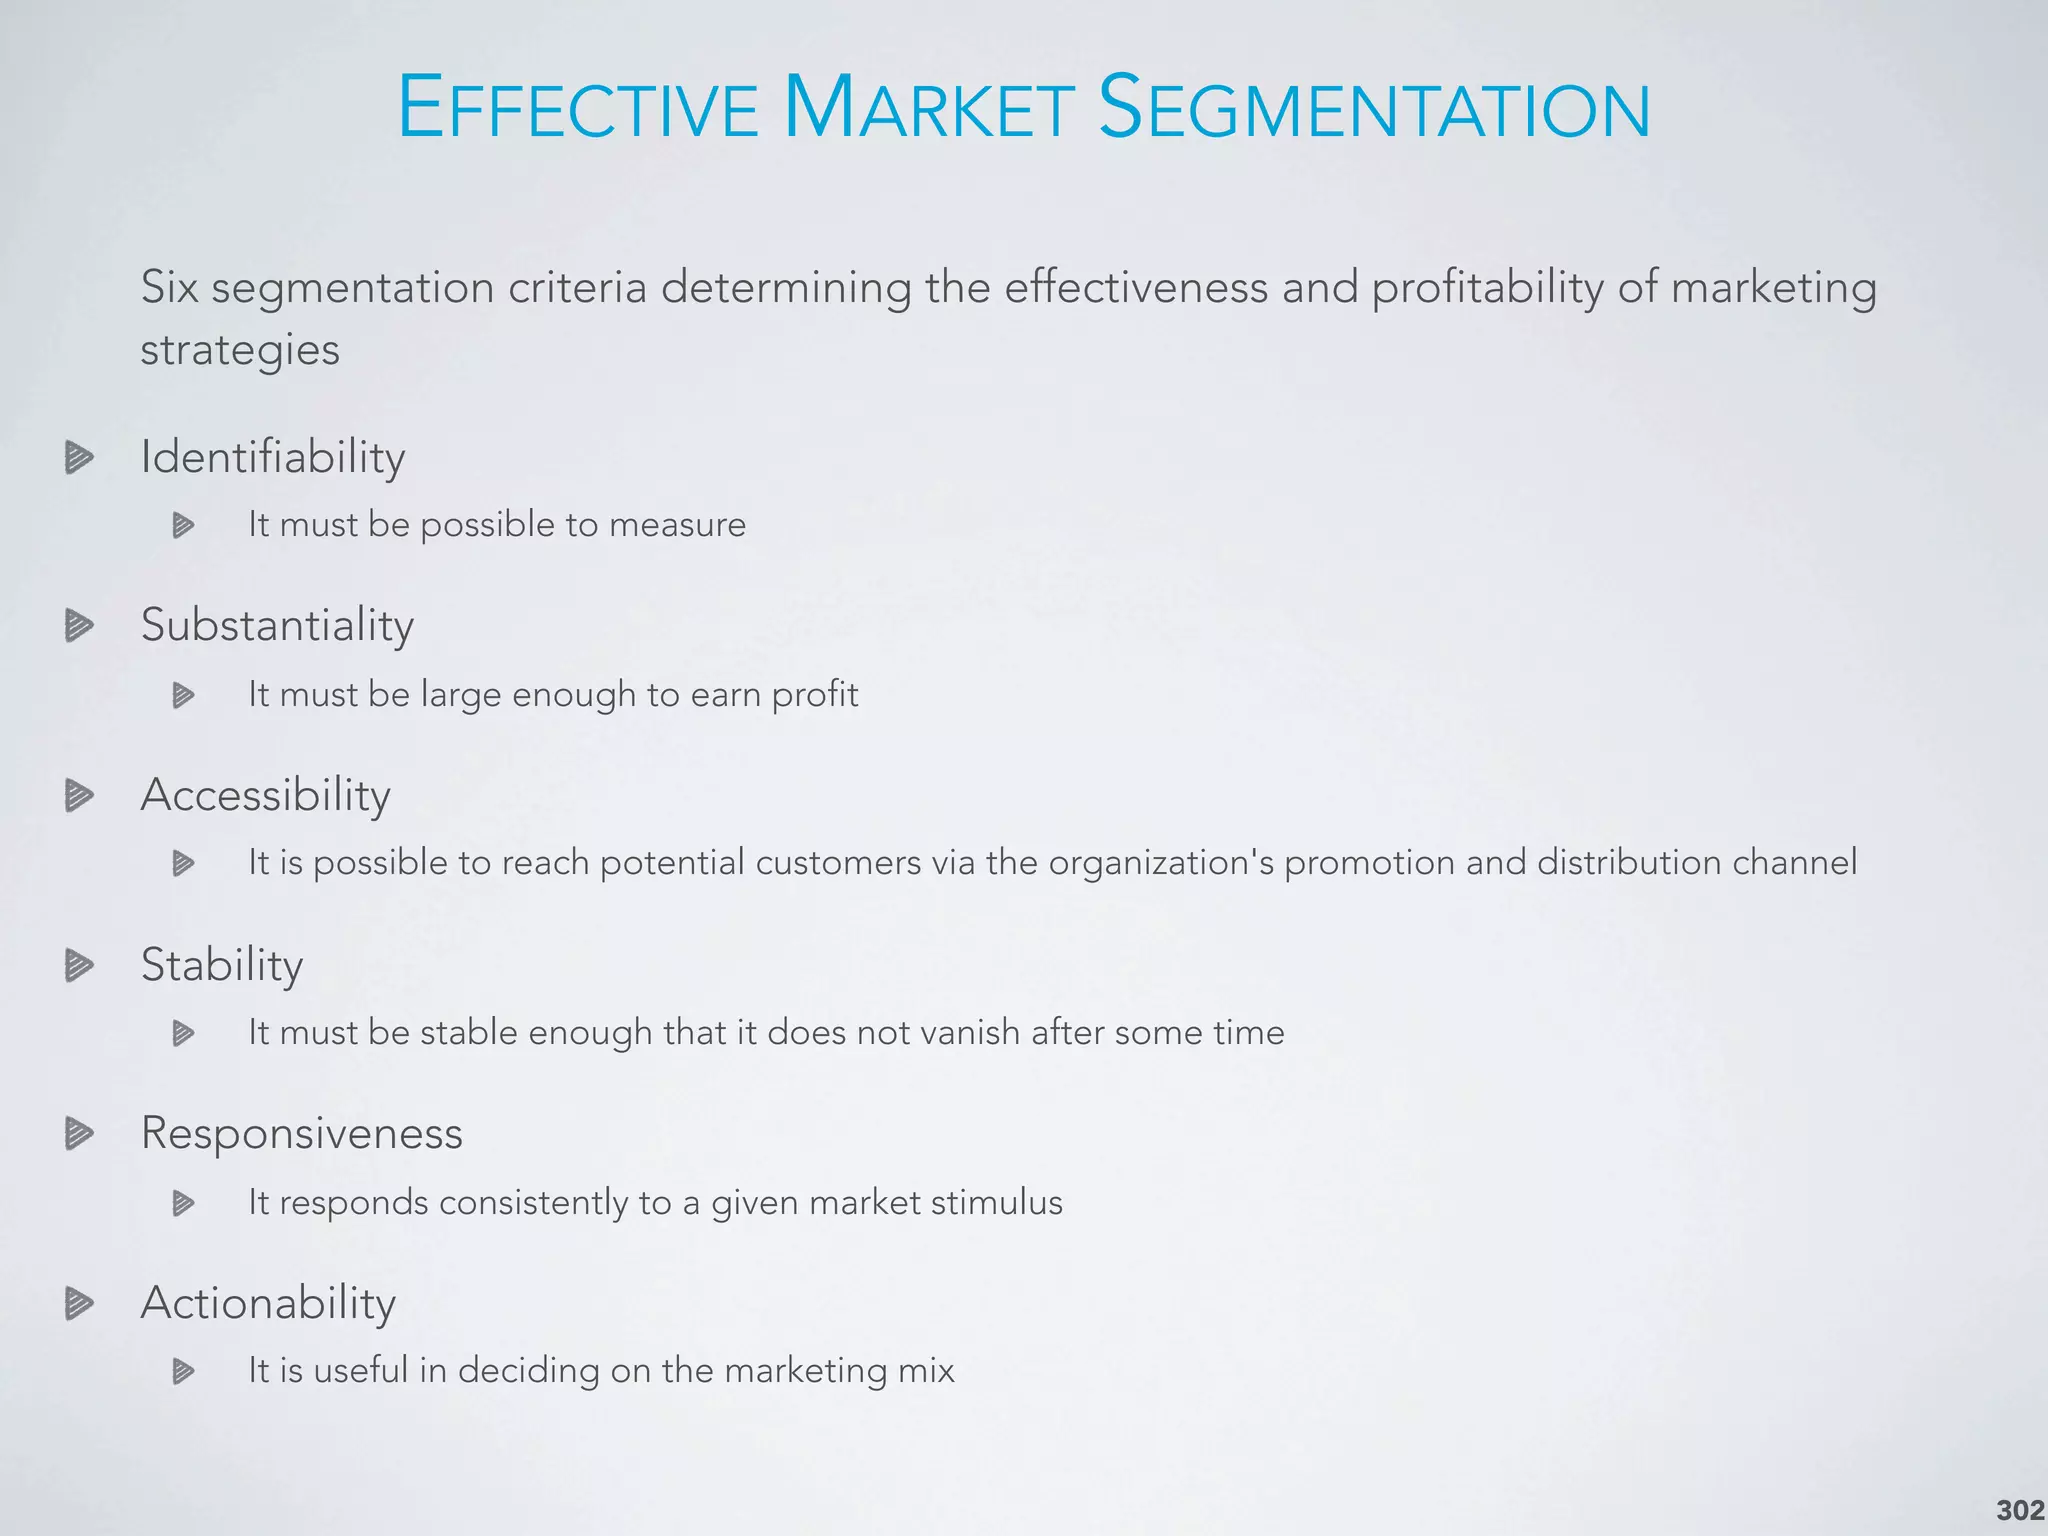
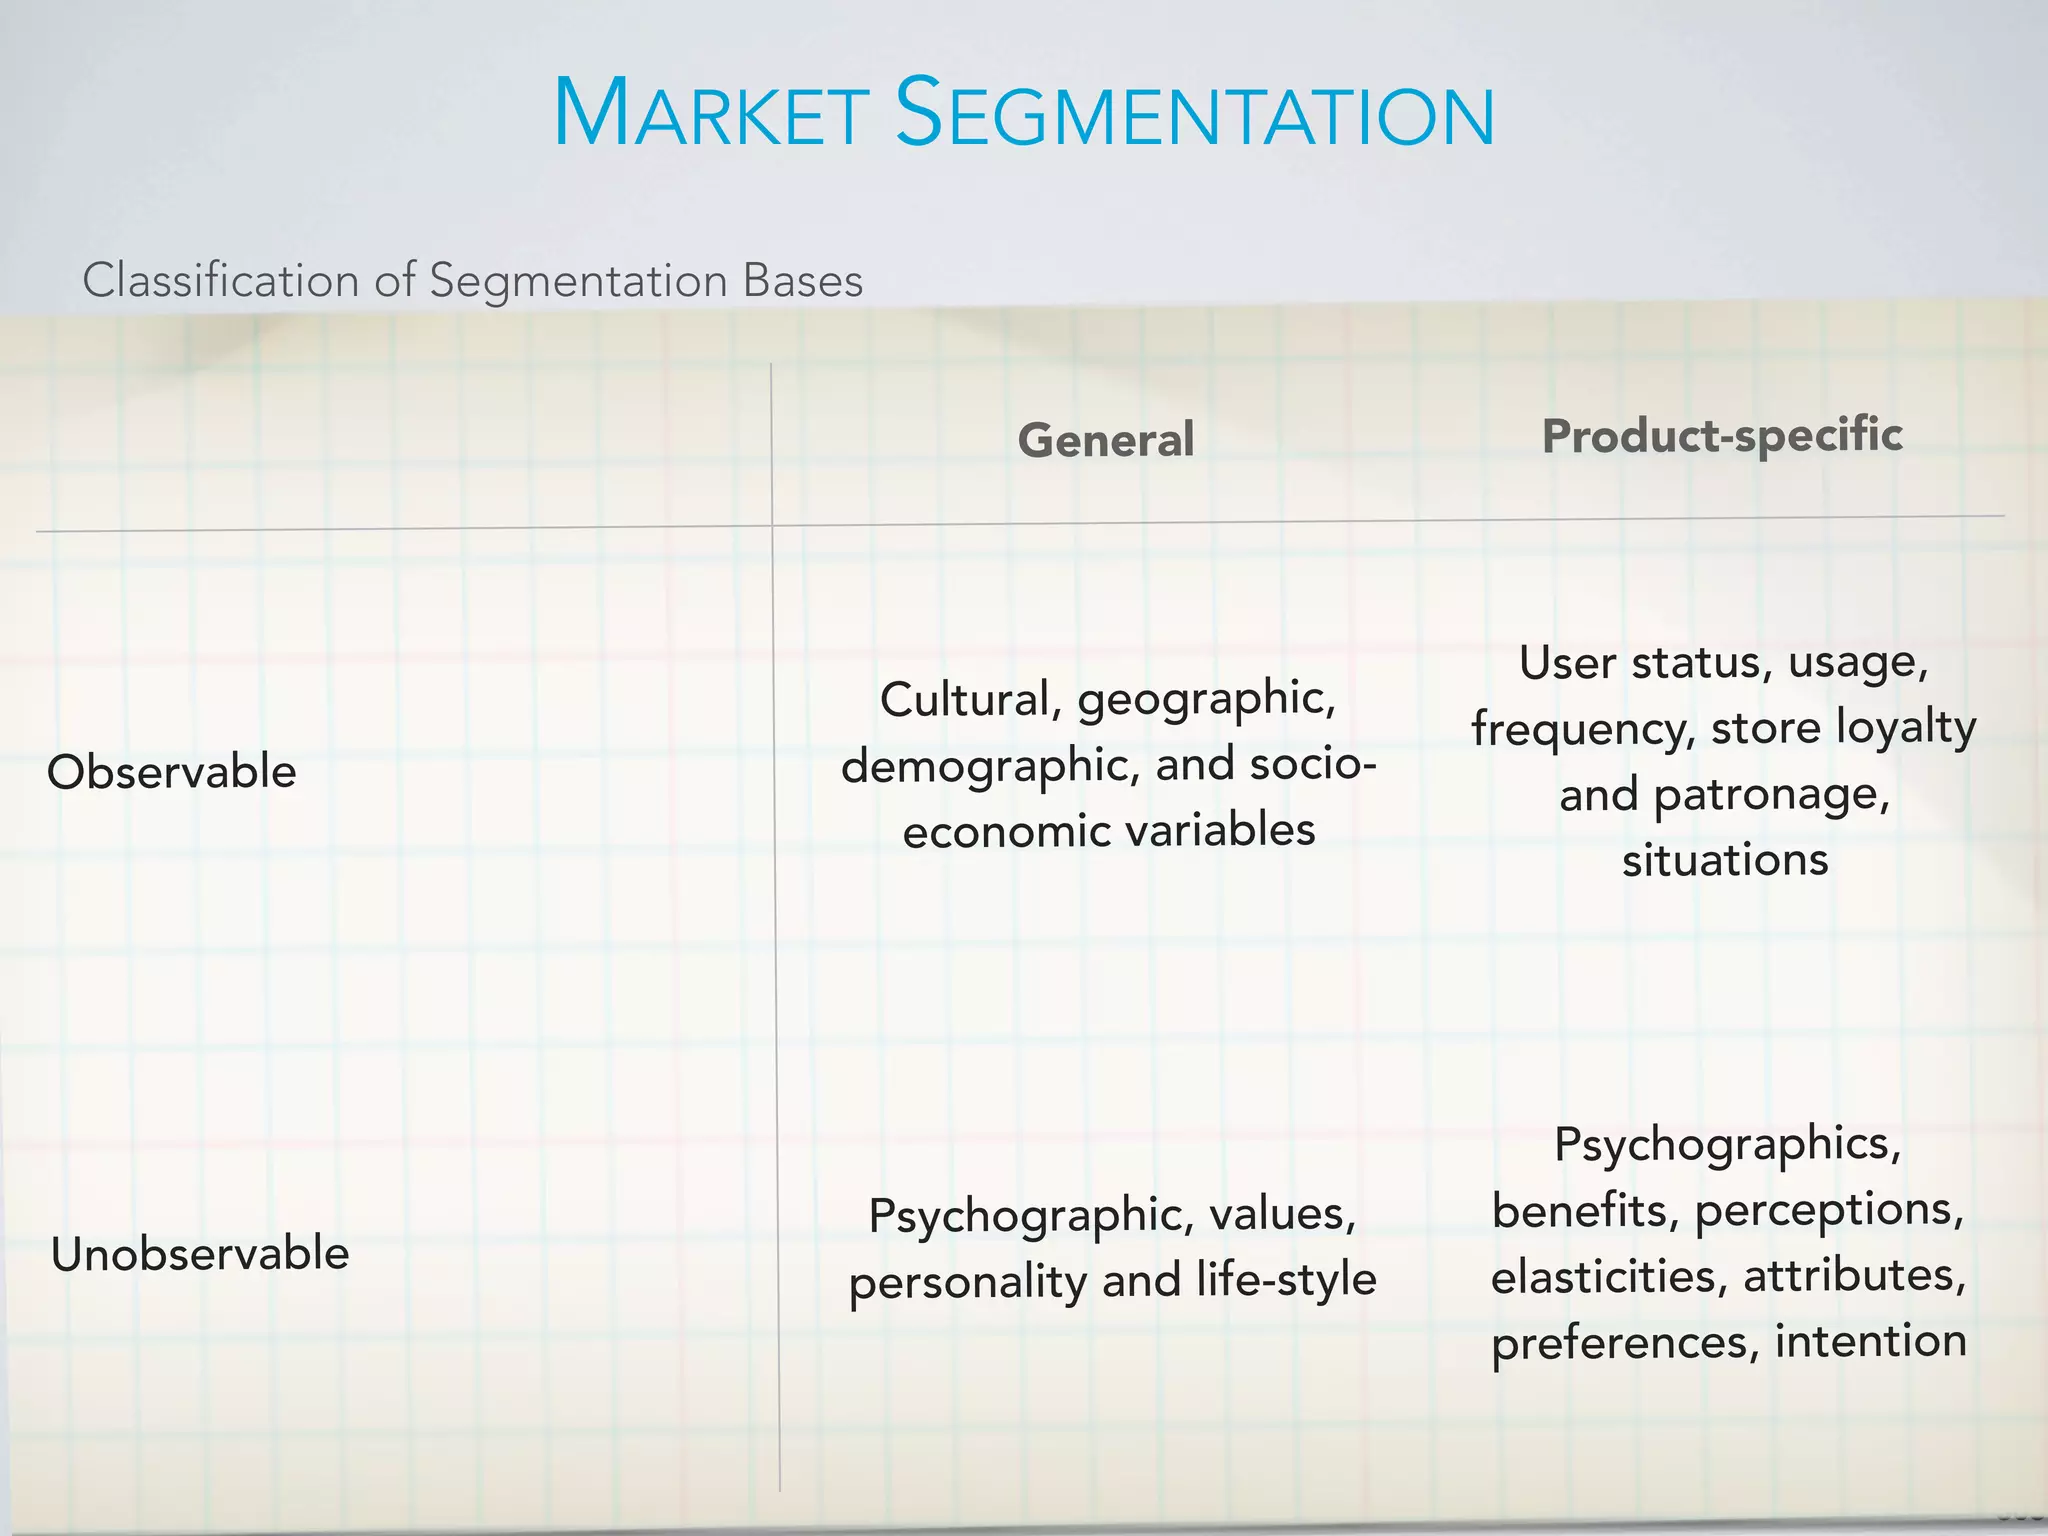
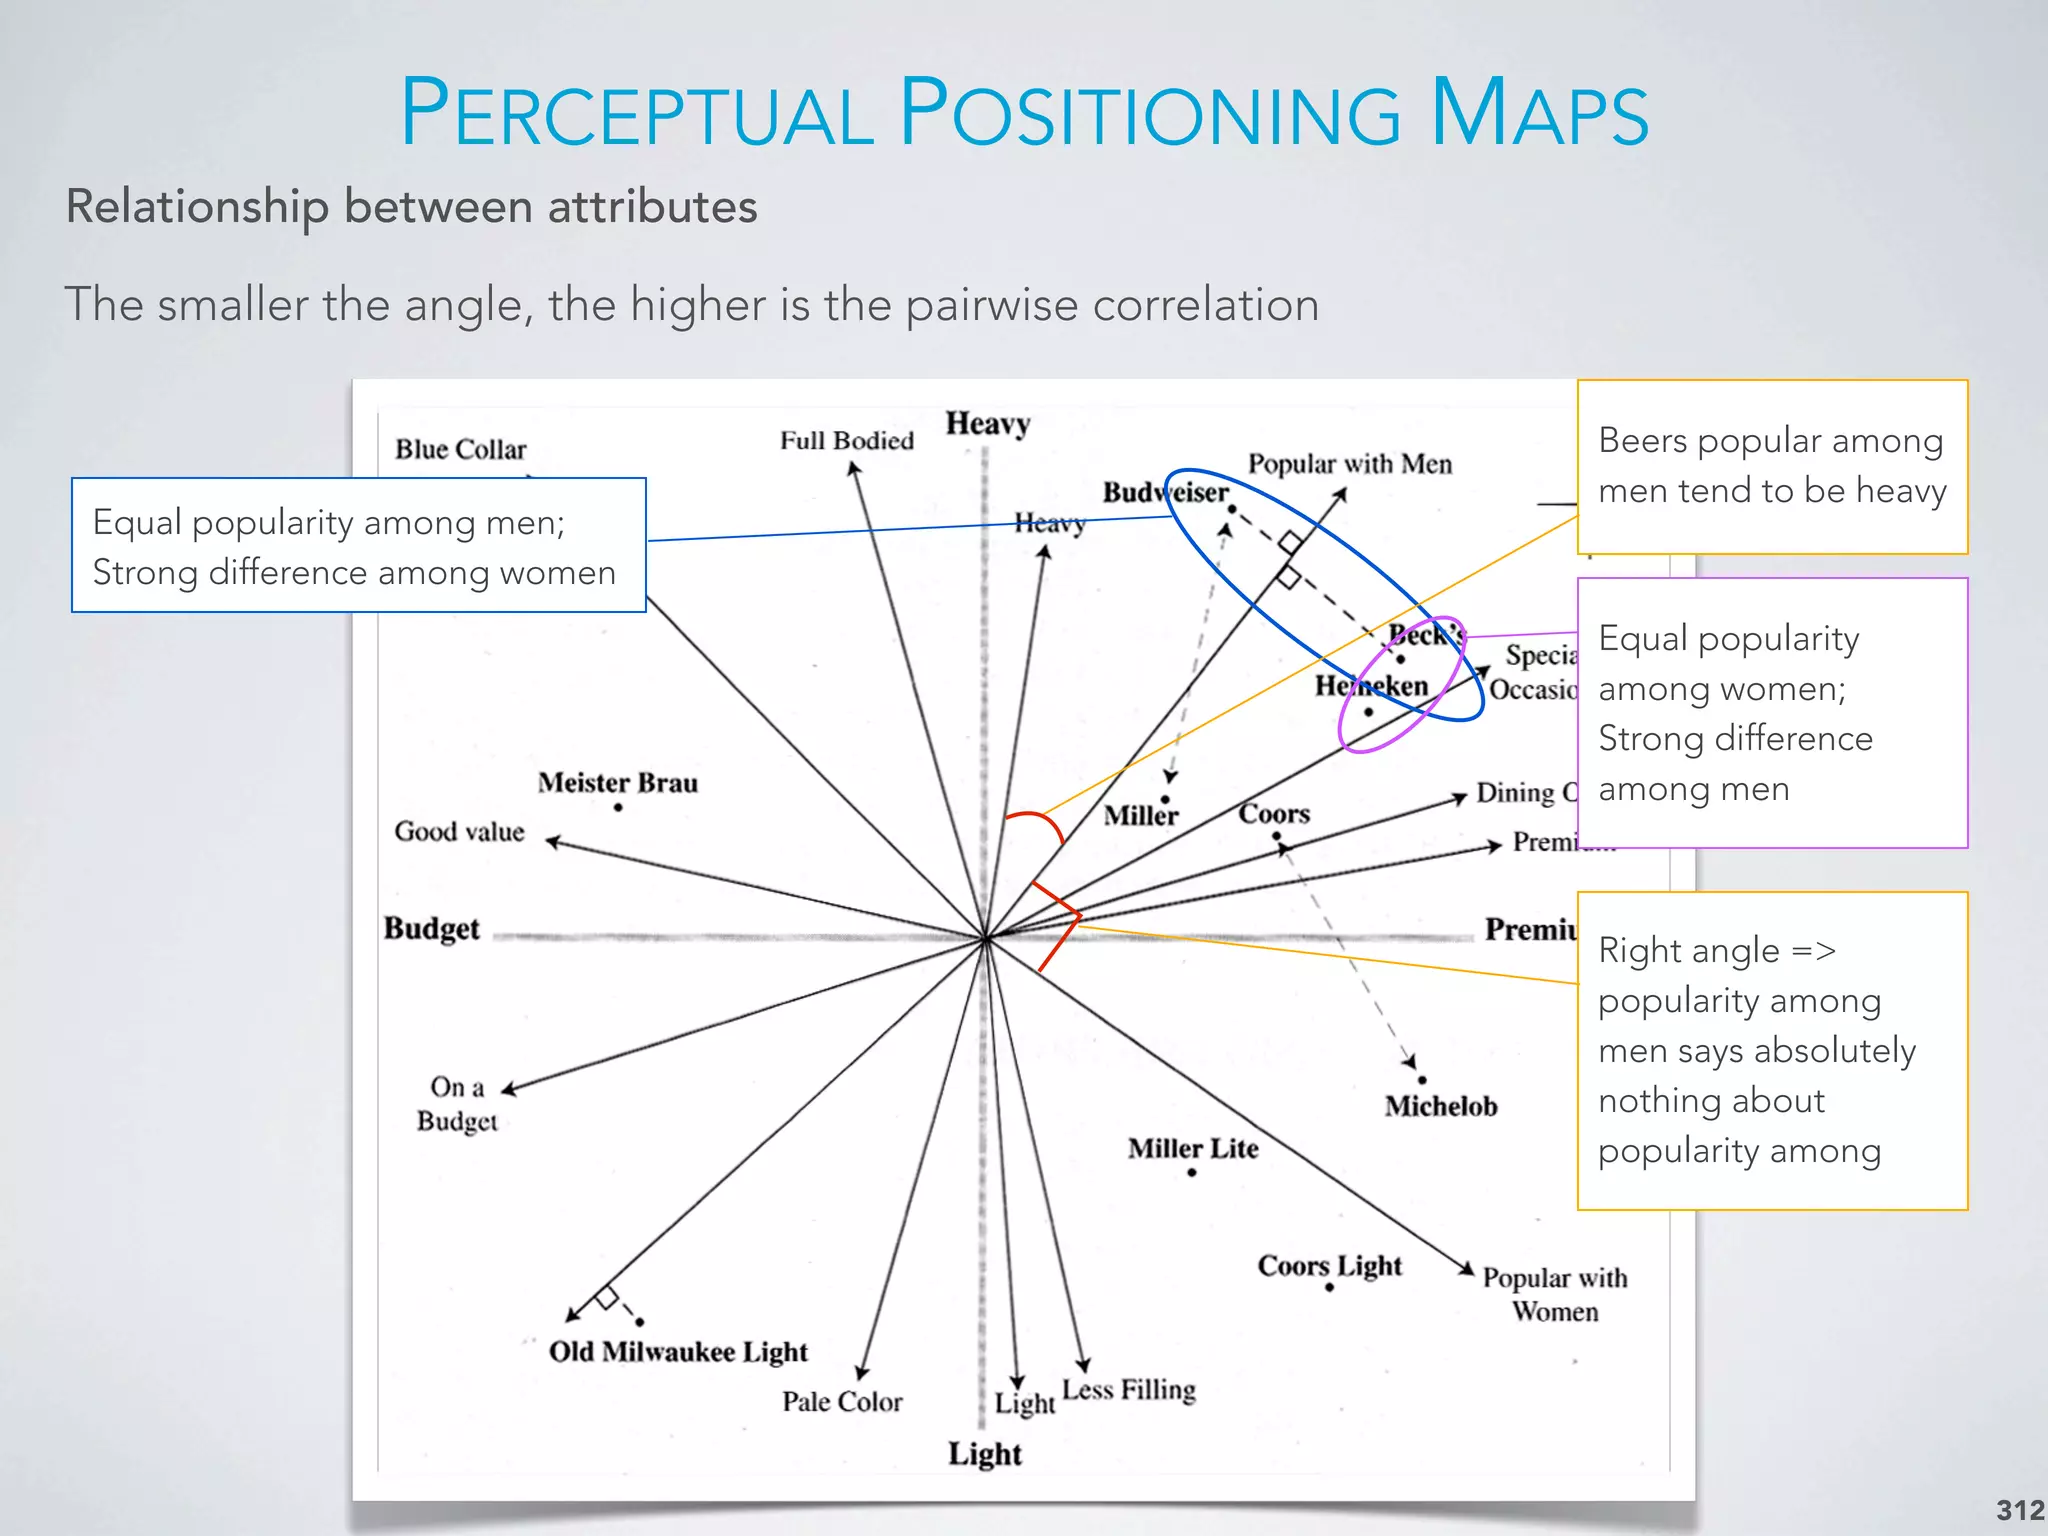
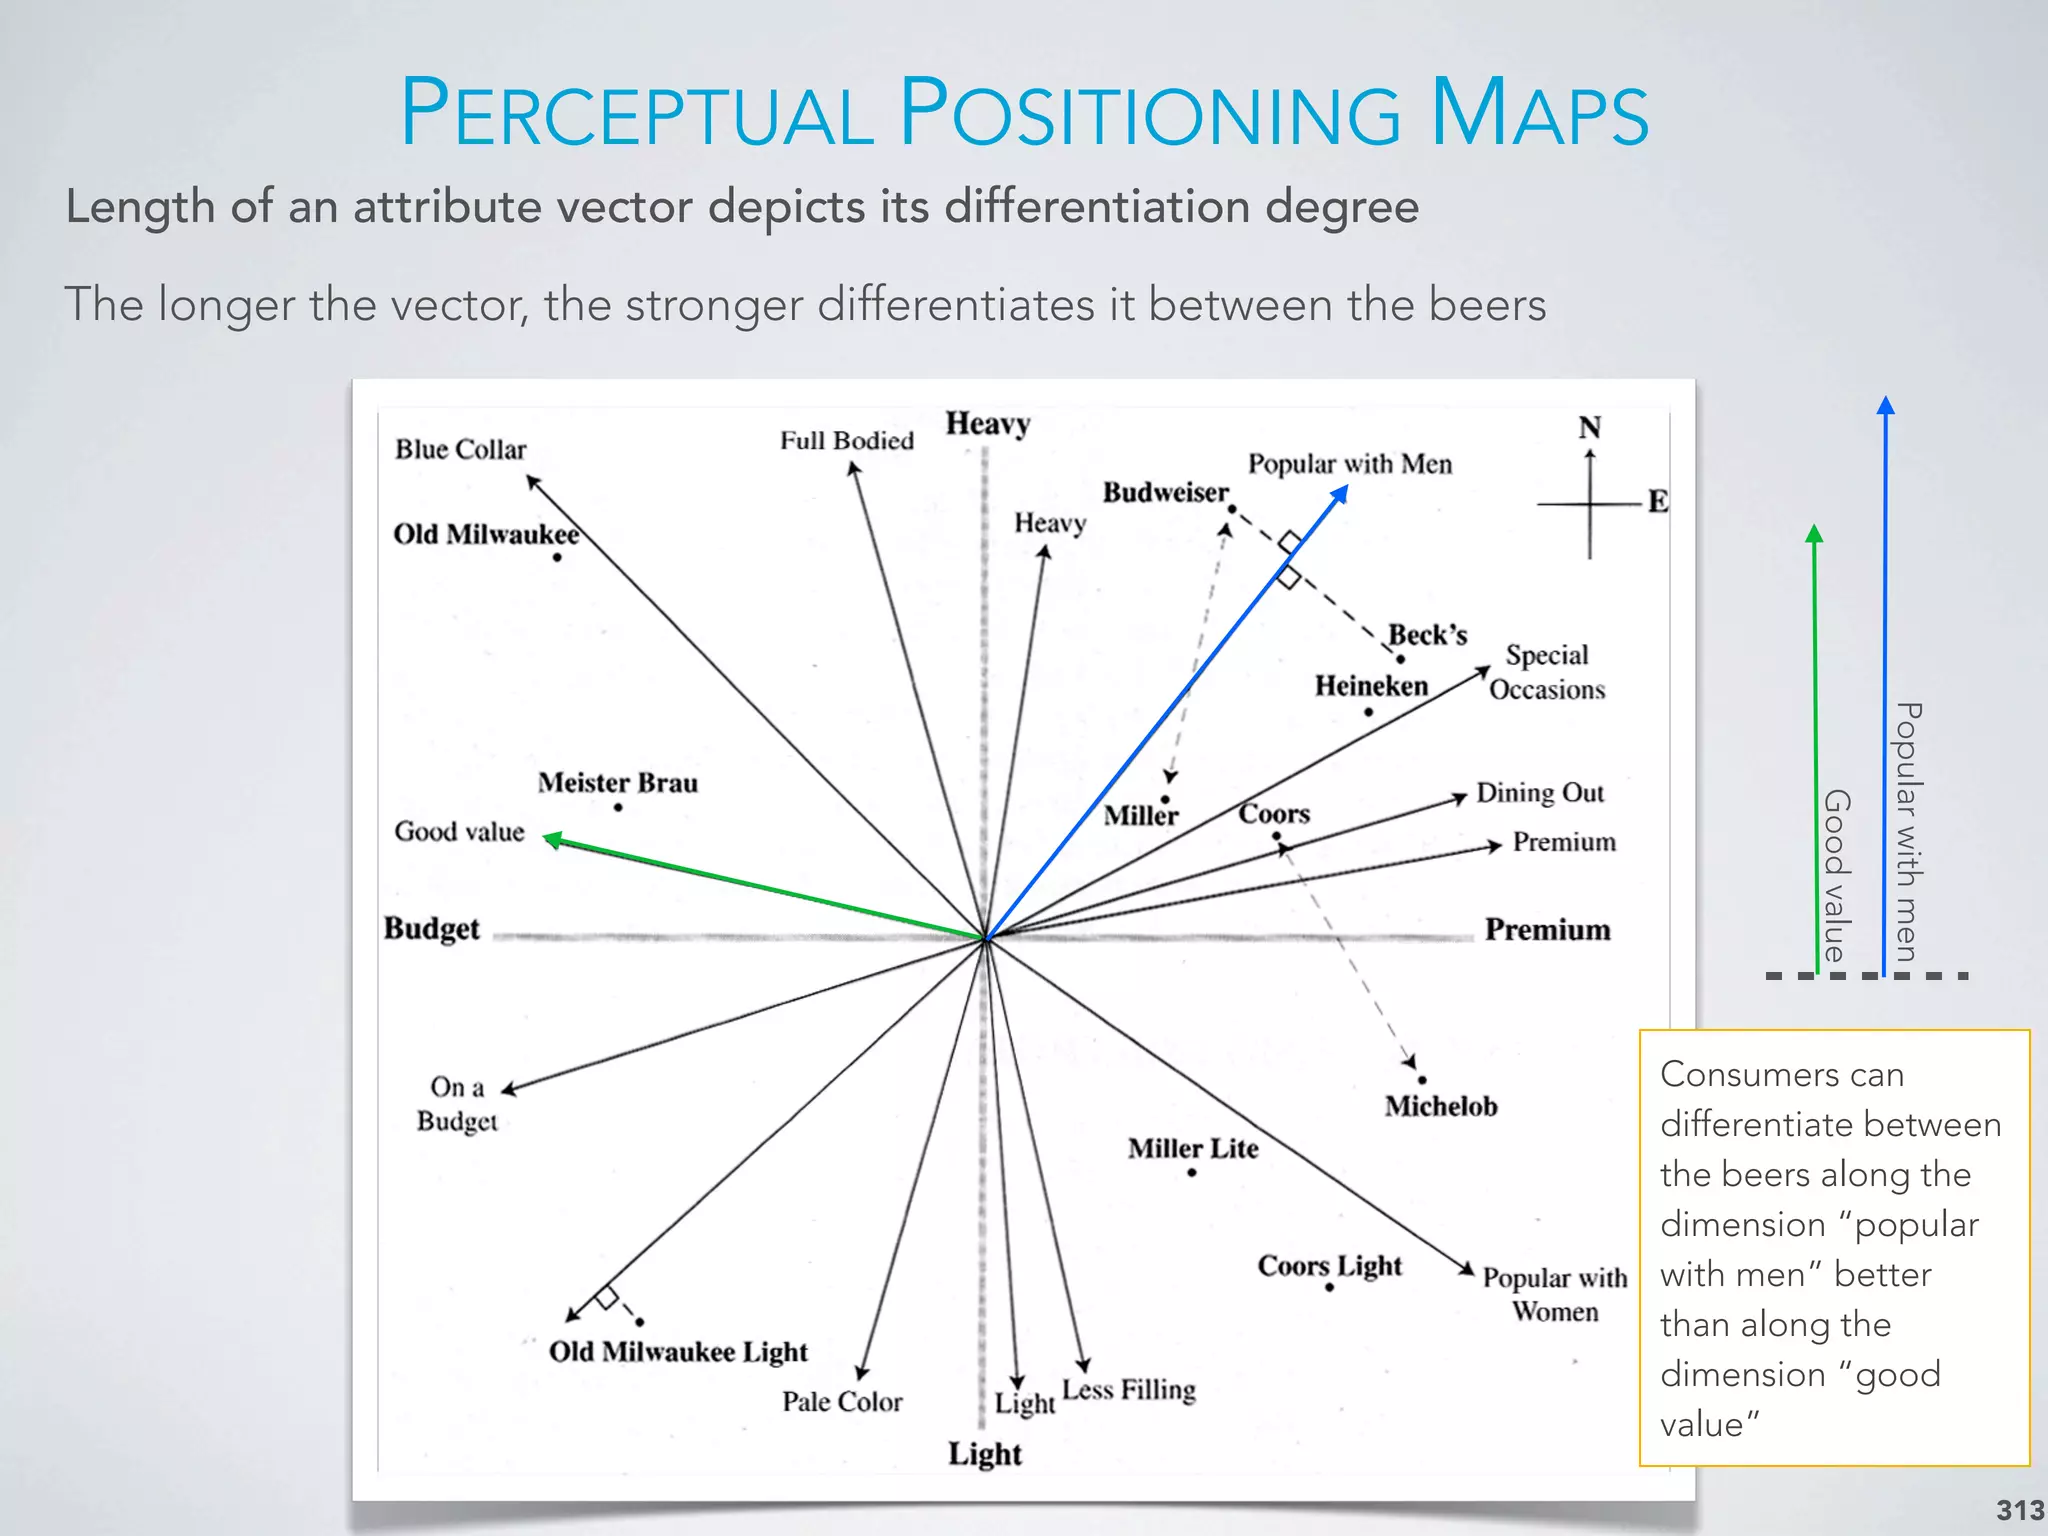
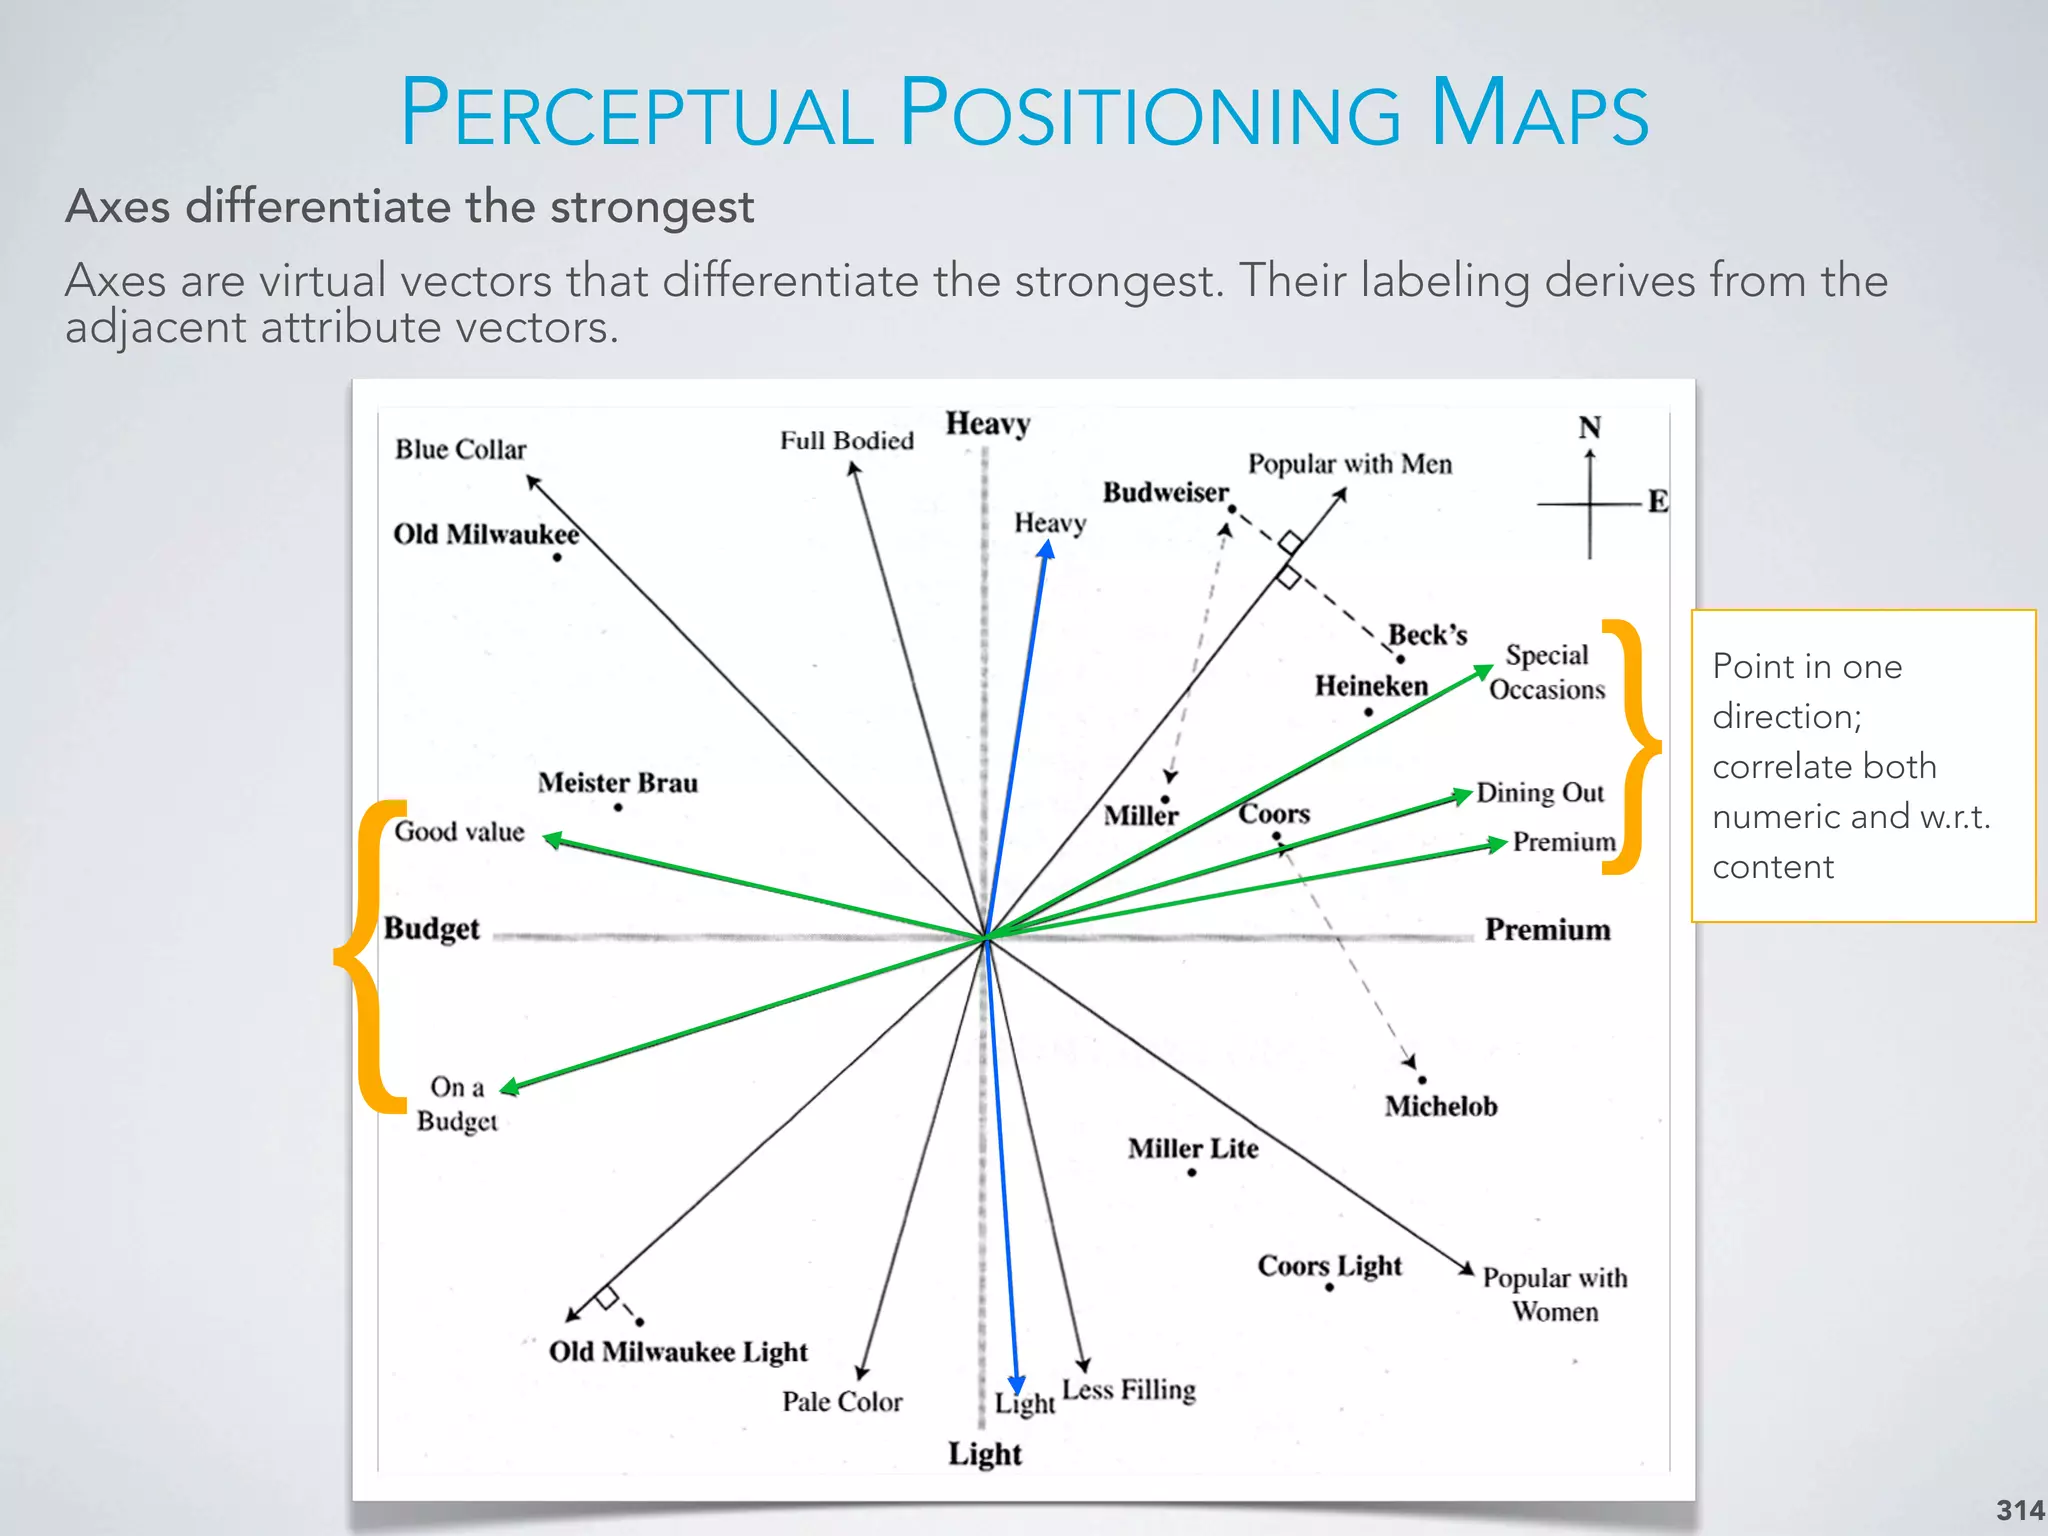
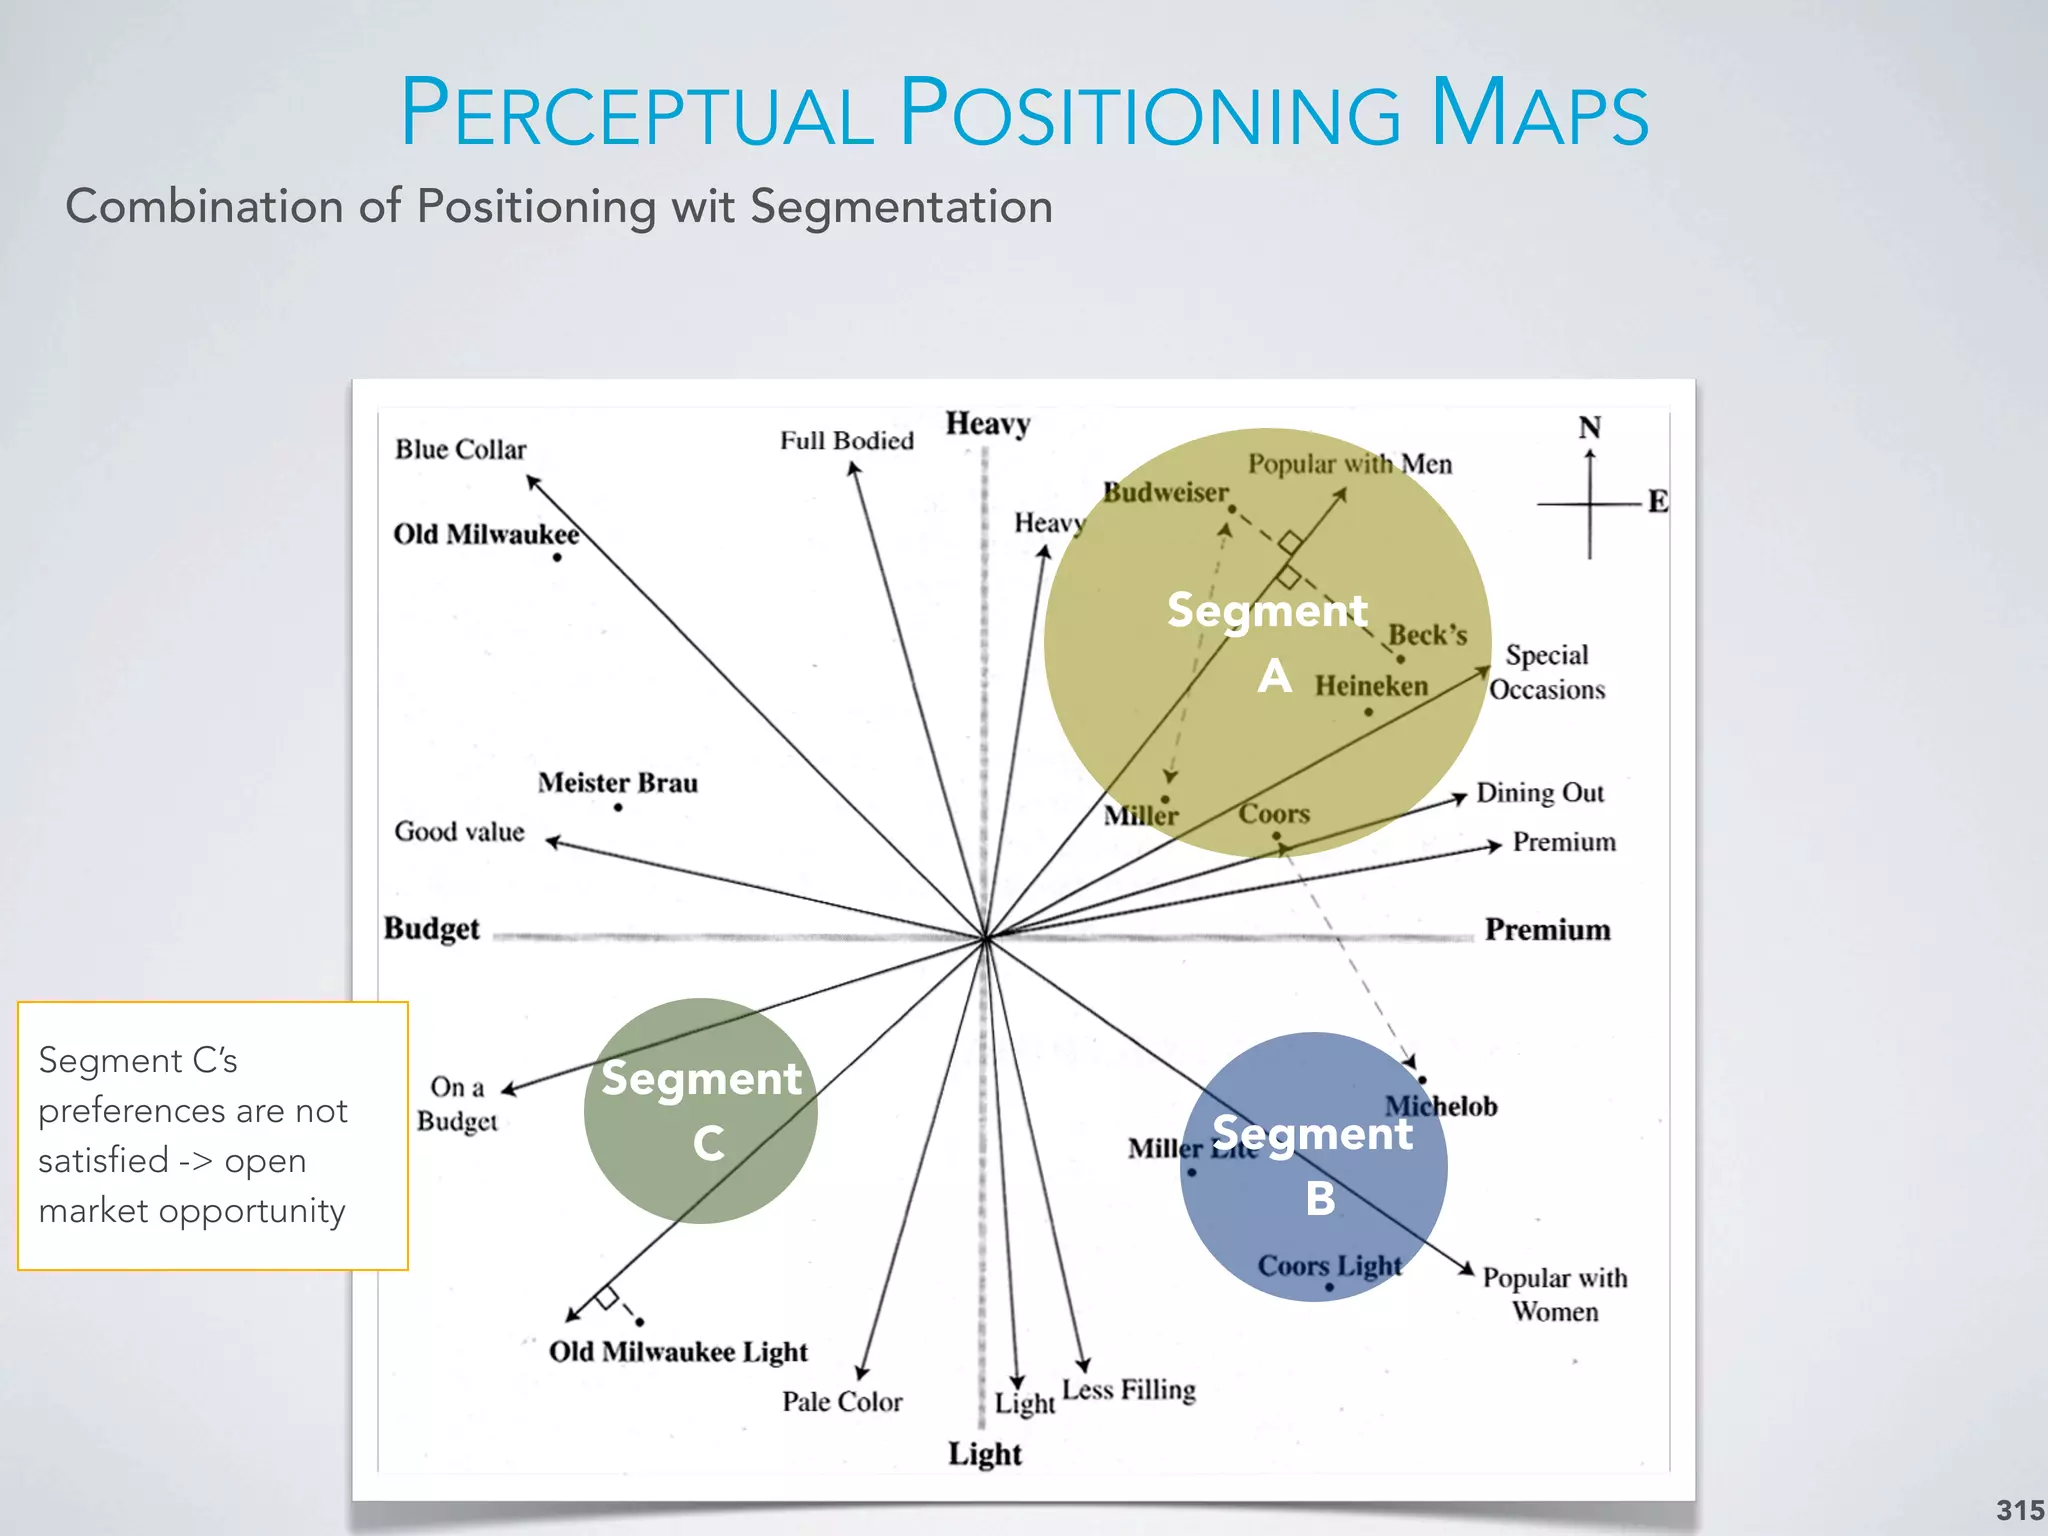
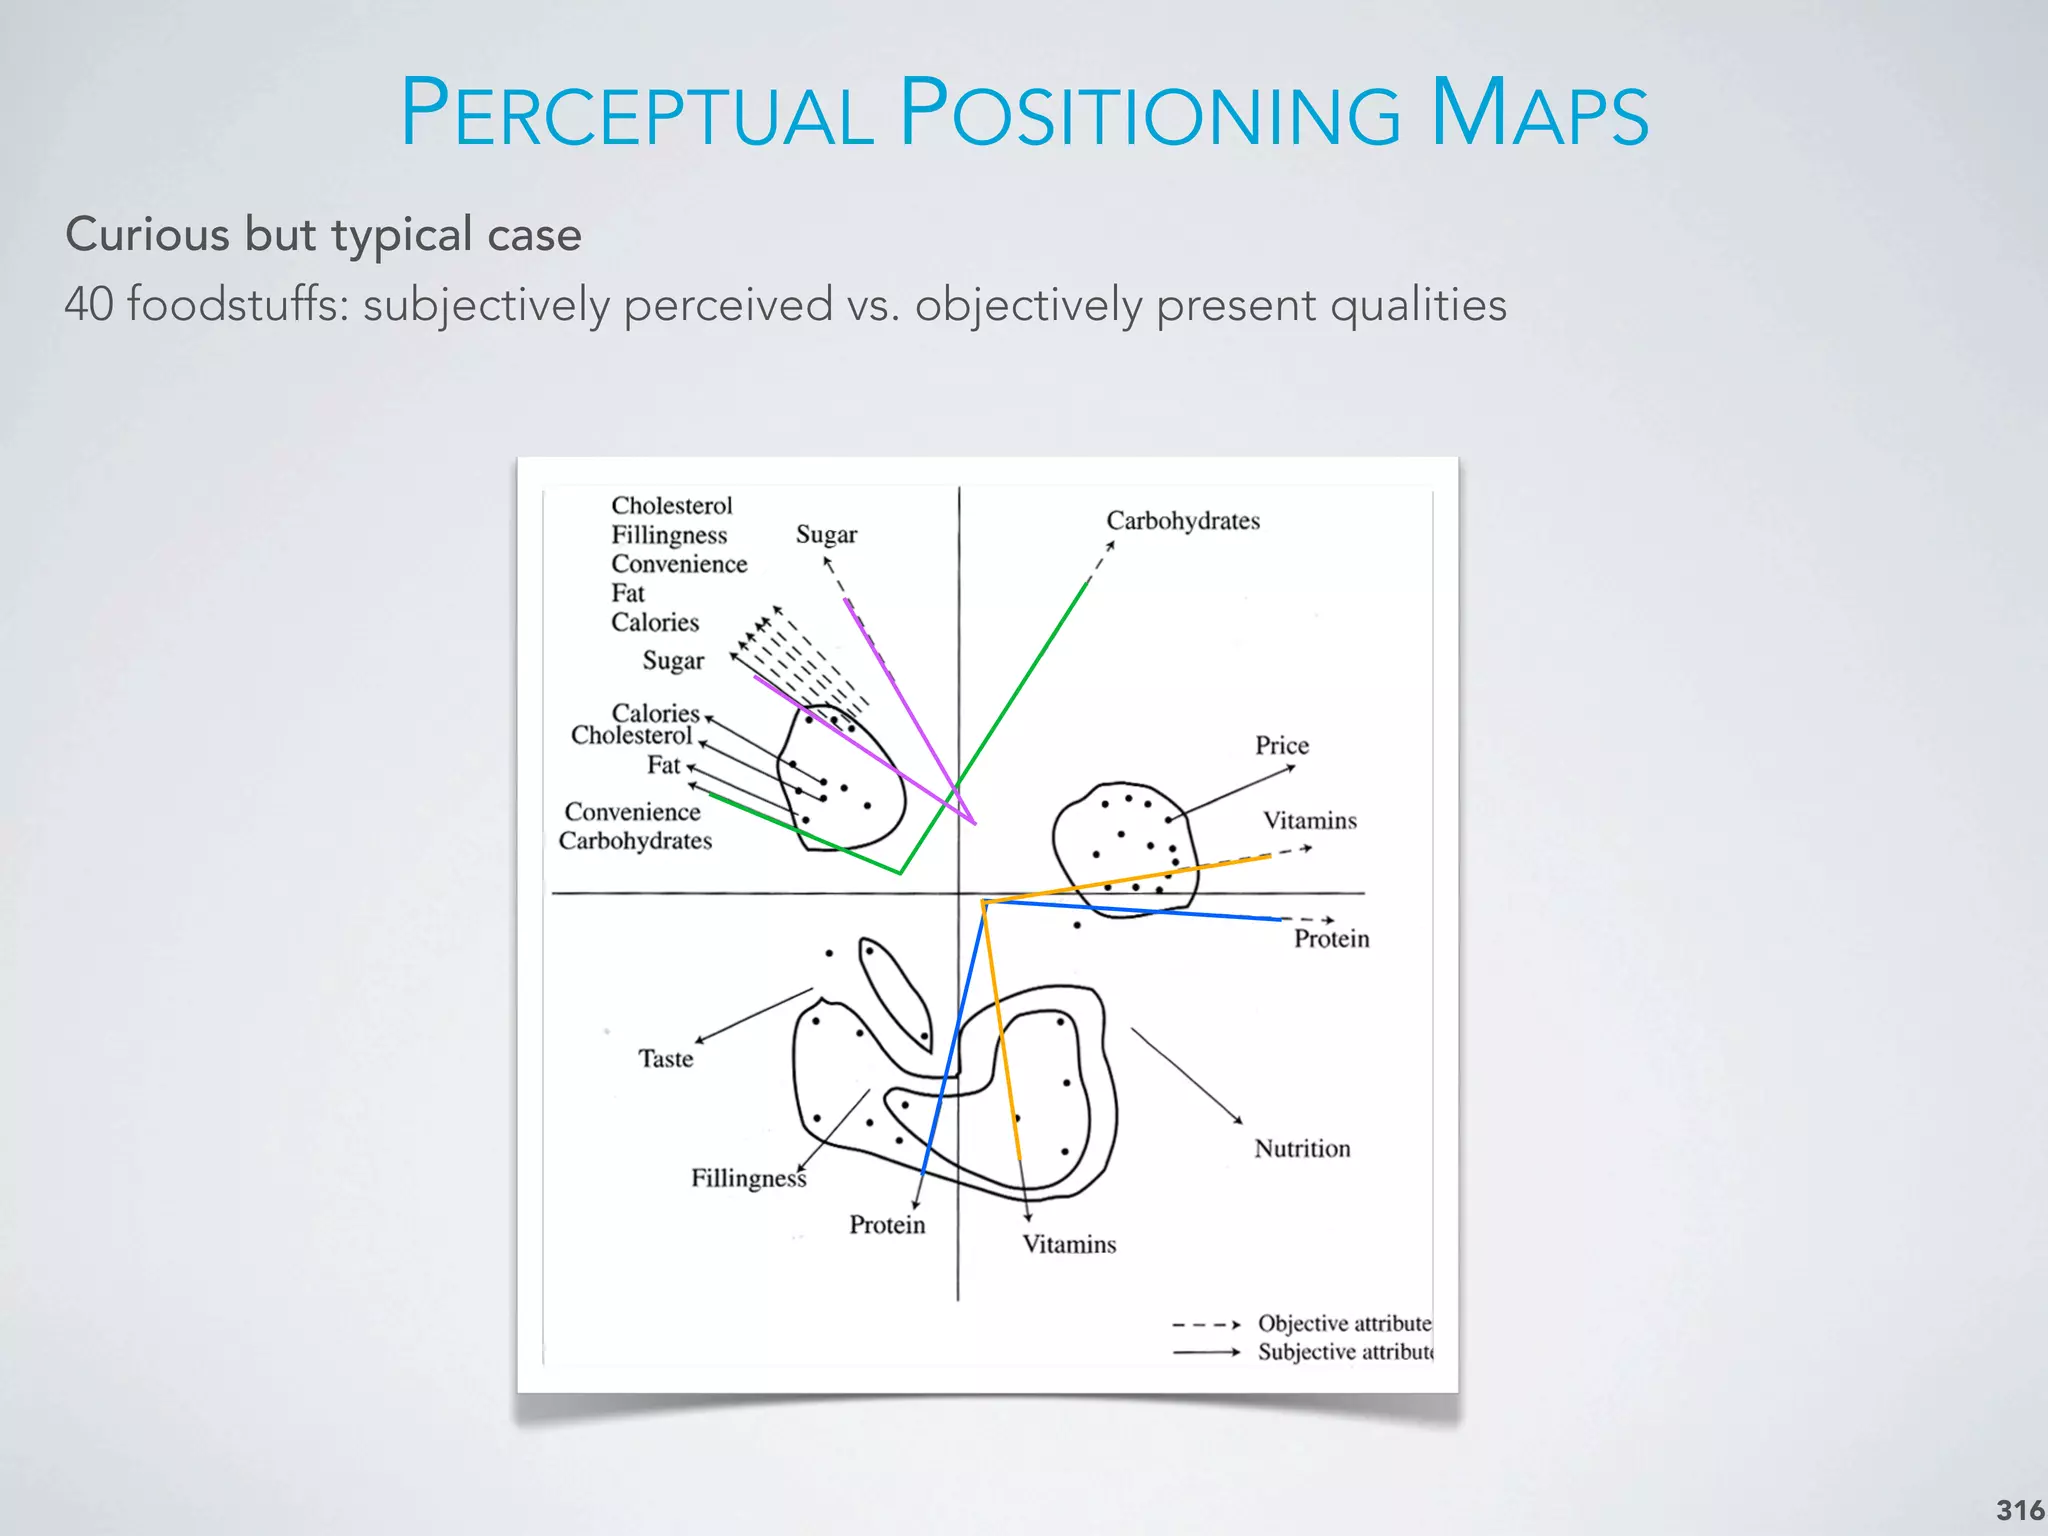
Overview of advanced techniques like conjoint analysis, market simulations, segmentation, and perceptual mapping.
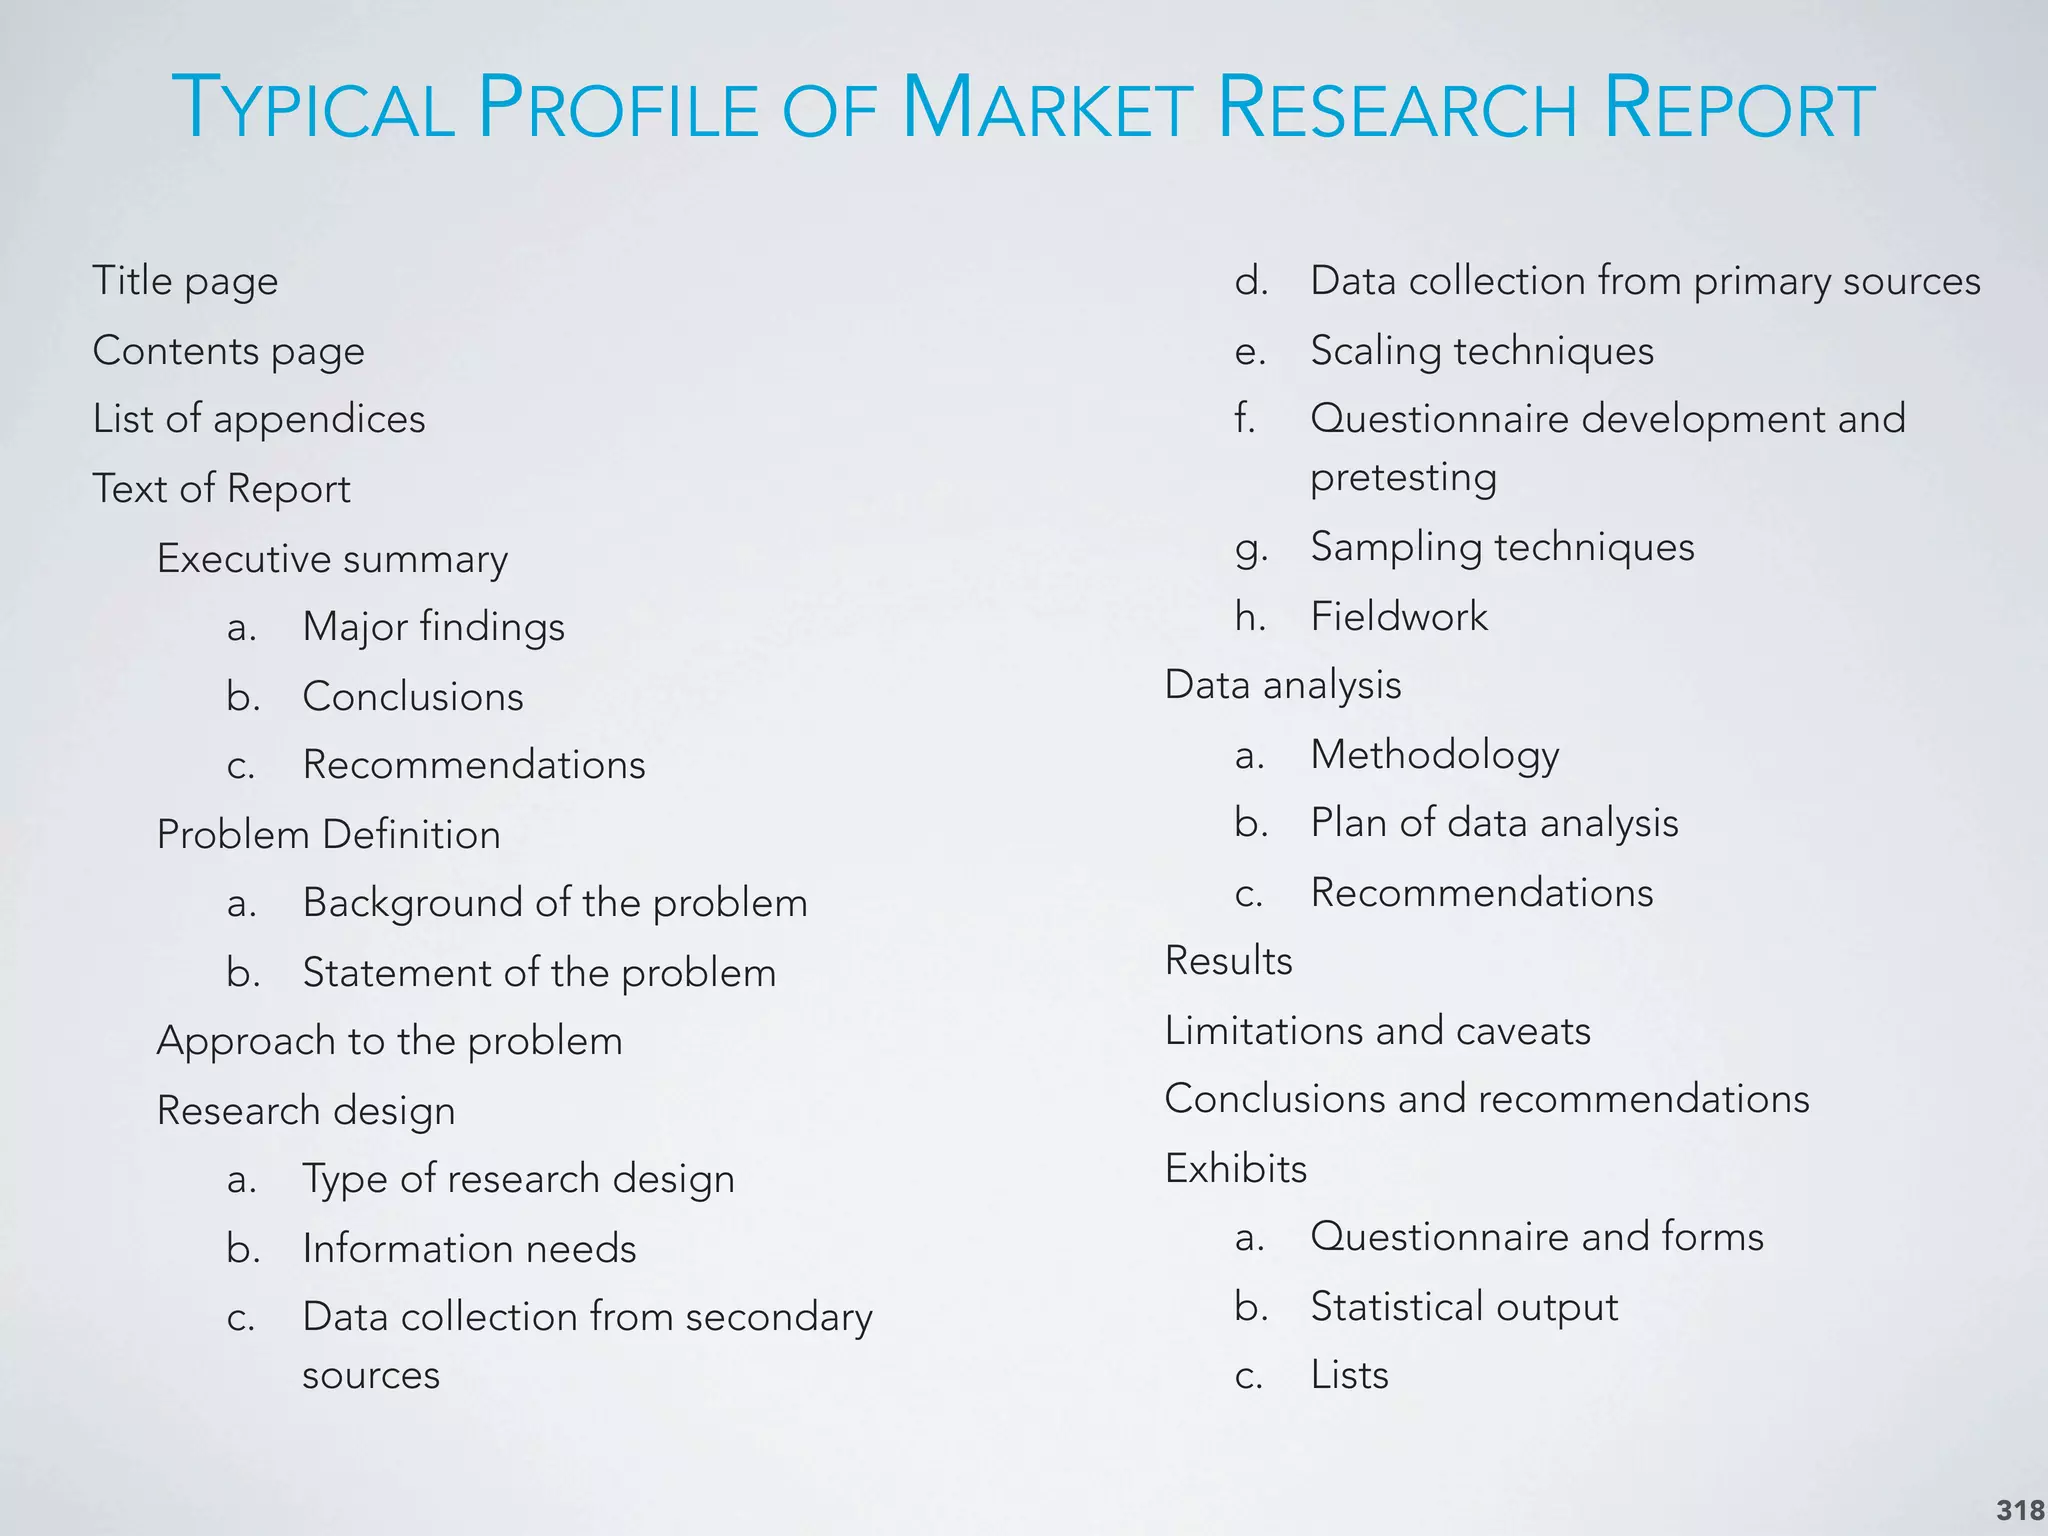
Structure and guidelines on writing effective marketing research reports for stakeholder communication.