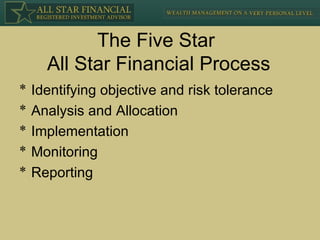
This document provides an overview of All Star Financial, an independent fee-only financial advisory firm. It discusses the firm's services, investment philosophy, and approach to managing client portfolios. Key points include:
1. All Star Financial provides personal and corporate financial planning, investment management, and tax services. They manage client assets using mutual funds, ETFs, stocks, and bonds.
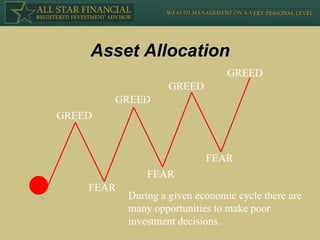
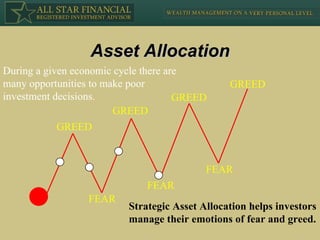
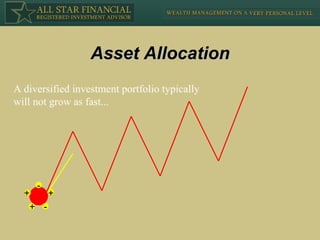
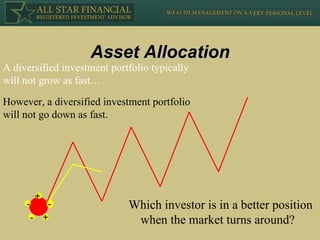
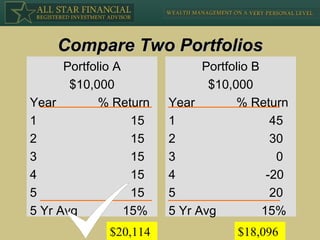
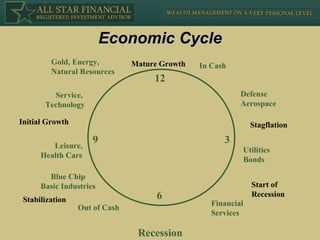
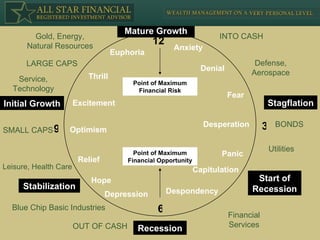
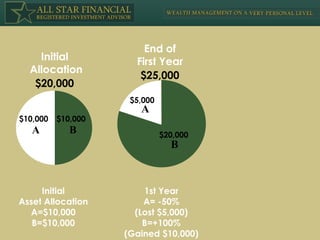
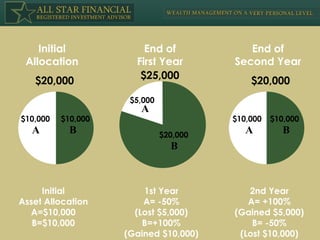
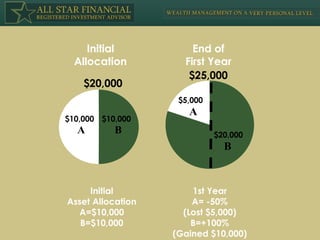
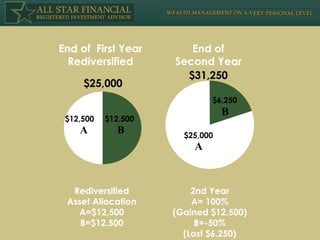
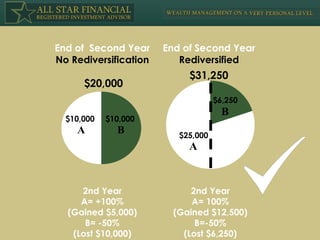
2. The firm's investment approach focuses on reducing risk and volatility through strategic asset allocation and diversification. They emphasize keeping what you earn over maximizing returns.
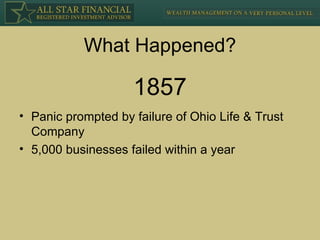
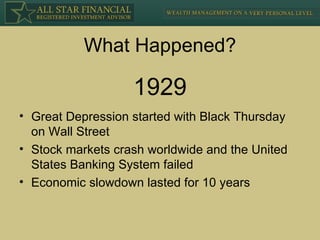
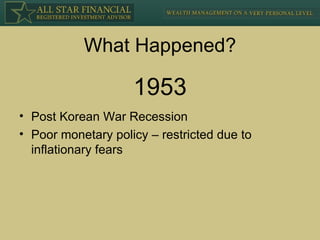
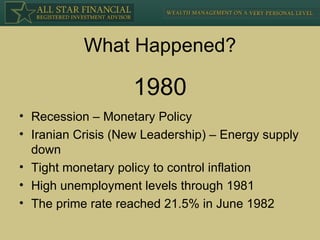
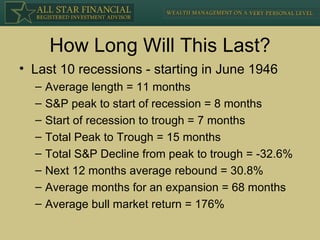
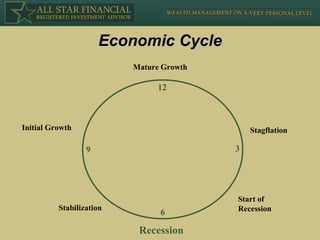
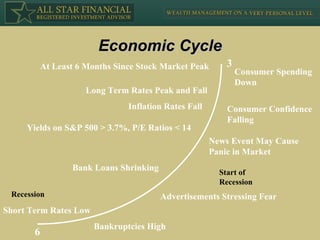
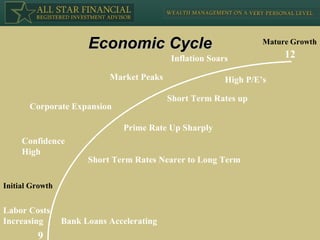
3. Examples from past economic cycles and market downturns illustrate why diversification and staying the course are important strategies during volatile periods. Panicking and making