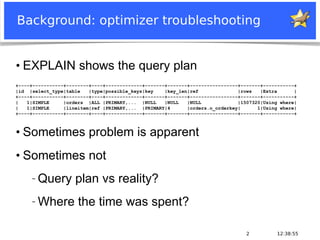
Download as PDF, PPTX

![12:38:559
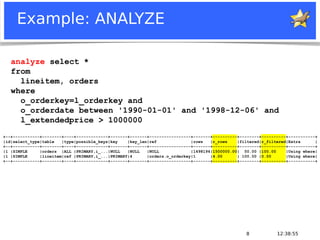
To ANALYZE FORMAT=JSON
"table": {
"table_name": "lineitem",
"access_type": "ref",
"possible_keys": ["PRIMARY", "i_l_orderkey",
"i_l_orderkey_quantity"],
"key": "PRIMARY",
"key_length": "4",
"used_key_parts": ["l_orderkey"],
"ref": ["dbt3sf1.orders.o_orderkey"],
"r_loops": 1500000,
"rows": 1,
"r_rows": 4.0008,
"r_total_time_ms": 170456,
"filtered": 100,
"r_filtered": 0,
"attached_condition": "(lineitem.l_extendedprice >
1000000)"
}
}
}
{
"query_block": {
"select_id": 1,
"r_loops": 1,
"r_total_time_ms": 191747,
"table": {
"table_name": "orders",
"access_type": "ALL",
"possible_keys": ["PRIMARY", "i_o_orderdate"],
"r_loops": 1,
"rows": 1498194,
"r_rows": 1.5e6,
"r_total_time_ms": 14261,
"filtered": 50,
"r_filtered": 100,
"attached_condition": "(orders.o_orderDATE between
1990-01-01 and 1998-12-06)"
},](https://image.slidesharecdn.com/mariadb-analyze-for-statements-lightning-talk-151013104328-lva1-app6891/85/MariaDB-ANALYZE-for-statements-lightning-talk-9-320.jpg)
![12:38:5510
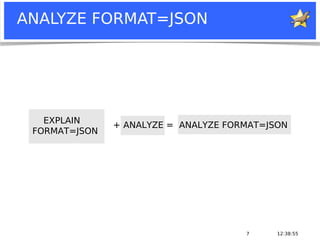
ANALYZE FORMAT=JSON data
●
Each node has
− r_loops
− r_total_time_ms ← !
●
In the example
− orders.r_total_time_ms=14261
− lineitem.r_total_time_ms=170456
{
"query_block": {
"select_id": 1,
"r_loops": 1,
"r_total_time_ms": 191747,
"table": {
"table_name": "orders",
"access_type": "ALL",
"possible_keys": ["PRIMARY", "i_o_orderdate"],
"r_loops": 1,
"rows": 1498194,
"r_rows": 1.5e6,
"r_total_time_ms": 14261,
"filtered": 50,
"r_filtered": 100,
"attached_condition": "(orders.o_orderDATE between
1990-01-01 and 1998-12-06)"
},](https://image.slidesharecdn.com/mariadb-analyze-for-statements-lightning-talk-151013104328-lva1-app6891/85/MariaDB-ANALYZE-for-statements-lightning-talk-10-320.jpg)


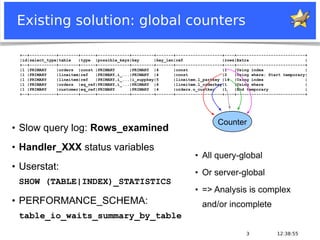
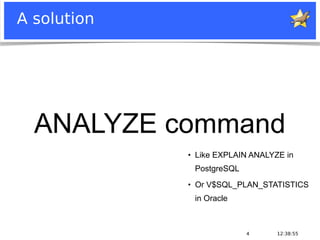
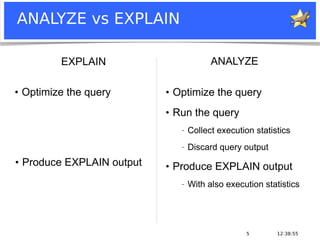
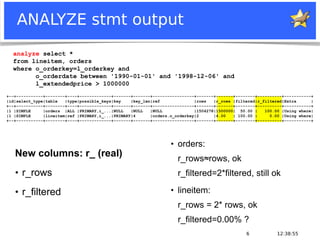
The document describes a new ANALYZE statement in MariaDB 10.1 that provides execution statistics for a SQL statement. ANALYZE runs the statement and collects statistics, similar to EXPLAIN ANALYZE in PostgreSQL. It produces an EXPLAIN plan with additional columns showing real rows, filtering percentages, and time spent. The FORMAT=JSON option outputs the results as a JSON document containing detailed timing and resource usage statistics for each step. This allows more complete analysis of how a query plan was executed versus global counters.


![Introduction to MySQL Query Tuning for Dev[Op]s](https://cdn.slidesharecdn.com/ss_thumbnails/qtdevops-191005204425-thumbnail.jpg?width=640&height=640&fit=bounds)