Download as PDF, PPTX


![PAS Array
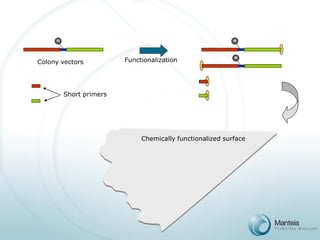
Density = f([template],[primer],t)
ss DNA Colony Vector(107/cm2)
ss Oligonucleotide
Primers (4x10⁴/μm2)
Glass surface
1
2
5’ endscovalently attached
3’ endsfree in solution](https://image.slidesharecdn.com/manteianonconfidential-presentation200309-141113135235-conversion-gate01/85/Manteia-non-confidential-presentation-2003-09-20-320.jpg)

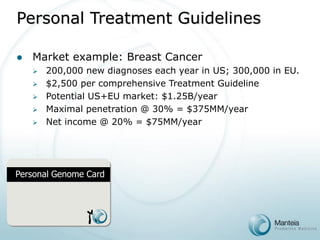
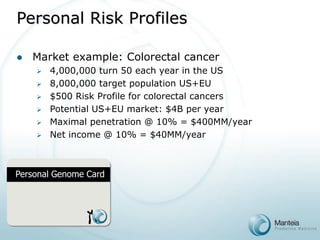

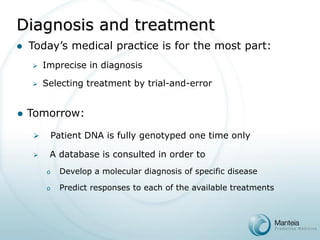
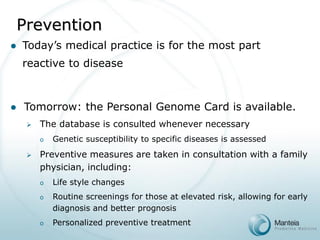
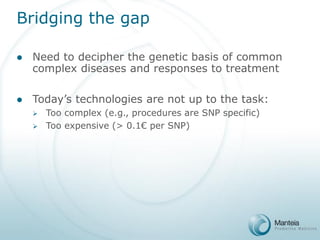
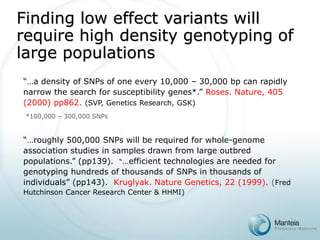
The document discusses the future of personalized predictive medicine, highlighting advancements such as full DNA genotyping and the use of databases to improve disease diagnosis and treatment selection, moving away from trial-and-error methods. It emphasizes the need for more efficient genetic analysis technologies, particularly for identifying low-effect genetic variants associated with common diseases, and describes Manteia's SNP typing technology as a scalable and cost-effective solution. The potential market for personalized genome cards and treatment guidelines is substantial, with projected revenues from both disease risk profiling and response predictions.