Downloaded 10 times

![Page 4 of 78
1.LITERATURE REVIEW
1.1.INTRODUCTION
Mars during recent years has been a great field of study for researchers. Since
the first close-up pictures of Mars were taken in 1965, spacecraft voyages to
the Red Planet have revealed a world strangely familiar to our predetermined
perception about its origin. Every time we feel close to understanding Mars;
new discoveries send us straight back to the drawing board to revise existing
theories challenging our views about the planet.[1]
Wernher von Braun’s book ‘The Mars Project’ was the first instance when an
option of landing gliders was discussed as a transfer option from Maritain Orbit
to the surface. The option of having an unmanned UAV as an observation
desk offers the best alternative for a science platform while reducing the risk of
sending a manned mission or a slower option of rover. The drawback for using
rover as an observational platform is that it minimises the surveying area. With
a planet of the size of Mars, rover missions allow us the possibility of having
limited scope of observing hence better alternatives for remote sensing were
required.
Manoeuvrability plays a vital role in defining mission objectives as observation
requirements may change over varied circumstances(atmospheric flux, new
objectives) hence a weather balloon looks like an unviable option. Factors like
weight of instruments and the craft mass itself, aerodynamic design, low
Reynolds number, high flight Mach number, low atmospheric density are the
major design constraints.
Propulsion for such an aircraft is too considered as a main design driver as
atmospheric density in Mars provides us less mass for momentum transfer.
Hence a lower thrust is generated for a given propulsion system when its](https://image.slidesharecdn.com/mane-missiontomars-151122062011-lva1-app6892/85/Mane-Mission-to-mars-4-320.jpg)
![Page 5 of 78
performance is calculated to that on Earth. Lack of Oxygen is too an issue for
an air breathing engine as it leads to added mass on the craft. The propulsive
thrust generated by electric driven propellers causes added weight of batteries.
Hence the concept of using rocket engines for propulsion is the most viable
option.
Apart from these, the challenge to get an airplane to Mars would be a
significant design driver. The geometric arrangement best suited for stable
atmospheric flight is much different from that best suited for launch and
atmospheric re-entry. Efficient packaging of the aircraft is critical to provide
sufficient wing area (lift capability) within the geometric constraints of the
launch and entry vehicles. Deployment of the stowed design into flight
configuration is a stiff challenge. A mid-air deployment strategy provides the
challenge of transition from ‘falling’ to flying. This mid-air conversion from the
stowed configuration to flight, in which the airplane must take the final shape,
orient itself, and execute a pull-out manoeuvre, is a critical design point.[2]
After this conversion, the flight needs to glide down until it achieves the desired
velocity. Thereafter, the deployment of the rotor wings of the autogiro takes
place which requires for added stress analysis on the wings as they act both
as part of aerofoil in the initial flight and later as a lift generating mechanism.
Reduced air-flow over the new aerofoil would cause turbulent flow as well as
the transition from glider to rotor-craft can cause serious conditions of stall
which would be difficult to overcome in low density hostile Maritain
Atmosphere.
Studies by NASA and ESA have been undertaken to investigate feasibility of
having an UAV mission to Mars.[3] NASA under its MARS SCOUT PROGRAM
developed ARES which is considered here for our base design and X-I’s
design for the rotorcraft is its optimisation of it as its future concept. ESA on
the other hand has undertaken studies for an inflatable rotor concept under its
SOW program.](https://image.slidesharecdn.com/mane-missiontomars-151122062011-lva1-app6892/85/Mane-Mission-to-mars-5-320.jpg)
![Page 6 of 78
The Mars plane thus offers an extensive scaled, high measurement surveyor
from a varied geographical and topological regions providing with a new and
better understanding of the Martian atmosphere as well as surface and its
geological interiors.
The primary objectives of MANE mission are explained below. Note the mission
objectives of MANE mission aren't the primary objectives of the design X-I but the
aircraft under MANE mission would achieve such science goals with on-board
instrumentation.
1.2.MISSION SCIENCE OBJECTIVES:
Extensive study of the Martian atmosphere identifying its key characteristics.
Understand the atmospheric changes, pattern of Martian storms and
atmospheric composition with dust detector and spectrometer.
Perform a radiation analysis of Martian atmosphere
Perform remote sensing of the observation area through a high spatial
resolution on-board camera.
To analyse and create a profile of water (in the form of hydrated minerals,
adsorbed water, or possibly ice at the deepest level) and mineral
abundances near the surface through on-board spectrometer.
Identify key landing sites on Mars for future manned mission by performing a
detailed analysis of the landscape features using 3-D mapping.
1.3.LOCATION OF THE MISSION:
After studying the Maritain Geology and going through the reports of
previous mission to Mars conducted by NASA and Soviet Union[4] ;
Hellas Planitia was chosen for the mission as described through Figure
2.1. It’s a circular crater located at the southern hemisphere of Mars
(42.7°S , 70°E) in Hellas Basin with a crater depth of 7,152 m which](https://image.slidesharecdn.com/mane-missiontomars-151122062011-lva1-app6892/85/Mane-Mission-to-mars-6-320.jpg)
![Page 7 of 78
extends over 2,300km as shown in Figure 2.1 and 2.2. The reason for
choosing Hellas Planitia for the mission was it offers 1,155 Pa of
atmospheric pressure at the bottom which was 89% higher than the
planet’s average. Such high pressure increases the possibility of finding
water in its liquid phase (under Martian temperature). Also the gullies
around it namely: Dao Vallis and Reull Vallis are low into the Martian
crust, making water exist there in its liquid form.
Figure 2.1: Location of Hellas Planitia on Mars[4]](https://image.slidesharecdn.com/mane-missiontomars-151122062011-lva1-app6892/85/Mane-Mission-to-mars-7-320.jpg)
![Page 8 of 78
Figure 2.2: Hellas Planitia extends across about 50° in longitude and more
than 20° in latitude. From data from the Mars Orbiter LaserAltimeter (MOLA) [4]
1.4.ENVIRONMENT:
The Martian atmosphere is the least friendly atmosphere in terms of
design engineering in the solar system. The study here is based around
the Mars Pathfinder Atmospheric Structure Investigation/Meteorology
(ASI/MET) Experiment. The atmospheric density, pressure and
temperature profiles which were observed by the Pathfinder EDL were
compared to the Viking-1 results which are shown in the Figure 2.3.](https://image.slidesharecdn.com/mane-missiontomars-151122062011-lva1-app6892/85/Mane-Mission-to-mars-8-320.jpg)
![Page 9 of 78
Figure 2.3: Atmospheric density and Temperature profile of Martian
Atmosphere with respect to altitude [5]
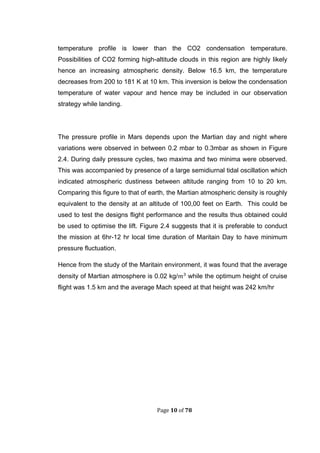
[5]The atmospheric densities measured by the Pathfinder varied from ~5 x
kg/ at the threshold of detection to 8 x kg/ at 9 km. An increase in
density was measured by the Pathfinder MET from 90 to 80 km height, which
was in respect to the temperature minimum. Below 30 km, the Pathfinder
measured lower values of density and pressure which was in consistent to the
lower overall mass and surface pressure of the Martian atmosphere at the time
of Pathfinder landing. A lower atmospheric density requires a higher minimal
velocity to assure steady flight, which in turn infers that we would have higher
power requirements to counteract it. This leads to higher fuel mass and hence
design optimisation through studying the trade-off between various propulsion
engines would be undertaken.
With respect to Martian thermosphere, the temperature increased rapidly with
altitude due to heating by solar ultraviolet radiation which was measured above
125 km. The temperature minimum was measured at 92K at 80 Km. Here the](https://image.slidesharecdn.com/mane-missiontomars-151122062011-lva1-app6892/85/Mane-Mission-to-mars-9-320.jpg)
![Page 11 of 78
Figure 2.4: Time averaged surface pressure measurement by the
MET instrument over 30 days of Pathfinder mission [5]
A pressure, wind and temperature variation was observed during Martian dust
storm. It caused a rhythmic fluctuation in temperature and pressure minimum
and maximum as shown in Figure 2.5. The vortex speed of such storm is quite
high compared to the regular Martian wind and hence mission should be
avoided under such unfavourable circumstances.](https://image.slidesharecdn.com/mane-missiontomars-151122062011-lva1-app6892/85/Mane-Mission-to-mars-11-320.jpg)
![Page 12 of 78
FIG 2.5:Pressure, wind and temperature change associated with
dust devil(storm). [5]
Solar flux density on Mars is 43% in comparison to Earth. This means the solar
cell area required to generate the same power in comparison to Earth would
need to be larger by a factor of 2.3. Such requirements put a constraint on the
availability of solar power as a method of propulsion and hence it was discarded
an option.](https://image.slidesharecdn.com/mane-missiontomars-151122062011-lva1-app6892/85/Mane-Mission-to-mars-12-320.jpg)
![Page 13 of 78
1.5.NASA ARES MISSION:
Under NASA’s Mars Scout Opportunity program; NASA’s Langley
Research Centre teamed with the Jet Propulsion Laboratory, Lockheed
Martin, Aurora Flight Sciences, Charles Stark Draper Laboratory, Malin
Space Science Systems and other academic researchers came with the
idea of Mars Aerial Regional-scale Environment Survey (ARES). The
main objective of the aircraft was to autonomously fly a pre-planned
aerial survey approximately 1.5 km above the surface of Mars with a
variation of <10% over 10 km height and range ≥ 500km in the southern
highlands. It carried scientific instruments like MAG Sensor, Mass
Spectrometer and Mars Observer Camera (MOC) as shown in Figure
2.6. It was designed to fit within 2.65m diameter Viking-derivative aero
shell shape(max. internal diameter of 2.48m) while surviving the G-force,
radiation and thermal environment involved with different aspects of the
mission.[6]
FIG 2.6: ARES Instrumentation[6]](https://image.slidesharecdn.com/mane-missiontomars-151122062011-lva1-app6892/85/Mane-Mission-to-mars-13-320.jpg)
![Page 14 of 78
While designing, the aerodynamic analysis of the aircraft was undertaken to
determine design drivers which was performed using the software VORVIEW.
The input geometry for VORVIEW was generated using Rapid Aircraft Modeller
(RAM) which was developed by NASA Ames Research Centre. Prediction of
maximum lift coefficient (CL max) and drag requires methods which encompass
viscous flow effects. Hence handbook estimates couldn’t explain the unusual
Mach and Reynolds Number found during simulation. The aerofoil section was
estimated using the MSES code developed by Mark Drela of MIT. The 3-D
aerodynamic predictions were undertaken using a non-linear Weissinger
method developed at UC Davis. The final results thus are shown below in
Figure 2.7.[7] These parameters were considered as the benchmark figures on
which the X-I design was optimised and its performances were compared to
these graphs.](https://image.slidesharecdn.com/mane-missiontomars-151122062011-lva1-app6892/85/Mane-Mission-to-mars-14-320.jpg)
![Page 15 of 78
Figure 2.7: Ares performance characteristics as calculated using VORVIEW[7]
In Ares for stowing, spring-loaded folds were considered as they are the
simplest and offer low risk packaging. The main objective and a key design
parameter was to have minimum number of folds to maintain aircraft’s structural
integrity. Both Rogallo type parawing and inflatable wing were considered as a
wing option to accommodate the plane inside the aero shell. The main
drawback for the inflatable wing was its performance under Martian atmosphere
after traversing a year in the cold space environment. Hence the idea was
discarded and a traditional method was chosen.
For Propulsion in ARES, unconventional options were considered because of
the low atmospheric density in Martian atmosphere. Monopropellant fuel was
considered as they carried both fuel and oxidizer on-board In the end, rocket
motors (60N bi-propellant thruster) were considered because of its low risk. The
propeller thrust system risk involves blade sizing to ensure efficiency in low
density Martian atmosphere.](https://image.slidesharecdn.com/mane-missiontomars-151122062011-lva1-app6892/85/Mane-Mission-to-mars-15-320.jpg)
![Page 16 of 78
2. CALCULATIONS
2.1. Considerations:
To generate the principle behind X-I’s flight, an experimental design was
generated using a craft mass of 154 kg. The fuel mass budget thus
allocated was 54 kg with a dry mass of 100 kg. The constant values used
in the calculations were:
Mass: 154 kg
Weight on Mars (W): 562.1 N
Acceleration due to gravity on Mars (g): 3.65 m/ [8]
Average density of Maritain atmosphere at 1.5 km (ρ): 0.02 kg/ [8]
Cruise Flight Height (h): 1.5 km
Drag Co-efficient for the glider configuration: 0.04
Lift Co-efficient for the glider configuration: 0.6
Using NASA’s Mars Atmospheric model at a height of 1.5 km[8],
Temperature (T) = -10.34-0.001217h = -26.73 C = 246.27 K
Pressure at the height (h) = 0.699 x = 611.51376 Pa
Gas constant on Mars = 188.92 J/Kg/K[9]
Gamma ( on Mars = 1.3(as the atmosphere has 95% C
Speed of sound at the height(h) = √ = √ = 245
m/s](https://image.slidesharecdn.com/mane-missiontomars-151122062011-lva1-app6892/85/Mane-Mission-to-mars-16-320.jpg)
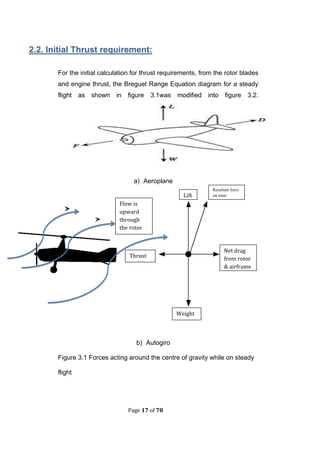
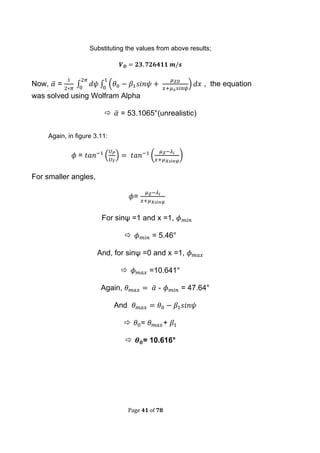
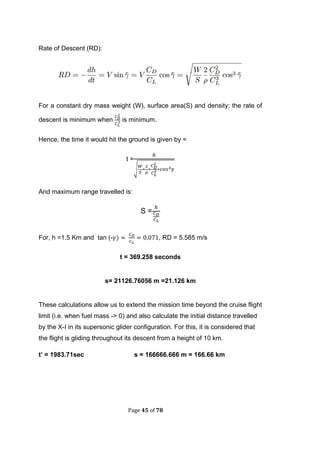
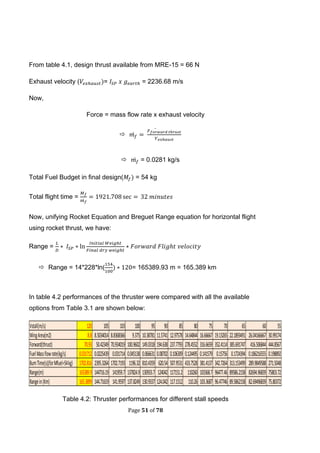
![Page 19 of 78
For a design with total surface area of 10.8 (explained in details in Design
section) an initial calculations was performed to find :
√
/s
Thereafter, the minimum velocity required through the rotor for autorotation was
calculated using the powered lift theorem [8] where was found.
Now resolving this vector, the minimum forward velocity required for the steady
flight could be calculated as shown in figure 3.3.
Figure 3.3
19.939 m/s = x sin(15)
x = 77.03 m/s
Minimum Forward Velocity required for autogyro performance = 74.405 m/s](https://image.slidesharecdn.com/mane-missiontomars-151122062011-lva1-app6892/85/Mane-Mission-to-mars-19-320.jpg)
![Page 20 of 78
Hence the minimum velocity margin is (91.918-74.405) = 17.513 m/s. This
means, the craft is able to generate a lift even it falls below its stall speed up to
74.405 m/s and maintain a forward flight without diving.
Now, total lift force required to be created =
= 0.5 x 0.02 x x 10.8 x 0.6
= 548.22 N
Using a lift-drag ratio of 14:1[9], Drag generated by the aerofoil = 0.071 x 726 N
= 51.546 N
Now applying conservation of momentum in a steady flight as shown in Figure
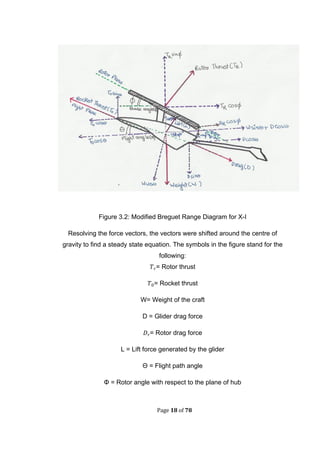
3.2 i.e. Sum of forces in all directions is zero; we have
= 0 ∑ = 0
∑ = 0
+ sinθ + L cosθ= W + Dsinθ +
= ………….(1)
An experimental value for was calculated using Blade Element Theory [9],
where for a flight angle of attack, θ= 5° and Blade angle,
and forward propulsion thrust of 85 N, equation(1) =>
=
( ( ( (
(
= 42.715 N
And](https://image.slidesharecdn.com/mane-missiontomars-151122062011-lva1-app6892/85/Mane-Mission-to-mars-20-320.jpg)
![Page 21 of 78
∑ = 0
……………. (2)
For small flight angles, and rotor blade angle,
Therefore,
For an autogiro, the Drag component of the blade must be equivalent to the
sin component of the rotor thrust in cruise flight. Hence Equation(1) =>
Hence, the forward propulsive thrust requirement is 63 N while the total rotor
thrust required to optimise our design is 42.715 N.
2.3.Rotor Blade Calculations:
Since the maximum rotor area is a function of the fairing size, initial
calculations for the sizing of rotor blade were done considering a pure
helicopter configuration were the required thrust to be generated was
56.351N [+15% margin on ] .The maximum fairing diameter of 4-5
m(figures based on Atlas 5, Ariane 5, Delta rocket fairing sizes) [10] allows
us a maximum rotor area of 16.04 . This is further explained in the
design section. Now,](https://image.slidesharecdn.com/mane-missiontomars-151122062011-lva1-app6892/85/Mane-Mission-to-mars-21-320.jpg)
![Page 22 of 78
Induced velocity, =√ =√
=9.36 m/s
Applying conservation of momentum on the controlled volume:
Thrust = Mass flow rate x 2 x Induced Velocity [from actuator disc theory]
Thrust =
= = 3.01 kg/m/s
Now,
=> = 3.01kg/m/s[Where rdr is the elemental radius of the
actuator disc]
rdr = = 1.131 m
Now integrating both sides with respect to r
∫ ∫
R = 2.26 m
Applying blade element calculation for a two-blade rotor(N=2) and a solidarity
value(s) of 0.1 for a figure of merit of 75% [10]
S = [where c is the chord length]
c = 0.3555 m](https://image.slidesharecdn.com/mane-missiontomars-151122062011-lva1-app6892/85/Mane-Mission-to-mars-22-320.jpg)
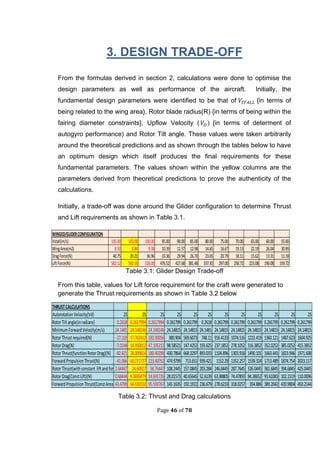
![Page 23 of 78
2.4. ACTUATOR DISC THEORY-AUTOGIRO
Figure 3.4: Velocity Vectors and distribution around the rotor
blade (actuator disc) [9]
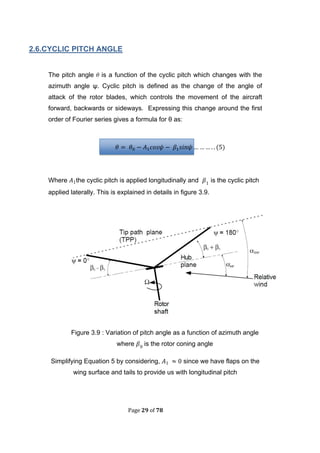
In figure 3.4, the elementary theory of actuator disc is being applied
to an autogiro. Instead of creating a thrust using rotor power, an
autogiro utilises the upward inflow from a horizontal velocity vector
to generate a torque around the disc, which in turns creates the
necessary power required to generate rotor lift. This is explained
through figure 3.5.](https://image.slidesharecdn.com/mane-missiontomars-151122062011-lva1-app6892/85/Mane-Mission-to-mars-23-320.jpg)
![Page 24 of 78
Figure 3.5: Co-ordinate system of the incoming velocity component around
an autogiro blade, where V is the upward velocity vector [9]
The upward velocity vector around the rotor is resolved and vectors are shifted
around the blade plane as shown in Figure 3.5. The design has been optimised
around the maximum available theoritical forward velocity of 120 m/s (a function
of forward thrust and propulsion system) and a disc tilt of 15°. Though , a forward
velocity of 74.405 m/s is required to sustain the autogyro’s lift, the maximum
available velocity in the upward direction is 31.05 m/s [V sin (15)]. Hence the
performances of the design were calculated within 19.9 m/s – 31.05m/s range.](https://image.slidesharecdn.com/mane-missiontomars-151122062011-lva1-app6892/85/Mane-Mission-to-mars-24-320.jpg)
![Page 25 of 78
Figure 3.6: Overall Inflow Velocity around the blade plane[9]
Velocity component parallel to the rotor disc: = V cosϕ = 120 * cos 15
115.911 m/s
Velocity normal to the rotor disc, ϕ - = 21.69 m/s
Hence, Overall Inflow Velocity, V’= √ = 120.364 m/s
For an upward velocity, V perpendicular to the disc plane; V’ tends to be equal to
the total rotor tip velocity. Therefore, ( = 120.36 m/s = Mach 0.5 = ΩR
Where Ω is the angular velocity of the rotor blade = 0.94 rad/s
Normalising the velocity component with respect to tip velocity:
µ = = 0.997 = 0.077
= = 0.96 = = 0.2579
= 0.18](https://image.slidesharecdn.com/mane-missiontomars-151122062011-lva1-app6892/85/Mane-Mission-to-mars-25-320.jpg)
![Page 27 of 78
For an incoming velocity , the blade incoming velocity in the disc plane due to
forward velocity is as explained in Figure 3.8
Figure 3.8 Incoming velocity around a Rotor
Here, for the advancing side is = sinψ +ΩR [to determine total incoming
velocity]
Where ψ is the azimuth angle
For an elemental distance along the rotor blade x, where x =
Ωr = ΩRx =
Therefore,
= ( ) [From normalisation of vector components]](https://image.slidesharecdn.com/mane-missiontomars-151122062011-lva1-app6892/85/Mane-Mission-to-mars-27-320.jpg)
![Page 28 of 78
Again, velocity perpendicular to the blade, [From figure 3.5]
(
= (
Total inflow velocity, √
√( (
= ( ) [ since for
Now, inflow angle, ϕ =
Φ = (
(
(
For small angles, ϕ =
(
(
=
(
………(4)](https://image.slidesharecdn.com/mane-missiontomars-151122062011-lva1-app6892/85/Mane-Mission-to-mars-28-320.jpg)
![Page 30 of 78
From above,
= +(
……………(6)
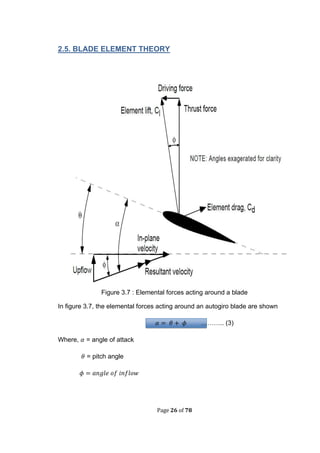
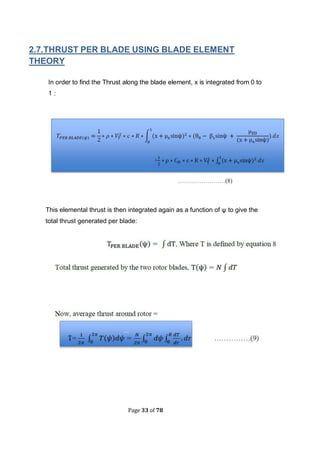
Applying Blade Element Theory to Figure 3.6, the elemental lift and drag forces
on the blade are as shown in figure 3.10:
Figure 3.10: Elemental forces on the blade[9]
From lift equation, dL =
= [ from lift- curve
slope]
And drag equation, dD =](https://image.slidesharecdn.com/mane-missiontomars-151122062011-lva1-app6892/85/Mane-Mission-to-mars-30-320.jpg)
![Page 31 of 78
For ϕ << 1 and a lift to drag ratio of 14:1 [stated above], and applying it on forces
around the blade through resolving of vector components:
dT = dL cosϕ + dD sinϕ
14*1 +1 *0.1
dT +dD
dĤ = dD cosϕ – dL sinϕ
1*1-14*0.1
dĤ 0
Hence no torque is generated by the lift and drag on the blade which explains the
absence of tail rotor in an autogiro to sustain a counter-torque to the forces of the
main rotor blade. The minimum torque generated could be overcome through
pitching the blades at different angles around the rotor hub.
Now, dT = dL + dD
= +
= ( ) ; dr =Rdx and equation (6) substituted in the above
equation
dT= = ( ( +
(
+
( *
……………(7)](https://image.slidesharecdn.com/mane-missiontomars-151122062011-lva1-app6892/85/Mane-Mission-to-mars-31-320.jpg)
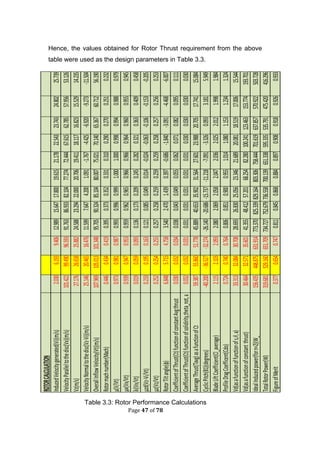
![Page 32 of 78
From experimental verifications of a blade with similar characteristics to that
of the above specified at NASA’s Ames Research Centre and NASA’s Langley
Low-Turbulence Pressure Tunnel (LTPT) under similar atmosphere to
that of Mars; the parameters like drag coefficient
( ( ( were estimated for initial
calculations.[11]
The blades under this experiment were tested at a tip Mach number of 0.65
and a Reynolds number of 50,000 for an Eppler 387 airfoil. A software called
OVERFLOW-D was used for the experimentation by the Research Centre. It
was found that in order to produce a thrust co-efficient greater than 0.1 and a
figure of merit of 0.4; there was a requirement of collective pitch equivalent to
8.4 degrees. While the design of X-I was improvised around a value of 0.6
which corresponds to an angle of attack ( of 5 degrees as shown in figure
3.10.[12] Also, the value of for theoretical evaluation was considered to be
0.04(streamline boy). Hence the value of a( was found to be 0.12 . This
value of collective pitch was used an experimental value to determine the
actual collective pitch through method of substitutive evaluation,
Figure 3.11: Vs α experimental graph for Eppler 387 at a Reynold’s[12]
Number of 60000](https://image.slidesharecdn.com/mane-missiontomars-151122062011-lva1-app6892/85/Mane-Mission-to-mars-32-320.jpg)
![Page 35 of 78
From initial calculations, let the average thrust required to be generated from the
Rotor = Average thrust required to maintain autogyro rotation = 56.351 N =
Substituting this into equation 11:
56.351 = 20.7944-0.96
=> =-37.03°
Hence, the non-dimensional thrust coefficient,
= 0.02424
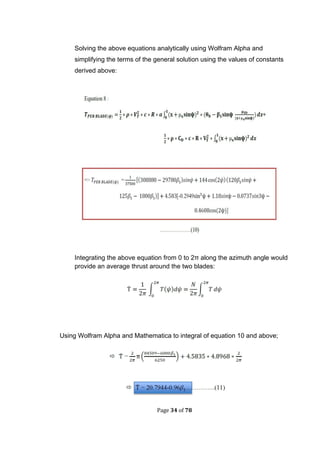
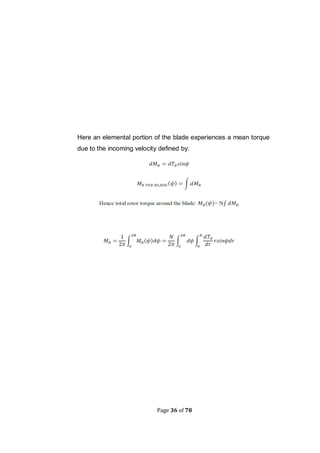
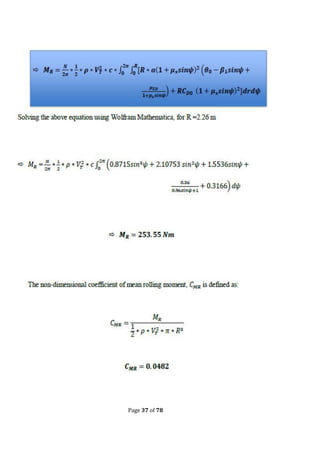
2.8. MEAN ROLLING MOMENT
The mean rolling moment experienced by the blade is explained in Figure
3.12
Figure 3.12: Mean Rolling Moment around a blade[9]](https://image.slidesharecdn.com/mane-missiontomars-151122062011-lva1-app6892/85/Mane-Mission-to-mars-35-320.jpg)
![Page 38 of 78
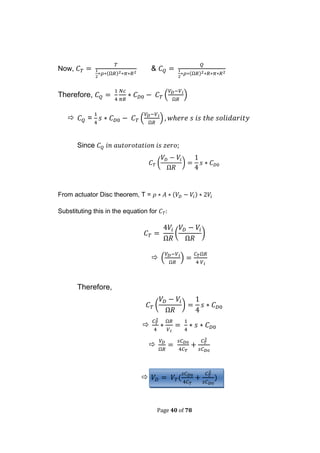
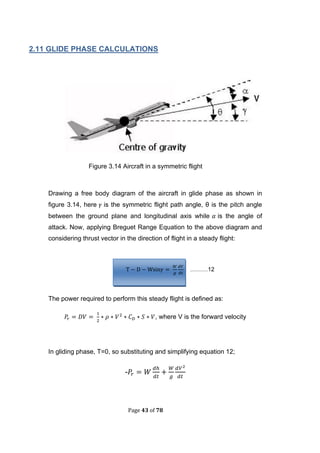
2.9. AUTOROTATION AND MINIMUM VELOCITY
CALCULATIONS
Figure 3.13: Elementary forces around a blade while autorotation[9]
When undergoing autorotation, a blade performs on the thrust generated due to
the downward movement of the craft because of its weight. This thrust
provides the necessary lift to maintain a steady rate of descent without
undergoing stall, which is the same principle used in an autogiro. This is
explained through figure 3.13](https://image.slidesharecdn.com/mane-missiontomars-151122062011-lva1-app6892/85/Mane-Mission-to-mars-38-320.jpg)
![Page 39 of 78
From elemental Lift equation, dL = ( (
dT = ( ( )
dT = ( (
T = ∫ (
T = (
Now, dĤ = dD-dLφ = ( (
( )
dQ = r* dĤ =
( )
Q= N ∫
(
] *
Here, Thrust (T) =
(
]
Therefore, Q =
(](https://image.slidesharecdn.com/mane-missiontomars-151122062011-lva1-app6892/85/Mane-Mission-to-mars-39-320.jpg)
![Page 49 of 78
4.PROPULSION SYSTEM
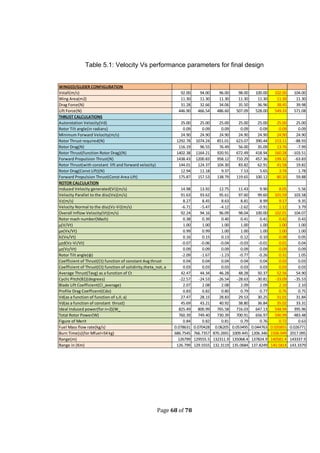
The requirement of propulsion system for the chosen configuration from Table 3.2
was in the range of 43 N – 100N. Propeller driven propulsion was discarded in
the initial phase due to the complexity in stowing arrangement. Electric
Propulsion proved insignificant because of their low thrust performance (20mN-
90mN). Hence it was decided that in order to meet the forward propulsive thrust
requirement, options of chemical thrusters would be the most suitable option for
X-I design. Thrusters were considered from EADS Astrium as well as Northrop
Grumman[13]. These options along with the fuel alternatives like cold gas,
monopropellant, bi-propellant were considered which is shown in details in table
4.2.
Storage of Bi-propellant fuel proved to be design constraint to the X-I fuselage as
it reduces the amount of total fuel which could be carried in the mission while
imposing external constraints on tank volumes. Hence the final choice of
propellant was chosen to be Mono-propellant Hydrazine thruster. Northrop
Grumman through its MRE-15 thruster met the requirements of X-I mission [14],
hence was considered as the final choice of thruster type. The characteristics as
well as performance data of MRE-15 thruster is as shown below in the table
Table 4.1: MRE-15 Technical Data[14]](https://image.slidesharecdn.com/mane-missiontomars-151122062011-lva1-app6892/85/Mane-Mission-to-mars-49-320.jpg)
![Page 50 of 78
Component type
Descripti
on/
Designati
on Mass I_sp
Inlet
pressure Thrust
Valve
(+heater)
power
accumulated
burn life
Length
(max)
Diameter
(max)
Mixing
ratio
(1) Mono-
prop
(2) Bi-
prop
(3) Cold-
gas
Propella
nt Oxidiser
V(exhaus
t)
per piece per piece per piece
OX /
PROP
[kg] [s] [bar] [N] [W] [hours] [mm] [mm] (m/s)
BI
Astrium 400N Bi-Propellant Engine
Model
S400-12 3.6 318. 10. 420. 35. 8.3 503. 248. 1.65 2. MMH
(N2O4,
MON-1,
MON-3) 3119.58
BI
Astrium
400N Bi-Propellant Engine
Model
S400-15 4.3 321. 10. 425. 35. 12.8 669. 316. 1.65 2. MMH
(N2O4,
MON-1,
MON-3) 3149.01
BI
Astrium
10N Bi-Propellant Thruster
(single Seat Valve) 0.35 291. 10. 70. 158.5 103. 1.65 2. MMH
(N2O4,
MON-1,
MON-3) 2854.71
MONO
AMPAC In-Space Propulsion
MONARC-
445 1.6 235. 445. 410. n/a 1. N2H4 n/a 2305.35
MONO
AMPAC In-Space Propulsion
MONARC-
90 1. 235. 90. 300. n/a 1. N2H4 n/a 2305.35
MONO
Astrium
400N Hydrazine Thruster 2.7 214. 400. 0.485 325. n/a 1. N2H4 n/a 2099.34
MONO
Astrium
20N Hydrazine Thruster 0.395 224. 20. 10.500 195. n/a 1. N2H4 n/a 2197.44
MONO
Astrium
1N Mono-Propellant Thruster 0.29 220. 1. 15.9 50.000 172. 30. n/a 1. N2H4 n/a 2158.2
COLD GAS
Moog
0.12N GN2Thruster
Solenoid
Actuated
58E142A 0.016 57. 6.9 0.12 16,666.667 n/a 3. GN2 n/a 559.17
COLD GAS
Moog
3.5N GN2Thruster
Solenoid
Actuated
58-118 0.022 71.5 14.82 3.5 16,666.667 n/a 3. GN2 n/a 701.415
BI
Astrium
22N Bipropellant Thruster 0.65 290. 22. 212. 55. 2. MMH MON 2844.9
BI
Northrop Grumman
Dual Mode Liquid Apogee Engine TR-308 322. 6.719 0. 0. 1. 2. N2H4 N2O4 3158.82
BI
Northrop Grumman
High Performance Dual Mode Liquid
Apogee Engine
TR-312-
100YN 330. 35. 6.944 0. 0. 1.06 2. N2H4 N2O4 3237.3
MONO-85N
Northrop Grumman
Monopropellant Thruster MRE-15 1.1 228. 66. 72. 318. 119. n/a 1. H2H4 n/a 2236.68
Table 4.2: Options for Thrusters and their specifications](https://image.slidesharecdn.com/mane-missiontomars-151122062011-lva1-app6892/85/Mane-Mission-to-mars-50-320.jpg)
![Page 52 of 78
5.FINAL DESIGN GENERATION
For the initial phase of concept generation, alternative designs of rectangular, v
shaped as well as delta wings were considered. The aircraft in initial glide stage
required to undergo speed up to Mach 3 while the autogiro requirement speed
was of Mach 0.50. Delta wings have been known to be effective under such flight
regime compared to rectangular wings. Concepts were generated to
accommodate both delta wing with a convertible wing section were the slats of
the wing could be transformed into the rotor blades. This was done in order to
accommodate the design within the aero shell constraints instead of having a
typical autogyro/rotor craft configuration with separate body and rotors. Further
study into NASA’s Mars Ares Mission[15] suggested that delta wing can sustain
better performance under stowing compared to rectangular wings and bluff
bodies in terms of fuselage structural integrity. The concept of X-I was initially
generated as figure 5.1.
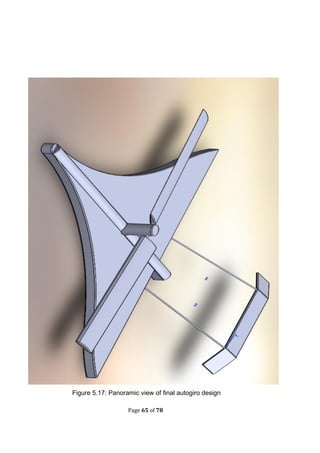
Figure 5.1: Concept Generation of X-I](https://image.slidesharecdn.com/mane-missiontomars-151122062011-lva1-app6892/85/Mane-Mission-to-mars-52-320.jpg)
![Page 53 of 78
From inputs from the initial calculations as shown in section 2, the wing half span
had to match the rotor blade radius in order to maintain structural symmetry to
minimise wingtip vortices. Hence, the half span for the design formed the chief
dimensional parameter(Y = 2.26m). The sweep angle was decided to be 30° in
order to sustain a delta wing formation. A wing tip chord (B) was chosen to be
equivalent to the blade chord length of 0.35 m. The design requirement provided
with a constraint to have a minimum wing surface area of 8 to 15 and
hence, an online tool called Aircraft Center of Gravity Calculator[15] was used to
generate rough dimensional figures to accommodate this surface area
requirement as shown in figure 5.2 and figure 5.3. These values formed the
foundation for the final design of X-I.](https://image.slidesharecdn.com/mane-missiontomars-151122062011-lva1-app6892/85/Mane-Mission-to-mars-53-320.jpg)
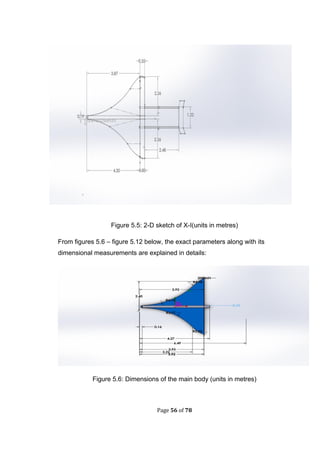
![Page 54 of 78
Figure 5.3: Identification of dimensional parameters from concept
generation-Glider (distances in metres) [15]](https://image.slidesharecdn.com/mane-missiontomars-151122062011-lva1-app6892/85/Mane-Mission-to-mars-54-320.jpg)
![Page 55 of 78
Figure 5.4: Identification of dimensional parameters from concept
generation-Autogyro (distances in metres) [15]
The values thus obtained from the Centre of Gravity calculator were then
transformed into a rough sketch as shown in Figure 5.5 using SolidWorks 2013.
As Fig 5.5 shows, some parameters were twirled to maintain structural symmetry.
Also to calculate the optimum CG for the design, an average of CG, NP and MAC
was taken in the generation of the final design. This sketch was used as the
foundation for generating the individual components of the autogiro.](https://image.slidesharecdn.com/mane-missiontomars-151122062011-lva1-app6892/85/Mane-Mission-to-mars-55-320.jpg)
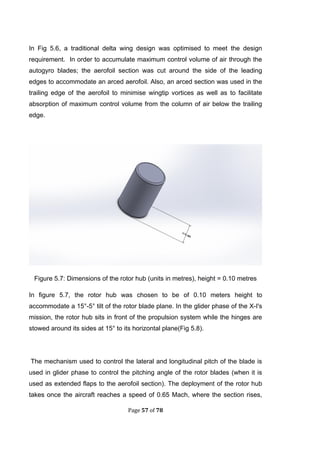
![Page 58 of 78
rotates by 90° and slides over the cylindrical central fuselage as shown in figure
5.14. The fillet section around the fuselage in the SolidWorks assembly
represents the tracks along which the hub slides over the fuselage. It moves
forward and sits on an extruded hole section (located behind the centre of gravity)
to maintain the nose tip high in air with respect to the central plane of the aircraft
(as shown in Figure 5.18). This is done to optimise as explained in figure 3.13.
Such kind of alignment ensures a steady rate of ascent which is explained in
details in the observation strategy section.
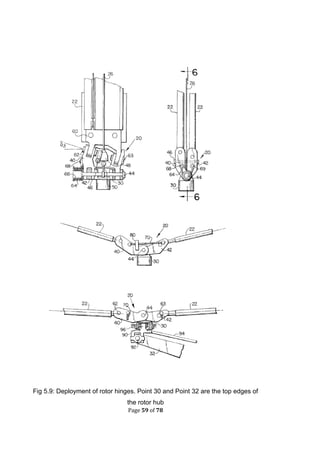
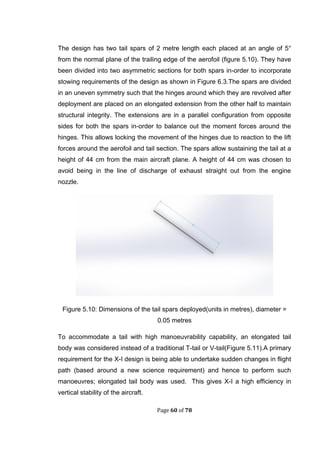
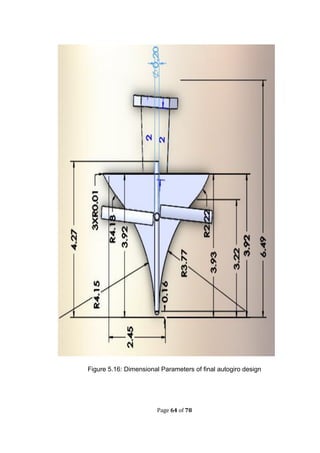
Figure 5.8: Dimensions of the rotor hinges (units in metres), radius = 0.02 metres
The rotor hinges used in X-I design are based on the deployable rotor invented
by Richard H. Hollrock from Kaman Aerospace Corporation [16]. Figures 5.9
explain the deployment of the rotor hinges with the blades attached to its free
end 22.](https://image.slidesharecdn.com/mane-missiontomars-151122062011-lva1-app6892/85/Mane-Mission-to-mars-58-320.jpg)
![Page 67 of 78
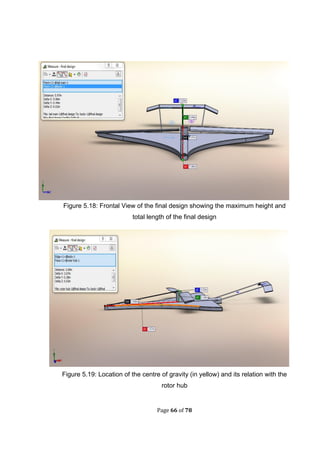
Figure5.20: Final design Wing Area estimation and characterisation of
ideal Centre of Gravity (CG), Aerodynamic Centre (AC) and Neutral Point
(NP)[15]
A final calculation based study was done to investigate the fluctuation of
performance parameter as a function of flight velocity. The range was considered
from Vstall to 104 m/s(maximum cruise velocity). The final range as a function of
cruise velocity and thrust requirement is shown in Table 5.1.](https://image.slidesharecdn.com/mane-missiontomars-151122062011-lva1-app6892/85/Mane-Mission-to-mars-67-320.jpg)
![Page 69 of 78
6. STOWING CONFIGURATION
During the descent into the Martian atmosphere, the X-I is stowed within an aero
shell to protect it from re-entry heat. The descent strategy used in its mission is
similar to that of NASA’s Pathfinder and Mars rover mission. The aero shell
enters the Martian atmosphere at angle of -13° and supersonic parachutes are
deployed to slow the craft down. At an approximate height of 15 km above the
surface, the bottom cover of the aero shell is jettisoned and the wings of X-I are
deployed. At a height of 12 km above the surface, the top half of the aero shell
separates from the main aircraft through an explosion of mortar canister and then
a drogue chute is deployed to slow down the aircraft to a lower Mach speed(<1)
and continue its flight in a glider configuration from until it reaches a speed of 0.5
Mach. At this speed, the rotor hub transforms vertically and slides over the
fuselage into the designated hole in the fuselage while the blades are being
deployed along with it. This would cause structural imbalance in the craft and the
thrusters would be initiated to overcome this imbalance. Thereafter it continues in
a flight as explained in the above sections. In order to describe the descent
sequence of events, Fig 6.2 is used which is the deployment sequence of Ares
Mars Mission whereas Fig 6.1 describes the stowed configuration within the aero
shell.[17]
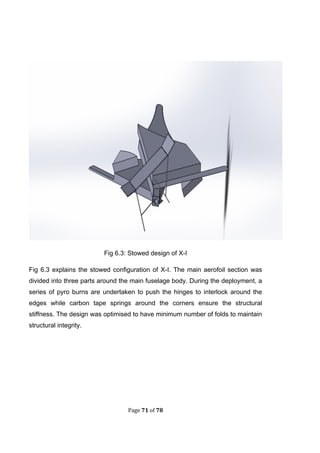
Fig 6.1: X-I stowed in the aero shell with the dimensional parameters of the shell](https://image.slidesharecdn.com/mane-missiontomars-151122062011-lva1-app6892/85/Mane-Mission-to-mars-69-320.jpg)
![Page 70 of 78
Fig 6.2: Descent strategy of X-I based on the Ares entry strategy[7]](https://image.slidesharecdn.com/mane-missiontomars-151122062011-lva1-app6892/85/Mane-Mission-to-mars-70-320.jpg)
![Page 72 of 78
. ONBOARD SCIENCE INSTRUMENTS
8.1. DUST DETECTOR
The dust environment of the Mars and the Martian atmosphere are of great
interest especially its summer dust storms. The prospect of future Martian
manned mission lies on the study of the effects of such storm on
Martian weather as well as the actual composition of the particles of
dust. This would allow creating a profile of the Martian atmosphere and
implementing the findings for future Martian missions and descent
strategies. The dust detector used in MARE is a Piezo Dust Detector (PDD)
. It performs consistent dust monitoring for better understanding of dust migration
patterns on the Mars through direct detection of particle impacts. The PPD is
a modular, miniaturized in-situ measurement device. The modular design
allows an addition of detector units to increase the sensor surface or measure
impacts on multiple spacecraft surfaces. The detector has a low mass, low power
consumption, low data rate and small size. This flexible design makes the PDD
easy to accommodate on the spacecraft.
The detector will provide physical parameters of impacting dust and debris
particles such as velocity, mass and impact energy. The size of detectable
particles will be in the range of 1 µm to 1 mm at a velocity of up to 10 km/s. [18]
Parameter Value
Mass 0.5 kg
Power (Operating) 3 W
Data Volume 36 MB/orbit
Table .1: Specifications for the Piezo Dust Detector (PDD)](https://image.slidesharecdn.com/mane-missiontomars-151122062011-lva1-app6892/85/Mane-Mission-to-mars-72-320.jpg)
![Page 73 of 78
Figure .1: CAD model of Piezo Dust Detector (80mm x 40mm x 40 mm)
.2.SPECTROMETER
The primary science goal of MARE is to analyse and create a profile of
minerals as well as water near the surface of Mars. This is achieved with the
use of The Chandrayaan-1 X-ray spectrometer (C1XS) w h i c h w a s
designed to measure absolute and relative abundances of major rock-
forming elements (principally Mg, Al,Si, Ca, Ti and Fe) in the lunar crust with
spatial resolution 25 km for India’s Lunar mission.[19] The C1XS
spectrometer was designed by the Rutherford Appleton Laboratory (RAL) for
the Indian Space Research Organisation (ISRO) Chandrayaan-1 lunar
mission and launched in 2008. The following instrument has been chosen
as it’s the latest space proven spectrometer.](https://image.slidesharecdn.com/mane-missiontomars-151122062011-lva1-app6892/85/Mane-Mission-to-mars-73-320.jpg)
![Page 74 of 78
Figure .2: CAD image of the C1XS Instrument showing coalligned front
detectors, deployable radiation shield and 140◦field-of-view.
Parameter Value
Mass 5.56 kg
Power (Operating) 25.5 W
Spatial Resolution 25 km
Table .2: Specifications for the The Chandrayaan-1 X-ray Spectrometer
(C1XS)
.3. RADIATION ASSESSMENT DETECTOR:
The Radiation Assessment Detector (RAD) is an energetic particle
detector designed to measure a broad spectrum of energetic particle
radiation. [20] It is a lightweight and energy efficient passive detector which
acquires radiation data from Galactic Cosmic Rays (GCRs) and ionised
particles from Coronal Mass Ejection (CMEs). The acquired information will
be used to assess the potential radiation hazard for future Mars manned
missions and Mars based colonies; and how the radiation dosage effects
the spacecraft subsystems during the entry phase.](https://image.slidesharecdn.com/mane-missiontomars-151122062011-lva1-app6892/85/Mane-Mission-to-mars-74-320.jpg)
![Page 75 of 78
The RAD combines both charged and neutral particle detection
capability over a wide dynamic range in a compact, low mass, low power
input.
.4. 3-D TERRAIN MODELLING
Modern cartography and geological studies rely on satellite data to
enhance our knowledge of morphology. When planning to build scientific bases
on extra-terrestrial ground, a deep study on landing and construction site
requires to be done. By using information about the altitude of each point in
the ground a more useful map can be generated.
A secondary goal of the MARE mission is to reconstruct terrain morphology.
Commonly a combination of high-resolution satellite images and Digital Elevation
Models (DEM) are used to produce this. [21] DEMs contain information about the
relative altitude of each pixel in a picture. From this a 3D surface resembling the
actual terrain can be produced. An imaging algorithm then carries out a warp and
match to combine the high-resolution pictures with the 3D model to create a
virtual terrain.
To generate 3D images of the Martian surface, two instruments are required.
For MARE, apart from the onboard high resolution camera; t h e r e i s a n o t h e r
i n s t r u m e n t c a l l e d the InterFerometric Synthetic Aperture Radar (IFSAR)
system. IFSAR uses a method called phase interferometry to obtain a pair of high
resolution radar images needed to generate DEMs.[22] IFSAR images are
obtained by using a stereo configuration i.e., two instruments pointing on the
same target on the ground are mounted at a fixed distance on the spacecraft.
The expected total system mass is 1.6 kg.[23] This is highly reliable and
being a radar it can select the desired wavelength to be used and observe other
features rather than obtaining just an elevation map (crater composition,
minerals, etc).](https://image.slidesharecdn.com/mane-missiontomars-151122062011-lva1-app6892/85/Mane-Mission-to-mars-75-320.jpg)
![Page 76 of 78
. . CAMERA
The Mars Orbiter Camera (MOC) was a camera developed for NASA’s
Mars Observer mission. It has three elements primary components: A
narrow angled camera having the capability to take images of very high
spatial resolution (1.4 m per pixel) and two wide angled cameras which
has various functionalities like global imaging, geodesy etc.[24] It is 80 cm
in length and 40 cm in diameter. This camera has been chosen as it has
proven its technological capability by being used in previous Mars mission
(Mars Observer and Ares Mission). It has a mass of approximately 10 kg
and the structure and the material of the camera is explained via figure 8.3
Figure 8.3: Components of the MOC](https://image.slidesharecdn.com/mane-missiontomars-151122062011-lva1-app6892/85/Mane-Mission-to-mars-76-320.jpg)
![Page 77 of 78
CONCLUSION
The study done in the report is only a beginning to accomplish a successful rotor-
wing based exploration mission to Mars. Technical issues like vibration test,
deployment test, drop test, aerofoil performance test in wind tunnel under
simulated Martian conditions, stowing configuration optimisation, wing aerofoil
optimisation, control systems definition etc. needs to be undertaken to make a
matured technical approach to the concepts in comparison to other available
options as studied under NASA’s Mars Scout Mission Program namely MARV
and GTMARS[25].
The final range of X-I is derived using the Newtonian laws of motion in a glider-
autogiro-glider configuration. The autogiro with a final cruise velocity of 102 m/s
has a maximum range of 140 km. The final glider phase allows the mission to be
extended further 21 km. In-order to calculate the initial distance covered in the
initial glider configuration, an initial velocity of Mach 1 was considered which is
decreased over to Mach 0.5 thereafter which the rotor blades are deployed. This
is shown in details in the figure below
10 km
1.5 km 1.5 km
0.010
2
4
6
8
10
12
0 108 1506.04 1875.298 time->
height
Glider from t=0 - t=1875
autogiro t=108
glider from t = 1506
Final Observational Plan for X-I](https://image.slidesharecdn.com/mane-missiontomars-151122062011-lva1-app6892/85/Mane-Mission-to-mars-77-320.jpg)
![Page 78 of 78
Now using the two laws of linear motion:
S =Ut +
V = u+at
S initial gliger = 31 km.
Total flight distance = 31+140.58+21 = 192.53 km
Comparing the concept of X-I to NASA’s Ares mission, which is its main
competitor, the above described aircraft has a capability of performing a <200 km
range(glider-autogiro-glider configuration) within a flight time of <1 hour while the
Ares can perform a 500+km range in a similar flight period. The X-I wet mass is
21 kg lower than that of Ares while its stowed structure could be fitted within a
2.5m diameter aeroshell; while X-I needs to be within a 5 m diameter aeroshell
(due to single structure of rotor blades) . Further optimisation of stowing
mechanism could bring this diameter constraint down to a region of 2.5 m –
3m(function of the blade length). Further the range could be optimised if the
thruster are operated around a low frequency duty cycle(pulses) instead of single
stage burn. Approximation based around Ares mission data[15] suggests the
mission duration could be increased substantially by a factor of 10%-15% .
However X-I design has greater ability to perform manoeuvring than ARES due to
external stability at slower speeds. As well in this study, the contingency in design
constraints were quite high which led to such conclusion with respect to ARES
mission .
Hence, the mission doesn’t meet the optimum range capabilities as compared to
that of NASA ARES mission, but it displays an opportunity to use a transformable
wing aircraft in Mars and achieve greater performances in stability and flight
control at the cost of greater observational range. Similar design could be
applied to high altitude drones, where the primary requirement of the aircraft is to
fly at lower speeds with capability of performing sudden manoeuvres. Hence
through this project, a new configuration of flight was discussed and it was finally
concluded that such a design is practically possible of performing a steady flight
while experimental tests as described above would make the design realistic.](https://image.slidesharecdn.com/mane-missiontomars-151122062011-lva1-app6892/85/Mane-Mission-to-mars-78-320.jpg)
![REFERENCES
1] „UAV mission design for the exploration of Mars‟;ESA/EUROAVIA DESIGN
WORKSHOP 2006;EUROAVIA
2] „Evolution of a mars airplane concept for the ares Mars scout mission‟; Mark D
Guynn and Mark A Croom; NASA Langley Research Center; American Institute
of Aeronautics and Astronautics
3] „Rotorcraft as Mars Scouts‟, G A Briggs, Center for Mars Exploration (CMEX),
NASA Ames Research Centre, NASA
4] „http://www.nasa.gov/mission_pages/mars/missions/‟,
„http://www.russianspaceweb.com/spacecraft_planetary_mars.html‟, Accessed on
March/2013
5] „The Mars Pathfinder Atmospheric Structure
Investigation/Meteorology(ASI/MET) Experiment; J.T. Schofield, J R Barnes;
NASA Ames Research Centre; NASA
[6] „Evolution of a Mars airplane concept for the ARES Mars Scout Mission; Mark
D Guynn , Mark A Croom; NASA Langley Research Center; NASA
[7] „Evolution of a Mars airplane concept for the ARES Mars Scout Mission; Mark
D Guynn , Mark A Croom; NASA Langley Research Center; NASA; AIAA 2003-
6578
[8] http://nssdc.gsfc.nasa.gov/planetary/factsheet/marsfact.html; NASA; Accessed
on March/2013
[9] „Blade Element Theory‟ ; Powered Lift lecture notes; Dr. Scott J I Walker;
University of Southampton
[10] „Aerodynamic design of helicopter‟; Basic Helicopter Aerodynamics; pg 286;
John Seddon and Simon Newman; Wiley](https://image.slidesharecdn.com/mane-missiontomars-151122062011-lva1-app6892/85/Mane-Mission-to-mars-79-320.jpg)
![[11] „Computational Analysis of a Protoype Martian Rotorcraft Experiment‟; Kelly
J. Corfeld; Department of Aerospace Engineering; The Pennyslvania State
University; NASA; AIAA-2002-2815
[12] „Computational Analysis of a Protoype Martian Rotorcraft Experiment‟; Kelly
J. Corfeld; Department of Aerospace Engineering; The Pennyslvania State
University; NASA; AIAA-2002-2815
[13] http://cs.astrium.eads.net/sp/spacecraft-propulsion/hydrazine-
thrusters/index.html ; EADS; Accessed in March 2013
[14] http://www.northropgrumman.com
/Capabilities/PropulsionProductsandServices
/Pages/MonopropellantThrusters.aspx; Northropgrumman; Accessed in March
2013
[15] „Aircraft Centre of Gravity Calculator‟; http:// adamone.rchomepage.com
/cg_calc.htm;
[16] „Deployable Rotor‟;Richard H Hollrock; US Patent Classification:
416/142; 244/138.00A; 244/138.00R
[17] „ ARES MISSION OVERVIEW- Capabilities and Requirements of the Robotic
Aerial Platform‟; Henry Wright, Robert Braun; NASA Langley Research Centre;
AIAA 2003-6577
[18] (PDD) : a modular miniaturized In-situ measurement instrument
for dust research.; A. Wolf, R. Laufer, G. Herdrich, T.W. Hyde, Piezo
Dust Detector; CASPER (Center for Astrophysics, Space Physics
and Engineering Research), 43rd Lunar and Planetary Science
Conference (2012)
[19] ”The C1XS X-ray Spectrometer on Chandrayaan-1”; M. Grandea,
B.J. Maddison, C.J. Howe, B.J. Kellett; in Journal of Planetary and
Space Science, Vol. 57, Issue 7, June 2009, page 717-724
[20] The Radiation Assessment Detector (RAD) Investigation, D.
M.Hassler et al.; Space Sci Rev (2012) 170:503:558 DOI](https://image.slidesharecdn.com/mane-missiontomars-151122062011-lva1-app6892/85/Mane-Mission-to-mars-80-320.jpg)
![0.1007/s11214-012-9913-1, 14 July 2012, available online:
http://link.springer.com/article/10.1007% 2Fs11214-012-9913-1
[21] D. M. Winker, W. Hunt & C. Hostetler, “Status and
performance of the CALIOP lidar,”proceedings of SPIE,
2004,available online from http://ccplot.org /pub/resources /CALIPSO
/Status%20and% 20performance%20of%20the%20CALIOP%20lidar.pdf
[22] M. A. Richards, “A Beginner‟s Guide to Interferometric SAR Concepts and
Signal Processing,” published in IEEE A&E Systems Magazine, 9 Sept 2007,
vol. 22, no. 9, pp. 5-29
[23] Olsen Technology, Inc., “Satellite Plus L-Band Optical Transport,” available
online from http://www.olson-technology.com/l-band.html
[24] Mars Orbiter Camera, Malin Space Science System,
http://www.msss.com/all_projects/mgs-mars-orbiter-camera.php;
accessed on March 2013
[25] Vertically Planetary Aerial Vehicles: Three planetary bodies and four
conceptual design case; Larry A Young; NASA Rotorcraft Division;
NASA;](https://image.slidesharecdn.com/mane-missiontomars-151122062011-lva1-app6892/85/Mane-Mission-to-mars-81-320.jpg)

The document presents a comprehensive design proposal for the Mars Autogyric Neutroscopic Explorer (X-I), a rotorcraft UAV aimed at investigating water presence on Mars utilizing neutron spectrometry. It details the mission's objectives, environmental considerations, the NASA Ares mission framework, and design optimization challenges stemming from Mars' thin atmosphere. Key features include extensive calculations to ensure stability and performance, highlighting the need for unique propulsion methods and structural adaptability for successful operation on the Martian surface.


![1010 woolsey[1]](https://cdn.slidesharecdn.com/ss_thumbnails/qtowjnbcsb6xtwzj83vj-signature-3e49a9720aafd161ec5213fc5cb0fac76e0a38578f2089fb876ad1cc6de4bad4-poli-140825181335-phpapp01-thumbnail.jpg?width=640&height=640&fit=bounds)


