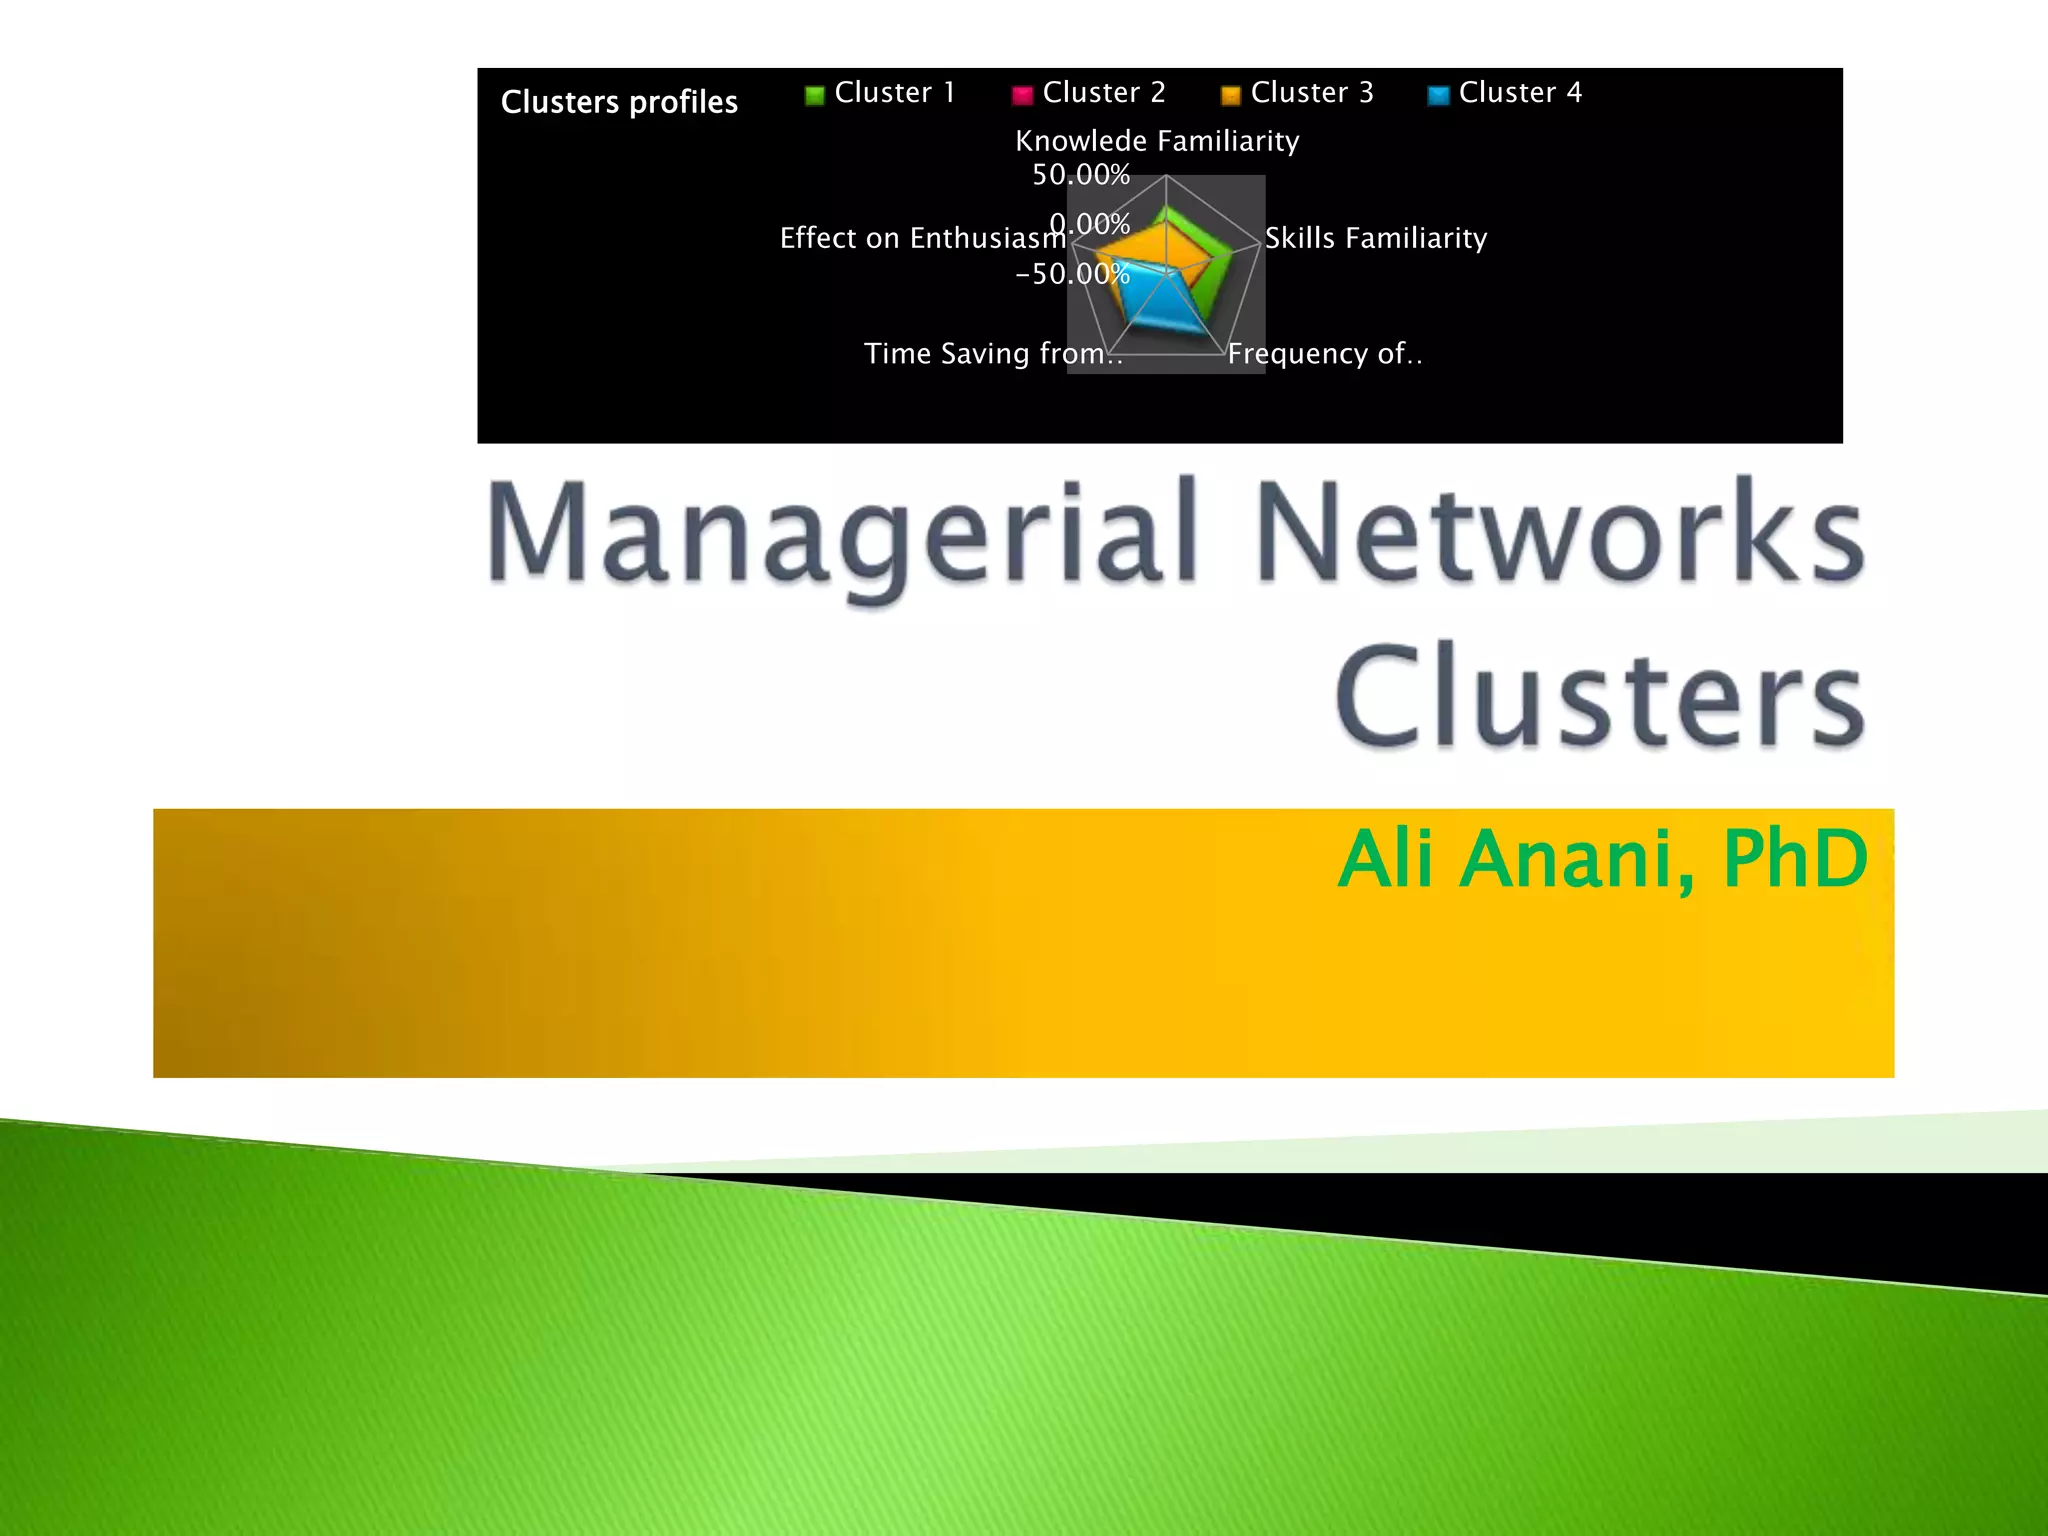
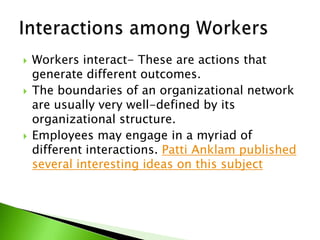
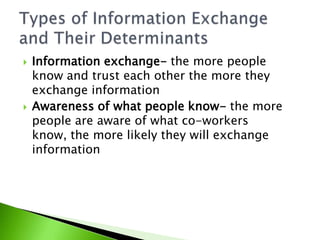
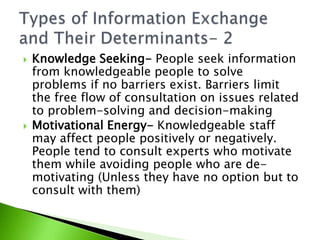
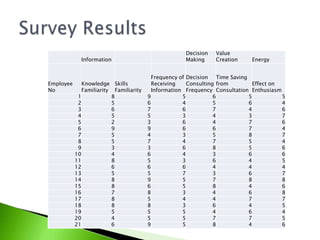
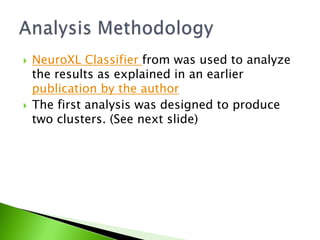
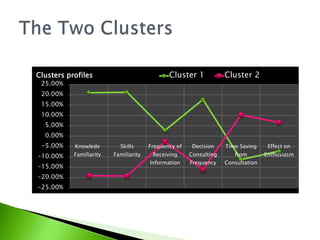
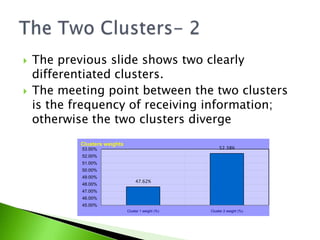
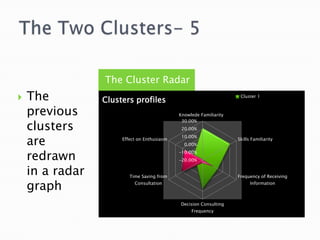
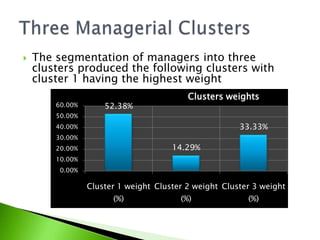
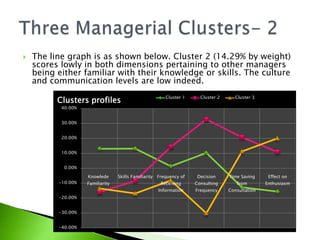
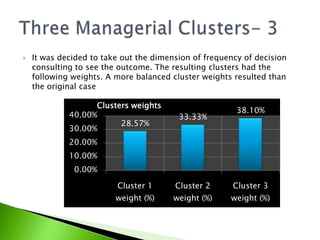
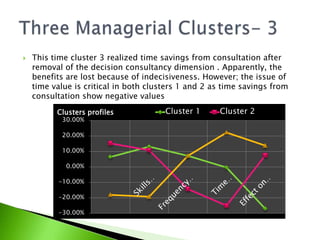
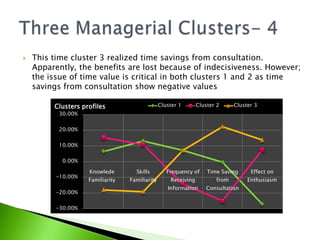
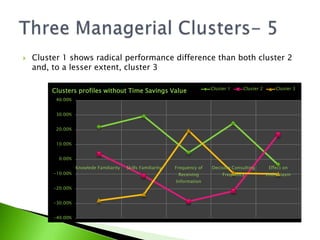
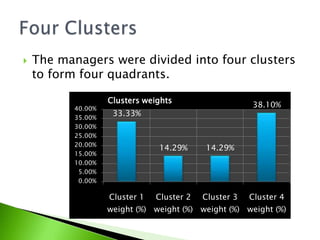
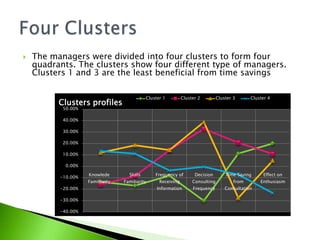
Managerial Networks ClustersAli Anani, PhD
Workers interact- These are actions that generate different outcomes.The boundaries of an organizational network are usually very well-defined by its organizational structure.Employees may engage in a myriad of different interactions. Patti Anklam published several interesting ideas on this subjectInteractions among Workers
Information exchange- the more people know and trust each other the more they exchange informationAwareness of what people know- the more people are aware of what co-workers know, the more likely they will exchange informationTypes of Information Exchange and Their Determinants
Knowledge Seeking- People seek information from knowledgeable people to solve problems if no barriers exist. Barriers limit the free flow of consultation on issues related to problem-solving and decision-makingMotivational Energy- Knowledgeable staff may affect people positively or negatively. People tend to consult experts who motivate them while avoiding people who are de-motivating (Unless they have no option but to consult with them)Types of Information Exchange and Their Determinants- 2
A sample of twenty one managers was taken randomly for a middle-sized companyFace to face interviews and written surveys produced the results shown in the next tableThe dimensions taken are the same as discussed in the preceding slidesA Case Study
Survey Results
NeuroXL Classifier from was used to analyze the results as explained in an earlier publication by the authorThe first analysis was designed to produce two clusters. (See next slide)Analysis Methodology
The Two Clusters
The previous slide shows two clearly differentiated clusters.The meeting point between the two clusters is the frequency of receiving information; otherwise the two clusters divergeThe Two Clusters- 2
In Cluster 1, managers are familiar with who has information and the skills to consult with. However; peer managers are hesitant to seek their advise because these managers do not either motivate their peers or save them time. This realization apparently led to the low frequency of information exchangeThe Two Clusters- 3
Cluster 2 compromises managers whose common profile is being low in the familiarity of the knowledge and skills of their peers and are not seekers of opinion to make decision. However; they benefit from the time savings they get from their peers and of the enthusiasm they get from these activitiesThe Two Clusters- 4
The Two Clusters- 5The Cluster RadarThe previous clusters are redrawn in a radar graph
The segmentation of managers into three clusters produced the following clusters with cluster 1 having the highest weightThree Managerial Clusters
The line graph is as shown below. Cluster 2 (14.29% by weight) scores lowly in both dimensions pertaining to other managers being either familiar with their knowledge or skills. The culture and communication levels are low indeed. Three Managerial Clusters- 2
It was decided to take out the dimension of frequency of decision consulting to see the outcome. The resulting clusters had the following weights. A more balanced cluster weights resulted than the original case Three Managerial Clusters- 3
This time cluster 3 realized time savings from consultation after removal of the decision consultancy dimension . Apparently, the benefits are lost because of indecisiveness. However; the issue of time value is critical in both clusters 1 and 2 as time savings from consultation show negative valuesThree Managerial Clusters- 3
This time cluster 3 realized time savings from consultation. Apparently, the benefits are lost because of indecisiveness. However; the issue of time value is critical in both clusters 1 and 2 as time savings from consultation show negative valuesThree Managerial Clusters- 4
The impact of time savings resulting from consultation prompted repeating the cluster analysis without this factor. The weights of the three clusters emerged as follows. Interestingly, the same weights for leaving decision data, but are reshuffled Three Managerial Clusters- 5
Cluster 1 shows radical performance difference than both cluster 2 and, to a lesser extent, cluster 3Three Managerial Clusters- 5
The managers were divided into four clusters to form four quadrants. Four Clusters
The managers were divided into four clusters to form four quadrants. The clusters show four different type of managers. Clusters 1 and 3 are the least beneficial from time savingsFour Clusters
The value of cluster risk analysis becomes evident if we take one dimension out. In this example the decision consulting frequency was left out. The results are shown in this slide and the next oneFour Clusters
The problem areas of each cluster may be identified. Satisfying or leaving out one factor leads to reshuffling of the weights of new clustersFour Clusters

Managerial Network Clusters

  • 1.
  • 2.
    Workers interact- Theseare actions that generate different outcomes.The boundaries of an organizational network are usually very well-defined by its organizational structure.Employees may engage in a myriad of different interactions. Patti Anklam published several interesting ideas on this subjectInteractions among Workers
  • 3.
    Information exchange- themore people know and trust each other the more they exchange informationAwareness of what people know- the more people are aware of what co-workers know, the more likely they will exchange informationTypes of Information Exchange and Their Determinants
  • 4.
    Knowledge Seeking- Peopleseek information from knowledgeable people to solve problems if no barriers exist. Barriers limit the free flow of consultation on issues related to problem-solving and decision-makingMotivational Energy- Knowledgeable staff may affect people positively or negatively. People tend to consult experts who motivate them while avoiding people who are de-motivating (Unless they have no option but to consult with them)Types of Information Exchange and Their Determinants- 2
  • 5.
    A sample oftwenty one managers was taken randomly for a middle-sized companyFace to face interviews and written surveys produced the results shown in the next tableThe dimensions taken are the same as discussed in the preceding slidesA Case Study
  • 6.
  • 7.
    NeuroXL Classifier fromwas used to analyze the results as explained in an earlier publication by the authorThe first analysis was designed to produce two clusters. (See next slide)Analysis Methodology
  • 8.
  • 9.
    The previous slideshows two clearly differentiated clusters.The meeting point between the two clusters is the frequency of receiving information; otherwise the two clusters divergeThe Two Clusters- 2
  • 10.
    In Cluster 1,managers are familiar with who has information and the skills to consult with. However; peer managers are hesitant to seek their advise because these managers do not either motivate their peers or save them time. This realization apparently led to the low frequency of information exchangeThe Two Clusters- 3
  • 11.
    Cluster 2 compromisesmanagers whose common profile is being low in the familiarity of the knowledge and skills of their peers and are not seekers of opinion to make decision. However; they benefit from the time savings they get from their peers and of the enthusiasm they get from these activitiesThe Two Clusters- 4
  • 12.
    The Two Clusters-5The Cluster RadarThe previous clusters are redrawn in a radar graph
  • 13.
    The segmentation ofmanagers into three clusters produced the following clusters with cluster 1 having the highest weightThree Managerial Clusters
  • 14.
    The line graphis as shown below. Cluster 2 (14.29% by weight) scores lowly in both dimensions pertaining to other managers being either familiar with their knowledge or skills. The culture and communication levels are low indeed. Three Managerial Clusters- 2
  • 15.
    It was decidedto take out the dimension of frequency of decision consulting to see the outcome. The resulting clusters had the following weights. A more balanced cluster weights resulted than the original case Three Managerial Clusters- 3
  • 16.
    This time cluster3 realized time savings from consultation after removal of the decision consultancy dimension . Apparently, the benefits are lost because of indecisiveness. However; the issue of time value is critical in both clusters 1 and 2 as time savings from consultation show negative valuesThree Managerial Clusters- 3
  • 17.
    This time cluster3 realized time savings from consultation. Apparently, the benefits are lost because of indecisiveness. However; the issue of time value is critical in both clusters 1 and 2 as time savings from consultation show negative valuesThree Managerial Clusters- 4
  • 18.
    The impact oftime savings resulting from consultation prompted repeating the cluster analysis without this factor. The weights of the three clusters emerged as follows. Interestingly, the same weights for leaving decision data, but are reshuffled Three Managerial Clusters- 5
  • 19.
    Cluster 1 showsradical performance difference than both cluster 2 and, to a lesser extent, cluster 3Three Managerial Clusters- 5
  • 20.
    The managers weredivided into four clusters to form four quadrants. Four Clusters
  • 21.
    The managers weredivided into four clusters to form four quadrants. The clusters show four different type of managers. Clusters 1 and 3 are the least beneficial from time savingsFour Clusters
  • 22.
    The value ofcluster risk analysis becomes evident if we take one dimension out. In this example the decision consulting frequency was left out. The results are shown in this slide and the next oneFour Clusters
  • 23.
    The problem areasof each cluster may be identified. Satisfying or leaving out one factor leads to reshuffling of the weights of new clustersFour Clusters